Abstract
Age-related changes in organ and tissue masses may add to changes in the relationship between resting energy expenditure (REE) and fat free mass (FFM) in normal and overweight healthy Caucasians. Secondary analysis using cross-sectional data of 714 healthy normal and overweight Caucasian subjects (age 18–83 years) with comprehensive information on FFM, organ and tissue masses (as assessed by magnetic resonance imaging (MRI)), body density (as assessed by Air Displacement Plethysmography (ADP)) and hydration (as assessed by deuterium dilution (D2O)) and REE (as assessed by indirect calorimetry). High metabolic rate organs (HMR) summarized brain, heart, liver and kidney masses. Ratios of HMR organs and muscle mass (MM) in relation to FFM were considered. REE was calculated (REEc) using organ and tissue masses times their specific metabolic rates. REE, FFM, specific metabolic rates, the REE-FFM relationship, HOMA, CRP, and thyroid hormone levels change with age. The age-related decrease in FFM explained 59.7% of decreases in REE. Mean residuals of the REE-FFM association were positive in young adults but became negative in older subjects. When compared to young adults, proportions of MM to FFM decreased with age, whereas contributions of liver and heart did not differ between age groups. HOMA, TSH and inflammation (plasma CRP-levels) explained 4.2%, 2.0% and 1.4% of the variance in the REE-FFM residuals, but age and plasma T3-levels had no effects. HMR to FFM and MM to FFM ratios together added 11.8% on to the variance of REE-FFM residuals. Differences between REE and REEc increased with age, suggesting age-related changes in specific metabolic rates of organs and tissues. This bias was partly explained by plasmaT3-levels. Age-related changes in REE are explained by (i) decreases in fat free mass; (ii) a decrease in the contributions of organ and muscle masses to FFM; and (iii) decreases in specific organ and tissue metabolic rates. Age-dependent changes in the REE-FFMassociation are explained by composition of FFM, inflammation and thyroid hormones.
1. Introduction
Resting energy expenditure (REE) decreases from young to old age by 1% to 2% per decade [1]. This is partly explained by age-related decreases in fat free mass (FFM) [2]. FFM accounts for 50%–70% of the variance in REE [3,4,5]. Metabolically, FFM is heterogeneous including high (i.e., heart, liver, kidneys and brain) and low metabolic rate organs and tissues (i.e., muscle mass and skeletal bone) [6]. In young adults, brain, liver, heart and kidney masses add up to approximately 12% of FFM but account for 60% of REE [3,7,8,9,10,11]. By contrast, muscle mass comprises more than 50% of FFM and accounts for up to 25% of REE only [5]. We have shown previously that REE and FFM change with age with gender-specific differences in the onset and magnitude of the age-related changes in metabolically active body components and REE [12]. Decreases in REE and body composition started between 30 and 45 years with decreases in REE adjusted for skeletal muscle and organ mass and adipose tissue by −145 kJ/day/decade and −604.8 kJ/day/decade after the age of 35.2 and 34.3 years in women and men, respectively [12]. There was first evidence that specific metabolic rates of major organs and tissues also decrease with age, and age-specific prediction algorithms have been published by Wang et al. [11,13]. Thus, the present evidence suggests that age-related decreases in REE are explained by decreases in both (i) FFM and (ii) the specific metabolic rate of organs and tissues. However, age-associated changes in the REE-FFM relationship still remain to be characterized.
The nature and the impact of age-related changes in organ and tissue masses together with changes in REE have not been widely examined. Two longitudinal studies, the Baltimore Longitudinal Study (BLSA) and Health Aging and Body Composition Study (Health ABC), indicated that a high resting metabolic rate at an older age was a risk factor of mortality [14] as well as for multi-morbidity in men [15,16]. The data of another longitudinal study, the German GISELA study [17] showed that REE decreases by 11.2 kJ/day and 34.1 kJ/day per year in women and men, respectively. However, in these studies, detailed composition of FFM has not been assessed.
In this cross-sectional study, we investigated a greater population of young and old adults with normal and overweight (BMI < 30 kg/m2) in order to avoid an obesity bias with consideration that a recommendation of a normal BMI for older adults is higher (BMI 24.0 to 29.0 kg/m2) than for younger adults. The aims of the study were to describe the age-related differences and the impact of the REE-FFM association, taking into account detailed body composition data as obtained by whole body MRI.
2. Materials and Methods
Data from the “Reference Center for Body Composition” (Institute of Human Nutrition and Food Science of the Christian-Albrechts University Kiel, Germany) were used in this secondary data analysis (Table 1). Subjects had participated in different studies on body composition and metabolism [7,10,11,18,19,20]. The total number of subjects with BMI < 30 kg/m2 was 714 (346 women and 368 men) with a median age of 41.0 years (18–83 years) and a median BMI of 24.6 kg/m2 (16.8–29.9 kg/m2). Data of tissue and organ masses assessed by whole body magnetic resonance imaging (MRI) were available in a subgroup of 369 healthy Caucasians (168 women and 201 men).

Table 1.
Physical characteristics of the main study population (n = 714) and subgroup with detailed body composition (n = 369).
Studies were approved by the ethical committee of the department of medicine (Christian-Albrechts University Kiel; last approved version A100/13A; 2014) and informed written consent to participate in the study was obtained from each subject. All studies were conducted according to the guidelines laid down in the “Declaration of Helsinki”.
Body height was measured to the nearest 0.5 cm with subjects wearing no shoes (secastadiometer; Hamburg, Germany). Weight was assessed to the nearest 0.01 kg with an electronic scale (Tanita, Tokyo, Japan).
Body composition was assessed by Air Displacement Plethysmography (ADP). ADP was performed by the BOD POD® device (Cosmeds.r.l., Rome, Italy). Participants wore tight-fitting underwear and a swim cap. Two repeated measurements of body volume were performed, averaged and corrected for predicted body surface area and thoracic gas volume using BOD POD® software (version 4.5.0). Percentage fat mass (FMADP) was calculated from body density using the equation by Siri et al. [21]. Fat free mass (FFMADP) was calculated as body weight minus FMADP. Total body water was assessed by dilution method as previously described in detail [22] and used to calculate the hydration of FFMADP.
In a subgroup of 369 subjects with BMI < 30 kg/m2 muscle mass (MM), total, subcutaneous and visceral adipose tissue and organ masses were measured using whole body multislice MRI. Scans were obtained with a 1.5T scanner (Magnetom Vision Siemens, Erlangen, Germany) as previouslydescribed [23]. Areas and volumes of MM, adipose tissue and volumes of 5 internal organs (brain, heart, liver, spleen and kidney) were manually analyzed using the SliceOmatic software (version 4.3; Tomovision, Montreal, QC, Canada) as described earlier [8]. Intra-observer coefficient of variation (CV) was 1.8% for total SM, 1.8% for brain, 0.07% for liver, 1.7% for heart and 1.0% for kidney.
DXA whole body measurement was performed (QDR4500A, Hologic Inc., Bedford, MA, USA). Subjects laid in supine position during the 10 min scan. Manufactures software (version V8.26a:3, Hologic Inc., Bedford, MA, USA) was used for analysis of bone mineral content (BMCDXA). Skeletal bone massDXA was calculated as BMCDXA × 1.85 and included in calculations of resting energy expenditure [24].
Resting energy expenditure (REE) was measured by indirect calorimetry (REE) with an open-circuit ventilated-hood system (Vmax Spectra 29n, SensorMedics BV, Viasys Healthcare, Bilthoven, The Netherlands; software V-max version 12-1A). REE was measured in the early morning after an overnight fast, and a detailed description of the measurement was reported elsewhere [7,25]. The CV for repeated measurements of REE was 5.0% [26]. In addition to measured REE, REE was calculated (REEc) based on organ and tissue masses times specific tissue metabolic rates reported by Elia et al. [27] and Wang et al. [13], who have published age-corrected values. For skeletal bone massDXA, a specific metabolic rate of 9.63 kJ/(kg·day) was assumed [28]. The REE equations were as follows:
REEc Equation published by Elia et al. [27]:
REEc [kJ/day] = (1008 (kJ) × brain mass (kg)) + (840 (kJ) × liver mass (kg)) + (1848 (kJ) × heart mass (kg)) + (1848 (kJ) × kidney mass (kg)) + (55 (kJ) × skeletal muscle mass (kg)) + (19 (kJ) × adipose tissue (kg)) + (9.63 (kJ) × skeletal bone massDXA (kg)) + (50 (kJ) × residual mass (kg))
Age-related REEc equations published by Wang et al. [13]:
21–30 years
REEc [kJ/day] = (1016 (kJ)×brain mass (kg)) + (848 (kJ)×liver mass (kg)) + (1860 (kJ) × heart mass (kg)) + (1860 (kJ) × kidney mass (kg)) + (55 (kJ) × skeletal muscle mass (kg)) + (19 (kJ) × adipose tissue (kg)) + (9.63 (kJ) × skeletal bone massDXA (kg)) + (51 (kJ) × residual mass (kg))
31–50 years
REEc [kJ/day] = (1003 (kJ)×brain mass (kg))+(835 (kJ)×liver mass (kg)) + (1839 (kJ) × heart mass (kg)) + (1839 (kJ) × kidney mass (kg)) + (54 (kJ) × skeletal muscle mass (kg)) + (19 (kJ) × adipose tissue (kg)) + (9.63 (kJ) × skeletal bone massDXA (kg)) + (50 (kJ) ×residual mass (kg))
51–73 years
REEc [kJ/day] = (978 (kJ) × brain mass (kg)) + (814 (kJ) × liver mass (kg)) + (1789 (kJ) × heart mass (kg)) + (1789 (kJ) × kidney mass (kg)) + (53 (kJ) × skeletal muscle mass(kg)) + (18 (kJ) × adipose tissue (kg)) + (9.63 (kJ) × skeletal bone massDXA (kg)) + (48 (kJ)×residual mass (kg))
Blood samples were taken after an overnight fast and insulin, glucose, thyroid hormones, and C-reactive proteins were analyzed as previously described [29,30].
Statistical analysis was performed using SPSS statistical software (SPSS 22.0, Inc., Chicago, IL, USA). All data are given as median+interquartil range (IQR). Differences between women and men were tested by Mann-Whitney U-test and between age groups using the Kruskal-Wallis-test. To assess differences of age-related changes in organ masses and muscle mass in relation to FFM, a general linear regression model was used with FFM as a dependent variable. Linear regression models examined the association between residuals of the FFM to REE relationship, and differences between REE and REEc, HOMA, CRP and thyroid hormones. A paired t-test was used to analyze the significance of the difference (Δ) between REE and REEc, and the differences were also plotted against age. A p-value < 0.05 was accepted as the limit of significance.
3. Results
3.1. Body Composition
Body composition characteristics of the study population are presented in Table 1. Men were heavier and taller than women, and they had higher BMI, FFM and organ masses. Visceral adipose tissue volumes (VAT) were higher in men, whereas total adipose tissue was higher in women. In both sexes, there were age-related decreases in the individual components of FFM. By contrast, in men, heart mass and VAT increased with age. Relative amounts of tissue and organ masses as part of FFM showed an age-related decrease of muscle and spleen mass in women and men. In contrast, masses of heart, brain, liver, kidneys as well as bone mineral in relation to FFM, increased during aging, which could be explained by co-occurring FFM decline. Compared to men, women had a lower body density but higher FFM hydration. In both sexes, body density decreased with increasing age; in contrast, FFM hydration increased in women only.
3.2. REE
There were significant age and sex effects on REE, REEFFM and the difference between REE to REEc (ΔREE-REEc), as calculated using the age-unspecific algorithm of Elia et al.(Table 2; see Methods). In contrast, no sex and age-differences in the ΔREE-REEc were observed using the age-specific algorithms of Wang et al. (Table 2; see Methods). Compared with women, men had higher levels of free triiodothyronineand lower levels of thyroid-stimulating hormone as well as free thyroxin. In women, only free thyroxin levels showed an age-related increase. This was also true in men, whereas thyroid-stimulating hormone and free triiodothyroninedecreased with age in men.

Table 2.
Measured REEm and calculated REEc resting energy expenditure and differences between measured and calculated energy expenditure for the study population (n = 714).
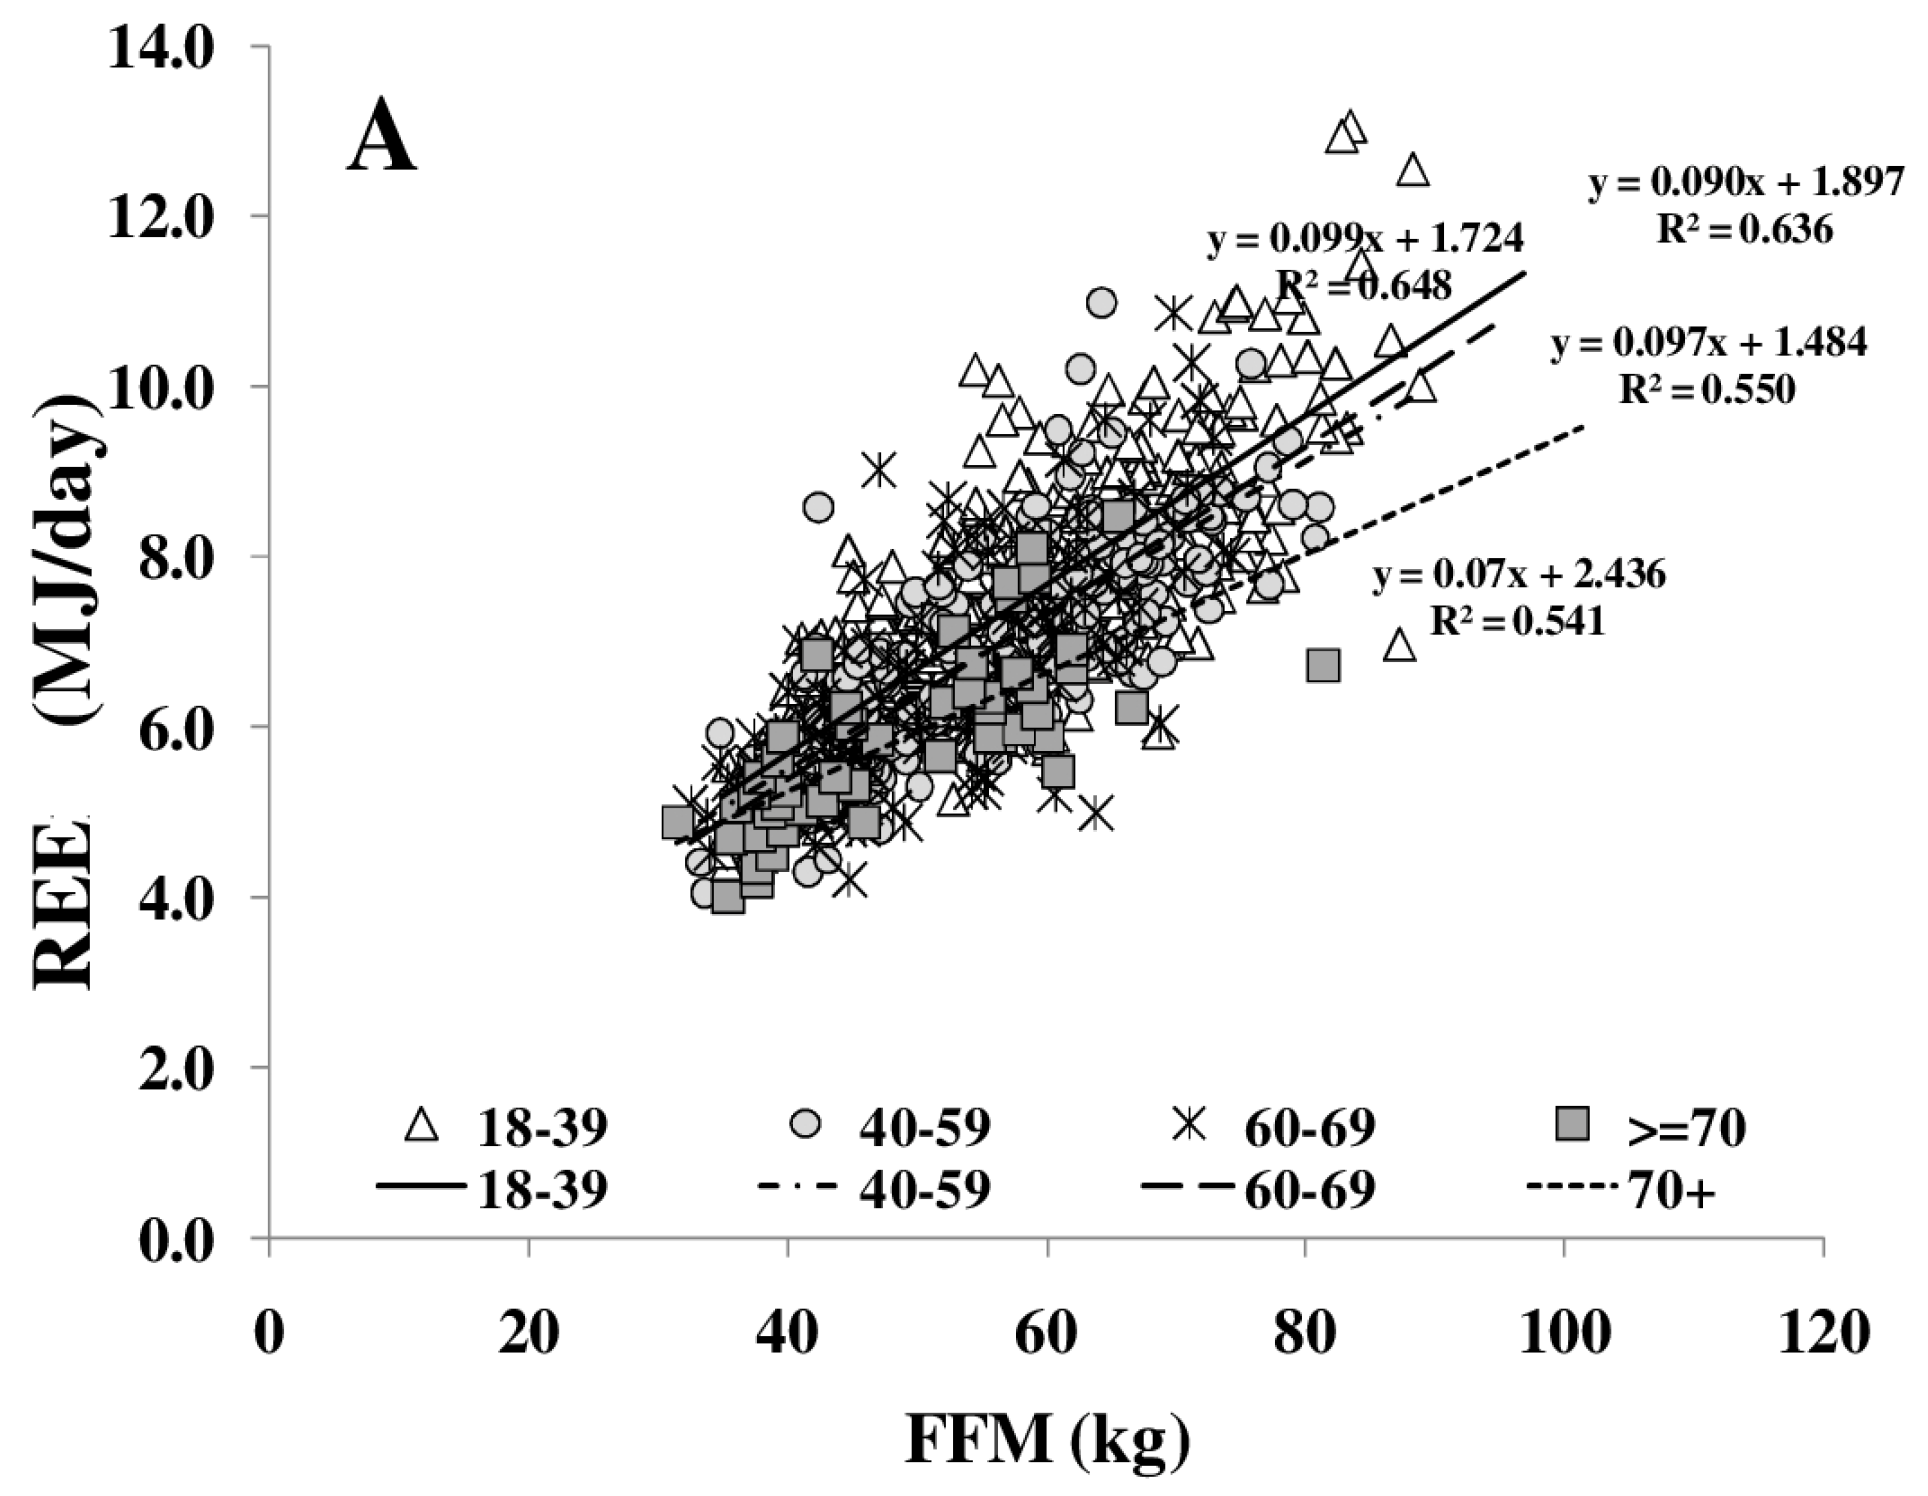
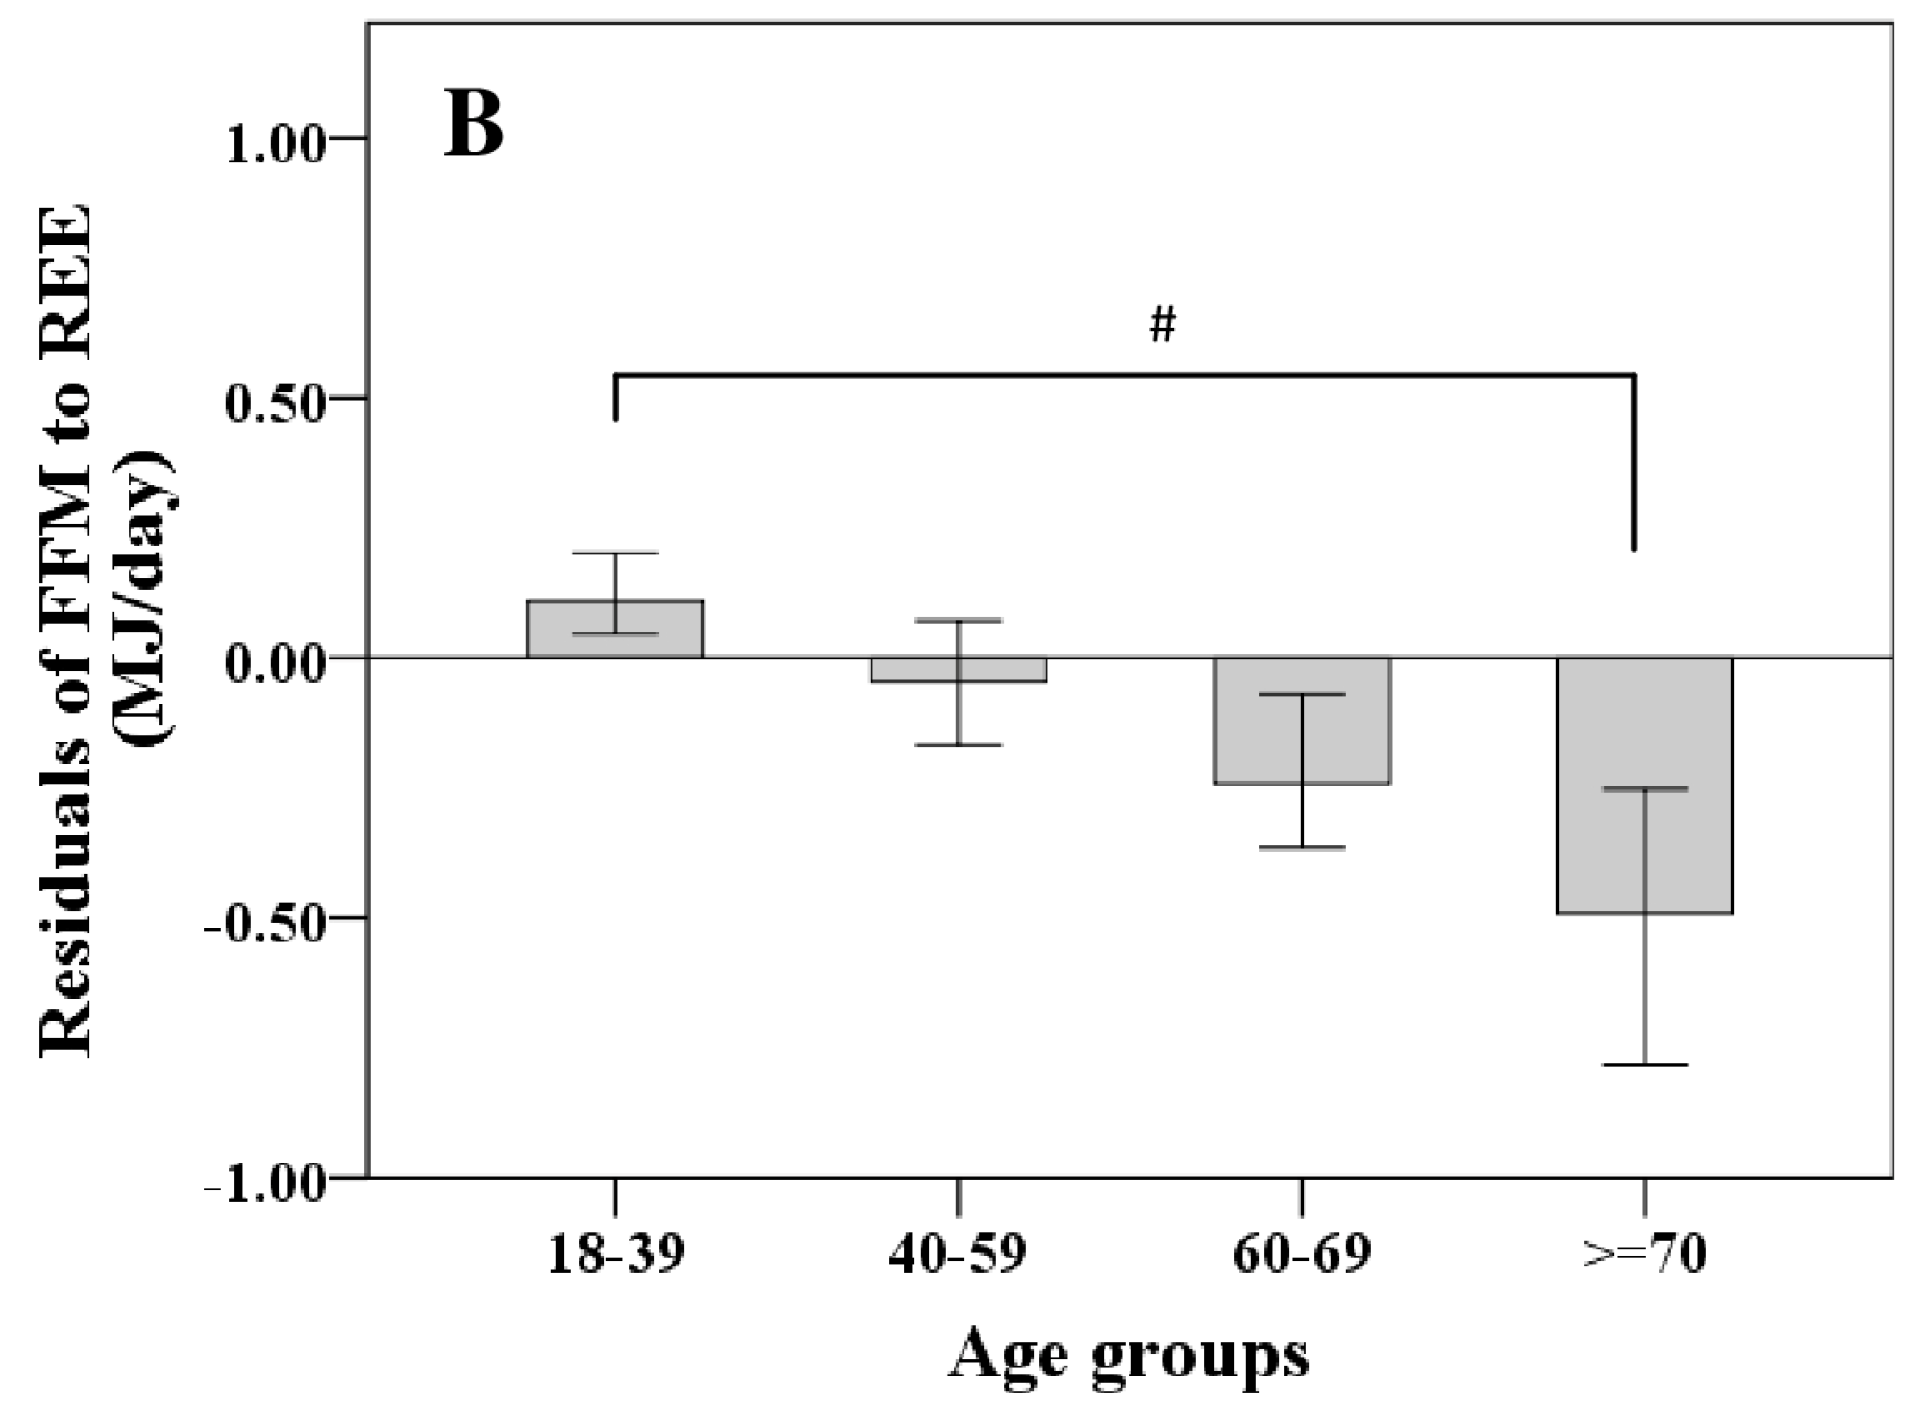
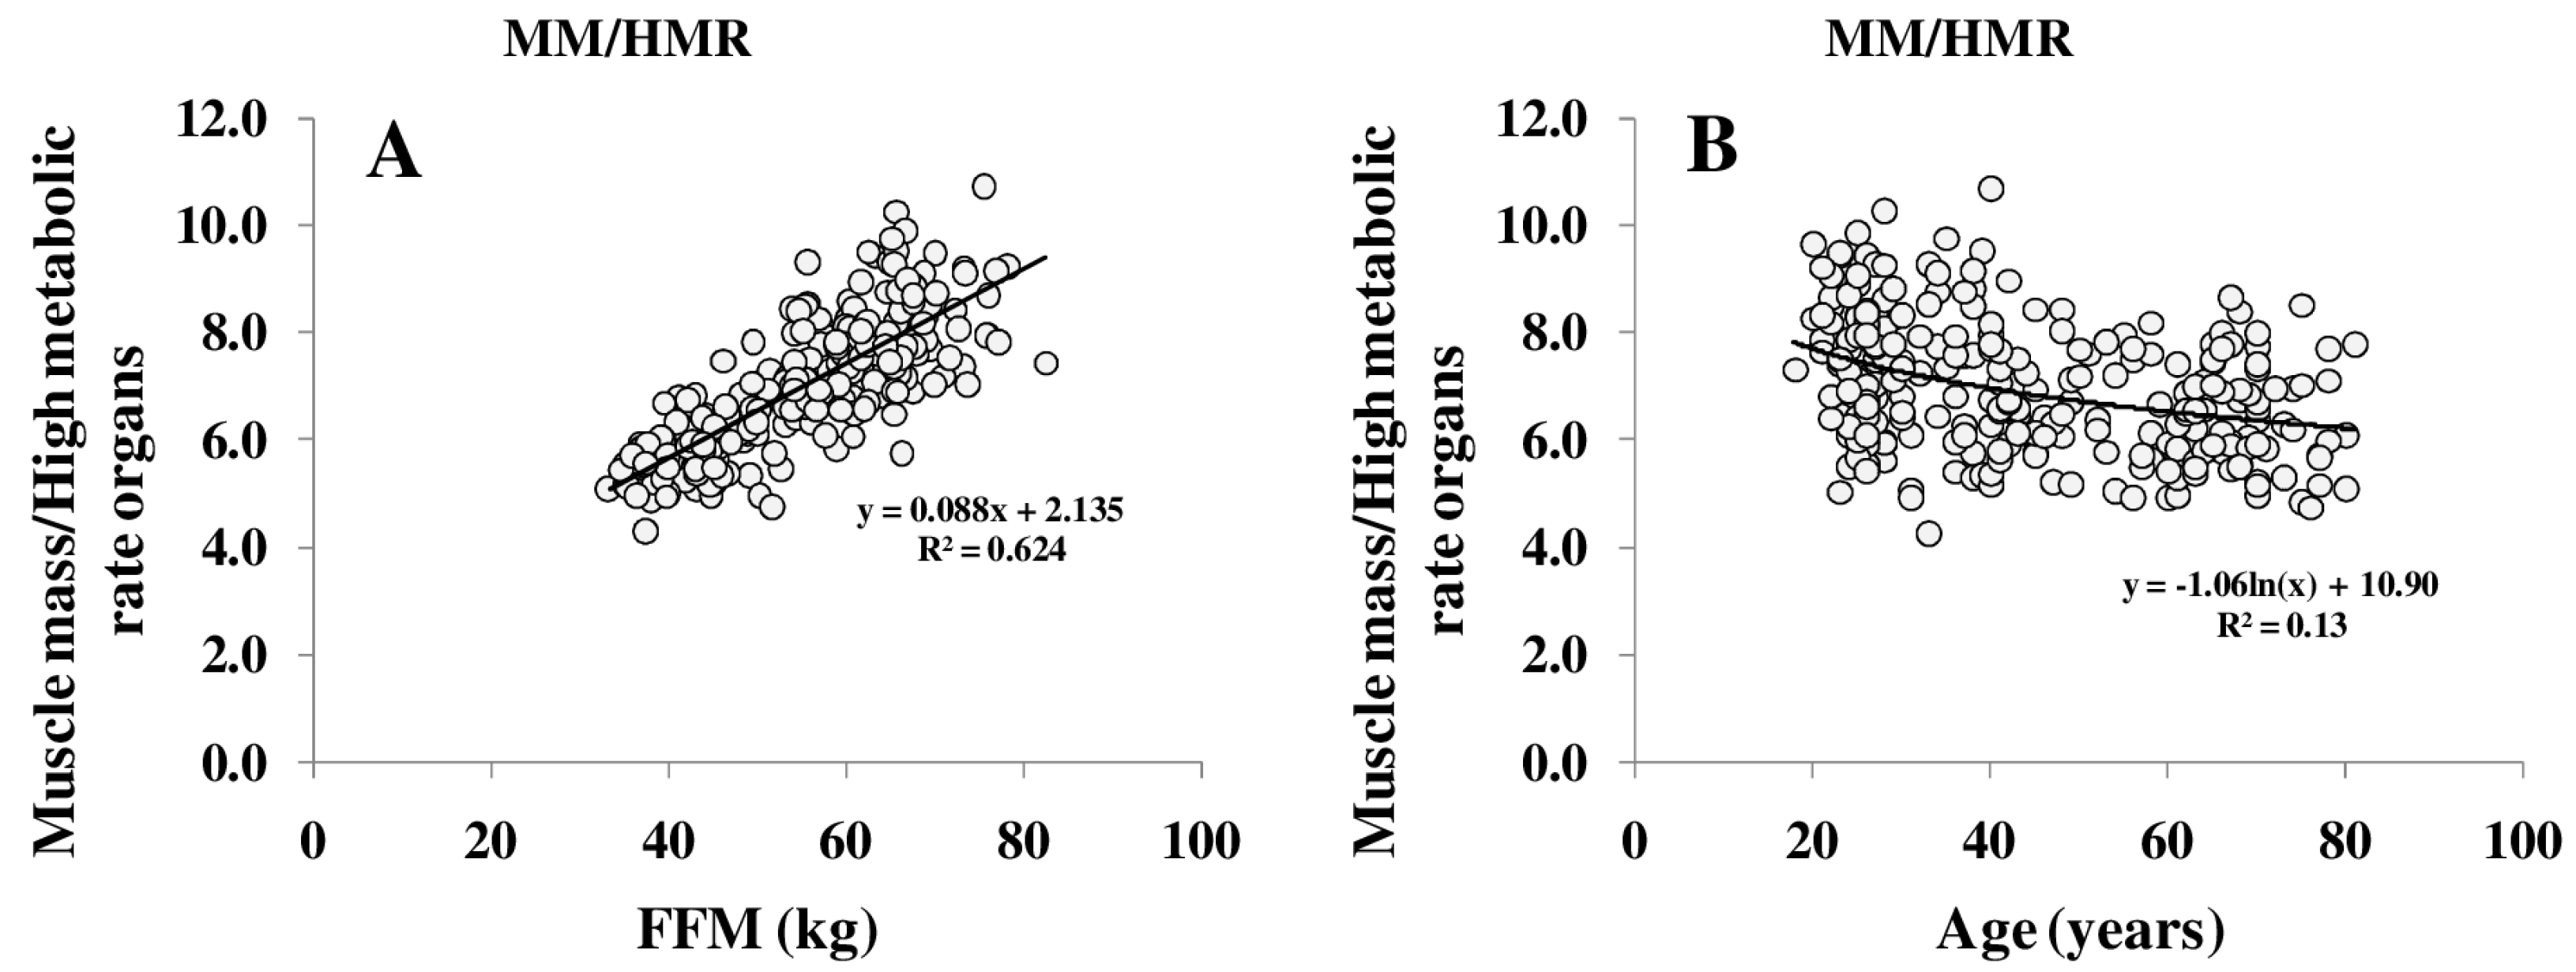
REE increased with FFM (Figure 1A); however, REE related to FFM decreased with age. Comparing different age groups, residuals of the REE-FFM relationship turned from positive to negative residuals with increasing age (Figure 1B). The ratio of muscle mass (as major low metabolic rate tissue) to high metabolic rate organ masses (HMR), and thus the relative proportion of MM to HMR, increased with FFM (Figure 2A) and decreased nonlinearly with age (Figure 2B).
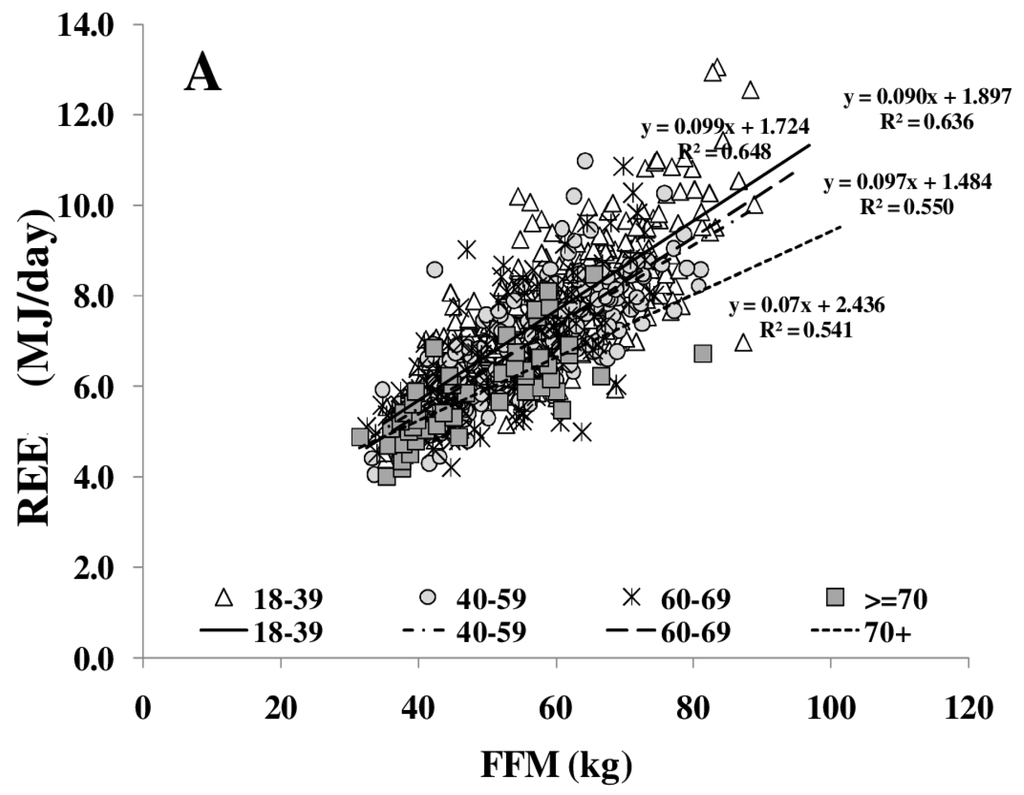
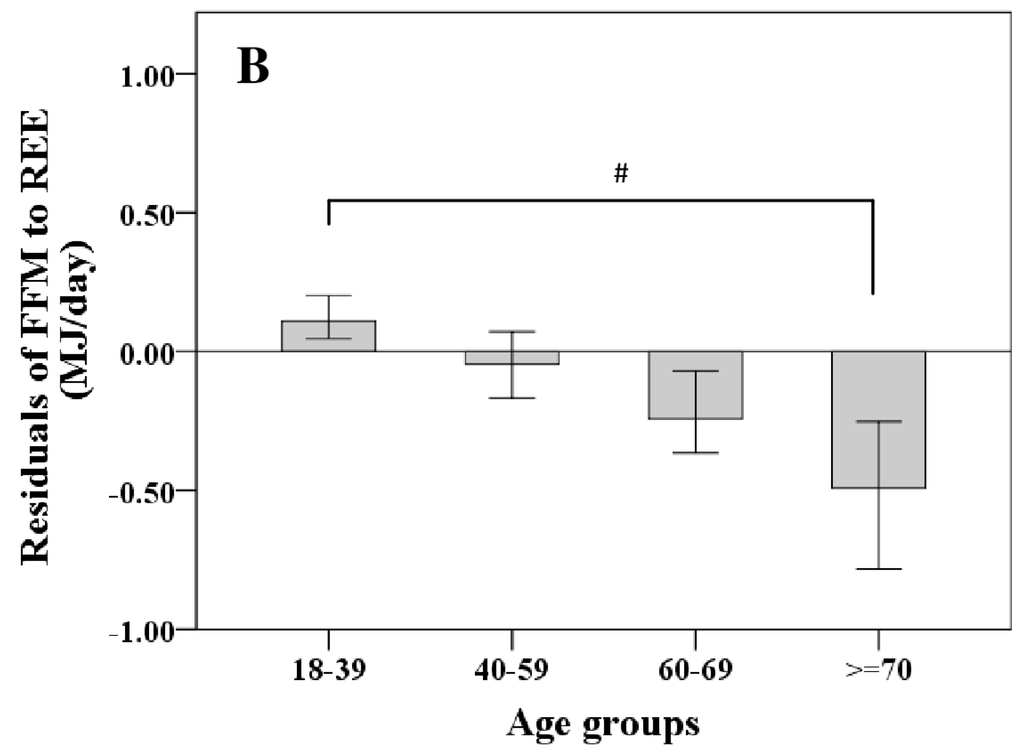
Figure 1.
Age-dependent decrease in fat free mass (FFM)-resting energy expenditure (REE) relationship (A) and their residuals in different age groups (median; 95% CI) (B). Significant differences between age-groups are indicated by # as tested by Kruskal-Wallis-test (n = 714). FFM was assessed by Air Displacement Plethysmography (ADP) (for details, see Methods).
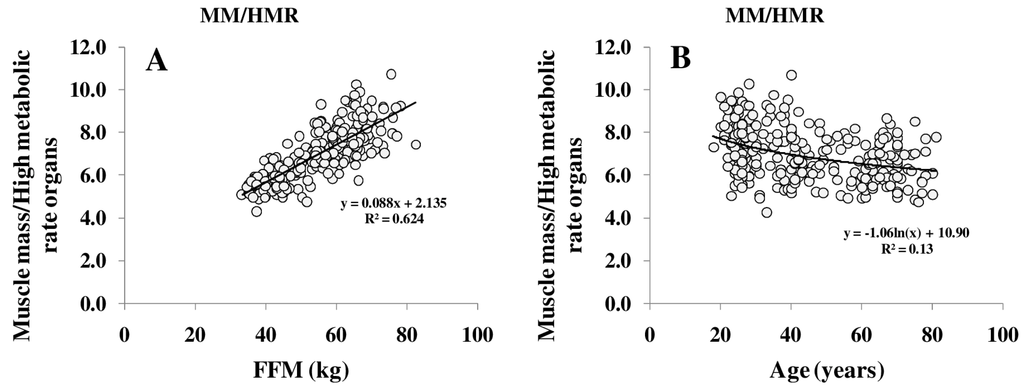
Figure 2.
Relationship between FFM and the ratio of muscle mass (MM) to high metabolic rate organs (HMR) per kg (A) and between the MM/HMR-ratio and age (B). HMR is the sum of masses of brain, heart, liver and kidneys.FFM was assessed by ADP, organ masses were assessed by whole body Magnetic Resonance Imaging (MRI) (for details, see Methods) (n = 369).
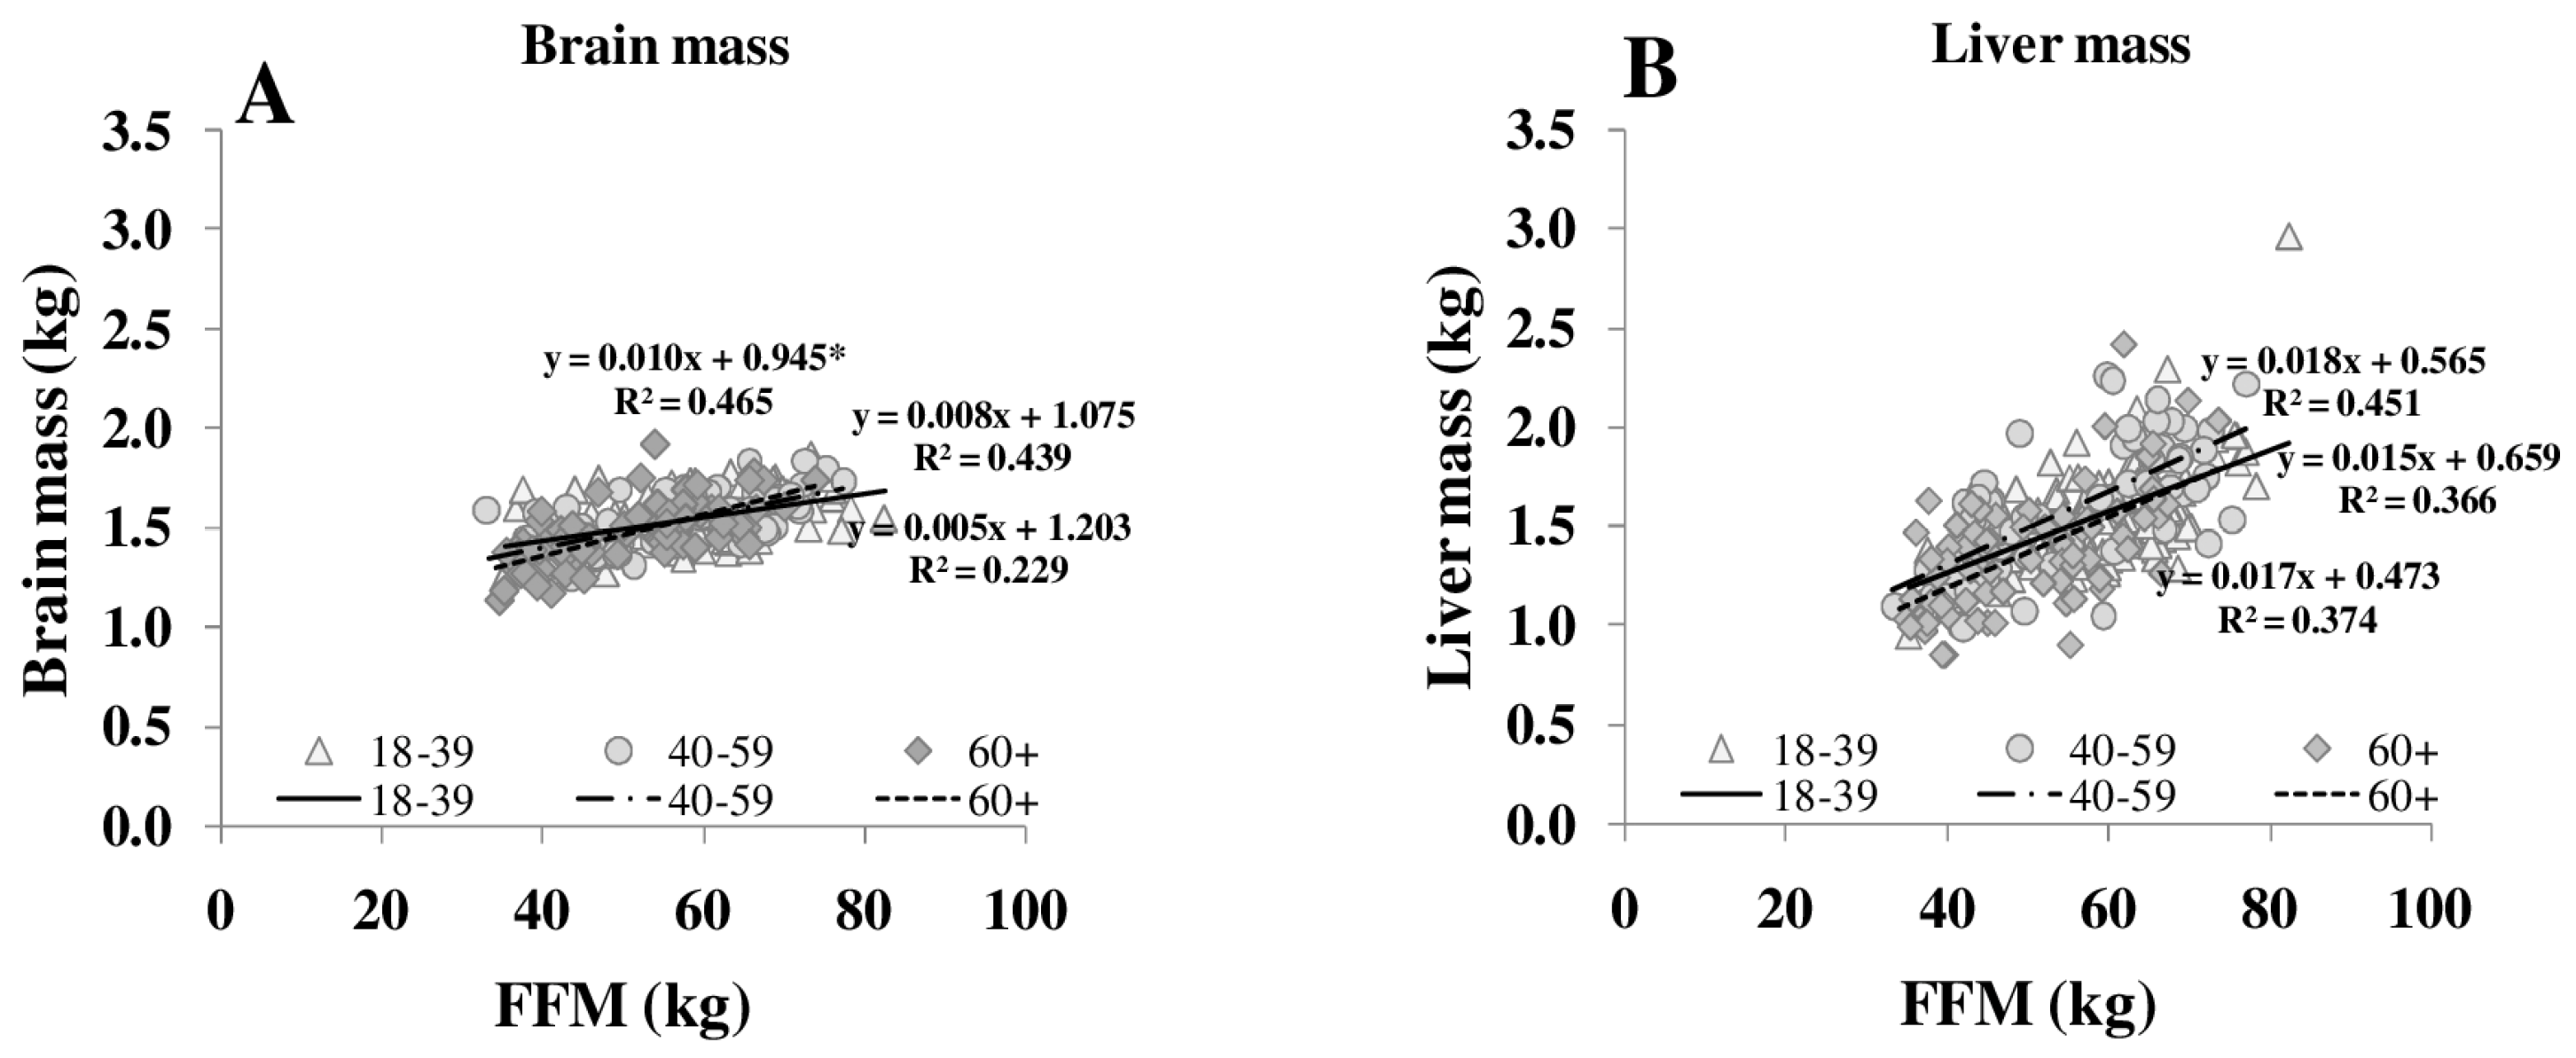
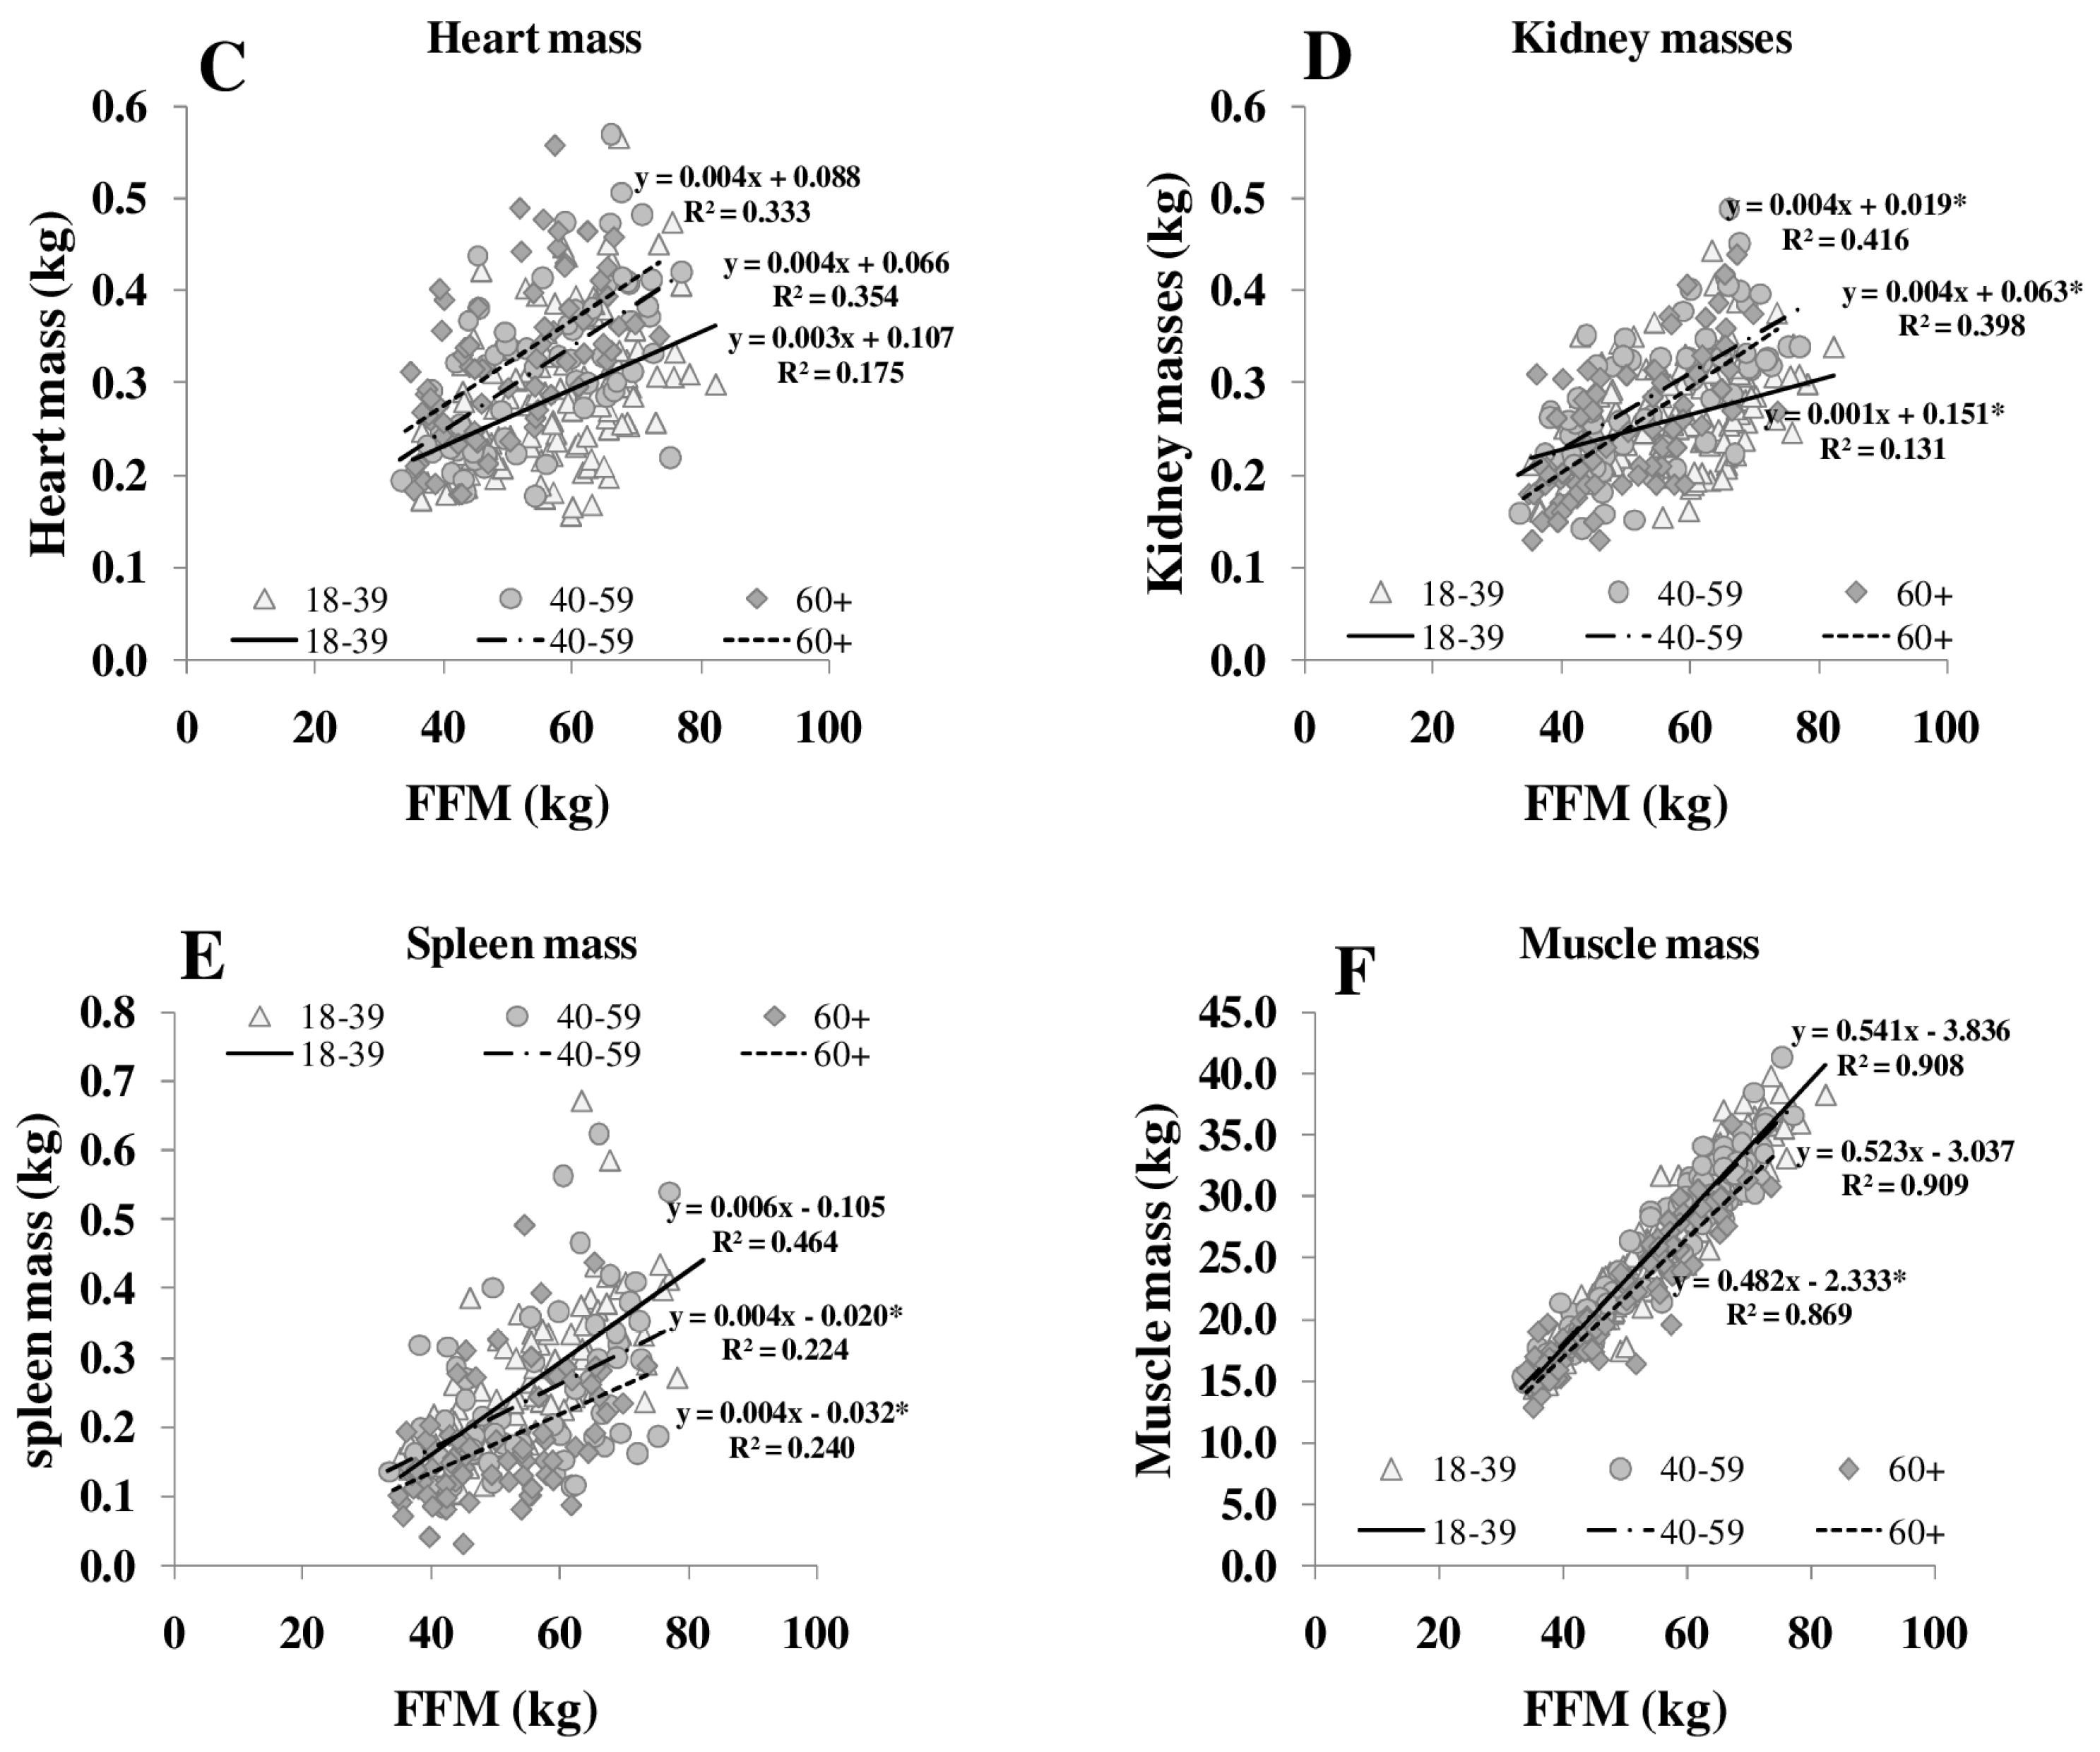
The ratio of MM/FFM increased with increasing FFM, whereas the HMR/FFM ratio remained stable. The association between FFM, MM/FFM and HMR/FFM in young (18–39 years) middle-aged (40–59 years) and older (≥60 years) subjects showed no significant differences between the age groups. Comparing age groups, the relationship between FFM to MM/FFM became weaker (R2 between 0.11 and 0.06) but FFM to HMR/FFM relationship remained constant (R2 between 0.65 and 0.50). However, age affected the relationship of individual organ masses (i.e., heart, spleen and skeletal muscle) to FFM (Figure 3).
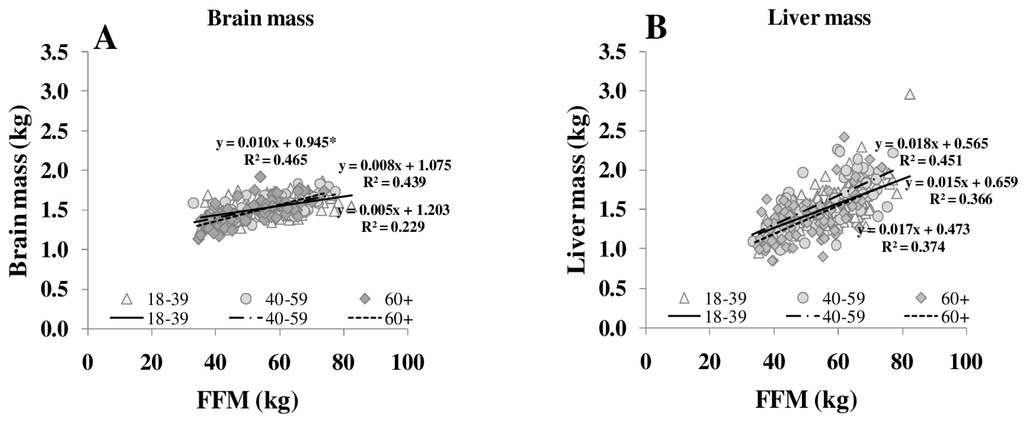
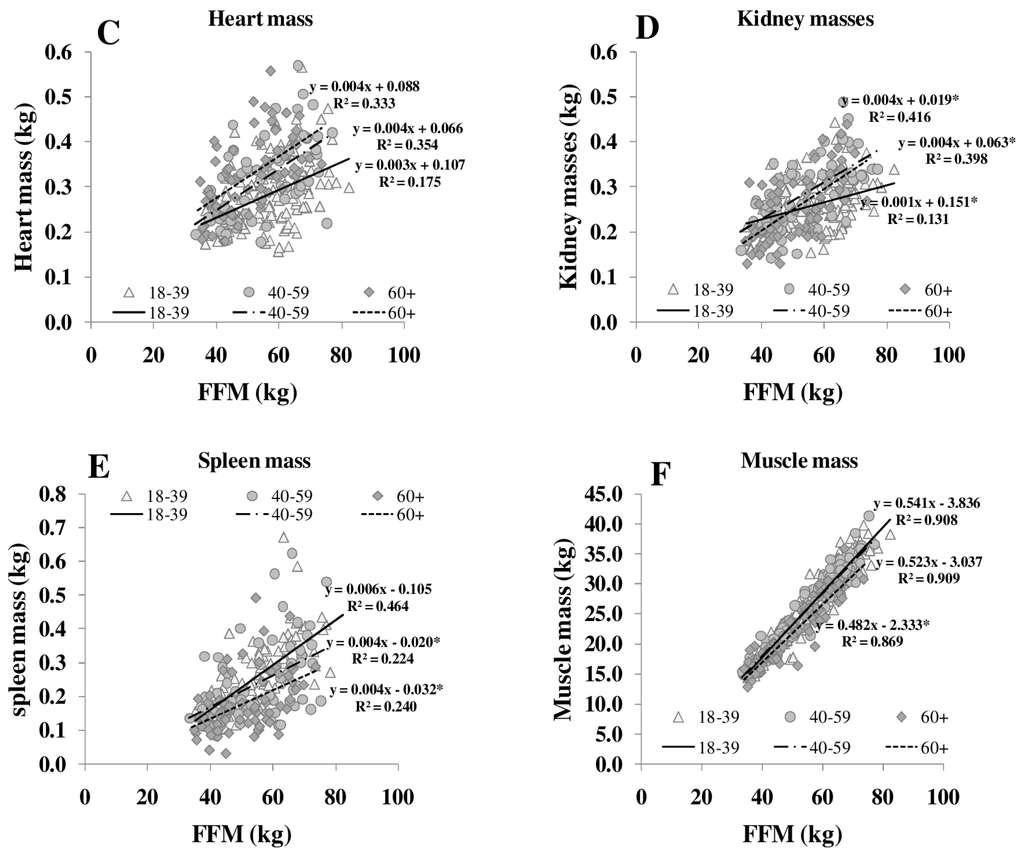
Figure 3.
Relationships between FFM and masses of brain (A), liver (B), heart (C), kidneys (D), spleen (E) and skeletal muscle (F) in different age groups. FFM was assessed by ADP, organ masses were assessed by whole body MRI (n = 369). * significant difference between youngest and other age groups (p < 0.05).
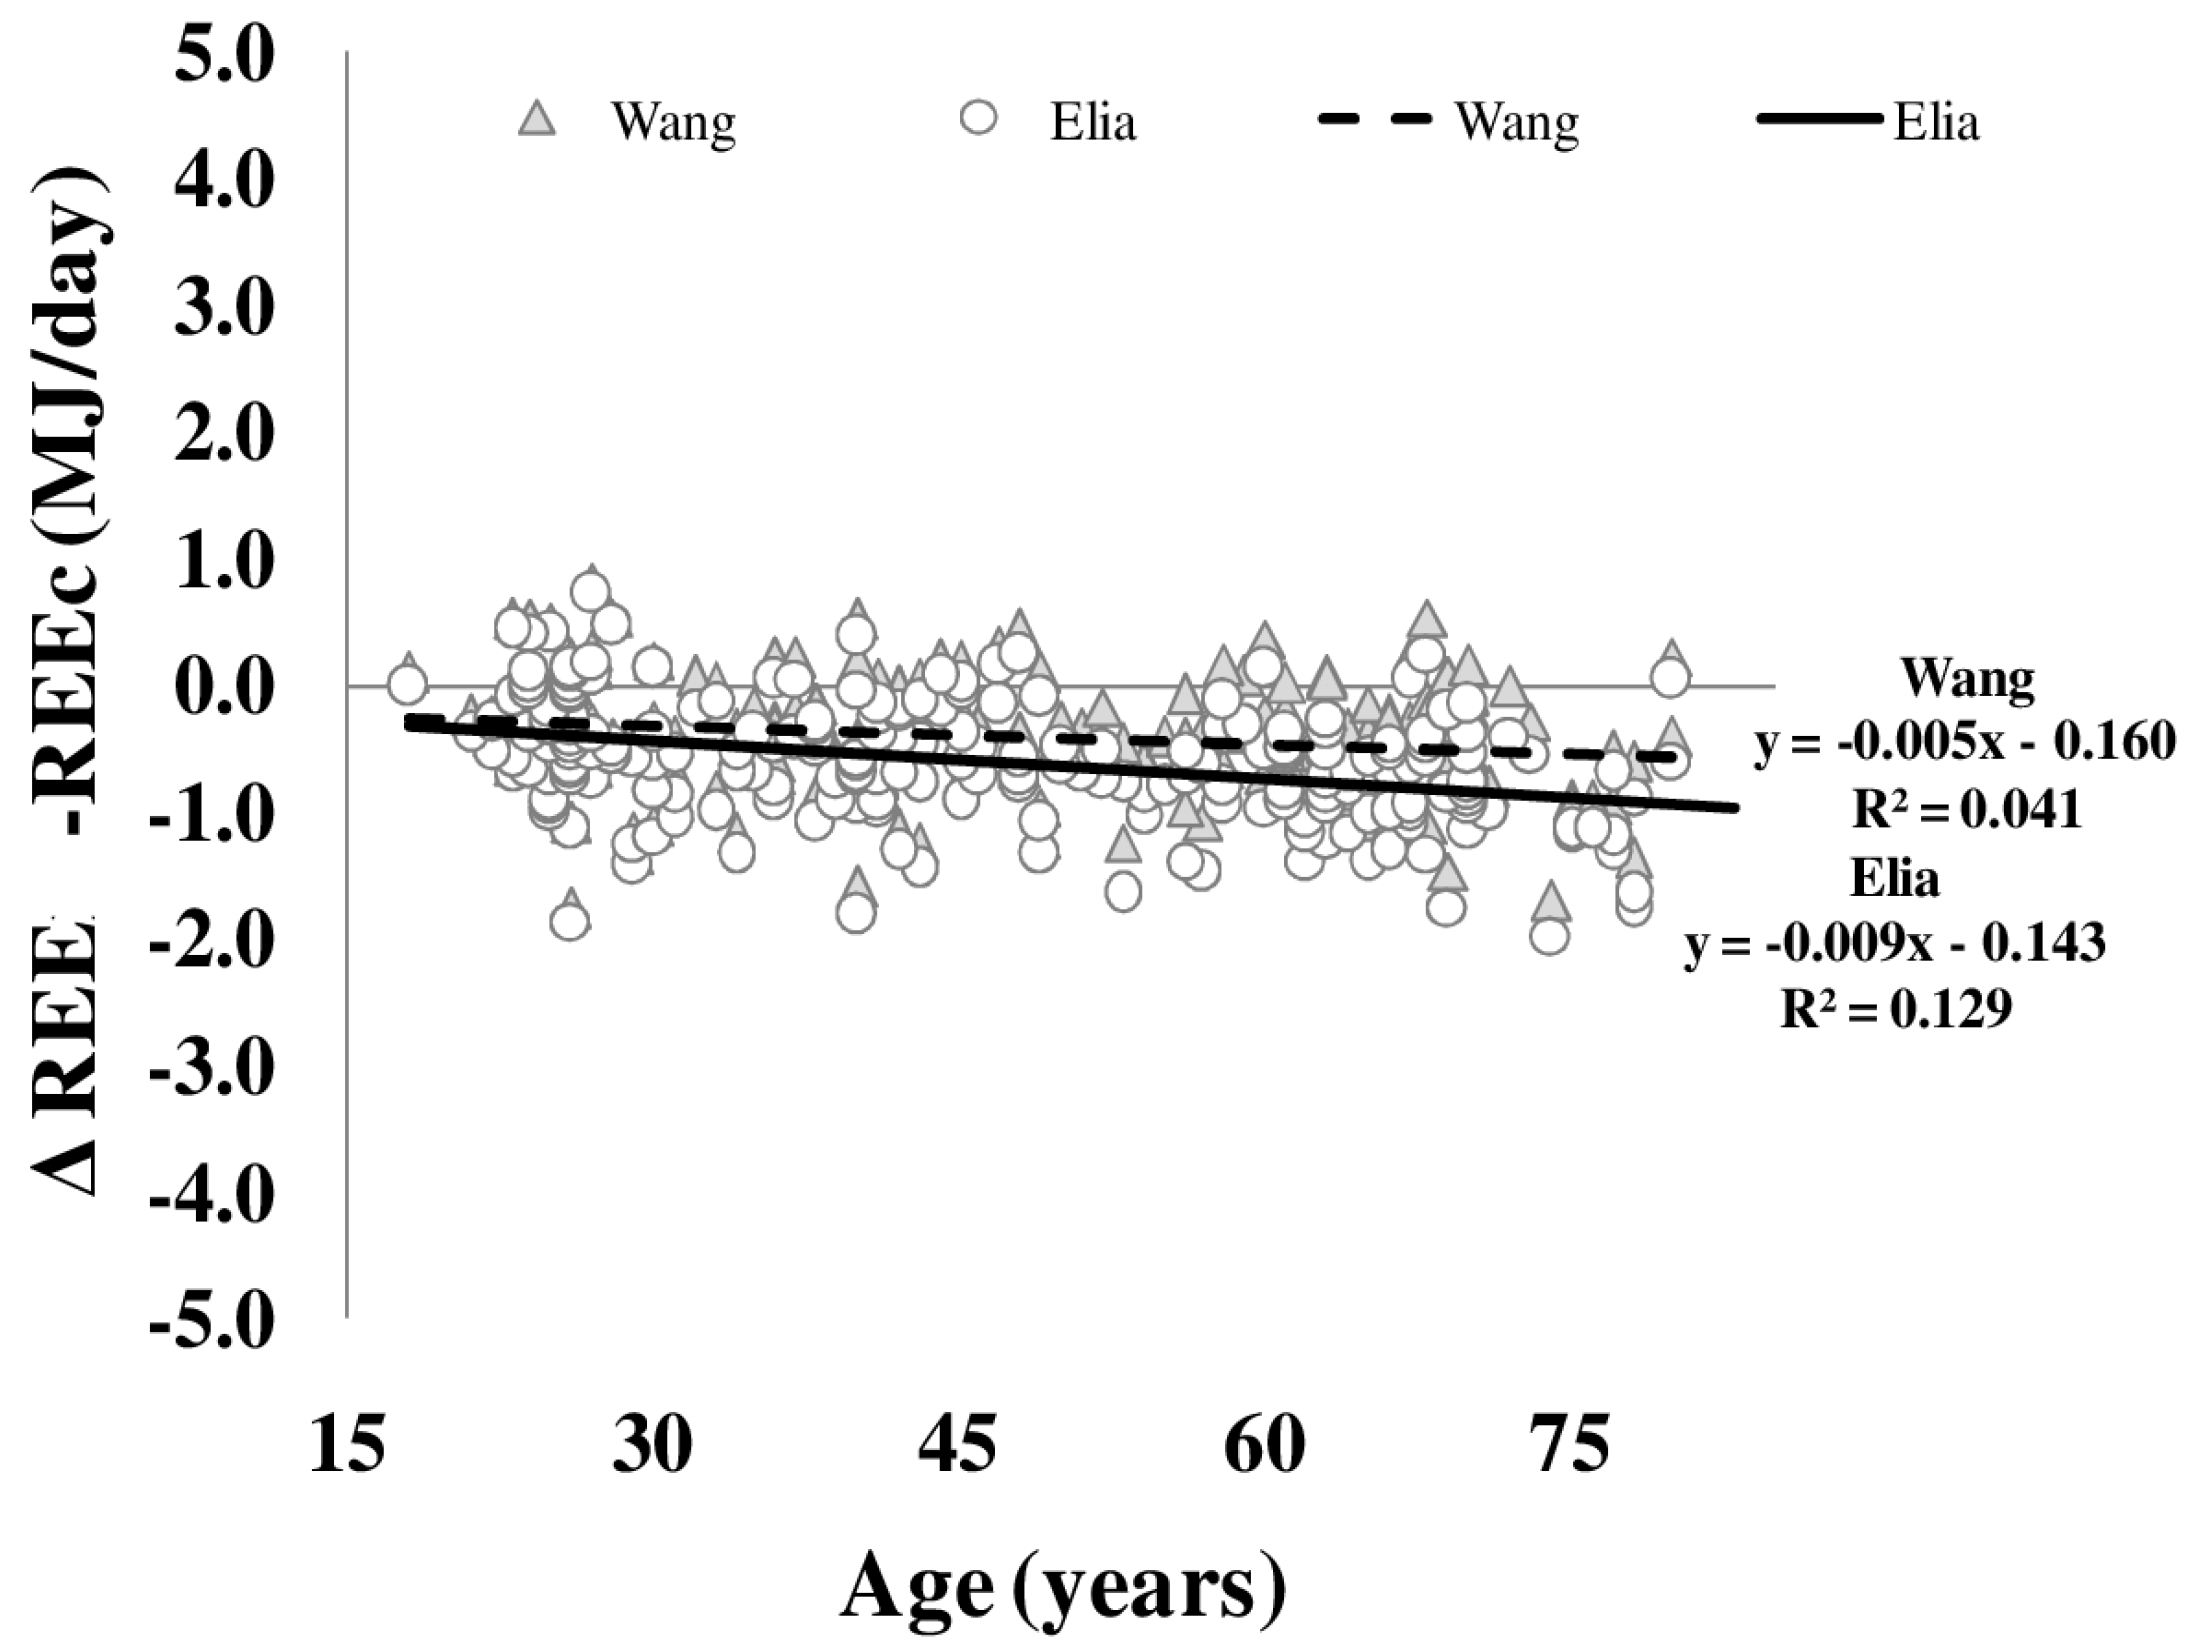
Differences between REE and REEc were plotted against age (Figure 4). Both REEc calculated according to either Elia or Wang et al. (see Methods) showed a significant bias of REE with age. This age bias was not explained by whole body density or FFM hydration. Plasma levels of free triiodothyronine explained 4.7% (Elia) and 2.5% (Wang et al.) of the variance in REE and REEc bias.
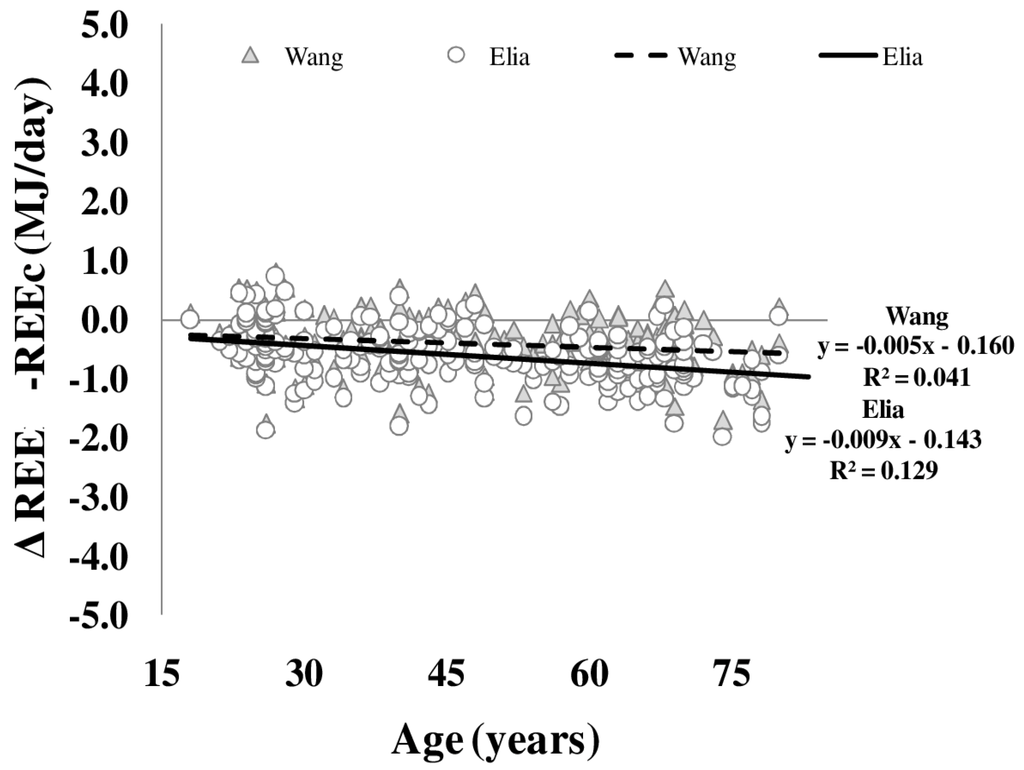
Figure 4.
Age-dependency of differences between measured and calculated resting energy expenditure (REE–REEc). REEc was calculated from organ/tissue masses (as assessed by whole body MRI times organ- and tissue-mass-specific metabolic rates as published by Elia (circles) and Wang (triangles, i.e., using age-adjusted specific metabolic rates) (n = 217) (for details, see Methods).
3.3. Cardiometabolic Risk
Table 3 shows cardiometabolic risk factors. Overall, there were no sex differences in biomarkers of inflammation and insulin resistance. Plasma levels of C-reactive protein significantly increased with age in women only. In contrast, an age-associated increase in HOMA index was only observed in men.

Table 3.
Characteristics of metabolic risk factors of the study population (n = 714).
In multivariate regression analysis variance of REE-FFM, residuals were explained by HOMA (4.2%), CRP (2.0%) and TSH (1.4%). However, MM/FFM and HMR/FFM ratios accounted for 11.8% of REE-FFM residuals, whereas age added 1.9% to their variance.
4. Discussion
Both REE and the relationship between REE and FFM decreased with age [25]. The decrease in REE is explained by a reduction in FFM as well as by changes in the composition of FFM in normal and overweight subjects (Table 1, Figure 3). With increasing FFM, the proportion of HMR to FFM remained relatively constant, whereas the MM to FFM ratio decreased with age. Considering individual organ and tissue masses, heart mass and spleen masses per FFM increased with age (Figure 3). In a previous study of our group, Bosy-Westphal et al. [3] had already described that heart mass explained 58% of the variance in the difference between REE and REEc in elderly subjects. A higher heart mass with age was seen as a compensatory effect on chronic hypertensive load or hypertrophy of cardiocytes.
In addition to the age-related (i) decreases in FFM and (ii) changes in the proportion of organ/tissues mass to FFM, alterations of specific metabolic rates of individual organs and tissues add to age-related changes in REE. To address this issue, REE was calculated (REEc) based on organ and tissue masses times specific tissue metabolic rates. Elia [27] was first to publish metabolic rates of individual organs and tissues assuming constant values across lifespan. By contrast, Gallagher et al. [4] showed that specific metabolic rates based on data of younger subjects do not resemble the respective metabolic rates in elderly subjects. In a previous work, Wang et al. [13] calculated that specific metabolic rates of organs and tissues changed with age resulting in corrections of Elias constants. Anyhow, the present data revealed that the differences between REE and REEc increased with age. This was obvious for both the Elia and Wang predictions (Figure 4). The bias between REE and REEc could not be explained by the age-related changes in whole body density or FFM hydration. In our opinion, this supports the idea that the physical property of organ and tissue masses are not related to age-related changes in REE.
In the Baltimore Longitudinal Study of Aging, Ruggiero et al. [14] and Fabbri et al. [16] have already shown that higher resting metabolic rates in age were associated with multi-morbidity and mortality. We now add the finding that age-related changes in the REE-FFM-association (i.e., the REE-FFMresiduals) were related to inflammation. Thus, the variance in the FFM to REE relationship could reflect health status.
A limitation of this study was the assumption of age-independent constant organ and tissue densities that affects the estimate of organ and tissue masses from their volumes. In addition, we have used cross-sectional data only; thus, our data cannot give a future prospect on individual aging. The fact that data analysis included normal and overweight subjects (BMI < 30 kg/m2) only could be seen as critical, but this cut off was chosen to cover current normal BMI ranges for all young as well as older adults.
5. Conclusions
In conclusion, age-related changes of REE relate to decreases in FFM as well as alterations in the REE-FFM relationship. In addition, proportional changes in FFM composition (i.e., the organ and tissue mass ratios to FFM) plus decreases in specific metabolic rates of organs and tissues add to the decrease in REE with age. The variance in the REE-FFM association is related to inflammation.
Acknowledgments
This work was supported by the Deutsche Forschungsgemeinschaft (DFG), the Federal Ministry of Education and Research (BMBF) (DFG Mü 714/8-1-3; DFG Bo 3296/1-1; BMBF 0312823A, 01EA1336, 01GI1121A, 01GI1125, 01GI0821) and Institut Danone Ernährung für Gesundheit e.V. (2013/13).
Author Contributions
Corinna Geisler: secondary data analysis and manuscript writing; Wiebke Braun: data collection, analysis of MRI data; Maryam Pourhassan: analysis of MRI data; Lisa Schweitzer: data collection and analysis of MRI data; Claus-Christian Glüer: MRI measurement support; Anja Bosy-Westphal: discussion of data; Manfred J. Müller: study design, discussion of data, manuscript writing.
Conflicts of Interest
The authors declare no conflict of interest.
Abbreviations
The following abbreviations are used in this manuscript:
| BMCDXA | bone mineral content measured by dual energy X-ray absorptiometry |
| DXA | dual energy X-ray absorptiometry |
| FFM | fat free mass by DXA |
| FM | fat mass |
| MJ/day | mega joule per day |
| MM | skeletal muscle mass |
| MRI | magnetic resonance imaging |
| HMR | high metabolic rate organs |
| REE | measured resting energy expenditure |
| REEc | REE calculated from organ/tissue masses times their specific metabolic rates |
| ∆ REE-REEc | difference between measured resting energy expenditure and calculated resting energy expenditure |
References
- Elia, M.; Ritz, P.; Stubbs, R.J. Total energy expenditure in the elderly. Eur. J. Clin. Nutr. 2000, 54, S92–S103. [Google Scholar] [CrossRef] [PubMed]
- Molnar, D.; Schutz, Y. The effect of obesity, age, puberty and gender on resting metabolic rate in children and adolescents. Eur. J. Pediatr. 1997, 156, 376–381. [Google Scholar] [CrossRef] [PubMed]
- Bosy-Westphal, A.; Eichhorn, C.; Kutzner, D.; Illner, K.; Heller, M.; Muller, M.J. The age-related decline in resting energy expenditure in humans is due to the loss of fat-free mass and to alterations in its metabolically active components. J. Nutr. 2003, 133, 2356–2362. [Google Scholar] [PubMed]
- Gallagher, D.; Allen, A.; Wang, Z.; Heymsfield, S.B.; Krasnow, N. Smaller organ tissue mass in the elderly fails to explain lower resting metabolic rate. Ann. N. Y. Acad. Sci. 2000, 904, 449–455. [Google Scholar] [CrossRef] [PubMed]
- Gallagher, D.; Belmonte, D.; Deurenberg, P.; Wang, Z.; Krasnow, N.; Pi-Sunyer, F.X.; Heymsfield, S.B. Organ-tissue mass measurement allows modeling of ree and metabolically active tissue mass. Am. J. Physiol. 1998, 275, E249–E258. [Google Scholar] [PubMed]
- Wang, Z.; Heshka, S.; Gallagher, D.; Boozer, C.N.; Kotler, D.P.; Heymsfield, S.B. Resting energy expenditure-fat-free mass relationship: New insights provided by body composition modeling. Am. J. Physiol. Endocrinol. Metab. 2000, 279, E539–E545. [Google Scholar] [PubMed]
- Bosy-Westphal, A.; Kossel, E.; Goele, K.; Later, W.; Hitze, B.; Settler, U.; Heller, M.; Gluer, C.C.; Heymsfield, S.B.; Muller, M.J. Contribution of individual organ mass loss to weight loss-associated decline in resting energy expenditure. Am. J. Clin. Nutr. 2009, 90, 993–1001. [Google Scholar] [CrossRef] [PubMed]
- Bosy-Westphal, A.; Reinecke, U.; Schlorke, T.; Illner, K.; Kutzner, D.; Heller, M.; Muller, M.J. Effect of organ and tissue masses on resting energy expenditure in underweight, normal weight and obese adults. Int. J. Obes. 2004, 28, 72–79. [Google Scholar] [CrossRef] [PubMed]
- Heymsfield, S.B.; Gonzalez, M.C.; Shen, W.; Redman, L.; Thomas, D. Weight loss composition is one-fourth fat-free mass: A critical review and critique of this widely cited rule. Obes. Rev. 2014, 15, 310–321. [Google Scholar] [CrossRef] [PubMed]
- Muller, M.J.; Bosy-Westphal, A.; Kutzner, D.; Heller, M. Metabolically active components of fat free mass (ffm) and resting energy expenditure (ree) in humans. Forum. Nutr. 2003, 56, 301–303. [Google Scholar] [PubMed]
- Müller, M.J.; Wang, Z.; Heymsfield, S.B.; Schautz, B.; Bosy-Westphal, A. Advances in the understanding of specific metabolic rates of major organs and tissues in humans. Curr. Opin. Clin. Nutr. Metab. Care 2013, 16, 501–508. [Google Scholar] [CrossRef] [PubMed]
- Geisler, C.; Braun, W.; Pourhassan, M.; Schweitzer, L.; Gluer, C.C.; Bosy-Westphal, A.; Muller, M.J. Gender-specific associations in age-related changes in resting energy expenditure (ree) and mri measured body composition in healthy caucasians. J. Gerontol. A Biol. Sci. Med. Sci. 2015, 20, 329–335. [Google Scholar] [CrossRef] [PubMed]
- Wang, Z.; Ying, Z.; Bosy-Westphal, A.; Zhang, J.; Schautz, B.; Later, W.; Heymsfield, S.B.; Muller, M.J. Specific metabolic rates of major organs and tissues across adulthood: Evaluation by mechanistic model of resting energy expenditure. Am. J. Clin. Nutr. 2010, 92, 1369–1377. [Google Scholar] [CrossRef] [PubMed]
- Ruggiero, C.; Metter, E.J.; Melenovsky, V.; Cherubini, A.; Najjar, S.S.; Ble, A.; Senin, U.; Longo, D.L.; Ferrucci, L. High basal metabolic rate is a risk factor for mortality: The baltimore longitudinal study of aging. J. Gerontol. A Biol. Sci. Med. Sci. 2008, 63, 698–706. [Google Scholar] [CrossRef] [PubMed]
- Abizanda, P.; Romero, L.; Sánchez-Jurado, P.M.; Ruano, T.F.; Ríos, S.S.; Sánchez, M.F. Energetics of aging and frailty: The fradea study. J. Gerontol. Ser. A Biol. Sci. Med. Sci. 2015. [Google Scholar] [CrossRef] [PubMed]
- Fabbri, E.; An, Y.; Schrack, J.A.; Gonzalez-Freire, M.; Zoli, M.; Simonsick, E.M.; Guralnik, J.M.; Boyd, C.M.; Studenski, S.A.; Ferrucci, L. Energy metabolism and the burden of multimorbidity in older adults: Results from the baltimore longitudinal study of aging. J. Gerontol. Ser. A Biol. Sci. Med. Sci. 2015, 70, 1297–1303. [Google Scholar] [CrossRef] [PubMed]
- Luhrmann, P.M.; Edelmann-Schafer, B.; Neuhauser-Berthold, M. Changes in resting metabolic rate in an elderly german population: Cross-sectional and longitudinal data. J. Nutr. Health Aging 2010, 14, 232–236. [Google Scholar] [CrossRef] [PubMed]
- Bosy-Westphal, A.; Muller, M.J.; Boschmann, M.; Klaus, S.; Kreymann, G.; Luhrmann, P.M.; Neuhauser-Berthold, M.; Noack, R.; Pirke, K.M.; Platte, P.; et al. Grade of adiposity affects the impact of fat mass on resting energy expenditure in women. Br. J. Nutr. 2009, 101, 474–477. [Google Scholar] [CrossRef] [PubMed]
- Bosy-Westphal, A.; Schautz, B.; Lagerpusch, M.; Pourhassan, M.; Braun, W.; Goele, K.; Heller, M.; Gluer, C.C.; Muller, M.J. Effect of weight loss and regain on adipose tissue distribution, composition of lean mass and resting energy expenditure in young overweight and obese adults. Int. J. Obes. 2013, 37, 1371–1377. [Google Scholar] [CrossRef] [PubMed]
- Müller, M.J.; Bosy-Westphal, A. Adaptive thermogenesis with weight loss in humans. Obesity 2013, 21, 218–228. [Google Scholar] [CrossRef] [PubMed]
- Siri, W.E. Body composition from fluid spaces and density: Analysis of methods. 1961. Nutrition 1993, 9, 480–491; discussion 480, 492. [Google Scholar] [PubMed]
- Muller, M.J.; Enderle, J.; Pourhassan, M.; Braun, W.; Eggeling, B.; Lagerpusch, M.; Gluer, C.C.; Kehayias, J.J.; Kiosz, D.; Bosy-Westphal, A. Metabolic adaptation to caloric restriction and subsequent refeeding: The minnesota starvation experiment revisited. Am. J. Clin. Nutr. 2015, 102, 807–819. [Google Scholar] [CrossRef] [PubMed]
- Schautz, B.; Later, W.; Heller, M.; Muller, M.J.; Bosy-Westphal, A. Total and regional relationship between lean and fat mass with increasing adiposity—Impact for the diagnosis of sarcopenic obesity. Eur. J. Clin. Nutr. 2012, 66, 1356–1361. [Google Scholar] [CrossRef] [PubMed]
- Snyder, W.; Cook, M.J.; Nasset, E.S.; Karhausen, L.R.; Howells, G.P.; Tipton, I.H. Report of the Task Group on Reference Man; Pergamon Press: Oxford, UK, 1975. [Google Scholar]
- Muller, M.J.; Bosy-Westphal, A.; Klaus, S.; Kreymann, G.; Luhrmann, P.M.; Neuhauser-Berthold, M.; Noack, R.; Pirke, K.M.; Platte, P.; Selberg, O.; et al. World health organization equations have shortcomings for predicting resting energy expenditure in persons from a modern, affluent population: Generation of a new reference standard from a retrospective analysis of a german database of resting energy expenditure. Am. J. Clin. Nutr. 2004, 80, 1379–1390. [Google Scholar] [PubMed]
- Bader, N.; Bosy-Westphal, A.; Dilba, B.; Muller, M.J. Intra- and interindividual variability of resting energy expenditure in healthy male subjects—Biological and methodological variability of resting energy expenditure. Br. J. Nutr. 2005, 94, 843–849. [Google Scholar] [CrossRef] [PubMed]
- Elia, M. Organ and tissue contribution to metabolic rate. In Energy Metabolism: Tissue Determinants and Cellular Corollaries; Kinney, J.M., Tucker, H.N., Eds.; Raven: New York, NY, USA, 1992; pp. 61–77. [Google Scholar]
- Heymsfield, S.B.; Gallagher, D.; Kotler, D.P.; Wang, Z.; Allison, D.B.; Heshka, S. Body-size dependence of resting energy expenditure can be attributed to nonenergetic homogeneity of fat-free mass. Am. J. Physiol. Endocrinol. Metab. 2002, 282, E132–E138. [Google Scholar] [PubMed]
- Haas, V.; Onur, S.; Paul, T.; Nutzinger, D.O.; Bosy-Westphal, A.; Hauer, M.; Brabant, G.; Klein, H.; Muller, M.J. Leptin and body weight regulation in patients with anorexia nervosa before and during weight recovery. Am. J. Clin. Nutr. 2005, 81, 889–896. [Google Scholar] [PubMed]
- Lagerpusch, M.; Enderle, J.; Eggeling, B.; Braun, W.; Johannsen, M.; Pape, D.; Muller, M.J.; Bosy-Westphal, A. Carbohydrate quality and quantity affect glucose and lipid metabolism during weight regain in healthy men. J. Nutr. 2013, 143, 1593–1601. [Google Scholar] [CrossRef] [PubMed]
© 2016 by the authors; licensee MDPI, Basel, Switzerland. This article is an open access article distributed under the terms and conditions of the Creative Commons Attribution (CC-BY) license (http://creativecommons.org/licenses/by/4.0/).

