Dietary BCAA Intake Is Associated with Demographic, Socioeconomic and Lifestyle Factors in Residents of São Paulo, Brazil

 , ,
, ,
Abstract
:1. Introduction
2. Materials and Methods
2.1. Study Design
2.2. Data Collecting and Processing
2.3. Assessment of Dietary Intake
2.4. Statistical Analyses
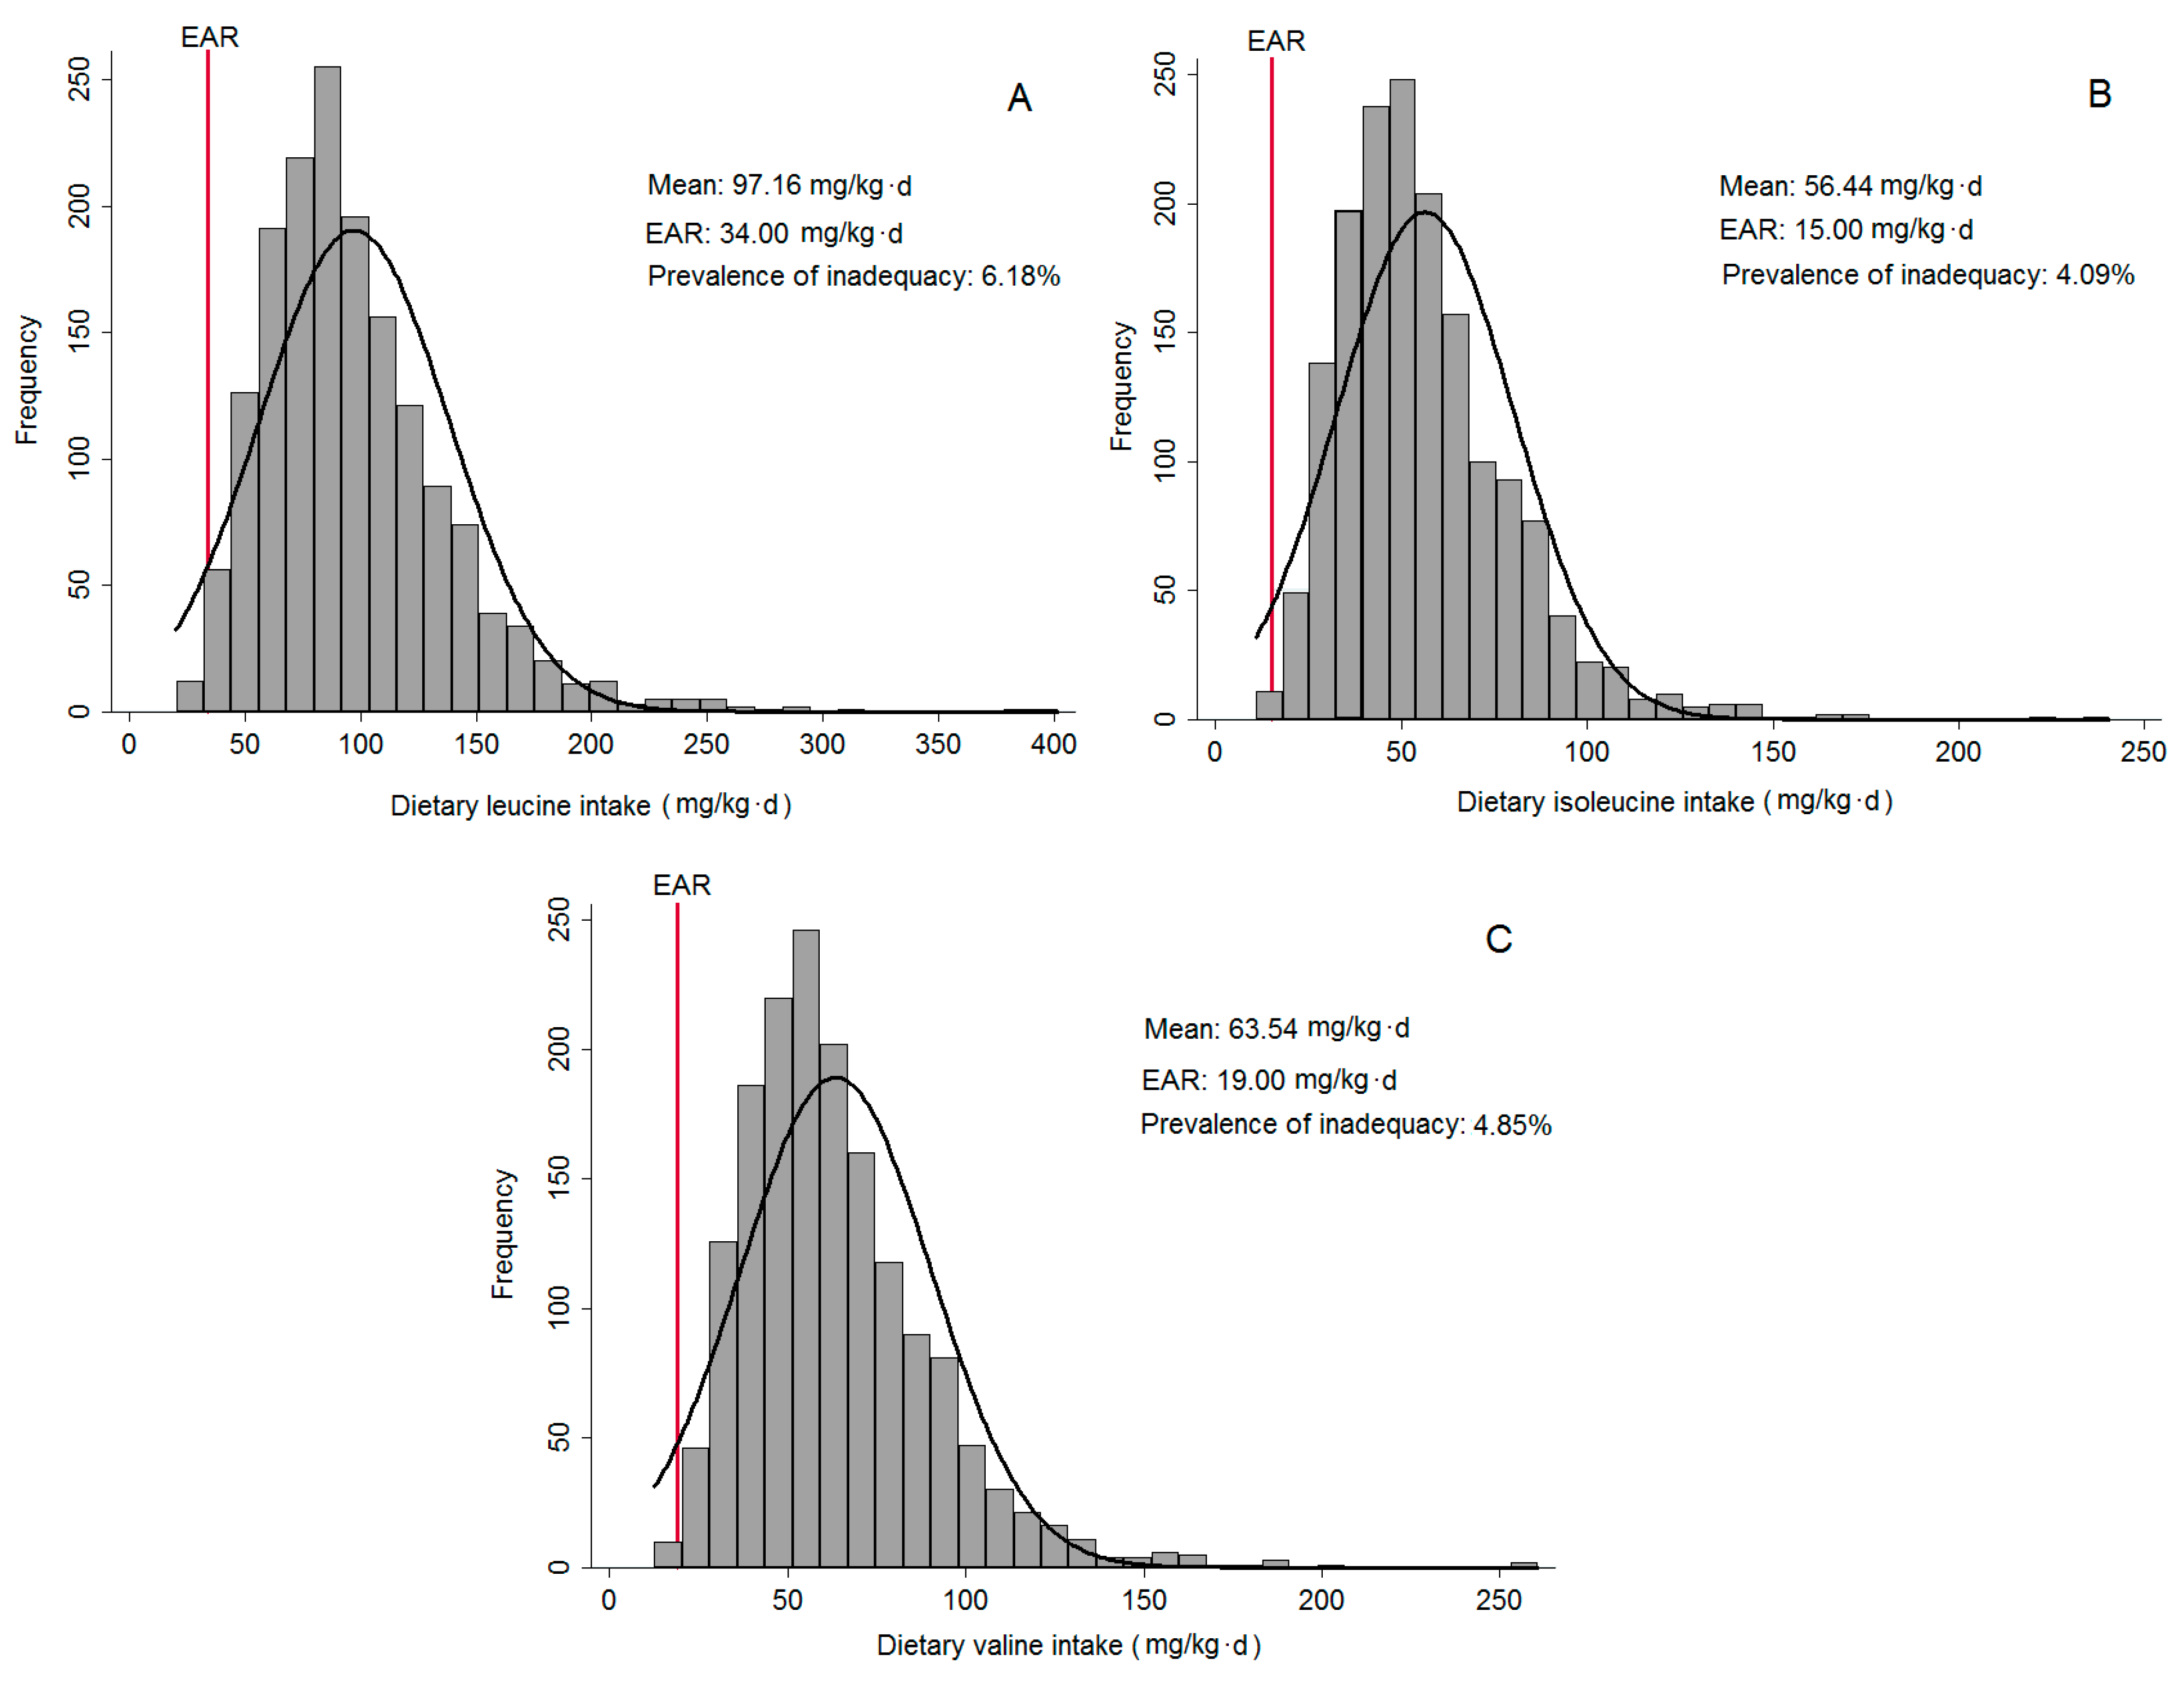
3. Results
4. Discussion
5. Conclusions
Acknowledgments
Author Contributions
Conflicts of Interest
References
- Conway, M.E.; Hutson, S.M. BCAA metabolism and NH3 homeostasis. Adv. Neurobiol. 2016, 13, 99–132. [Google Scholar] [PubMed]
- Fernstrom, J.D. Branched-chain amino acids and brain function. J. Nutr. 2005, 135, 1539S–1546S. [Google Scholar] [PubMed]
- Ferguson, J.F.; Wang, T.J. Branched-chain amino acids and cardiovascular disease: Does diet matter? Clin. Chem. 2016, 62, 545–547. [Google Scholar] [CrossRef] [PubMed]
- Mangge, H.; Zelzer, S.; Pruller, F.; Schnedl, W.J.; Weghuber, D.; Enko, D.; Bergsten, P.; Haybaeck, J.; Meinitzer, A. Branched-chain amino acids are associated with cardiometabolic risk profiles found already in lean, overweight and obese young. J. Nutr. Biochem. 2016, 32, 123–127. [Google Scholar] [CrossRef] [PubMed]
- Nagata, C.; Nakamura, K.; Wada, K.; Tsuji, M.; Tamai, Y.; Kawachi, T. Branched-chain amino acid intake and the risk of diabetes in a Japanese community: The Takayama study. Am. J. Epidemiol. 2013, 178, 1226–1232. [Google Scholar] [CrossRef] [PubMed]
- Zheng, Y.; Li, Y.; Qi, Q.; Hruby, A.; Manson, J.E.; Willett, W.C.; Wolpin, B.M.; Hu, F.B.; Qi, L. Cumulative consumption of branched-chain amino acids and incidence of type 2 diabetes. Int. J. Epidemiol. 2016, 45, 1482–1492. [Google Scholar] [CrossRef] [PubMed]
- Zhao, X.; Han, Q.; Liu, Y.; Sun, C.; Gang, X.; Wang, G. The relationship between branched-chain amino acid related metabolomic signature and insulin resistance: A systematic review. J. Diabetes Res. 2016, 2016, 1–12. [Google Scholar] [CrossRef] [PubMed]
- World Health Organization (WHO). Global Status Report on Noncommunicable Diseases; WHO: Geneva, Switzerland, 2014. [Google Scholar]
- Vlismas, K.; Stavrinos, V.; Panagiotakos, D.B. Socio-economic status, dietary habits and health-related outcomes in various parts of the world: A review. Cent. Eur. J. Public Health 2009, 17, 55–63. [Google Scholar] [PubMed]
- Hulshof, K.; Brussaard, J.H.; Kruizinga, A.; Telman, J.; Wik, M. Socio-economic status, dietary intake and 10 y trends: The Dutch National Food Consumption Survey. Eur. J. Clin. Nutr. 2003, 57, 128–137. [Google Scholar] [CrossRef] [PubMed]
- Masur, J.; Monteiro, M.G. Validation of the “cage” alcoholism screening test in a Brazilian psychiatric inpatient hospital setting. Braz. J. Med. Biol. Res. 1983, 16, 215–218. [Google Scholar] [PubMed]
- Craig, C.L.; Marshall, A.L.; Sjöström, M.; Bauman, A.E.; Booth, M.L.; Ainsworth, B.E.; Pratt, M.; Ekelund, U.; Yngve, A.; Sallis, J.F.; et al. International physical activity questionnaire: 12-country reliability and validity. Med. Sci. Sports Exerc. 2003, 35, 1381–1395. [Google Scholar] [CrossRef] [PubMed]
- de Onis, M.; Onyango, A.W.; Borghi, E.; Siyam, A.; Nishida, C.; Siekmann, J. Development of a WHO growth reference for school-aged children and adolescents. Bull. World Health Organ. 2007, 85, 660–667. [Google Scholar] [CrossRef] [PubMed]
- World Health Organization. Consultation on Obesity: Preventing and Managing the Global Epidemic; WHO-Technical Report Series, 894; WHO: Geneva, Switzerland, 1998. [Google Scholar]
- Lebrão, M.L.; Duarte, Y.A.O. SABE—Saúde, Bem-Estar e Envelhecimento—O Projeto Sabe no Município de São Paulo: Uma Abordagem Inicial; Organização Pan-Americana da Saúde: Brasília, Brazil, 2003. [Google Scholar]
- Carvalho, A.M.; Piovezan, L.G.; Selem, S.S.C.; Fisberg, R.M.; Marchioni, D.M.L. Validação e calibração de medidas de peso e altura autorreferidas por indivíduos da cidade de São Paulo. Rev. Bras. Epidemiol. 2014, 17, 735–746. [Google Scholar] [CrossRef] [PubMed]
- Guenther, P.M.; DeMaio, T.J.; Ingwersen, L.A.; Berlin, M. The multiple-pass approach for the 24-hour recall in the continuing survey of food intakes by individuals (CSFII) 1994–96. In Proceedings of the International Conference on Dietary Assessment Methods, Boston, MA, USA, 22–24 January 1995. [Google Scholar]
- Blanton, C.A.; Moshfegh, A.J.; Baer, D.J.; Kretsch, M.J. The USDA automated multiple-pass method accurately estimates group total energy and nutrient intake. J. Nutr. 2006, 136, 2594–2599. [Google Scholar] [PubMed]
- NCC Food and Nutrient Center. Regents of the University of Minnesota—NDSR Manual; University of Minnesota: Minneapolis, MN, USA, 2014. [Google Scholar]
- Raper, N.; Perloff, B.; Ingwersen, L.; Steinfeldt, L.; Arnand, J. An overview of USDA’s dietary intake data system. J. Food Compos. Anal. 2004, 17, 545–555. [Google Scholar] [CrossRef]
- Núcleo de Estudos e Pesquisas em Alimentação, Universidade Estadual de Campinas. Tabela Brasileira de Composição de Alimentos, 4rd ed.; NEPA-UNICAMP: Campinas, Brazil, 2011. [Google Scholar]
- Block, G.; Dresser, C.M.; Hartman, A.M.; Carroll, M.D. Nutrient sources in the American diet: Quantitative data from the NHANES II survey. II. Macronutrients and fats. Am. J. Epidemiol. 1985, 122, 27–40. [Google Scholar] [CrossRef] [PubMed]
- Kelly, M.T.; Rennie, K.L.; Wallace, J.M.; Robson, P.J.; Welch, R.W.; Hannon-Fletcher, M.P.; Livingstone, M.B. Associations between the portion sizes of food groups consumed and measures of adiposity in the British National Diet and Nutrition Survey. Br. J. Nutr. 2009, 101, 1413–1420. [Google Scholar] [CrossRef] [PubMed]
- Institute of Medicine. Dietary Reference Intakes for Energy, Carbohydrate, Fiber, Fat, Fatty Acids, Cholesterol, Protein and Amino Acids (Macronutrients): Preliminary Report; National Academies Press: Washington, DC, USA, 2002. [Google Scholar]
- Haubrock, J.; Nӧthlings, U.; Volatier, J.; Dekkers, A.; Ocké, M.; Harttig, U.; Illner, A.K.; Knüppel, S.; Andersen, L.F.; Boeing, H.; et al. Estimating usual food intake distributions by using the multiple source method in the EPIC-Potsdam Calibration Study. J. Nutr. 2011, 141, 914–920. [Google Scholar] [CrossRef] [PubMed]
- Willett, W.C.; Howe, G.R.; Kushi, L.W. Adjustment for total energy intake in epidemiologic studies. Am. J. Clin. Nutr. 1997, 65, 1220S–1228S. [Google Scholar] [PubMed]
- German Institute of Human Nutrition Potsdam-Rehbrücke—DIfE, Department of Epidemiology. The Multiple Source Method (MSM) Version 1.0.1. Available online: https://nugo.dife.de/msm (accessed on October 2016).
- Riazi, R.; Wykes, L.J.; Ball, R.O.; Pencharz, P.B. The total branched-chain amino acid requirement in young healthy adult men determined by indicator amino acid oxidation by use of L-[1–13C] phenylalanine. J. Nutr. 2003, 133, 1383–1389. [Google Scholar] [PubMed]
- Mager, D.R.; Wykes, L.J.; Ball, R.O.; Pencharz, P.B. Branched-chain amino acid requirements in school-aged children determined by indicator amino acid oxidation (IAAO). J. Nutr. 2003, 133, 3540–3545. [Google Scholar] [PubMed]
- Baker, D.H. Tolerance for branched-chain amino acids in experimental animals and humans. J. Nutr. 2005, 135, 1585S–1590S. [Google Scholar] [PubMed]
- Baker, D.H. Problems and pitfalls in animal experiments designed to establish dietary requirements for essential nutrients. J. Nutr. 1986, 116, 2339–2349. [Google Scholar] [PubMed]
- Fuller, M.F.; Garlick, P.J. Human amino acid requirements: Can the controversy be resolved? Annu. Rev. Nutr. 1994, 14, 217–241. [Google Scholar] [CrossRef] [PubMed]
- Micha, R.; Khatibzadeh, S.; Shi, P.; Andrews, K.G.; Engell, R.E.; Mozaffarian, D.; Global Burden of Diseases Nutrition and Chronic Diseases Expert Group (NutriCoDE). Global, regional and national consumption of major food groups in 1990 and 2010: A systematic analysis including 266 country-specific nutrition surveys worldwide. BMJ Open 2015, 5, e008705. [Google Scholar] [CrossRef] [PubMed]
- Rizk, M.T.; Treat, T.A. Perceptions of food healthiness among free-living women. Appetite 2015, 95, 390–398. [Google Scholar] [CrossRef] [PubMed]
- Rolls, B.J.; Fedoroff, I.C.; Guthrie, J.F. Gender differences in eating behavior and body weight regulation. Health Psychol. 1991, 10, 133–142. [Google Scholar] [CrossRef] [PubMed]
- Morimoto, A.; Ohno, Y.; Tatsumi, Y.; Nishigaki, Y.; Maejima, F.; Mizuno, S.; Watanabe, S. Impact of smoking cessation on incidence of diabetes mellitus among overweight or normal-weight Japanese men. Diabetes Res. Clin. Pract. 2012, 96, 407–413. [Google Scholar] [CrossRef] [PubMed]
- Song, M.; Fung, T.T.; Hu, F.B.; Willett, W.C.; Longo, V.D.; Chan, A.T.; Giovannucci, E.L. Association of animal and plant protein intake with all-cause and cause-specific mortality. JAMA Intern. Med. 2016, 176, 1453–1463. [Google Scholar] [CrossRef] [PubMed]
- Kouvari, M.; Tyrovolas, S.; Panagiotakos, D.B. Red meat consumption and healthy ageing: A review. Maturitas 2016, 84, 17–24. [Google Scholar] [CrossRef] [PubMed]
- Carvalho, A.M.; Selem, S.S.C.; Miranda, A.M.; Marchioni, D.M. Excessive red and processed meat intake: Relations with health and environment in Brazil. Br. J. Nutr. 2016, 115, 2011–2016. [Google Scholar] [CrossRef] [PubMed]
- Souza, A.M.; Pereira, R.A.; Yokoo, E.M.; Levy, R.B.; Sichieri, R. Most consumed foods in Brazil: National Dietary Survey 2008–2009. Rev. Saúde Pública 2013, 47, 190S–199S. [Google Scholar] [CrossRef]
- Baum, J.I.; Kim, I.Y.; Wolfe, R.R. Protein consumption and the elderly: What is the optimal level of intake? Nutrients 2016, 8, 359. [Google Scholar] [CrossRef] [PubMed]
- Carvalho, A.M.; Miranda, A.M.; Santos, F.A.; Loureiro, A.P.M.; Fisberg, R.M.; Marchioni, D.M. High intake of heterocyclic amines from meat is associated with oxidative stress. Br. J. Nutr. 2015, 113, 1301–1307. [Google Scholar] [CrossRef] [PubMed]


| Variables | Leucine | Isoleucine | Valine | Total BCAA | ||||
|---|---|---|---|---|---|---|---|---|
| β | 95% CI | β | 95% CI | β | 95% CI | β | 95% CI | |
| Sex (Ref. male) | ||||||||
| Female | −0.43 | −0.71; −0.16 | −0.25 | −0.42; −0.09 | −0.28 | −0.46; −0.11 | −0.98 | −1.59; −0.37 |
| Race (Ref. white) | ||||||||
| No white | −0.24 | −0.47; −0.02 | −0.16 | −0.29; −0.02 | −0.17 | −0.32; −0.03 | −0.58 | −1.09; −0.08 |
| Smoking status (Ref. nonsmoker) | ||||||||
| Former smoker | −0.29 | −0.91; 0.31 | −0.15 | −0.56; 0.24 | −0.19 | −0.58; 0.20 | −0.64 | −2.05; 0.76 |
| Current smoker | −0.71 | −1.50; 0.07 | −0.44 | −0.92; 0.04 | −0.47 | −1.00; 0.05 | −1.62 | −3.43; 0.17 |
| Alcohol consumption (Ref. no consumer) | ||||||||
| Consumer | 0.03 | −0.20; 0.28 | 0.01 | −0.13; 0.16 | 0.00 | −0.14; 0.16 | 0.06 | −0.49; 0.61 |
| Household per capita income (US$ per month) * | 0.02 | 0.01; 0.04 | 0.01 | 0.01; 0.02 | 0.01 | 0.01; 0.02 | 0.06 | 0.02; 0.10 |
| Household head education | −0.00 | −0.04; 0.03 | −0.00 | −0.02; 0.01 | −0.00 | −0.03; 0.01 | −0.01 | −0.01; 0.00 |
| Body Mass Index (Ref. without excess body weight) ‡ | ||||||||
| With excess body weight | −0.22 | −0.47; 0.02 | −0.10 | −0.26; 0.04 | −0.12 | −0.29; 0.04 | −0.45 | −1.03; 0.11 |
| Leisure time physical activity (Ref. Insufficiently active) | ||||||||
| Sufficiently active † | −0.29 | −0.61; 0.03 | −0.16 | −0.35; 0.01 | −0.16 | −0.38; 0.04 | −0.63 | −1.35; 0.08 |
| Variables | Leucine | Isoleucine | Valine | Total BCAA | ||||
|---|---|---|---|---|---|---|---|---|
| β | 95% CI | β | 95% CI | β | 95% CI | β | 95% CI | |
| Sex (Ref. male) | ||||||||
| Female | −0.35 | −0.61; −0.10 | −0.21 | −0.36; −0.06 | −0.24 | −0.40; −0.07 | −0.81 | −1.38; −0.24 |
| Race (Ref. white) | ||||||||
| No white | −0.02 | −0.26; 0.22 | −0.02 | −0.17; 0.12 | −0.02 | −0.18; 0.13 | −0.06 | −0.61; 0.48 |
| Smoking status (Ref. nonsmoker) | ||||||||
| Former smoker | 0.36 | 0.04; 0.67 | 0.24 | 0.04; 0.44 | 0.23 | 0.03; 0.43 | 0.83 | 0.12; 1.55 |
| Current smoker | −0.11 | −0.46; 0.23 | −0.07 | −0.29; 0.13 | −0.09 | −0.32; 0.13 | −0.29 | −1.08; 0.50 |
| Alcohol consumption (Ref. no consumer) | ||||||||
| Consumer | 0.05 | −0.18; 0.28 | 0.03 | −0.11; 0.17 | 0.02 | −0.12; 0.17 | 0.10 | −0.41; 0.63 |
| Household per capita income (US$ per month) * | 0.02 | 0.01; 0.04 | 0.01 | 0.01; 0.02 | 0.01 | 0.01; 0.03 | 0.64 | 0.02; 0.10 |
| Household head education | −0.04 | −0.08; 0.00 | −0.02 | −0.04; 0.00 | −0.02 | −0.05; 0.00 | −0.09 | −0.18; 0.00 |
| Body Mass Index (Ref. without excess body weight) ‡ | ||||||||
| With excess body weight | −0.12 | −0.33; 0.09 | −0.08 | −0.21; 0.04 | −0.07 | −0.20; 0.06 | −0.28 | −0.76; 0.19 |
| Leisure time physical activity (Ref. Insufficiently active) | ||||||||
| Sufficiently active † | 0.01 | −0.28; 0.30 | 0.01 | −0.28 | −0.00 | −0.30; 0.30 | 0.00 | −1.06; 1.08 |
| Variables | Leucine | Isoleucine | Valine | Total BCAA | ||||
|---|---|---|---|---|---|---|---|---|
| β | 95% CI | β | 95% CI | β | 95% CI | β | 95% CI | |
| Sex (Ref. male) | ||||||||
| Female | −0.14 | −0.31; 0.01 | −0.06 | −0.16; 0.03 | −0.08 | −0.19; 0.02 | −0.30 | −0.67; 0.06 |
| Race (Ref. white) | ||||||||
| No white | 0.13 | −0.11; 0.38 | 0.06 | −0.08; 0.20 | 0.07 | −0.96; 0.23 | 0.26 | −0.29; 0.83 |
| Smoking status (Ref. nonsmoker) | ||||||||
| Former smoker | 0.02 | −0.19; 0.24 | 0.02 | −0.10; 0.15 | 0.01 | −0.12; 0.14 | 0.05 | −0.43; 0.53 |
| Current smoker | 0.19 | −0.16; 0.55 | 0.13 | −0.09; 0.36 | 0.13 | −0.10; 0.36 | 0.46 | −0.35; 1.28 |
| Alcohol consumption (Ref. no consumer) | ||||||||
| Consumer | 0.07 | −0.15; 0.31 | 0.02 | −0.10; 0.16 | 0.03 | −0.11; 0.18 | 0.14 | −0.37; 0.66 |
| Household per capita income (US$ per month) * | 0.00 | −0.02; 0.02 | 0.00 | −0.01; 0.01 | 0.00 | −0.01; 0.01 | 0.00 | −0.05; 0.06 |
| Household head education | −0.00 | −0.04; 0.02 | −0.00 | −0.02; 0.01 | −0.00 | −0.02; 0.01 | 0.01 | 0.00; 0.03 |
| Body Mass Index (Ref. without excess body weight) ‡ | ||||||||
| With excess body weight | 0.02 | −0.22; 0.27 | 0.00 | −0.13; 0.14 | 0.01 | −0.14; 0.16 | 0.03 | −0.50; 0.58 |
| Leisure time physical activity (Ref. Insufficiently active) | ||||||||
| Sufficiently active † | 0.19 | −0.05; 0.43 | 0.13 | −0.02; 0.29 | 0.14 | −0.02; 0.31 | 0.46 | −0.10; 1.04 |
| Rank | Leucine | Isoleucine | Valine | Total BCAA | ||||||||
|---|---|---|---|---|---|---|---|---|---|---|---|---|
| Food | Median (g) | % | Food | Median (g) | % | Food | Median (g) | % | Food | Median (g) | % | |
| 1 | Unprocessed red meat | 105.0 | 22.4 | Unprocessed red meat | 105.0 | 22.4 | Unprocessed red meat | 105.0 | 21.1 | Unprocessed red meat | 105.0 | 22.0 |
| 2 | Unprocessed poultry | 80.0 | 9.0 | Unprocessed poultry | 80.0 | 10.8 | Unprocessed poultry | 80.0 | 9.2 | Unprocessed poultry | 80.0 | 9.5 |
| 3 | Savoury baked | 113.1 | 7.8 | Savoury baked | 113.1 | 7.4 | Savoury baked | 113.1 | 7.5 | Savoury baked | 113.1 | 7.6 |
| 4 | Bread and toast | 50.0 | 6.7 | Bread and toast | 50.0 | 6.3 | Bread and toast | 50.0 | 6.4 | Bread and toast | 50.0 | 6.5 |
| 5 | Beans | 43.0 | 6.0 | Beans | 43.0 | 5.7 | Rice | 150.0 | 6.1 | Beans | 43.0 | 5.9 |
| 6 | Rice | 150.0 | 5.4 | Whole milk | 180.4 | 5.4 | Beans | 43.0 | 6.0 | Rice | 150.0 | 5.5 |
| 7 | Whole milk | 180.4 | 5.0 | Rice | 150.0 | 4.9 | Whole milk | 180.4 | 5.6 | Whole milk | 180.4 | 5.3 |
| 8 | Processed red meat | 56.0 | 4.2 | Processed pork | 47.5 | 4.2 | Processed red meat | 56.0 | 4.0 | Processed red meat | 56.0 | 4.1 |
| 9 | Processed pork | 47.5 | 3.9 | Processed red meat | 56.0 | 4.1 | Processed pork | 47.5 | 4.0 | Processed pork | 47.5 | 4.0 |
| 10 | Unprocessed pork | 100.0 | 3.2 | Unprocessed pork | 100.0 | 3.2 | Unprocessed pork | 100.0 | 3.3 | Unprocessed pork | 100.0 | 3.2 |
| 11 | Sandwiches | 124.3 | 3.1 | Sandwiches | 124.3 | 3.0 | Sandwiches | 124.3 | 3.0 | Sandwiches | 124.3 | 3.0 |
| 12 | Yellow cheese | 30.0 | 2.4 | Yellow cheese | 30.0 | 2.5 | Yellow cheese | 30.0 | 2.8 | Yellow cheese | 30.0 | 2.5 |
| 13 | Fresh pasta | 220.0 | 2.2 | Candies | 50.0 | 2.2 | Candies | 50.0 | 2.3 | Candies | 50.0 | 2.2 |
| 14 | Unprocessed fish | 120.0 | 2.2 | Unprocessed fish | 120.0 | 2.2 | Unprocessed fish | 120.0 | 2.1 | Unprocessed fish | 120.0 | 2.2 |
| 15 | Candies | 50.0 | 2.2 | Fried snacks | 60.0 | 2.1 | Fresh pasta | 220.0 | 2.1 | Fresh pasta | 220.0 | 2.1 |
| % total | 85.7 | 86.4 | 85.5 | 85.6 | ||||||||
| Rank | Leucine | Isoleucine | Valine | Total BCAA | ||||||||
|---|---|---|---|---|---|---|---|---|---|---|---|---|
| Food | Median (g) | % | Food | Median (g) | % | Food | Median (g) | % | Food | Median (g) | % | |
| 1 | Unprocessed red meat | 100.0 | 22.4 | Unprocessed red meat | 100.0 | 22.1 | Unprocessed red meat | 100.0 | 21.2 | Unprocessed red meat | 100.0 | 22.0 |
| 2 | Unprocessed poultry | 80.0 | 14.8 | Unprocessed poultry | 80.0 | 17.5 | Unprocessed poultry | 80.0 | 15.0 | Unprocessed poultry | 80.0 | 15.5 |
| 3 | Bread and toast | 50.0 | 6.3 | Beans | 50.0 | 5.9 | Rice | 124.0 | 7.0 | Rice | 124.0 | 6.3 |
| 4 | Beans | 43.0 | 6.3 | Bread and toast | 43.0 | 5.9 | Beans | 43.0 | 6.4 | Beans | 43.0 | 6.2 |
| 5 | Rice | 124.0 | 6.3 | Rice | 124.0 | 5.6 | Bread and toast | 50.0 | 6.0 | Bread and toast | 50.0 | 6.1 |
| 6 | Unprocessed fish | 162.5 | 5.0 | Unprocessed fish | 162.5 | 4.9 | Unprocessed fish | 162.5 | 4.9 | Unprocessed fish | 162.5 | 4.9 |
| 7 | Savoury baked | 100.0 | 4.7 | Savoury baked | 100.0 | 4.4 | Savoury baked | 100.0 | 4.5 | Savoury baked | 100.0 | 4.5 |
| 8 | Whole milk | 123.7 | 3.9 | Whole milk | 123.7 | 4.2 | Whole milk | 123.7 | 4.4 | Whole milk | 123.7 | 4.1 |
| 9 | Processed pork | 30.0 | 3.7 | Processed pork | 30.0 | 3.7 | Processed pork | 30.0 | 3.6 | Processed pork | 30.0 | 3.6 |
| 10 | Unprocessed pork | 90.0 | 2.6 | Unprocessed pork | 90.0 | 2.6 | Unprocessed pork | 90.0 | 2.7 | Unprocessed pork | 90.0 | 2.6 |
| 11 | Yellow cheese | 30.0 | 2.4 | Yellow cheese | 30.0 | 2.3 | Yellow cheese | 30.0 | 2.6 | Yellow cheese | 30.0 | 2.4 |
| 12 | Processed red meat | 52.0 | 2.2 | Processed red meat | 52.0 | 2.2 | Processed red meat | 52.0 | 2.1 | Processed red meat | 52.0 | 2.2 |
| 13 | Stuffed pasta | 190.0 | 2.2 | Stuffed pasta | 190.0 | 2.0 | Stuffed pasta | 190.0 | 2.1 | Stuffed pasta | 190.0 | 2.1 |
| 14 | Fresh pasta | 190.0 | 1.7 | Eggs | 190.0 | 1.6 | Candies | 50.0 | 1.6 | Fresh pasta | 190.0 | 1.6 |
| 15 | Sandwiches | 82.0 | 1.6 | Candies | 82.0 | 1.6 | Eggs | 50.0 | 1.6 | Candies | 50.0 | 1.6 |
| % total | 86.1 | 86.5 | 85.7 | 85.7 | ||||||||
| Rank | Leucine | Isoleucine | Valine | Total BCAA | ||||||||
|---|---|---|---|---|---|---|---|---|---|---|---|---|
| Food | Median (g) | % | Food | Median (g) | % | Food | Median (g) | % | Food | Median (g) | % | |
| 1 | Unprocessed red meat | 100.0 | 20.7 | Unprocessed red meat | 100.0 | 20.5 | Unprocessed red meat | 100.0 | 19.5 | Unprocessed red meat | 100.0 | 20.3 |
| 2 | Unprocessed poultry | 86.0 | 13.5 | Unprocessed poultry | 80.0 | 16.1 | Unprocessed poultry | 65.0 | 13.7 | Unprocessed poultry | 65.0 | 14.2 |
| 3 | Bread and toast | 20.0 | 7.4 | Beans | 43.0 | 6.9 | Rice | 116.2 | 7.6 | Bread and toast | 50.0 | 7.2 |
| 4 | Rice | 45.0 | 6.8 | Bread and toast | 50.0 | 6.6 | Bread and toast | 50.0 | 7.0 | Rice | 116.2 | 6.8 |
| 5 | Beans | 91.3 | 6.5 | Rice | 124.0 | 6.2 | Whole milk | 112.9 | 6.9 | Whole milk | 112.9 | 6.5 |
| 6 | Whole milk | 60.0 | 6.2 | Unprocessed fish | 162.5 | 6.1 | Beans | 43.0 | 6.5 | Beans | 43.0 | 6.4 |
| 7 | Processed red meat | 150.0 | 3.5 | Savoury baked | 100.0 | 3.4 | Processed pork | 30.0 | 3.3 | Processed red meat | 50.0 | 3.4 |
| 8 | Processed pork | 25.0 | 3.4 | whole milk | 123.7 | 3.4 | Processed red meat | 50.0 | 3.3 | Processed pork | 30.0 | 3.4 |
| 9 | Skimmed milk | 77.3 | 3.1 | Processed pork | 30.0 | 2.8 | Unprocessed pork | 75.0 | 2.9 | Skimmed milk | 133.3 | 2.9 |
| 10 | White cheese | 16.8 | 2.9 | Unprocessed pork | 90.0 | 2.7 | Skimmed milk | 133.3 | 2.8 | Unprocessed pork | 75.0 | 2.8 |
| 11 | Unprocessed pork | 15.0 | 2.8 | Yellow cheese | 30.0 | 2.6 | White cheese | 30.0 | 2.6 | White cheese | 30.0 | 2.7 |
| 12 | Yellow cheese | 10.8 | 2.2 | Processed red meat | 52.0 | 2.2 | Yellow cheese | 20.0 | 2.4 | Yellow cheese | 20.0 | 2.2 |
| 13 | Soups | 30.0 | 2.1 | Stuffed pasta | 190.0 | 2.1 | Soups | 325.0 | 2.1 | Soups | 325.0 | 2.2 |
| 14 | Savoury baked | 50.0 | 2.0 | Eggs | 50.0 | 2.0 | Unprocessed fish | 106.1 | 1.9 | Unprocessed fish | 106.1 | 2.0 |
| 15 | Unprocessed fish | 1.7 | 2.0 | Candies | 50.0 | 1.9 | Savoury baked | 90.1 | 1.9 | Savoury baked | 90.1 | 2.0 |
| % total | 85.1 | 85.5 | 84.4 | 85.0 | ||||||||
© 2017 by the authors. Licensee MDPI, Basel, Switzerland. This article is an open access article distributed under the terms and conditions of the Creative Commons Attribution (CC BY) license (http://creativecommons.org/licenses/by/4.0/).
Share and Cite
Pallottini, A.C.; Sales, C.H.; Vieira, D.A.d.S.; Marchioni, D.M.; Fisberg, R.M. Dietary BCAA Intake Is Associated with Demographic, Socioeconomic and Lifestyle Factors in Residents of São Paulo, Brazil. Nutrients 2017, 9, 449. https://doi.org/10.3390/nu9050449
Pallottini AC, Sales CH, Vieira DAdS, Marchioni DM, Fisberg RM. Dietary BCAA Intake Is Associated with Demographic, Socioeconomic and Lifestyle Factors in Residents of São Paulo, Brazil. Nutrients. 2017; 9(5):449. https://doi.org/10.3390/nu9050449
Chicago/Turabian StylePallottini, Ana Carolina, Cristiane Hermes Sales, Diva Aliete dos Santos Vieira, Dirce Maria Marchioni, and Regina Mara Fisberg. 2017. "Dietary BCAA Intake Is Associated with Demographic, Socioeconomic and Lifestyle Factors in Residents of São Paulo, Brazil" Nutrients 9, no. 5: 449. https://doi.org/10.3390/nu9050449
APA StylePallottini, A. C., Sales, C. H., Vieira, D. A. d. S., Marchioni, D. M., & Fisberg, R. M. (2017). Dietary BCAA Intake Is Associated with Demographic, Socioeconomic and Lifestyle Factors in Residents of São Paulo, Brazil. Nutrients, 9(5), 449. https://doi.org/10.3390/nu9050449