A Micronutrient Fortified Beverage Given at Different Dosing Frequencies Had Limited Impact on Anemia and Micronutrient Status in Filipino Schoolchildren

Abstract
:1. Introduction
2. Materials and Methods
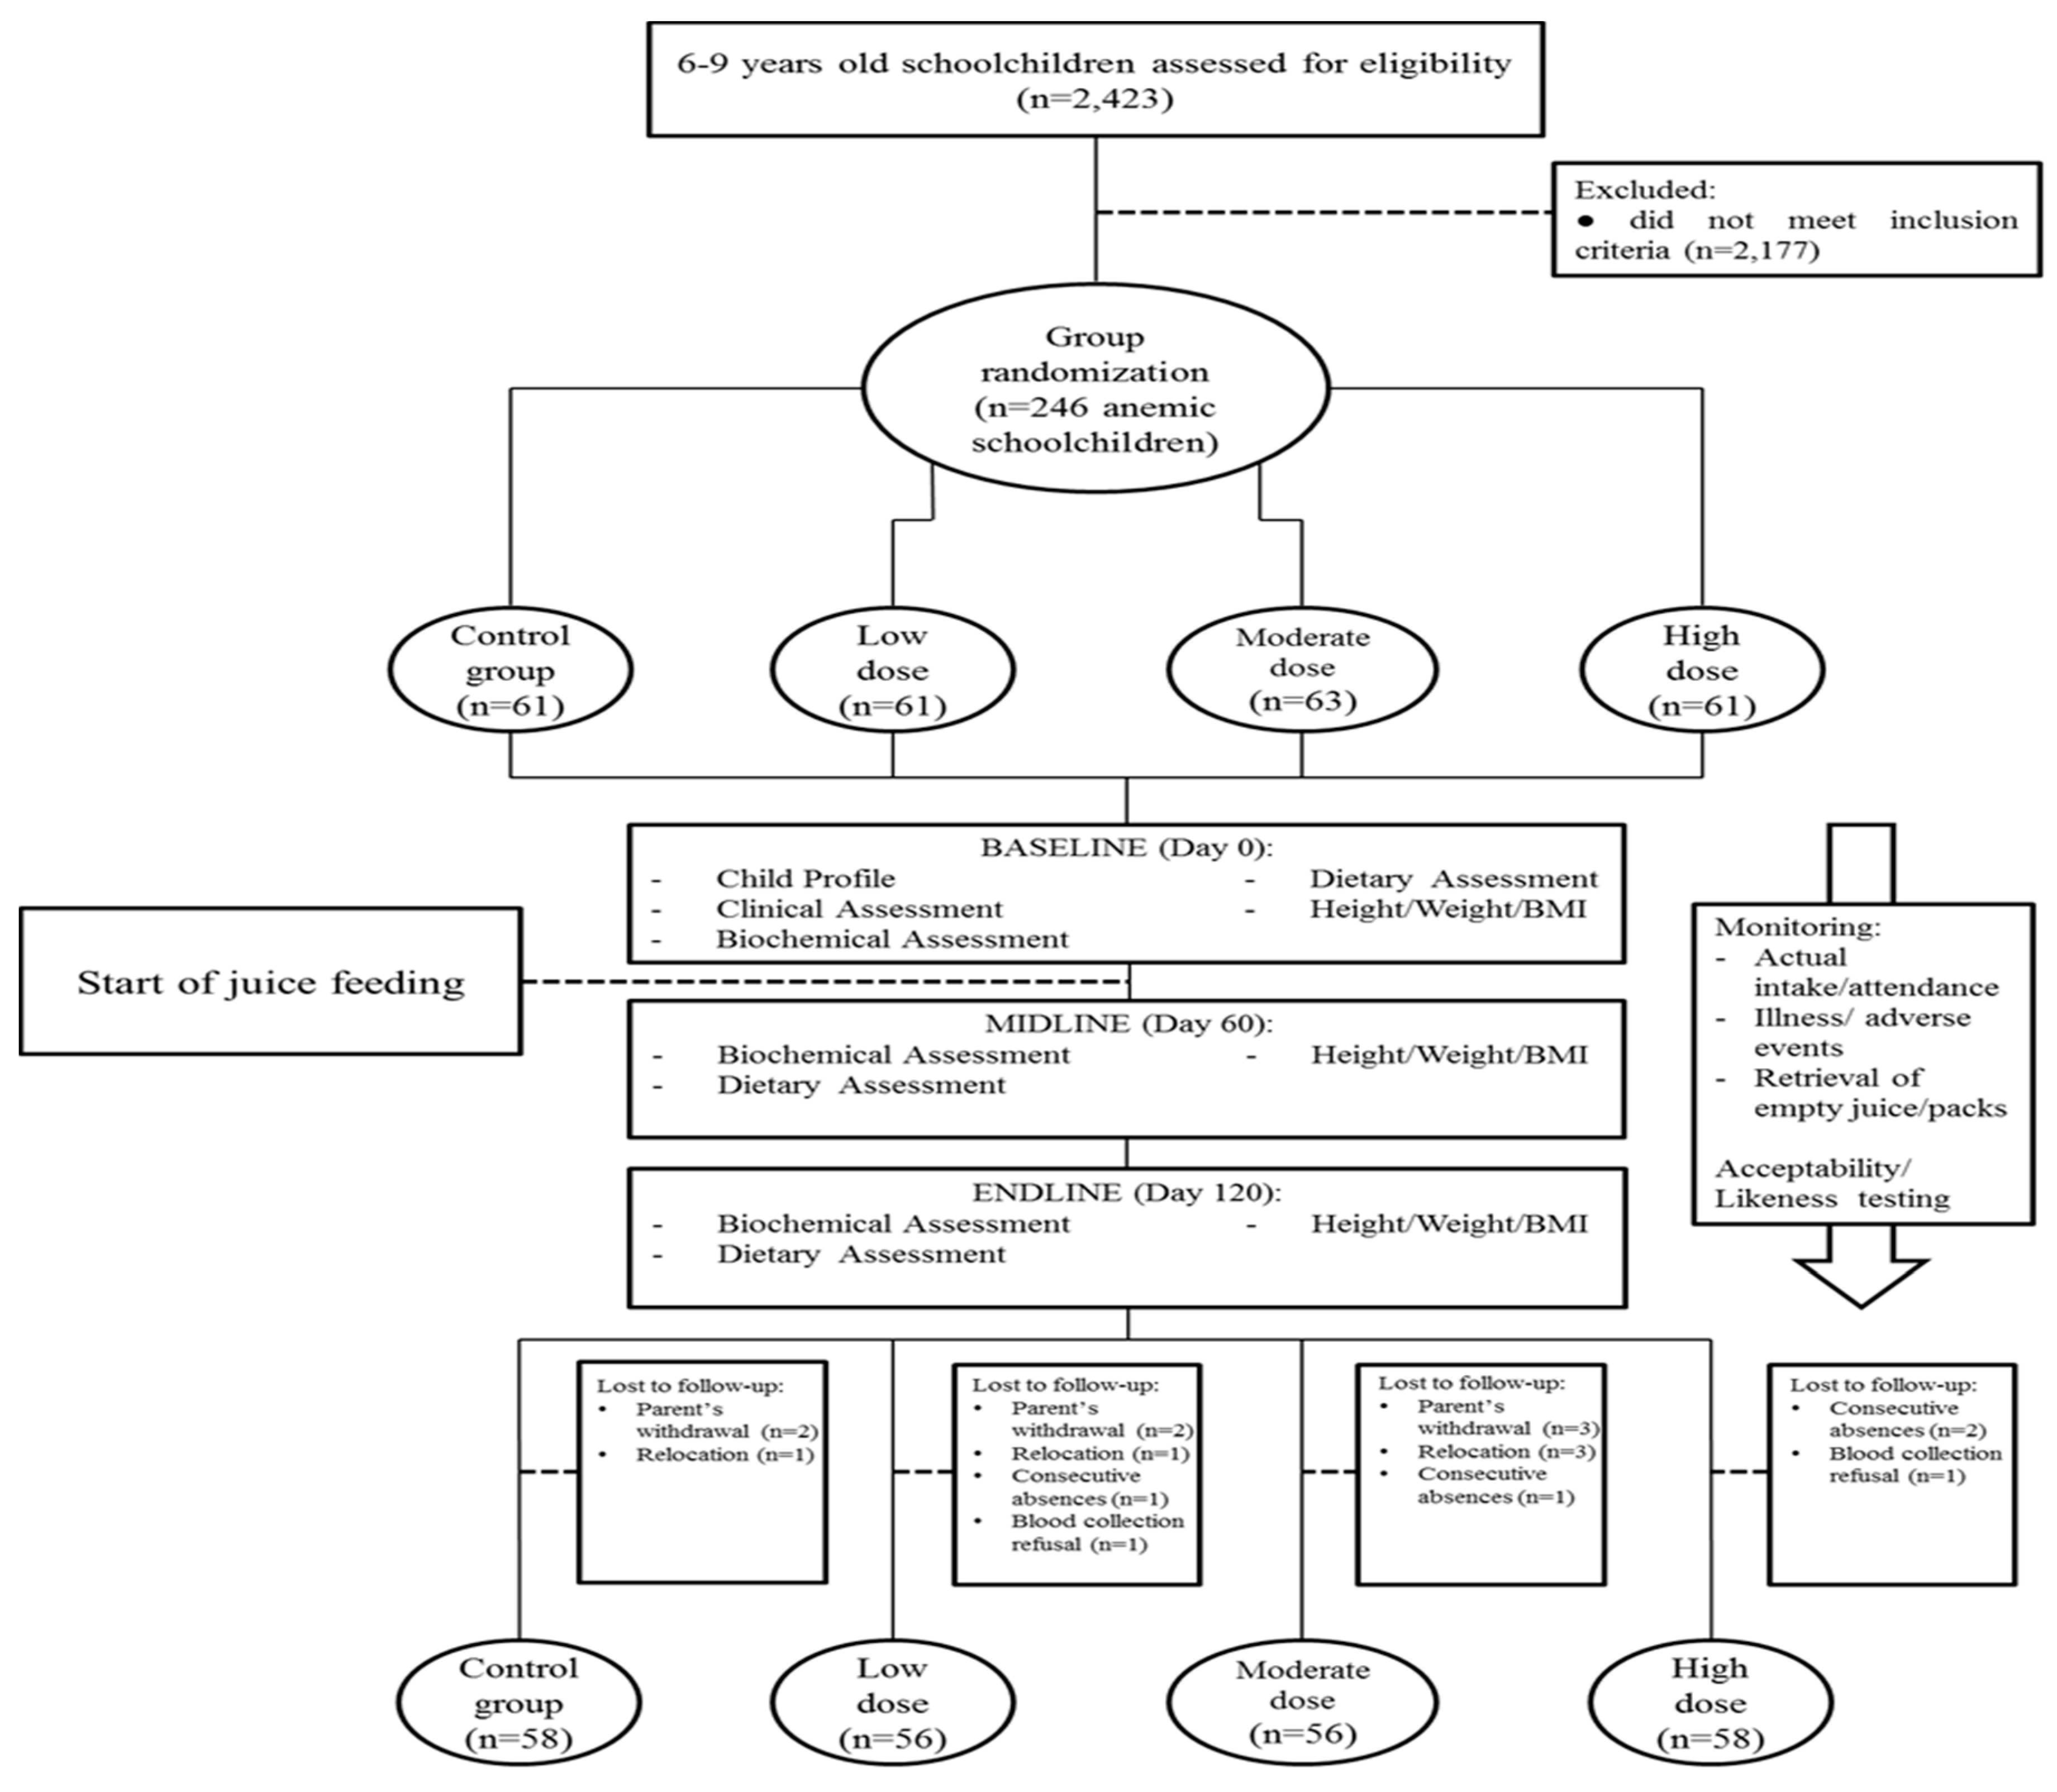
2.1. Study Design and Sampling Size
2.2. Monitoring of Intake
2.3. Measurements
2.4. Ethical Considerations
2.5. Statistical Analysis
3. Results
4. Discussion
4.1. Limitations of This Study
4.2. Further Work
5. Conclusions
Acknowledgments
Author Contributions
Conflicts of Interest
References
- Kassebaum, N.J.; Jasrasaria, R.; Naghavi, M.; Wulf, S.K.; Johns, N.; Lozano, R.; Regan, M.; Weatherall, D.; Chou, D.P.; Eisele, T.P.; et al. Systematic analysis of global anemia burden from 1990 to 2010. Blood 2014, 123, 615–624. [Google Scholar] [CrossRef] [PubMed]
- Wieser, S.; Plessow, R.; Eichler, K.; Malek, O.; Capanzana, M.V.; Agdeppa, I.A. Burden of micronutrient deficiencies by socio-economic strata in children aged 6 months to 5 years in the Philippines. BMC Public Health 2013, 13, 1167. [Google Scholar] [CrossRef] [PubMed]
- Forouzanfar, M.H.; Alexander, L.; Anderson, H.R.; Bachman, V.F.; Biryukov, S.; Brauer, M.; Burnett, R.; Casey, D.; Coates, M.M.; Cohen, A.; et al. Global, regional and national comparative risk assessment of 79 behavioural, environmental and occupational, and metabolic risks or clusters of risks in 188 countries, 1990–2013: A systematic analysis for the Global Burden of Disease Study 2013. Lancet 2015, 386, 2287–2323. [Google Scholar] [CrossRef]
- Department of Science and Technology—Food and Nutrition Research Institute (DOST–FNRI). The 7th National Nutrition Survey (2008) Results; Association of the Philippines: Taguig City, Philippines, 2008.
- World Health Organization (WHO). Global Nutrition Policy Review: What Does It Take to Scale up Nutrition Action? WHO: Geneva, Switzerland, 2013. [Google Scholar]
- Cardoso, M.A.; Penteado, M.V.C. Nutritional strategies for controlling iron deficiency anemia. Rep. Public Health 1994, 10, 231–240. [Google Scholar]
- Andrade, K.C. The fortification of foods with iron in the control of iron deficiency anemia. Braz. J. Health Sci. 2004, 2, 50–55. [Google Scholar]
- Singh, M.; Das, R.R. Zinc for the common cold. Cochrane Database Syst. Rev. 2013, 6, CD001364. [Google Scholar] [CrossRef]
- World Health Organization (WHO). Iron Deficiency Anemia: Assessment, Prevention and Control: A Guideline for Programme Managers; WHO Document Production Services: Geneva, Switzerland, 2001. [Google Scholar]
- Gibson, R.S. Principles of Nutritional Assessment, 2nd ed.; Oxford University Press: New York, NY, USA, 2005; pp. 155–260. [Google Scholar]
- Angeles-Agdeppa, I.; Magsadia, C.R.; Capanzana, M.V. Fortified juice drink improved iron and zinc status of schoolchildren. Asia Pac. J. Clin. Nutr. 2011, 20, 535–543. [Google Scholar] [PubMed]
- Dawson-Saunders, B.; Trapp, R.G. Basic and clinical biostatistics. In A Lange Medical Book, 2nd ed.; Prentice Hall International Incorporated: Norwalk, CT, USA, 1994. [Google Scholar]
- Norman, G.R.; Streiner, D.L. Biostatistics: The Bare Essentials; Farell, R., Ed.; Mosby: St. Louis, MO, USA, 1994. [Google Scholar]
- Department of Science and Technology—Food and Nutrition Research Institute (DOST-FNRI). Philippine Dietary Reference Intakes (PDRI) 2015 Ed.; DOST-FNRI: Taguig City, Philippines, 2015.
- De Keyzer, W.; Huybrechts, I.; de Vriendt, V.; Vandevijvere, S.; Slimani, N.; van Oyen, H.; de Henauw, S. Repeated 24-h recalls versus dietary records for estimating nutrient intakes in a national food consumption survey. Food Nutr. Res. 2011, 55, 7307. [Google Scholar] [CrossRef] [PubMed] [Green Version]
- Gunter, E.W.; Turner, W.E.; Neese, J.W.; Bayse, D.D. Laboratory Procedures Used by the Clinical Chemistry Division, Centers for Disease Control for the Second Health and Nutrition Examination Survey (HANES II) 1976–1980; Public Health Service, Centers for Disease Control: Atlanta, GA, USA, 1981.
- International Zinc Nutrition Consultative Group (WHO/UNICEF/IAEA/IZiNCG). Recommendations for indicators of population zinc status. Food Nutr. Bull. 2007, 28, S399–S400. [Google Scholar] [CrossRef]
- Vitamin C Status: Methods and Findings. Available online: http://onlinelibrary.wiley.com/doi/10.1111/j.1749-6632.1975.tb29302.x/full (accessed on 23 May 2017).
- National Osteoporosis Foundation. Clinician’s Guide the Prevention and Treatment of Osteoporosis 2008. Available online: http://osteoporosis.utorontoeit.com/PDFs/NOF_Clinicians_Guide.pdf (accessed on 23 May 2017).
- International Committee for Standardization in Haematology, Recommendations for Reference Method for Haemoglobinometry in Human Blood (ICSH Standard EP 6/2: 1977) and Specifications for International Haemiglobincyanide Reference Preparation (ICSH Standard EP 6/3: 1977). Available online: https://www.ncbi.nlm.nih.gov/pmc/articles/PMC1145204/pdf/jclinpath00438-0039.pdf (accessed on 17 November 2016).
- Erhardt, J.G.; Estes, J.E.; Pfeiffer, C.M.; Biesalski, H.K.; Craft, N.E. Combined measurement of ferritin, soluble transferrin receptor, retinol binding protein, and c-reactive protein by an inexpensive, sensitive, and simple sandwich enzyme-linked immunosorbent assay technique. J. Nutr. 2004, 134, 3127–3132. [Google Scholar] [PubMed]
- Engle-Stone, R.; Nankap, M.; Ndjebayi, A.O.; Erhardt, J.G.; Brown, K.H. Plasma ferritin and soluble transferrin receptor concentrations and body iron stores identify similar risk factors for iron deficiency but result in different estimates of the national prevalence of iron deficiency and iron-deficiency anemia among women and children in Cameroon. J. Nutr. 2013, 143, 369–377. [Google Scholar] [CrossRef] [PubMed]
- Thurnham, D.I.; McCabe, L.D.; Haldar, S.; Wieringa, F.T.; Northrop-Clewes, C.A.; McCabe, G.P. Adjusting plasma ferritin concentrations to remove the effects of subclinical inflammation in the assessment of iron deficiency: A meta-analysis. Am. Soc. Nutr. 2010, 92, 546–555. [Google Scholar] [CrossRef] [PubMed]
- World Health Organization (WHO). C-Reactive Protein Concentrations as a Marker of Inflammation or Infection for Interpreting Biomarkers of Micronutrient Status; WHO Document Production Services: Geneva, Switzerland, 2014. [Google Scholar]
- Council for International Organizations of Medical Sciences (CIOMS). International Ethical Guidelines for Biochemical Research Involving Human Subjects; WHO: Geneva, Switzerland; 2002. [Google Scholar]
- Philippine Council for Health Research and Development—Department of Science and Technology (PCHRD-DOST). National Ethical Guidelines for Research; PCHRD–DOST: Taguig City, Philippines, 1996.
- Barbosa, T.N.; Taddei, J.A.; Palma, D.; Ancona-Lopez, F.; Braga, J.A. Double-blind randomized controlled trial of rolls fortified with microencapsulated iron. Rev. Assoc. Med. Bras. 2012, 58, 118–124. [Google Scholar] [CrossRef]
- Osei, A.K.; Rosenberg, I.H.; Hauser, R.F.; Bulusu, S.; Mathews, M.; Hamer, D.H. Community-level micronutrient fortification of school lunch meals improved vitamin A, folate, and iron status of schoolchildren in Himalayan villages of India. J. Nutr. 2010, 140, 1146–1154. [Google Scholar] [CrossRef] [PubMed]
- Semba, R.D.; de Pee, S.; Ricks, M.O.; Sari, M.; Bloem, M.W. Diarrhea and fever as risk factors for anemia among children under age five living in urban slum areas of Indonesia. Int. J. Infect. Dis. 2008, 12, 62–70. [Google Scholar] [CrossRef] [PubMed]
- Le, H.T.; Brouwer, I.D.; Nguyen, K.C.; Burema, J.; Kok, F.J. The effect of iron fortification and de-worming on anaemia and iron status of Vietnamese schoolchildren. Br. J. Nutr. 2007, 97, 955–962. [Google Scholar] [CrossRef] [PubMed]
- Cook, J.D.; Flowers, C.H.; Skikne, B.S. The quantitative assessment of body iron. Blood 2003, 101, 3359–3363. [Google Scholar] [CrossRef] [PubMed]
- Avalos Mishaan, A.M.; Zavaleta, N.; Griffin, I.J.; Hilmers, D.C.; Hawthorne, K.M.; Abrams, S.A. Bioavailability of iron and zinc from a multiple micronutrient-fortified beverage. J. Pediatr. 2004, 145, 26–31. [Google Scholar] [CrossRef] [PubMed]
- Sandtröm, B. Micronutrient interaction: Effects of absorption and bioavailability. Br. J. Nutr. 2001, 28, S181–S185. [Google Scholar] [CrossRef]
- Lönnerdal, B. Calcium and iron absorption: Mechanisms and public health relevance. Int. J. Vitam. Nutr. Res. 2010, 80, 293–299. [Google Scholar] [CrossRef] [PubMed]
- Yadrick, M.K.; Kenney, M.A.; Winterfeldt, E.A. Iron, copper, and zinc status: Response to supplementation with zinc or zinc and iron in adult females. Am. J. Clin. Nutr. 1989, 49, 145–150. [Google Scholar] [PubMed]
- Moretti, D.; Goede, J.S.; Zeder, C.; Jiskra, M.; Chatzinakou, V.; Tjalsma, H.; Melse-Boonstra, A.; Brittenham, G.; Swinkels, D.W.; Zimmermann, M.B. Oral iron supplements increase hepcidin and decrease iron absorption from daily or twice-daily doses in iron depleted young women. Blood 2015. [Google Scholar] [CrossRef] [PubMed]
- Capanzana, M.V.; Mirasol, A.; Smith, G.; Angeles-Agdeppa, I.; Perlas, L.; de los Reyes, F.; Amarra, M.S. Thalassemia and other hemoglobinopathies among anemic individuals in Metro Manila, Philippines and their intake of iron supplements. APJCN 2017, in press. [Google Scholar]


| Nutrients | Unfortified | Fortified | ||
|---|---|---|---|---|
| Amount/200 mL Serving | % RENI b for 6–9 Years | Amount/200 mL Serving | %RENI b for 6–9 Years | |
| Energy (kcal) | 63.43 | 3.96 | 60.34 | 3.77 |
| Carbohydrates (g) | 15.74 | 99.23 | 15.04 | 99.70 |
| Vitamins | ||||
| Beta Carotene (µg RE) | 23.78 | 5.94 | 97.00 | 24.25 |
| Thiamin (mg) | 0.01 | 1.43 | 0.41 | 58.57 |
| Riboflavin (mg) | 0.00 | 0.29 | 0.34 | 48.57 |
| Niacin (mg) | 0.03 | 0.29 | 6.90 | 76.67 |
| Vitamin B6 (mg) | 0.00 | 0.00 | 0.86 | 114.23 |
| Dietary Folate (µg) | 0.00 | 0.00 | 165.00 | 55.00 |
| Vitamin C (mg) | 3.13 | 34.73 | 94.90 | 210.89 |
| Vitamin D (IU) | 0.00 | 0.00 | 145.90 | 72.95 |
| Vitamin E (IU) | 0.00 | 0.00 | 4.20 | 31.82 |
| Minerals | ||||
| Calcium (mg) | 0.00 | 0.00 | 154.00 | 22.00 |
| Iron (mg) | 0.02 | 0.16 | 5.43 | 54.30 |
| Zinc (mg) | 0.00 | 0.00 | 5.60 | 109.80 |
| Phosphorus (mg) | 4.03 | 0.81 | 64.40 | 12.88 |
| Magnesium (mg) | 0.79 | 0.88 | 0.79 | 0.88 |
| Potassium (mg) | 33.10 | 2.07 | 33.00 | 2.06 |
| Characteristics | Control | Low Dose (LD) | Moderate Dose (MD) | High Dose (HD) | Total | p-Value 1 |
|---|---|---|---|---|---|---|
| (n = 58) | (n = 56) | (n = 56) | (n = 58) | (n = 228) | ||
| n (%) | n (%) | n (%) | n (%) | n (%) | ||
| Age of study child, mean (SE) | 7.3 (0.1) | 7.2 (0.1) | 7.4 (0.1) | 7.3 (0.1) | 7.3 (0.0) | 0.90 |
| Age Group | 0.60 | |||||
| 6 | 24 (41.4) | 25 (44.6) | 26 (46.4) | 23 (39.7) | 98 (43.0) | |
| 7 | 20 (34.5) | 16 (28.6) | 16 (28.6) | 23 (39.7) | 75 (32.9) | |
| 8–9 | 14 (24.1) | 15 (26.8) | 14 (25.0) | 12 (20.7) | 55 (24.1) | |
| Sex | 0.60 | |||||
| Male | 29 (50.0) | 24 (42.9) | 23 (41.1) | 30 (51.7) | 106 (46.5) | |
| Female | 29 (50.0) | 32 (57.1) | 33 (58.9) | 28 (48.3) | 122 (53.5) | |
| Age of Respondent, mean (SE) | 36.6 (1.3) | 34.5 (1.4) | 37.5 (1.1) | 35.6 (1.1) | 36.0 (0.6) | 0.25 |
| Family Type | 0.92 | |||||
| Nuclear | 39 (67.2) | 38 (67.9) | 40 (71.4) | 38 (65.5) | 155 (68.0) | |
| Extended | 19 (32.8) | 18 (32.1) | 16 (28.6) | 20 (34.5) | 73 (32.0) | |
| Household Size, mean (SE) | 6.3 (0.3) | 6.5 (0.4) | 5.9 (0.3) | 6.4 (0.2) | 6.3 (0.2) | 0.55 |
| Main Occupation of Father | 0.15 | |||||
| Production-related | 17 (29.3) | 10 (17.9) | 5 (8.9) | 7 (12.1) | 39 (17.1) | |
| Service-related | 26 (44.8) | 20 (35.7) | 25 (44.6) | 24 (41.4) | 95 (41.7) | |
| Transportation-related | 6 (10.3) | 9 (16.1) | 11 (19.6) | 11 (19) | 37 (16.2) | |
| Clerical, business, technical-related | 9 (15.5) | 17 (30.4) | 15 (26.8) | 16 (27.5) | 57 (25.1) | |
| Number of Earning Family Members | 0.02 * | |||||
| 1 Member | 24 (41.4) | 29 (51.8) | 31 (55.4) | 34 (58.6) | 118 (51.8) | |
| 2 Members | 31 (53.4) | 21 (37.5) | 24 (42.9) | 14 (24.1) | 90 (39.5) | |
| 3 or More Members | 3 (5.1) | 6 (10.7) | 1 (1.8) | 10 (17.1) | 20 (8.8) | |
| Estimated Total Monthly Family Income in Philippine Peso, mean (SE) | 12,503.62 (1,088.12) | 13,164.79 (1,020.72) | 15,146.43 (1,271.31) | 14,944.62 (1,152.04) | 13,936.08 (569.42) | 0.27 |
| Average Daily Food Expenditure in Philippine Peso, mean (SE) | 242.86 (13.56) | 276.64 (21.10) | 235.54 (14.17) | 269.66 (14.30) | 256.18 (8.04) | 0.20 |
| Status of residential lot | 0.02 * | |||||
| Owned | 26 (44.8) | 21 (37.5) | 18 (32.1) | 14 (24.1) | 79 (34.6) | |
| Renting | 19 (32.8) | 12 (21.4) | 9 (16.1) | 20 (34.5) | 60 (26.3) | |
| Living with Relatives (Free) | 12 (20.7) | 17 (30.4) | 17 (30.4) | 14 (24.1) | 60 (26.3) | |
| Biomarkers | Control (n = 58) | Low Dose (n = 56) | Moderate Dose (n = 56) | High Dose (n = 58) | p-Value 1 |
|---|---|---|---|---|---|
| Mean (SE) | Mean (SE) | Mean (SE) | Mean (SE) | ||
| Hemoglobin (g/dL) | |||||
| Baseline | 10.8 (0.1) | 11.1 (0.1) | 11.1 (0.0) | 11.0 (0.1) | 0.01 * |
| Endpoint | 11.7 (0.1) | 11.9 (0.1) | 11.9 (0.1) | 12.0 (0.1) | 0.50 |
| Difference | 0.9 (0.1) | 0.9 (0.1) | 0.8 (0.1) | 1.0 (0.1) | 0.47 |
| No. (%) Anemia | |||||
| Baseline | 58 (100) | 56 (100) | 56 (100) | 58 (100) | 1.00 |
| Endpoint | 21 (36.2) | 17 (30.4) | 13 (23.2) | 15 (25.9) | 0.44 |
| Difference | 37 (63.8) | 39 (69.6) | 43 (76.8) | 43 (74.1) | |
| Serum ferritin(μg/L) | |||||
| Undajusted for inflammation Baseline | 66.4 (5.1) | 68.7 (4.4) | 73.5 (5.6) | 68.4 (3.8) | 0.75 |
| Endpoint | 65.5 (4.3) | 72.0 (4.3) | 74.2 (4.8) | 71.4 (3.3) | 0.50 |
| Difference | 0.9 (4.5) | 3.2 (3.5) | 0.7 (4.6) | 2.9 (3.8) | 0.88 |
| Adjusted for inflammation a | |||||
| Baseline | 59.0 (4.1) | 64.5 (3.9) | 66.4 (4.6) | 64.4 (3.5) | 0.61 |
| Endpoint | 62.3 (4.2) | 66.7 (3.8) | 70.9 (4.5) | 66.6 (2.6) | 0.48 |
| Difference | 3.2 (3.52 | 2.2 (3.0) | 4.5 (3.2) | 2.2 (3.2) | 0.95 |
| No. (%) Iron deficiency using adjusted ferritin values | |||||
| Baseline | 9 (15.2) | 3 (5.4) | 4 (7.1) | 1 (1.7) | 0.60 |
| Endpoint | 5 (8.6) | 3 (5.4) | 4 (7.1) | 3 (5.1) | 0.48 |
| Difference | 4 (6.6) | 0 (0.0) | 0 (0.0) | 2 (3.4) | |
| Serum transferrin receptors (mg/L) | |||||
| Baseline | 7.2 (0.3) | 6.8 (0.2) | 6.7 (0.2) | 6.9 (0.26) | 0.54 |
| Endpoint | 7.2 (0.3 | 7.0 (0.3) | 6.9 (0.2) | 7.0 (0.31) | 0.83 |
| Difference | 0.0 (0.2) | 0.2 (0.2) | 0.2(0.1) | 0.1 (0.1) | |
| Low serum transferrin receptor (n and %) | |||||
| Baseline | 10 (17.2) | 6 (10.7) | 5 (8.9) | 8 (13.8) | 0.56 |
| Endpoint | 9 (15.5) | 10 (17.9) | 7 (12.5) | 8 (13.8) | 0.87 |
| Difference | 1 (1.7) | 4 (7.1) | 2 (3.6) | 0 (0.0) | |
| Body iron stores (mg/kg/body weight) | |||||
| Baseline | 6.0 (0.34) | 6.6 (0.26) | 6.7 (0.29) | 6.59 (0.24) | 0.338 |
| Endpoint | 6.0 (0.35) | 6.7 (0.26) | 6.8 (0.24) | 6.8 (0.2) | 0.128 |
| Difference | 0.0 (0.2) | 0.06 (0.18) | 0.09 (0.24) | 0.21 (0.19) | |
| Biochemical | Control | Low Dose | Moderate Dose | High Dose | p-Value 1 |
|---|---|---|---|---|---|
| (n = 58) | (n = 56) | (n = 56) | (n = 58) | ||
| Mean (SE) | Mean (SE) | Mean (SE) | Mean (SE) | ||
| RBP-(µmol/L) a | |||||
| Baseline | 0.94 (0.03) | 1 (0.03) | 1.03 (0.04) | 1.00 (0.03) | 0.16 |
| Endpoint | 1.05 (0.03) | 1.11 (0.04) | 1.11 (0.03) | 1.11 (0.03) | 0.48 |
| Difference | 0.12 (0.03) | 0.11 (0.04) | 0.07 (0.03) | 0.10 (0.03) | |
| Zinc-(µg/dL) b | |||||
| Baseline | 64 (3) | 63 (3) | 64 (3) | 64 (2) | 0.98 |
| Endpoint | 68 (2) | 66 (2) | 73 (3) | 67 (3) | 0.24 |
| Difference | 4 (3) | 3 (3) | 9 (4) | 3 (3) | |
| Vitamin C-(μg/dL) c | |||||
| Baseline | 0.22 (0.01) | 0.23 (0.02) | 0.24 (0.02) | 0.22 (0.02) | 0.74 |
| Endpoint | 0.24 (0.02) | 0.28 (0.02) | 0.36 (0.03) | 0.30 (0.02) | 0.01 * |
| Difference | 0.02 (0.02) | 0.05 (0.02) | 0.11 (0.02) | 0.08 (0.02) | |
| p-value 2 | 0.23 | 0.01 | 0.00 | 0.00 | |
| Vitamin D-(nmol/L) d | |||||
| Baseline | 60 (2) | 64 (2) | 64 (3) | 69 (3) | 0.44 |
| Endpoint | 65 (2) | 68 (2) | 69 (2) | 73 (2) | 0.11 |
| Difference | 5 (1) | 3 (2) | 5 (2) | 7 (1) | |
| Nutrients | Control | % | Low Dose | % | Moderate Dose | % | High Dose | % |
|---|---|---|---|---|---|---|---|---|
| (n = 58) | (n = 56) | (n = 56) | (n = 58) | |||||
| Mean ± SE | Mean ± SE | Mean ± SE | Mean ± SE | |||||
| Vitamin A (µg RE) | ||||||||
| Baseline | 499.8 ± 131.1 | 51.7 | 470.5 ± 93.6 | 64.3 | 734.7 ± 338.3 | 58.9 | 404.1 ± 43.4 | 69 |
| Endpoint | 484.6 ± 86.7 | 62.1 | 370.7 ± 27.0 | 62.5 | 384.3 ± 33.6 | 55.4 | 360.1 ± 26.0 | 67.2 |
| Difference 1 | −15.2 ± 158.8 | 10.3 | −99.8 ± 99.7 | −1.8 | −350.4 ± 344.5 | −3.6 | −44.0 ± 47.8 | −1.7 |
| Percent Contribution of juice drink | 1.6 | 2.1 | 2.0 | 2.2 | ||||
| Vitamin C (mg) | ||||||||
| Baseline | 14.8 ± 2.4 | 22.4 | 26.2 ± 6.5 | 32.1 | 26.1 ± 6.7 | 30.4 | 49.5 ± 30.3 | 36.2 |
| Endpoint | 17.1 ± 2.8 | 25.9 | 40.7 ± 3.6 | 80.4 | 58.5 ± 6.7 | 100 | 60.9 ± 2.3 | 100 |
| Difference 1 | 2.4 ± 3.3 | 3.4 | 14.5 ± 7.6 | 48.2 * | 32.4 ± 9.4 * | 69.6 * | 11.4 ± 30.6 | 63.8 * |
| Percent Contribution of juice drink | 16.8 | 68.6 | 74.0 | 87.6 | ||||
| Thiamin (mg) | ||||||||
| Baseline | 0.7 ± 0.1 | 48.3 | 0.9 ± 0.1 | 62.5 | 0.8 ± 0.07 | 60.7 | 0.9 ± 0.1 | 74.1 |
| Endpoint | 0.8 ± 0.1 | 55.2 | 0.8 ± 0.1 | 66.1 | 1.0 ± 0.1 | 76.8 | 1.1 ± 0.1 | 82.8 |
| Difference 1 | 0.1 ± 0.1 | 6.9 | 0.1 ± 0.1 | 3.6 | 0.2 ± 0.1 * | 16.1 * | 0.2 ± 0.1 | 8.6 |
| Percent Contribution of juice drink | 1.3 | 20.0 | 25.7 | 32.8 | ||||
| Riboflavin (mg) | ||||||||
| Baseline | 0.6 ± 0.1 | 39.7 | 0.8 ± 0.07 | 57.1 | 0.8 ± 0.1 | 58.9 | 0.8 ± 0.1 | 63.8 |
| Endpoint | 0.7 ± 0.1 | 55.2 | 0.7 ± 0.04 | 69.6 | 0.9 ± 0.1 | 78.6 | 0.8 ± 0.0 | 81 |
| Difference 1 | 0.1 ± 0.1 | 15.5 * | −0.0 ± 0.1 | 12.5 | 0.0 ± 0.1 | 19.6 * | 0.0 ± 0.1 | 17.2 * |
| Percent Contribution of juice drink | 0.0 | 18.5 | 24.6 | 33.3 | ||||
| Niacin (mg) | ||||||||
| Baseline* | 10.2 ± 0.6 | 70.7 | 12.5 ± 1.18 | 73.2 | 12.0 ± 1.2 | 76.8 | 14.6 ± 1.2 | 87.9 |
| Endpoint* | 11.2 ± 0.8 | 69 | 13.0 ± 0.64 | 94.6 | 13.7 ± 0.2 | 96.4 | 16.0 ± 0.8 | 98.3 |
| Difference | 1.0 ± 1.0 | −1.7 | 0.5 ± 1.38 | 21.4 * | 1.7 ± 1.3 | 19.6 * | 1.4 ± 1.3 | 10.3 * |
| Percent Contribution of juice drink | 0.2 | 20.8 | 30.9 | 35.9 | ||||
| Calcium (mg) | ||||||||
| Baseline | 284.3 ± 27.4 | 13.8 | 314.4 ± 23.3 | 19.6 | 373.6 ± 35.2 | 35.7 | 332.3 ± 24.8 | 19 |
| Endpoint | 295.3 ± 26.8 | 15.5 | 342.1 ± 22.3 | 19.6 | 387.8 ± 33.2 | 30.4 | 359.1 ± 18.1 | 25.9 |
| Difference 1 | 11.0 ± 27.4 | 1.7 | 27.6 ± 26.2 | 0 | 14.3 ± 36.8 | −5.4 | 26.7 ± 28.3 | 6.9 |
| Percent Contribution of juice drink | 0.0 | 17.6 | 24.8 | 35.3 | ||||
| Iron (mg) | ||||||||
| Baseline | 7.0 ± 0.4 | 29.3 | 7.7 ± 0.57 | 39.3 | 8.4 ± 0.9 | 35.7 | 7.8 ± 0.5 | 36.2 |
| Endpoint | 7.6 ± 0.6 | 29.3 | 9.0 ± 0.49 | 53.6 | 9.1 ± 0.5 | 48.2 | 10.1 ± 0.5 | 62.1 |
| Difference 1 | 0.6 ± 0.8 | 0 | 1.2 ± 0.8 | 14.3 | 0.6 ± 1.1 | 12.5 | 2.4 ± 0.7 * | 25.9 * |
| Percent Contribution of juice drink | 0.3 | 23.1 | 35.4 | 42.3 |
© 2017 by the authors. Licensee MDPI, Basel, Switzerland. This article is an open access article distributed under the terms and conditions of the Creative Commons Attribution (CC BY) license (http://creativecommons.org/licenses/by/4.0/).
Share and Cite
Angeles-Agdeppa, I.; Magsadia, C.R.; Aaron, G.J.; Lloyd, B.B.; Hilmers, D.C.; Bhutta, Z.A. A Micronutrient Fortified Beverage Given at Different Dosing Frequencies Had Limited Impact on Anemia and Micronutrient Status in Filipino Schoolchildren. Nutrients 2017, 9, 1002. https://doi.org/10.3390/nu9091002
Angeles-Agdeppa I, Magsadia CR, Aaron GJ, Lloyd BB, Hilmers DC, Bhutta ZA. A Micronutrient Fortified Beverage Given at Different Dosing Frequencies Had Limited Impact on Anemia and Micronutrient Status in Filipino Schoolchildren. Nutrients. 2017; 9(9):1002. https://doi.org/10.3390/nu9091002
Chicago/Turabian StyleAngeles-Agdeppa, Imelda, Clarita R. Magsadia, Grant J. Aaron, Beate B. Lloyd, David C. Hilmers, and Zulfiqar A. Bhutta. 2017. "A Micronutrient Fortified Beverage Given at Different Dosing Frequencies Had Limited Impact on Anemia and Micronutrient Status in Filipino Schoolchildren" Nutrients 9, no. 9: 1002. https://doi.org/10.3390/nu9091002