Article

A Theoretical Study of the Adsorption Process of B-aflatoxins Using Pyracantha koidzumii (Hayata) Rehder Biomasses

by
Abraham Méndez-Albores
1,
René Escobedo-González
2,
Juan Manuel Aceves-Hernández
3,
Perla García-Casillas
4,
María Inés Nicolás-Vázquez
3,* and
René Miranda-Ruvalcaba
3
1
UNAM–FESC, Campus 4, Multidisciplinary Research Unit L14 (Food, Mycotoxins and Mycotoxicosis), Cuautitlan Izcalli 54714, Mexico
2
Department of industrial maintenance and nanotechnology, Technological University of Juarez City, Ciudad Juarez, Chihuahua 32695, Mexico
3
UNAM–FESC, Campus 1, Chemical Sciences Department, Cuautitlan Izcalli C. P. 54740, Mexico
4
Institute of Engineering and Technology, Autonomous University of the City of Juarez, UACJ, City Juarez, Chihuahua 32584, Mexico
*
Author to whom correspondence should be addressed.
Toxins 2020, 12(5), 283; https://doi.org/10.3390/toxins12050283
Submission received: 13 March 2020 / Revised: 11 April 2020 / Accepted: 24 April 2020 / Published: 28 April 2020
(This article belongs to the Special Issue Novel Strategy to Prevent Post-Harvest Mycotoxin Contamination)

Abstract

:
Employing theoretical calculations with density functional theory (DFT) using the B3LYP/6-311++G(d,p) functional and basis set, the interaction of the aflatoxin B1 (AFB1) molecule and the functional groups present in the Pyracantha koidzumii biosorbent was investigated. Dissociation free energy and acidity equilibrium constant values were obtained theoretically both in solution (water) and gas phases. Additionally, the molecular electrostatic potential for the protonated molecules was calculated to verify the reactivity. Thus, methanol (hydroxyl group), methylammonium ion (amino group), acetate ion (carboxyl group), and acetone (carbonyl group), were used as representatives of the substrates present in the biomass; these references were considered using the corresponding protonated or unprotonated forms at a pH value of 5. The experimental infrared spectrophotometric data suggested the participation of these functional groups in the AFB1 biosorption process, indicating that the mechanism was dominated by electrostatic interactions between the charged functional groups and the positively charged AFB1 molecule. The theoretical determination indicated that the carboxylate ion provided the highest interaction energy with the AFB1 molecule. Consequently, an enriched biosorbent with compounds containing carboxyl groups could improve the yield of the AFB1 adsorption when using in vitro and in vivo trials.
Key Contribution: Employing a theoretical study at the Density Functional Theory level, the interaction process between chemical groups of the biosorbent and the protonated AFB1 was explained.

Graphical Abstract

1. Introduction

Aflatoxins (AFs) are biologically active secondary metabolites from certain fungal strains of Aspergillus flavus Link, A. parasiticus Speare and A. nomius Kurtzman et al. [1,2], being potentially fatal to humans and animals [3,4]. Aflatoxin B1 (AFB1), the most toxic structure of the four naturally occurring aflatoxins, is a direct-acting mutagen, being shown to disrupt genes involved in carcinogenesis and tumor suppression [5]. AFB1 also reacts in vivo with DNA to yield 2,3-dihydro-2-(N7-guanyl)-3-hydroxy AFB1 [6]. Reducing the consumption of aflatoxin-contaminated foods significantly minimizes the risk of an acute or chronic aflatoxicosis in humans; however, in developing countries such as Mexico, this scheme is not easy to achieve, due to the fact that the Mexican population has one of the highest world per capita consumption of maize, frequently contaminated with aflatoxins, both in the field as well as in storage [7].
Since the well-studied problem of aflatoxicosis in the early 1960s, researchers all over the globe have been searching for techniques to eliminate or to reduce the effects of these unavoidable food contaminants. However, due to the extensive variety of mycotoxins and their different chemical structures, protection against mycotoxicosis is a challenge task. Various methods have been investigated in connection with their effectiveness to control AF, with the objectives to either inactivate, to degrade, or to remove the mycotoxin, and they can be classified into physical, chemical, and biological [8,9,10,11,12,13]. Physical methods, such as binding adsorbents are by far the most practical and widely studied strategy for reducing the toxic effects of mycotoxin exposure. Recently, our research group proposed the use of a novel, natural, abundant, inexpensive, and effective AF binder based on Pyracantha koidzumii biosorbents [4]. Using an in vitro biosorption methodology, leaves and the mixture of leaves/berries presented the highest aflatoxin uptakes; 86% and 82%, respectively. Fourier transform infrared spectrophotometric studies suggested the participation of hydroxyl, carboxyl, and carbonyl groups in the biosorption process. Therefore, an adsorption model was proposed mainly by the electrostatic interactions between the negatively charged functional groups and the positively charged AF molecules.
Recently, computational theoretical chemistry methods have been used in property predictions, drug designs, and the study of molecular interactions in a wide variety of compounds [14,15,16,17]. In this context, a feasible strategy is the use of quantum chemical calculations to accurately explain the aflatoxin-biosorbent interactions and the main functional groups responsible in the biosorption process. Consequently, the objective of this work is to inform about the interactions of the AFB1 molecule with the different functional groups present in the P. koidzumii biosorbents in order to propose an enriched biosorbent to improve the yield of aflatoxin adsorption when using both in vitro an in vivo trials.

2. Results and Discussion

2.1. Study of the Protonation of Aflatoxin B1 (AFB1)

Recently, as a physical decontamination strategy, our research group reported the biosorption of the AFB1 molecule in an acidic medium by means of Pyracantha koidzumii biomasses (leaves, berries, and the mixture of leaves and berries in a 7:3 ratio) [4]. The biosorption model was proposed to be dominated by electrostatic interactions between the positively charged AFB1 molecules and the hydroxyl, ammonium, carboxylate and ketone-carbonyl groups of the biosorbent molecules.
In this research, a theoretical approach of the AFB1 biosorption is presented. Interaction between the AFB1 molecule and the functional groups of the biomass and identification of the main molecular groups involved in the biosorption process is studied. Since the experimental adsorption process was carried out in acidic conditions, the first step of this research was to analyze the AFB1 basic centers and their possible protonation structures (Figure 1).
In this regard, others authors have reported the protonation of the AFB1 molecule on the oxygen atom of the carbonylic groups (O12, O14), furan ring (O7), methoxyl group (O13) and the lactone ring (O10) [9,12,18], which is consistent with our findings. Additionally, a chemical structure with a hydrogen atom among the two carbonyl groups was considered (Figure 1A3,7). Moreover, two conformers were considered for the O12 and O13 protonated forms, one with intramolecular hydrogen bonding (O12∙∙∙H+∙∙∙O13) and two with the hydrogen attached only to one carbonyl group, O12∙∙∙H+ and H+∙∙∙O13. The chemical structures were optimized and evaluated by the acidity equilibrium constant both in gas and solution phases, in order to obtain their thermodynamic parameters. Isomeric structures were optimized at level of the Density Functional Theory (DFT), using calculations defined by the Becke’s three-parameter hybrid functional (B3LYP), employing the 6-311++G(d,p) basis set to obtain their molecular geometry and energy parameters after considering the solvent effect. The molecular geometry and some geometrical parameters for the structures are shown in Figure 2. Both the furan and lactone rings are not stabilized by the protonation process, yielding the opening of the corresponding ring, as previously reported, using basic and acidic conditions [10,11,13].
The structures A3–A7 exhibited the bond between the hydrogen atom and the oxygen atoms of the carbonyl groups with a length in the range of 0.971 to 0.989 Å, with A4 being the isomer with the shorter distance and the stronger bond, with a value of 0.971 Å, followed by A6 (0.973 Å). Additionally, two structures exhibited the hydrogen atom between the carbonyl groups (A3 and A7); these isomers established an intramolecular hydrogen bond. However, the structure with the shorter and stronger hydrogen bond was A7. The energy values of the different protonated chemical structures are summarized in Table 1. The results show that the structure with the carbonyl group, C=O13, and the O12- H+ intramolecular bond (Figure 2A3) is the most stable isomer, both in gas and solution phases. The isomer A4, with the hydrogen atom bond towards O12, but with the opposite orientation, has an energy difference of 3.31 and 7.96 kcal/mol in the water solution and gas phase, respectively.
The less stable structures were those with the hydrogen atom attached to the methoxyl group (A5), followed by the AFB1 structures with their protonated lactone (A2) or furan rings (A1). Thus, the instability of these structures could be attributed to the hydrolysis reaction carried out by the acidic medium. Thermodynamic parameters, such as Gibbs free energy of formation, were also determined at the same theory level and used to obtain the free energy required to protonate and the equilibrium constants. Results of the free energy and equilibrium constant values in the gas phase are summarized in Table 2.
Gibbs free energies indicate that, in the gas phase, the deprotonation process is spontaneous, showing a trend in the dissociation reaction to produce a neutral AFB1 molecule. Thus, pKa and acidity equilibrium constants showed higher values. In all cases, the deprotonated AFB1 molecule was the predominant species in equilibrium and the protonated species appeared to a lesser extent. Besides, the pKa values revealed that, in acidic medium and at the pH of the process, all AFB1 molecules were deprotonated. These results can be explained by considering the poor solvation effect in the gas phase and consequently the lower stability of the charged species. Additionally, the same calculations were carried out considering the solvent effect (water); results are shown in Table 3.
Interestingly, in the gas phase, the Gibbs free energy of formation for the protonated compounds showed lower negative values. However, in solution, structures with better stability were obtained when the AFB1 molecule was protonated, as a result of the solvation effect. Also, the dissociation free energies indicated that the loss of the hydrogen atom in the structures A1 (−30.9 kcal/mol), A2 (−37.8 kcal/mol), and A5 (−11.3 kcal/mol) was spontaneous (Table 2). However, the structures proposed for the O12 and O13 of the carbonyl groups (A3, A4, A6, and A7) revealed a nonspontaneous dissociation process with greater stability of the charged form in contrast with the neutral form. Moreover, the acidity constants and pKa values were obtained from the Gibbs free energy, showing positive or negative pKa values for A1 (0.17), A2 (−1.70), and A5 (−5.76), confirming that at the studied conditions of pH = 5, the structures were in a deprotonated form. On the other hand, the structures A3, A4, A6, and A7 showed greater pKa values at the above-mentioned pH value, indicating that these structures were in a protonated form, and consequently, involved in the biosorption process.
According to the previous results, the protonation study showed that only the structures A3, A4, A6, and A7 were in a protonated form under the experimental conditions tested, these structures have the oxygen atoms O12 and O13 attached to the carbonyl groups. Considering the Gibbs free energy, the most stable structures were A3 (−694,518.3 kcal/mol), A4 (−694,515.6 kcal/mol), A6 (−694,510.2 kcal/mol), and A7 (−694,513.4 kcal/mol). Structures A3 (O13∙∙∙HO12) and A7 (O13H∙∙∙O12) have the hydrogen ion between both carbonyl groups. Consequently, the interaction studies were made with the above-mentioned structures, when the hydrogen atom was attached to each carbonyl group with and without simultaneous interaction with O12 and O13. In general, analysis of the protonated AFB1 molecule allowed identifying co-existent structures and using them as models for the interaction study with the functional groups of the biosorbent. The experimental work proposed the AFB1 interaction with several molecular groups such as hydroxyl, ammonium ion, carboxylate ion, and ketone-carbonyl groups. Consequently, molecular models for these groups were—CH3OH for the hydroxyl group, CH3NH3+ for ammonium ion, and CH3COO for the carboxylate ion, and finally CH3COCH3 for the keto-carbonyl group. Furthermore, the protonated or deprotonated forms of the different molecular groups were also evaluated considering the experimental pH value; thus, the amino groups in the aminoacids and peptides are in the protonated form (ammonium ion); meanwhile, the carboxyl groups of the aminoacids, proteins, and other compounds are in deprotonated form (carboxylate ion).

2.2. Molecular Electrostatic Potential Surface

The molecular electrostatic potential (MEP) map is an advantageous property employed to predict appropriately the molecular reactivity of the compound of interest [19,20]. In other words, it is contemplated as an indicator of the reactivity regions of a target molecule, hence MEP has been employed in order to study the electron-donator and electron-acceptor interactions [21]. This property in the seven protonated forms of AFB1 was calculated at the B3LYP/6-311++G(d,p) level of theory, and it is indicated in a color range from +242 (deepest blue) to +146 (light blue). The corresponding maps are displayed in Figure 3. A positive potential value is concentrated in the vicinity of the hydrogen atom bonded to an oxygen atom. Therefore, interaction sites are proposed through hydrogen bridges. The AFB1H+ and hydroxyl, ammonium ion, carboxylate ion, and ketone-carbonyl groups of the biosorbent could act as both the proton donor and acceptors. The hydrogen atoms bonded the O12 (A3) and O13 (A7) oxygen atoms have a lower positive charge due to an intramolecular hydrogen bridge. This type of interaction causes a polarization through the AFB1 molecule, as observed in Figure 3. The MEP results indicate that the formation of the complexes depend on the protonation site of AFB1 molecule.

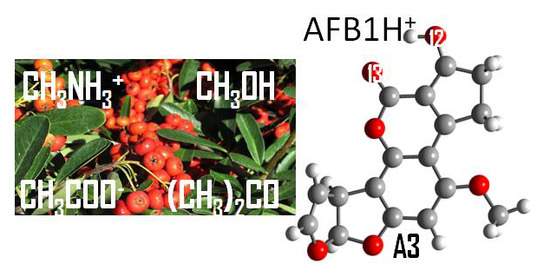
2.3. Studies of Protonated Aflatoxin B1 (AFB1H+) Interaction with Molecular Models

2.3.1. Hydroxyl Groups: CH3OH

The principal interaction considered among the AFB1H+ molecule and the hydroxyl group was the hydrogen bond. Thus, various interactions with distinct conformations were considered and proposed between the AFB1 positively charged molecule and the hydroxyl groups. The hydrogen of the positive AFB1 molecule was oriented in two directions, first between both carbonyl groups (O13∙∙∙HO12 and O13H∙∙∙O12) and the opposite orientation (HO12 or HO13). These interactions are shown in Figure 4. The CH3OH interaction with the A3 and A7 structures shows two hydrogen bonds between the A3-OHCH3 yielding a strong hydrogen bond (1.968 Å and 128°) formed between the hydroxyl group of methanol and the O13 atom of the carbonyl group. The second hydrogen bond formed among O12 protonated with the oxygen atom of the hydroxyl group also leads to a very strong bond (1.390 Å and 170°) [22,23,24]. The interaction between A7 and CH3OH was also formed by two hydrogen bonds, one strong among the hydroxyl group as a donor and O12 as an acceptor (1.621 Å and 152.9°), and the other very strong bond between the protonated O13 and the CH3OH as an acceptor (1.281 Å and 180°). Moreover, A4 and A6 structures also interact with CH3OH (1.500–1.570 Å with angle of 170–176°) [25,26,27].
Concerning the energy parameters (Table 4), the most stable structures were observed in water dissolution instead of the gas phase; this energy difference was attributed to the solvation effect. The analysis in the gas phase revealed that the most stable interaction was A3-OHCH3 (−767,270.3 kcal/mol), while in solution it was A4-OHCH3 (−767,310.8 kcal/mol). In water, the energy difference among these structures was less than 1 kcal/mol (0.2 kcal/mol); however, in the gas phase, the difference was 5.2 kcal/mol. The energy difference between the highest and the lowest energy value in the gas phase was 10.5 kcal/mol. And the energy difference between the highest and the lowest energy value in the water phase was 5.0 kcal/mol.
The energy of interaction displayed a stronger hydrogen bond in the gas phase for all considered structures and a strong interaction in solution. It is important to note that the A6-OHCH3 and A7-OHCH3 structures have the greatest interaction energy in both phases, corresponding to a strong acidity constant. The correlation among the hydrogen bond energy and the acidity has been previously reported, pointing out that usually the strong acid is a better hydrogen donor and consequently increases the strength of the bond; however, this increment does not occur indefinitely [28,29]. In contrast, in the gas phase, a different behavior was observed, where the structure A7-CH3OH (−19.9 kcal/mol) showed the stronger interaction, followed by A6-CH3OH (−18.8 kcal/mol). Other researchers have indicated that, in gas phase, the strength of the hydrogen bond decreases corresponding to the basicity of two donor atoms; this phenomenon could be explained by the change in the trend in gas and solution phases [30,31,32,33].

2.3.2. Ammonium Ion: CH3NH3+

The experimental work revealed a possible interaction with both the ammonium ion and the carboxylate ion; consequently, two molecular models were considered. CH3NH3+ was used for the ammonium ion and CH3COO for the carboxylate ion (Figure 5 and Figure 6). Both protonated (−NH3+) and un-protonated (−COO) forms were defined by the pKa values previously reported [34,35]. In the interaction model, a carboxylate ion as an acceptor and an ammonium ion as a hydrogen donor are proposed.
The hydrogen bond length among the ammonium ion and the AFB1 molecule was in the range of 1.802 and 1.747 Å, which is in close agreement with previous reports (1.888−1.738 Å) [36]. In this context, shorter hydrogen bonds among ammonium ion and AFB1 carbonyl group (1.755 for A3-+H3NCH3 and 1.747 for A6-+H3NCH3) correspond to the structures with no intramolecular hydrogen bond, which can be explained by the electrostatic repulsion for the position of the hydrogen atom attached to the carbonyl group in the opposite side of the ammonium ion. In contrast, structures A3-+H3NCH3 and A7-+H3NCH3 have slightly larger hydrogen bond lengths (1.790 and 1.802, respectively) than the above-mentioned structures. These differences could be attributed to the additional hydrogen bond among the ketone-carbonyl groups (2.045 Å for A3-+H3NCH3 and 2.124 Å for A7-+H3NCH3). Thus, by increasing the electrostatic repulsion and consequently the bond length, the same phenomenon was observed for the hydrogen bond between the two carbonyl groups, showing an increase in the bond length in comparison with the structure without interaction. Regarding the energy of interaction in the gas phase (Table 5), the values indicate that all interactions were instable, with the least stable being A4-NH3+ (29.1099 kcal/mol). Therefore, the interactions in water solution were more stable for A3-+H3NCH3, A6-+H3NCH3, and A7-+H3NCH3. These structures have interaction energy values in the range of −1.2 to −9 kcal/mol, with A7-+H3NCH3 being the structure with the highest value (−8.6 kcal/mol).

2.3.3. Carboxylate Ion: CH3COO

Regarding the carboxylate ion, the association with the AFB1 protonated isomers was evaluated to establish the possible interaction sites, considering the unprotonated form of the acid. At the experimental pH, the AFB1 molecule is protonated and the carboxylic acid is unprotonated when they are in solution without interacting and when interacting, and the proton of the AFB1 molecule is transferred to the carboxylate ion.
In all interactions, the hydrogen atom of the protonated AFB1 was transferred to the carboxylate ion similarly to other carbonylic moieties (ketones, aldehydes, esters, and amides). Thus, the consequence of the primary effect of the neighboring OH is to increase the proton affinity of the C=O group [31,37,38,39,40]. The interaction model with the carboxylate ion is shown in Figure 6. The structures A4-OOCCH3 and A6-OOCCH3 have a strong hydrogen bond (1.745 and 1.821 Å, with angles of 173.6° and 167.2°, respectively); meanwhile, the structures A3-OOCCH3 and A7-OOCCH3 have two hydrogen bonds, one stronger (1.821 and 1.809 Å, respectively), and the second weaker (2.765 and 2.719 Å, respectively), with bond angles of 110.9° and 114.9°, respectively.
In the gas phase (Table 6), a stronger interaction in comparison to that due to water solvation is shown as a consequence to the ionic nature species bonding and the lower stabilization effect. A neutral structure generates the most stable structure in the medium as a result of the charge attraction. However, the solvation effect that stabilizes the polar molecules and ionic structures also improves the dispersion effect and reduces the interaction energy (Table 6). In general, the most stable structure was A4-OOCCH3 (−838,181.1 kcal/mol in the gas phase, and −838,198.0 kcal/mol in water solution). In water, the best interaction energy corresponded to A6-OOCCH3 (−40.2 kcal/mol), followed by A7-OOCCH3 (−36.0 kcal/mol). Finally, the structure with the lowest interaction energy was A4-OOCCH3 (−31.69 kcal/mol).

2.3.4. Carbonyl Group: (CH3)2C=O

The carbonyl group involved in the AFB1 adsorption is also seen in peptides, aminoacids, carbohydrates, and some secondary metabolites present in the biosorbent [34]. The interaction among this group and the protonated AFB1 molecule was studied using the (CH3)2C=O molecule as a model, which can act as a hydrogen bond acceptor [41]. These interactions are depicted in Figure 7. Structures showed the hydrogen bond between the carbonyl group of the (CH3)2C=O and the protonated AFB1 molecule. The interaction model with structures A3-O=C(CH3)2 and A7-O=C(CH3)2 exhibited two hydrogen bonds, the first weaker, among the two carbonyl groups of the AFB1 molecule (2.579 Å and 111.5° for A3-O=C(CH3)2, and 2.600 Å and 94.6° for A7-O=C(CH3)2), and a stronger hydrogen bond with the O=C(CH3)2 (1.461 Å and 160.1° for A3-O=C(CH3)2 and 1.411 Å and 168.9° for A7-O=C(CH3)2). Structures A4-O=C(CH3)2 and A6-O=C(CH3)2 revealed only one stronger hydrogen bond with the carbonyl model, with geometrical parameters of 1.524 Å and 179.3° for A4-O=C(CH3)2, and 1.453 Å and 174.4° for A6-O=C(CH3)2, respectively.
With regard to the interaction energy (Table 7), it was stronger in the gas phase than that in solution phase, which is consistent with other results obtained in this work. Furthermore, the interaction energy among the structures A4-O=C(CH3)2 and A6-O=C(CH3)2 (−7.3 and −11.4 kcal/mol, respectively) was greater than that of A3-O=C(CH3)2 and A7-O=C(CH3)2 (−5.2 and −5.4 kcal/mol, respectively), which was attributed to the second hydrogen bond in the last two structures, causing a weak interaction with the carbonyl model.
Based on these results, the best interaction was obtained with the carboxylic groups; consequently, carboxylate ion-enriched biosorbents would be the best option for AFB1 adsorption with the experimental conditions tested.

2.4. Infrared Spectrophotometric Studies of the Interactions

Complementary and interesting results were obtained for the theoretical infrared spectrum calculations at the same theory level, searching for experimental band shifts. The infrared spectra of the molecule models are shown in Figure 8. The predicted infrared spectrum showed bands of hydroxyl groups above 3800 cm−1 and amine groups at 3500 cm−1, both bands in the experimental spectrum were broader [41], mainly due to the hydrogen bond formation; however, the theoretical calculation was made on single molecules; therefore, the bands in the predicted spectrum were very sharp. In all cases, alkyl chain bands were around 3000 cm−1; also, the carbonyl group bands of ketone and carboxylate ions were found at 1785 and 1648 cm−1, respectively. Finally, the bands of N-H deformation appeared between 1600 and 1500 cm−1. In addition, the infrared spectrums of the protonated AFB1 molecules (A3, A4, A6, and A7) were predicted and are shown in Figure 9. All data are in close agreement to previously reported results [41].
The infrared spectra showed bands at 3700–3300 cm−1 attributable to the stretching of the hydrogen- carbonyl group bond, located at low wavenumbers when an intramolecular hydrogen bond was formed as a consequence of the minor energy required by the bond vibration [42,43]. Other intense bands were assigned to the stretch of carbonyl groups (1739 to 1800 cm−1), and to the symmetrical and nonsymmetrical stretching of the carbon-carbon double bonds (1500–1600 cm−1). Results are in close agreement with the experimental data found in the AFB1 infrared spectrum [4,12,44,45,46]. Interestingly, structures A3 and A6 have similar patterns to those of the experimental spectrum. Moreover, the biosorbent-aflatoxin interactions were calculated and compared with the experimental results previously reported [4] in order to confirm the proposed changes. The obtained results are displayed in Figure 10, Figure 11, Figure 12 and Figure 13.
Theoretical infrared spectrum bands showed the hydroxyl group vibration band toward less wavenumbers [4]. This variation was associated with the hydrogen bond formation and consequently the lower stretching energy for the O-H bond. The CH3OH interaction with A7 was similar to the experimental results. Additionally, the hydrogen bond formed with the ammonium ion also exhibits a shift to lower wavenumbers and lower energy values. Regarding the carboxyl group, the bands corresponding to the hydroxyl group showed a shift to lower wavenumbers appearing at around 3400 cm−1. Also, the carbonyl group changes the wavenumber from 1648 to around 1700 cm−1, as a consequence of the hydrogen bond interaction with the lactone ring of the AFB1 molecule. Additionally, the carbonyl group revealed a reduction in its infrared activity with a greater reduction in the A6 structure. Finally, theoretical spectrophotometric results of the carbonyl group showed the corresponding intense band of the hydrogen bond among the AFB1 and the employed models (wavenumbers between 2100 to 2700 cm−1). The nonprotonated carbonyl group appeared at around 1800 cm−1, while the protonated group was detected around 1600 to 1700 cm−1. Thus, the offered theoretical infrared information contributes to confirm the feasibility of the interaction model proposed in the present work.

3. Conclusions

A theoretical study of the AFB1-biosorbent interactions was carried out. Acidity constants of some protonated structures of the AFB1 molecule were calculated. The protonated A3 molecule was the most stable structure. The protonated AFB1 structures that are in the 13 kcal/mol range were A3, A4, A6, and A7. Structures A1, A5, and A7 were found to be less stable, due to protonated oxygen atoms in both furan and lactone rings. The interaction energy increases in the order of methylammonium ions (amino group) < acetone (carbonyl group) < methanol (hydroxyl group) < acetate ions (carboxyl group). Consequently, carboxylate ion-enriched biosorbents would be the best option for AFB1 adsorption in both in vitro and in situ trials. Research in this direction is in progress.

4. Materials and Methods

4.1. Optimization of the Structures

This study considered the aflatoxin molecule maximum stability stereoisomer previously reported by our research group [10,47]. In the first stage, the interactions were built with standard bond lengths and bond angles, using the PC Spartan06 program [48]. Therefore, the first task was to establish the conformation of maximum stability. Thus, the geometry for each isomer was fully optimized using DFT calculations, which were obtained using the Gaussian 09 program [49]. These calculations were carried out defined by the Becke’s three parameter hybrid functional (B3LYP) [50,51], which include a mixture of Hartree–Fock exchange with DFT exchange correlation. The used basis set includes the split-valance and diffuse functions, 6-311++G(d,p) [52,53,54,55,56,57]. The substrate model optimizations were carried out considering the protonated or unprotonated form at the experimentally studied pH.

4.2. Thermochemical Parameters and Acidity of the Structure and Models

Thermochemical values were estimated from frequency calculations, which included a thermochemical analysis of the system considering 298.15 K, 1 atm of pressure and the principal isotope for each element [39,58,59], all at the same theory level. Zero-point correction to the electronic energy (ZPE) of the molecule was used to calculate the values of enthalpy and Gibbs free energy. The solvent effect was also calculated by using the self-consistent reaction field (SCRF) method and considering the Tomasi’s polarizable continuum model (PCM) at the same theory level, using water as a medium. The procedure to calculate solvation model involved first optimizing the structure in the gas phase and then again optimizing the optimized structure for the solvation model. For all energies, ZPE corrections were taken into consideration [60,61]. The acidity constants were calculated using the relationship between free energy and the equilibrium constants using the following equation [62]:
Δ = −RTLnkeq
where Δ was the Gibbs free energy of the deprotonation process, calculated by the difference among the formation free energy of products and the reactants. The keq values of the deprotonation process were used as acidity constants.

4.3. Molecular Electrostatic Surface

The molecular electrostatic potential (MEP) map is often used as a powerful predictive and interpretative tool in fields such as chemistry and intermolecular interactions. MEP is widely used to make a reactivity map displaying the molecular regions most probable to get the electrophilic attack of reagents in the molecules [63]. It maps potentials created in the space around a molecule by its nuclei and electrons. This also provides information for understanding the shape, size, charge density, delocalization and site of chemical reactivity of the molecules. MEP can be measured experimentally by diffraction as well as computed by quantum mechanical methods. MEP maps can be obtained by mapping electrostatic potential onto the total electron density with a color code [64]. MEP contour maps provide a simple way to predict how different geometries could interact [65]. This property was determined using the DFT (B3LYP/6-311++G(d,p) method.

4.4. Vibrational Analysis

Density functional theory (DFT) calculations are reported to provide vibrational frequencies of organic compounds [66,67,68,69,70,71,72]. Consequently, in this work, by using the DFT (B3LYP/6-311++G(d,p) method, the respective vibrational frequencies were calculated. The outcome represents the vibrational force constants of the molecule and the vibrational frequencies of vibrational modes and the integrated intensities of the infrared bands. Therefore, these calculations are valuable to provide insight into the vibrational spectrum. According to Rui-Zhou et al. [72], the B3LYP function yields a good description of harmonic vibrational wavenumbers for small- and medium-sized molecules; the calculations refer to the isolated molecules while the experimental vibrational spectra, as previously reported, were recorded mostly in condensed phase.

4.5. Interaction Energy Calculations

The association energies through the hydrogen bond shown in the AFB1–biosorbent interaction were calculated by subtracting the energy of the isolated molecules from the total energy of the complex [14,15,16].

Author Contributions

Conceptualization, P.G.-C. and R.M.-R.; formal analysis, J.M.A.-H.; investigation, R.E.-G. and M.I.N.-V.; project administration, A.M.-A. All authors read and approved the final version of the document. All authors have read and agreed to the published version of the manuscript.

Funding

This research was funded by Consejo Nacional de Ciencia y Tecnologia (CONACYT), grant number 299804 and UNAM PAPIIT, grant number IN207920.

Acknowledgments

The authors are grateful to Dirección General de Cómputo y de Tecnologías de Información y Comunicación (DGTIC-UNAM) for the use of Supercomputer MIZTLI-LANCAD-UNAM-DGTIC-165 and Project DGTIC-185. Also, Thanks to Moisés Hernández Duarte for technical assistance.

Conflicts of Interest

The authors declare no conflict of interest.

References

  1. Feibelman, T.P.; Cotty, P.J.; Doster, M.; Michailides, T. A morphologically distinct strain of Aspergillus nomius. Mycologia 1998, 90, 618–623. [Google Scholar] [CrossRef]
  2. Nesci, A.; Gsponer, N.; Etcheverry, M. Natural maize phenolic acids for control of aflatoxigenic fungi on maize. J. Food Sci. 2007, 72, M180–M185. [Google Scholar] [CrossRef] [PubMed]
  3. Phillips, T.D. Dietary clay in the chemoprevention of aflatoxin-induced disease. Toxicol. Sci. Off. J. Soc. Toxicol. 1999, 52, 118–126. [Google Scholar] [CrossRef] [PubMed]
  4. Ramales-Valderrama, R.; Vázquez-Durán, A.; Méndez-Albores, A. Biosorption of B-aflatoxins Using Biomasses Obtained from Formosa Firethorn [Pyracantha koidzumii (Hayata) Rehder]. Toxins 2016, 8, 218. [Google Scholar] [CrossRef]
  5. Smela, M.E.; Currier, S.S.; Bailey, E.A.; Essigmann, J.M. The chemistry and biology of aflatoxin B1: From mutational spectrometry to carcinogenesis. Carcinogenesis 2001, 22, 535–545. [Google Scholar] [CrossRef] [Green Version]
  6. Essigmann, J.M.; Croy, R.G.; Nadzan, A.M.; Busby, W.F.; Reinhold, V.N.; Büchi, G.; Wogan, G.N. Structural identification of the major DNA adduct formed by aflatoxin B1 in vitro. Proc. Natl. Acad. Sci. USA 1977, 74, 1870–1874. [Google Scholar] [CrossRef] [Green Version]
  7. Hernández-Meléndez, D.; Salas-Téllez, E.; Zavala-Franco, A.; Téllez, G.; Méndez-Albores, A.; Vázquez-Durán, A. Inhibitory effect of flower-shaped zinc oxide nanostructures on the growth and aflatoxin production of a highly toxigenic strain of aspergillus flavus link. Materials 2018, 11, 1265. [Google Scholar]
  8. Doyle, M.P.; Applebaum, R.S.; Brackett, R.E.; Marth, E.H. Physical, chemical and biological degradation of mycotoxins in foods and agricultural commodities. J. Food Prot. 1982, 45, 964–971. [Google Scholar] [CrossRef] [PubMed]
  9. Goldblatt, L. Aflatoxin: Scientific Background, Control, and Implications; Academic Press: London, UK, 1969; ISBN 0323148492. [Google Scholar]
  10. Nicolás-Vázquez, I.; Méndez-Albores, A.; Moreno-Martínez, E.; Miranda, R.; Castro, M. Role of Lactone Ring in Structural, Electronic, and Reactivity Properties of Aflatoxin B1: A Theoretical Study. Arch. Environ. Contam. Toxicol. 2010, 59, 393–406. [Google Scholar] [CrossRef]
  11. Sabbioni, G.; Skipper, P.L.; Büchi, G.; Tannenbaum, S.R. Isolation and characterization of the major serum albumin adduct formed by aflatoxin B 1 in vivo in rats. Carcinogenesis 1987, 8, 819–824. [Google Scholar] [CrossRef]
  12. Ivanova, B.; Spiteller, M. Raman Spectroscopic and Mass Spectrometric Determination of Aflatoxins. Food Anal. Methods 2014, 7, 242–256. [Google Scholar] [CrossRef]
  13. Martin, C.N.; Garner, R.C. Aflatoxin B-oxide generated by chemical or enzymic oxidation of aflatoxin B1 causes guanine substitution in nucleic acids. Nature 1977, 267, 863–865. [Google Scholar] [CrossRef] [PubMed]
  14. Nicolás-Vázquez, I.; Torres, J.H.; Borbolla, J.C.; Ruvalcaba, R.M.; Aceves-Hernández, J.M. Orlistat interaction with sibutramine and carnitine. A physicochemical and theoretical study. J. Mol. Struct. 2014, 1062, 1–12. [Google Scholar] [CrossRef]
  15. Moyers-Montoya, E.; García-Casillas, P.; Vargas-Requena, C.; Escobedo-González, R.; Martel-Estrada, S.-A.; Martínez-Pérez, C.A. Polycaprolactone/amino-β-cyclodextrin inclusion complex prepared by an electrospinning technique. Polymers 2016, 8, 395. [Google Scholar] [CrossRef] [PubMed] [Green Version]
  16. Vazquez-Flores, A.A.; Martinez-Gonzalez, A.I.; Alvarez-Parrilla, E.; Díaz-Sánchez, Á.G.; de la Rosa, L.A.; González-Aguilar, G.A.; Aguilar, C.N. Proanthocyanidins with a low degree of polymerization are good inhibitors of digestive enzymes because of their ability to form specific interactions: A hypothesis. J. Food Sci. 2018, 83, 2895–2902. [Google Scholar] [CrossRef] [Green Version]
  17. Martínez, J.; Rodríguez, M.H.; Escobedo-González, R.; Nicolás-Vázquez, M.I.; Saavedra-Leos, Z.; Ruvalcaba, R.M. Computational Characterization of Perezone, Isoperezone and their Sulfur-Derivatives: Anti-inflammatory Activity. ChemistrySelect 2019, 4, 13333–13346. [Google Scholar] [CrossRef]
  18. Tóth, K.; Nagy, L.; Mándi, A.; Kuki, Á.; Mézes, M.; Zsuga, M.; Kéki, S. Collision-induced dissociation of aflatoxins. Rapid Commun. Mass Spectrom. 2013, 27, 553–559. [Google Scholar] [CrossRef] [Green Version]
  19. Kumar, A.; Mohan, C.G.; Mishra, P.C. Molecular electrostatic potential and field as descriptors of hydrogen bonding and molecular activity. Effects of hybridization displacement charge. J. Mol. Struct. THEOCHEM 1996, 361, 135–144. [Google Scholar] [CrossRef]
  20. Escobedo-González, R.; Vargas-Requena, C.L.; Moyers-Montoya, E.; Aceves-Hernández, J.M.; Nicolás-Vázquez, M.I.; Miranda-Ruvalcaba, R. In silico study of the pharmacologic properties and cytotoxicity pathways in cancer cells of various indolylquinone analogues of perezone. Molecules 2017, 22, 1060. [Google Scholar] [CrossRef] [Green Version]
  21. Politzer, P.; Laurence, P.R.; Jayasuriya, K. Molecular electrostatic potentials: An effective tool for the elucidation of biochemical phenomena. Environ. Health Perspect. 1985, 61, 191. [Google Scholar] [CrossRef]
  22. Desiraju, G.R.; Steiner, T. The Weak Hydrogen Bond: In Structural Chemistry and Biology; Oxford university, Ed.; International Union of Crystal: New York, NY, USA, 2001; Volume 9. [Google Scholar]
  23. Smith, G.T.; Howard, J.A.K.; Wallis, J.D. Characterisation of weak intramolecular interactions in the topology of the experimental charge density of 2, 2′-ethynylenedibenzoic acid. Phys. Chem. Chem. Phys. 2001, 3, 4501–4507. [Google Scholar] [CrossRef]
  24. Steiner, T.; Desiraju, G.R. Distinction between the weak hydrogen bond and the van der Waals interaction. Chem. Commun. 1998, 891–892. [Google Scholar] [CrossRef]
  25. Oliveira, B.G.; Pereira, F.S.; de Araújo, R.; Ramos, M.N. The hydrogen bond strength: New proposals to evaluate the intermolecular interaction using DFT calculations and the AIM theory. Chem. Phys. Lett. 2006, 427, 181–184. [Google Scholar] [CrossRef]
  26. Wojtulewski, S.; Grabowski, S.J. Different donors and acceptors for intramolecular hydrogen bonds. Chem. Phys. Lett. 2003, 378, 388–394. [Google Scholar] [CrossRef]
  27. Cyrański, M.; Jezierska, A.; Klimentowska, P.; Panek, J.J.; Sporzyński, A. Impact of intermolecular hydrogen bond on structural properties of phenylboronic acid: Quantum chemical and X-ray study. J. Phys. Org. Chem. 2008, 21, 472–482. [Google Scholar] [CrossRef]
  28. Perrin, C.L.; Nielson, J.B. “Strong” hydrogen bonds in chemistry and biology. Annu. Rev. Phys. Chem. 1997, 48, 511–544. [Google Scholar] [CrossRef]
  29. Chen, J.; McAllister, M.A.; Lee, J.K.; Houk, K.N. Short, Strong Hydrogen Bonds in the Gas Phase and in Solution: Theoretical Exploration of pKa Matching and Environmental Effects on the Strengths of Hydrogen Bonds and Their Potential Roles in Enzymatic Catalysis. J. Org. Chem. 1998, 63, 4611–4619. [Google Scholar] [CrossRef]
  30. Shan, S.-O.; Herschlag, D. The change in hydrogen bond strength accompanying charge rearrangement: Implications for enzymatic catalysis. Biochemistry 1996, 93, 14474–14479. [Google Scholar] [CrossRef] [Green Version]
  31. Stewart, R.; Yates, K. The Protonation of the Carbonyl Group. I. The Basicity of Substituted Acetophenones. J. Am. Chem. Soc. 1958, 80, 6355–6359. [Google Scholar] [CrossRef]
  32. Berthelot, M.; Besseau, F.; Laurence, C. The Hydrogen-Bond Basicity pKHB Scale of Peroxides and Ethers. European J. Org. Chem. 1998, 1998, 925–931. [Google Scholar] [CrossRef]
  33. Shokri, A.; Abedin, A.; Fattahi, A.; Kass, S.R. Effect of Hydrogen Bonds on pKa Values: Importance of Networking. J. Am. Chem. Soc. 2012, 134, 10646–10650. [Google Scholar] [CrossRef] [PubMed]
  34. Nelson, D.L.; Lehninger, A.L.; Cox, M.M. Lehninger Principles of Biochemistry, 4th ed.; Freeman: New York, NY, USA, 2008. [Google Scholar]
  35. Včeláková, K.; Zusková, I.; Kenndler, E.; Gaš, B. Determination of cationic mobilities and pKa values of 22 amino acids by capillary zone electrophoresis. Electrophoresis 2004, 25, 309–317. [Google Scholar] [CrossRef] [PubMed]
  36. Brown, R.J.C. Hydrogen bonding of the ammonium ion. J. Mol. Struct. 1995, 345, 77–81. [Google Scholar] [CrossRef]
  37. Hillenbrand, E.A.; Scheiner, S. Analysis of the Principles Governing Proton-Transfer Reactions. Carboxyl Group. J. Am. Chem. Soc. 1986, 108, 7178–7186. [Google Scholar] [CrossRef]
  38. Mills, B.E.; Martin, R.L.; Shirley, D.A. Further Studies of the Core Binding Energy-Proton Affinity Correlation in Molecules. J. Am. Chem. Soc. 1976, 98, 2380–2385. [Google Scholar] [CrossRef] [Green Version]
  39. Smith, S.R.; Thomas, T.D. Acidities and Basicities of Carboxylic Acids. Correlations between Core-Ionization Energies, Proton Affinities, and Gas-Phase Acidity. J. Am. Chem. Soc. 1978, 5460–5464. [Google Scholar]
  40. Stewart, R.; Yates, K. The Position of Protonation of the Carboxyl Group. J. Am. Chem. Soc. 1960, 82, 4059–4061. [Google Scholar] [CrossRef]
  41. Lommerse, J.P.M.; Price, S.L.; Taylor, R. Hydrogen bonding of carbonyl, ether, and ester oxygen atoms with alkanol hydroxyl groups. J. Comput. Chem. 1997, 18, 757–774. [Google Scholar] [CrossRef]
  42. Liang, C.Y.; Marchessault, R.H. Infrared spectra of crystalline polysaccharides. I. Hydrogen bonds in native celluloses. J. Polym. Sci. 1959, 37, 385–395. [Google Scholar] [CrossRef]
  43. Gellman, S.H.; Dado, G.P.; Liang, G.B.; Adams, B.R. Conformation-directing effects of a single intramolecular amide-amide hydrogen bond: Variable-temperature NMR and IR studies on a homologous diamide series. J. Am. Chem. Soc. 1991, 113, 1164–1173. [Google Scholar] [CrossRef]
  44. Zavala-Franco, A.; Hernández-Patlán, D.; Solís-Cruz, B.; López-Arellano, R.; Tellez-Isaias, G.; Vázquez-Durán, A.; Méndez-Albores, A. Assessing the Aflatoxin B1 Adsorption Capacity between Biosorbents Using an In Vitro Multicompartmental Model Simulating the Dynamic Conditions in the Gastrointestinal Tract of Poultry. Toxins 2018, 10, 484. [Google Scholar] [CrossRef] [PubMed] [Green Version]
  45. Billes, F.; Móricz, Á.M.; Tyihák, E.; Mikosch, H. Simulated vibrational spectra of aflatoxins and their demethylated products and the estimation of the energies of the demethylation reactions. Spectrochim. Acta Part A Mol. Biomol. Spectrosc. 2006, 64, 600–622. [Google Scholar] [CrossRef] [PubMed]
  46. Asao, T.; Büchi, G.; Abdel-Kader, M.M.; Chang, S.B.; Wick, E.L.; Wogan, G.N. The Structures of Aflatoxins B and G1. J. Am. Chem. Soc. 1965, 87, 882–886. [Google Scholar] [CrossRef] [PubMed]
  47. Escobedo-González, R.; Méndez-Albores, A.; Villarreal-Barajas, T.; Aceves-Hernández, J.M.; Miranda-Ruvalcaba, R.; Nicolás-Vázquez, I. A Theoretical Study of 8-Chloro-9-Hydroxy-Aflatoxin B 1, the Conversion Product of Aflatoxin B 1 by Neutral Electrolyzed Water. Toxins 2016, 8, 225. [Google Scholar] [CrossRef] [Green Version]
  48. Deppmeier, B.J.; Driessen, A.J.; Hehre, T.S.; Hehre, W.J.; Johnson, J.A.; Klunzinger, P.E.; Leonard, J.M.; Pham, I.N.; Pietro, W.J.; Jianguo, Y.; et al. Spartan 06; Wavefunction Inc.: Irvine, CA, USA, 2006. [Google Scholar]
  49. Frisch, M.; Trucks, G.W.; Schlegel, H.B.; Scuseria, G.E.; Robb, M.A.; Cheeseman, J.R.; Scalmani, G.; Barone, V.; Mennucci, B.; Petersson, G.A.; et al. Gaussian 09, Revision D. 01; Gaussian, Inc.: Wallingford, CT, USA, 2009. [Google Scholar]
  50. Beke, A.D. Density-functional exchanges-energy approximation with correct asymptotic behavior. Phys. Chem. Chem. Phys. Rev. A 1988, 38, 3098–3100. [Google Scholar] [CrossRef]
  51. Lee, C.; Yang, W.; Parr, R.G. Development of the Colle-Salvetti correlation-energy formula into a functional of the electron density. Phys. Rev. B 1988, 37, 785. [Google Scholar] [CrossRef] [Green Version]
  52. Gill, P.M.W.; Johnson, B.G.; Pople, J.A.; Frisch, M.J. The performance of the Becke-Lee-Yang-Parr (B-LYP) density functional theory with various basis sets. Chem. Phys. Lett. 1992, 197, 499–505. [Google Scholar] [CrossRef] [Green Version]
  53. Becke, A.D. Density-functional thermochemistry. IV. A new dynamical correlation functional and implications for exact-exchange mixing. J. Chem. Phys. 1998, 104, 1040–1046. [Google Scholar] [CrossRef]
  54. Becke, A.D. Density-functional thermochemistry. III. The role of exact exchange. J. Chem. Phys. 1993, 98, 5648–5652. [Google Scholar] [CrossRef] [Green Version]
  55. Krishnan, R.; Binkley, J.S.; Seeger, R.; Pople, J.A. Self-consistent molecular orbital methods. XX. A basis set for correlated wave functions. J. Chem. Phys. 1980, 72, 650–654. [Google Scholar] [CrossRef]
  56. Clark, T.; Chandrasekhar, J.; Spitznagel, G.W.; Schleyer, P.V.R. Efficient diffuse function-augmented basis sets for anion calculations. III. The 3-21+ G basis set for first-row elements, Li--F. J. Comput. Chem. 1983, 4, 294–301. [Google Scholar] [CrossRef]
  57. Hariharan, P.C.; Pople, J.A. The influence of polarization functions on molecular orbital hydrogenation energies. Theoretica Chim. Acta 1973, 28, 213–222. [Google Scholar] [CrossRef]
  58. Escobedo-González, R.G.; Pérez Martínez, H.; Nicolás-Vázquez, M.I.; Martínez, J.; Gómez, G.; Serrano, J.N.; Carranza Téllez, V.; Vargas-Requena, C.L.; Miranda Ruvalcaba, R. Green production of indolylquinones, derivatives of perezone, and related molecules, promising antineoplastic compounds. J. Chem. 2016, 2016, 1–10. [Google Scholar] [CrossRef]
  59. Foresman, J.B.; Frisch, A. Exploring Chemistry with Electronic Structure Methods: A Guide to using Gaussian; Gaussian, Inc.: Pittsburgh, PA, USA, 1996. [Google Scholar]
  60. Cossi, M.; Barone, V.; Cammi, R.; Tomasi, J. Ab initio study of solvated molecules: A new implementation of the polarizable continuum model. Chem. Phys. Lett. 1996, 255, 327–335. [Google Scholar] [CrossRef]
  61. Cances, E.; Mennucci, B.; Tomasi, J. A new integral equation formalism for the polarizable continuum model: Theoretical background and applications to isotropic and anisotropic dielectrics. J. Chem. Phys. 1997, 107, 3032–3041. [Google Scholar] [CrossRef]
  62. Silva, C.O.; da Silva, E.C.; Nascimento, M.A.C. Ab Initio Calculations of Absolute pKa Values in Aqueous Solution II. Aliphatic Alcohols, Thiols, and Halogenated Carboxylic Acids. J. Phys. Chem. A 2000, 104, 2402–2409. [Google Scholar] [CrossRef]
  63. Huczyński, A.; Janczak, J.; Łowicki, D.; Brzezinski, B. Monensin A acid complexes as a model of electrogenic transport of sodium cation. Biochim. Biophys. Acta BBA Biomembr. 2012, 1818, 2108–2119. [Google Scholar] [CrossRef] [Green Version]
  64. Alam, M.J.; Ahmad, S. Anharmonic vibrational studies of L-aspartic acid using HF and DFT calculations. Spectrochim. Acta Part A Mol. Biomol. Spectrosc. 2012, 96, 992–1004. [Google Scholar] [CrossRef]
  65. Ramalingam, S.; Babu, P.D.S.; Periandy, S.; Fereyduni, E. Vibrational investigation, molecular orbital studies and molecular electrostatic potential map analysis on 3-chlorobenzoic acid using hybrid computational calculations. Spectrochim. Acta Part A Mol. Biomol. Spectrosc. 2011, 84, 210–220. [Google Scholar] [CrossRef]
  66. Escobedo-González, R.G.; Bahena, L.; Arias Tellez, J.L.; Hinojosa Torres, J.; Ruvalcaba, R.M.; Aceves-Hernández, J.M. Characterization and comparison of perezone with some analogues. Experimental and theoretical study. J. Mol. Struct. 2015, 1097, 98–105. [Google Scholar] [CrossRef]
  67. Fragoso-Medina, A.J.; Escobedo-González, R.G.; Nicolás-Vázquez, M.I.; Arroyo-Razo, G.A.; Noguez-Córdova, M.O.; Miranda-Ruvalcaba, R. A DFT study of the geometrical, spectroscopical and reactivity properties of diindolylmethane-phenylboronic acid hybrids. Molecules 2017, 22, 1744. [Google Scholar] [CrossRef] [PubMed] [Green Version]
  68. Handy, N.C.; Murray, C.W.; Amos, R.D. Study of methane, acetylene, ethene, and benzene using Kohn-Sham theory. J. Phys. Chem. 1993, 97, 4392–4396. [Google Scholar] [CrossRef]
  69. Stephens, P.J.; Devlin, F.J.; Chabalowski, C.F.; Frisch, M.J. Ab initio Calculation of Vibrational Absorption and Circular Dichroism Spectra using Density Functional force Fields. J. Phys. Chem. 1994, 98, 11623–11627. [Google Scholar] [CrossRef]
  70. Devlin, F.J.; Finley, J.W.; Stephens, P.J.; Frisch, M.J. Ab initio calculation of vibrational absorption and circular dichroism spectra using density functional force fields: A comparison of local, nonlocal, and hybrid density functionals. J. Phys. Chem. 1995, 99, 16883–16902. [Google Scholar] [CrossRef]
  71. Lee, S.Y.; Boo, B.H. Density functional theory study of vibrational spectra of anthracene neutral and radical cation. Bull. Korean Chem. Soc. 1996, 17, 754–759. [Google Scholar]
  72. Rui-Zhou, Z.; Xiao-Hong, L.; Xian-Zhou, Z. Molecular structure, vibrational spectra and NBO analysis on 1N-acetyl-3-(2, 4dichloro-5-fluoro-phenyl)-5-(p-methyl-phenyl)-2-pyrazoline using DFT method. Indian J. Pure Appl. Phys. 2011, 49, 731–739. [Google Scholar]
Figure 1. Proposed structures of the protonated aflatoxin B1 (AFB1) molecule. A1 (AFB1O7-H+), A2 (AFB1O10-H+), A3 (AFB1O13O12-H+), A4 (AFB1O12-H+), A5 (AFB1O14-H+), A6 (AFB1O13-H+), and A7 (AFB1O12-O13-H+).
Toxins 12 00283 g001
Figure 2. Optimized structures of the positively charged AFB1 molecules A1–A7. A1 (AFB1O7-H+), A2 (AFB1O10-H+), A3 (AFB1O13O12-H+), A4 (AFB1O12-H+), A5 (AFB1O14-H+), A6 (AFB1O13-H+), A7 (AFB1O12-O13-H+).
Toxins 12 00283 g002
Figure 3. The total electron density isosurface mapped with molecular electrostatic potential of—A1 (AFB1O7-H+), A2 (AFB1O10-H+), A3 (AFB1O13O12-H+), A4 (AFB1O12-H+), A5 (AFB1O14-H+), A6 (AFB1O13-H+), and A7 (AFB1O12-O13-H+). Density = 0.0004 and isovalue = 0.02. Level of calculation: B3LYP/6-311++G(d,p). The color scheme for the MEPS is as follows—blue, electron-deficient, partially positive charge; light blue, slightly electron-deficient region.
Toxins 12 00283 g003
Figure 4. Interaction of the AFB1 protonated forms with the hydroxyl group using CH3OH as a model system. A3-OHCH3 (AFB1-O13O12-H+∙∙∙OHCH3), A4-OHCH3 (AFB1O12H+∙∙∙OHCH3), A6-OHCH3 (AFB1O13H+∙∙∙OHCH3), and A7-OHCH3 (AFB1O12-O13-H+∙∙∙OHCH3).
Toxins 12 00283 g004
Figure 5. Interaction of the AFB1 protonated forms with the protonated amine group, CH3NH3+ as a model. A3-+H3NCH3 (AFB1O12O13∙∙∙+H3NCH3), A4-+H3NCH3 (AFB1O13∙∙∙+H3NCH3), A6-+H3NCH3 (AFB1O12∙∙∙+H3NCH3) and A7-+H3NCH3 (AFB1O13O12∙∙∙+H3NCH3).
Toxins 12 00283 g005
Figure 6. Interaction of the AFB1H+ with the carboxylate ion using CH3COO as a model system. A3-OOCCH3 (AFB1O13O12-H+∙∙∙OOCCH3), A4-OOCCH3 (AFB1O12H+∙∙∙OOCCH3), A6-OOCCH3 (AFB1O13H+∙∙∙OOCCH3) and A7-OOCCH3 (AFB1O12O13-H+∙∙∙OOCCH3).
Toxins 12 00283 g006
Figure 7. Interaction of the AFB1 protonated forms with the carbonyl group using O=C(CH3)2 as a model system. A3-O=C(CH3)2 (AFB1O13O12-H+∙∙∙O=C(CH3)2), A4-O=C(CH3)2 AFB1O12-H+∙∙∙O=C(CH3)2), A6-O=C(CH3)2 (AFB1O13-H+∙∙∙O=C(CH3)2) and A7-O=C(CH3)2 AFB1O12O13-H+∙∙∙O=C(CH3)2).
Toxins 12 00283 g007
Figure 8. Predicted infrared spectra (without correction factor) for the model systems—(a) hydroxyl (methanol), (b) ammonium ion (methylamine), (c) carboxylate ion (acetic acid), and (d) carbonyl group (acetone).
Toxins 12 00283 g008
Figure 9. Theoretical infrared spectrums of the protonated AFB1 molecules—(a) A3 (AFB1O13O12-H+), (b) A4 (AFB1O12-H+), (c) A6 (AFB1O13-H+), and (d) A7 (AFB1O12-O13-H+).
Toxins 12 00283 g009
Figure 10. Theoretical infrared spectra of CH3OH interactions—(a) A3 (AFB1-O13O12-H+∙∙∙OHCH3), (b) A4 (AFB1O12H+∙∙∙OHCH3), (c) A6 (AFB1O13H+∙∙∙OHCH3) and (d) A7 (AFB1-O12O13-H+∙∙∙OHCH3).
Toxins 12 00283 g010
Figure 11. Theoretical infrared spectra of CH3NH3+ interactions—(a) A3 (AFB1O12O13∙∙∙+H3NCH3), (b) A4 (AFB1O13∙∙∙+H3NCH3), (c) A6 (AFB1O12∙∙∙+H3NCH3) and (d) A7 (AFB1O13O12∙∙∙+H3NCH3).
Toxins 12 00283 g011
Figure 12. Theoretical infrared spectra of CH3COO interactions—(a) A3 (AFB1O13O12-H+∙∙∙OOCCH3), (b) A4 (AFB1O12H+∙∙∙OOCCH3), (c) A6 (AFB1O13H+∙∙∙OOCCH3) and (d) A7 (AFB1O12O13-H+∙∙∙OOCCH3).
Toxins 12 00283 g012
Figure 13. Theoretical infrared spectra of (CH3)2CO interactions—(a) A3 (AFB1O13O12-H+∙∙∙O=C(CH3)2), (b) A4 (AFB1O12-H+∙∙∙O=C(CH3)2), (c) A6 (AFB1O13-H+∙∙∙O=C(CH3)2) and (d) A7 (AFB1O12O13-H+∙∙∙O=C(CH3)2).
Toxins 12 00283 g013
Table 1. Energy values of the protonated structures of the AFB1 optimized molecule. A1 (AFB1O7-H+), A2 (AFB1O10-H+), A3 (AFB1O13O12-H+), A4 (AFB1O12-H+), A5 (AFB1O14-H+), A6 (AFB1O13-H+), A7 (AFB1O12-O13-H+).
Protonated Structures
AFB1
Water SolutionGas Phase
Energy
Kcal/mol
ΔE
Kcal/mol
Energy
Kcal/mol
ΔE
Kcal/mol
A1−694,634.9825.91−694,577.7938.45
A2−694,633.5727.32−694,585.8530.38
A3−694,660.890−694,616.240
A4−694,657.583.31−694,608.317.96
A5−694,629.3231.57−694,560.5755.66
A6−694,651.918.98−694,602.8113.43
A7−694,655.765.14−694,611.205.03
ΔE = EenergyA1…A7 − EenergyA3.
Table 2. Dissociation free energy and acidity equilibrium constant values in the gas phase for—A1 (AFB1O7-H+), A2 (AFB1O10-H+), A3 (AFB1O13O12-H+), A4 (AFB1O12-H+), A5 (AFB1O14-H+), A6 (AFB1O13-H+), A7 (AFB1O12-O13-H+).
AFB1H+ ⇆ AFB1 + H+
StructureΔG Formation
kcal/mol
ΔG Dissociation Reaction
kcal/mol
KapKa
A1−694,440.146−30.9144.575 × 1022−22.661
A2−694,447.074−37.8435.483 × 1027−27.739
A3−694,473.686−64.4541.759 × 1047−47.245
A4−694,466.299−57.0676.767 × 1041−41.830
A5−694,420.522−11.2911.888 × 108−8.276
A6−694,461.097−51.8651.041 × 1038−38.018
A7−694,468.856−59.6255.071 × 1043−43.705
Table 3. Dissociation free energy and acidity equilibrium constant values in water phase for—A1 (AFB1O7-H+), A2 (AFB1O10-H+), A3 (AFB1O13O12-H+), A4 (AFB1O12-H+), A5 (AFB1O14-H+), A6 (AFB1O13-H+), A7 (AFB1O12-O13-H+).
AFB1H+ ⇆ AFB1 + H+
StructureΔG Formation
kcal/mol
ΔG Dissociation Reaction
kcal/mol
KapKa
A1−694,497.342−0.2300.680.17
A2−694,494.788−2.32450.53−1.70
A3−694,518.34021.2282.76 × 101615.56
A4−694,515.57118.4592.95 × 101413.53
A5−694,489.274−7.838556,713.56−5.76
A6−694,510.19413.0822.58 × 10109.59
A7−694,513.410 16.2981.13 × 101211.95
Table 4. Interaction energies between the protonated aflatoxin B1 (AFB1H+) molecule and CH3OH—A3-OHCH3 (AFB1-O13O12-H+∙∙∙OHCH3), A4-OHCH3 (AFB1O12H+∙∙∙OHCH3), A6-OHCH3 (AFB1O13H+∙∙∙OHCH3), and A7-OHCH3 (AFB1O12-O13-H+∙∙∙OHCH3).
PhaseStructure/StabilityA3-OHCH3A4-OHCH3A6-OHCH3A7-OHCH3
Gas Structure energy (kcal/mol)−767,270.3−767,265.1−767,259.8−767,269.4
Interaction energy (kcal/mol)−15.8−10.7−18.8−19.9
Water Structure energy (kcal/mol)−767,310.6−767,310.8−767,305.8−767,310.6
Interaction energy (kcal/mol)−7.7−7.9−12.0−12.8
Table 5. Interaction energies between aflatoxin B1 (AFB1) protonated forms and protonated ammonium ion CH3NH3+. A3-+H3NCH3 (AFB1O12O13∙∙∙+H3NCH3), A4-+H3NCH3 (AFB1O13∙∙∙+H3NCH3), A6-+H3NCH3 (AFB1O12∙∙∙+H3NCH3) and A7-+H3NCH3 (AFB1O13O12∙∙∙+H3NCH3).
PhaseStructure/StabilityA3-+H3NCH3A4-+H3NCH3A6-+H3NCH3A6-+H3NCH3
GasStructure energy (kcal/mol)−754,981.1−754,979.8−754,976.5−754,977.8
Interaction energy (kcal/mol)27.829.127.426.1
WaterStructure energy (kcal/mol)−755,123.2−755,120.4−755,115.5−755,118.8
Interaction energy (kcal/mol)0.3−1.2−5.3-8.6
Table 6. Interaction energies between AFB1 (AFB1H+) and CH3COO. A3-OOCCH3 (AFB1O13O12-H+∙∙∙OOCCH3), A4-OOCCH3 (AFB1O12H+∙∙∙∙∙∙OOCCH3), A6-OOCCH3 (AFB1O13H+∙∙∙OOCCH3) and A7-OOCCH3 (AFB1O12O13-H+∙∙∙OOCCH3).
PhaseStructure/StabilityA3-OOCCH3A4-OOCCH3 A6-OOCCH3A7-OOCCH3
GasStructure energy (kcal/mol)−838,180.2−838,181.1−838,180.1−838,177.7
Interaction energy (kcal/mol)−124.5−125.3−137.8−126.9
WaterStructure energy (kcal/mol)−838,197.7−838,198.0−838,197.2−838,196.9
Interaction energy (kcal/mol)−31.7−32.0−40.2−36.0
Table 7. Interaction energies between protonated aflatoxin B1 (AFB1) and O=C(CH3)2. A3-O=C(CH3)2 (AFB1O13O12-H+∙∙∙O=C(CH3)2), A4-O=C(CH3)2 AFB1O12-H+∙∙∙O=C(CH3)2), A6-O=C(CH3)2 (AFB1O13-H+∙∙∙O=C(CH3)2) and A7-O=C(CH3)2 AFB1O12O13-H+∙∙∙O=C(CH3)2).
PhaseStructure/StabilityA3-O=C(CH3)2A4-O=C(CH3)2A6-O=C(CH3)2A7-O=C(CH3)2
GasStructure energy (kcal/mol)−815,867.5−815,867.3−815,862.2−815,865.0
Interaction energy (kcal/mol)−14.0−18.9−22.1−16.6
WaterStructure energy (kcal/mol)−815,908.0−815,910.0−815,905.2−815,903.0
Interaction energy (kcal/mol)−5.2−7.3−11.4−5.4

