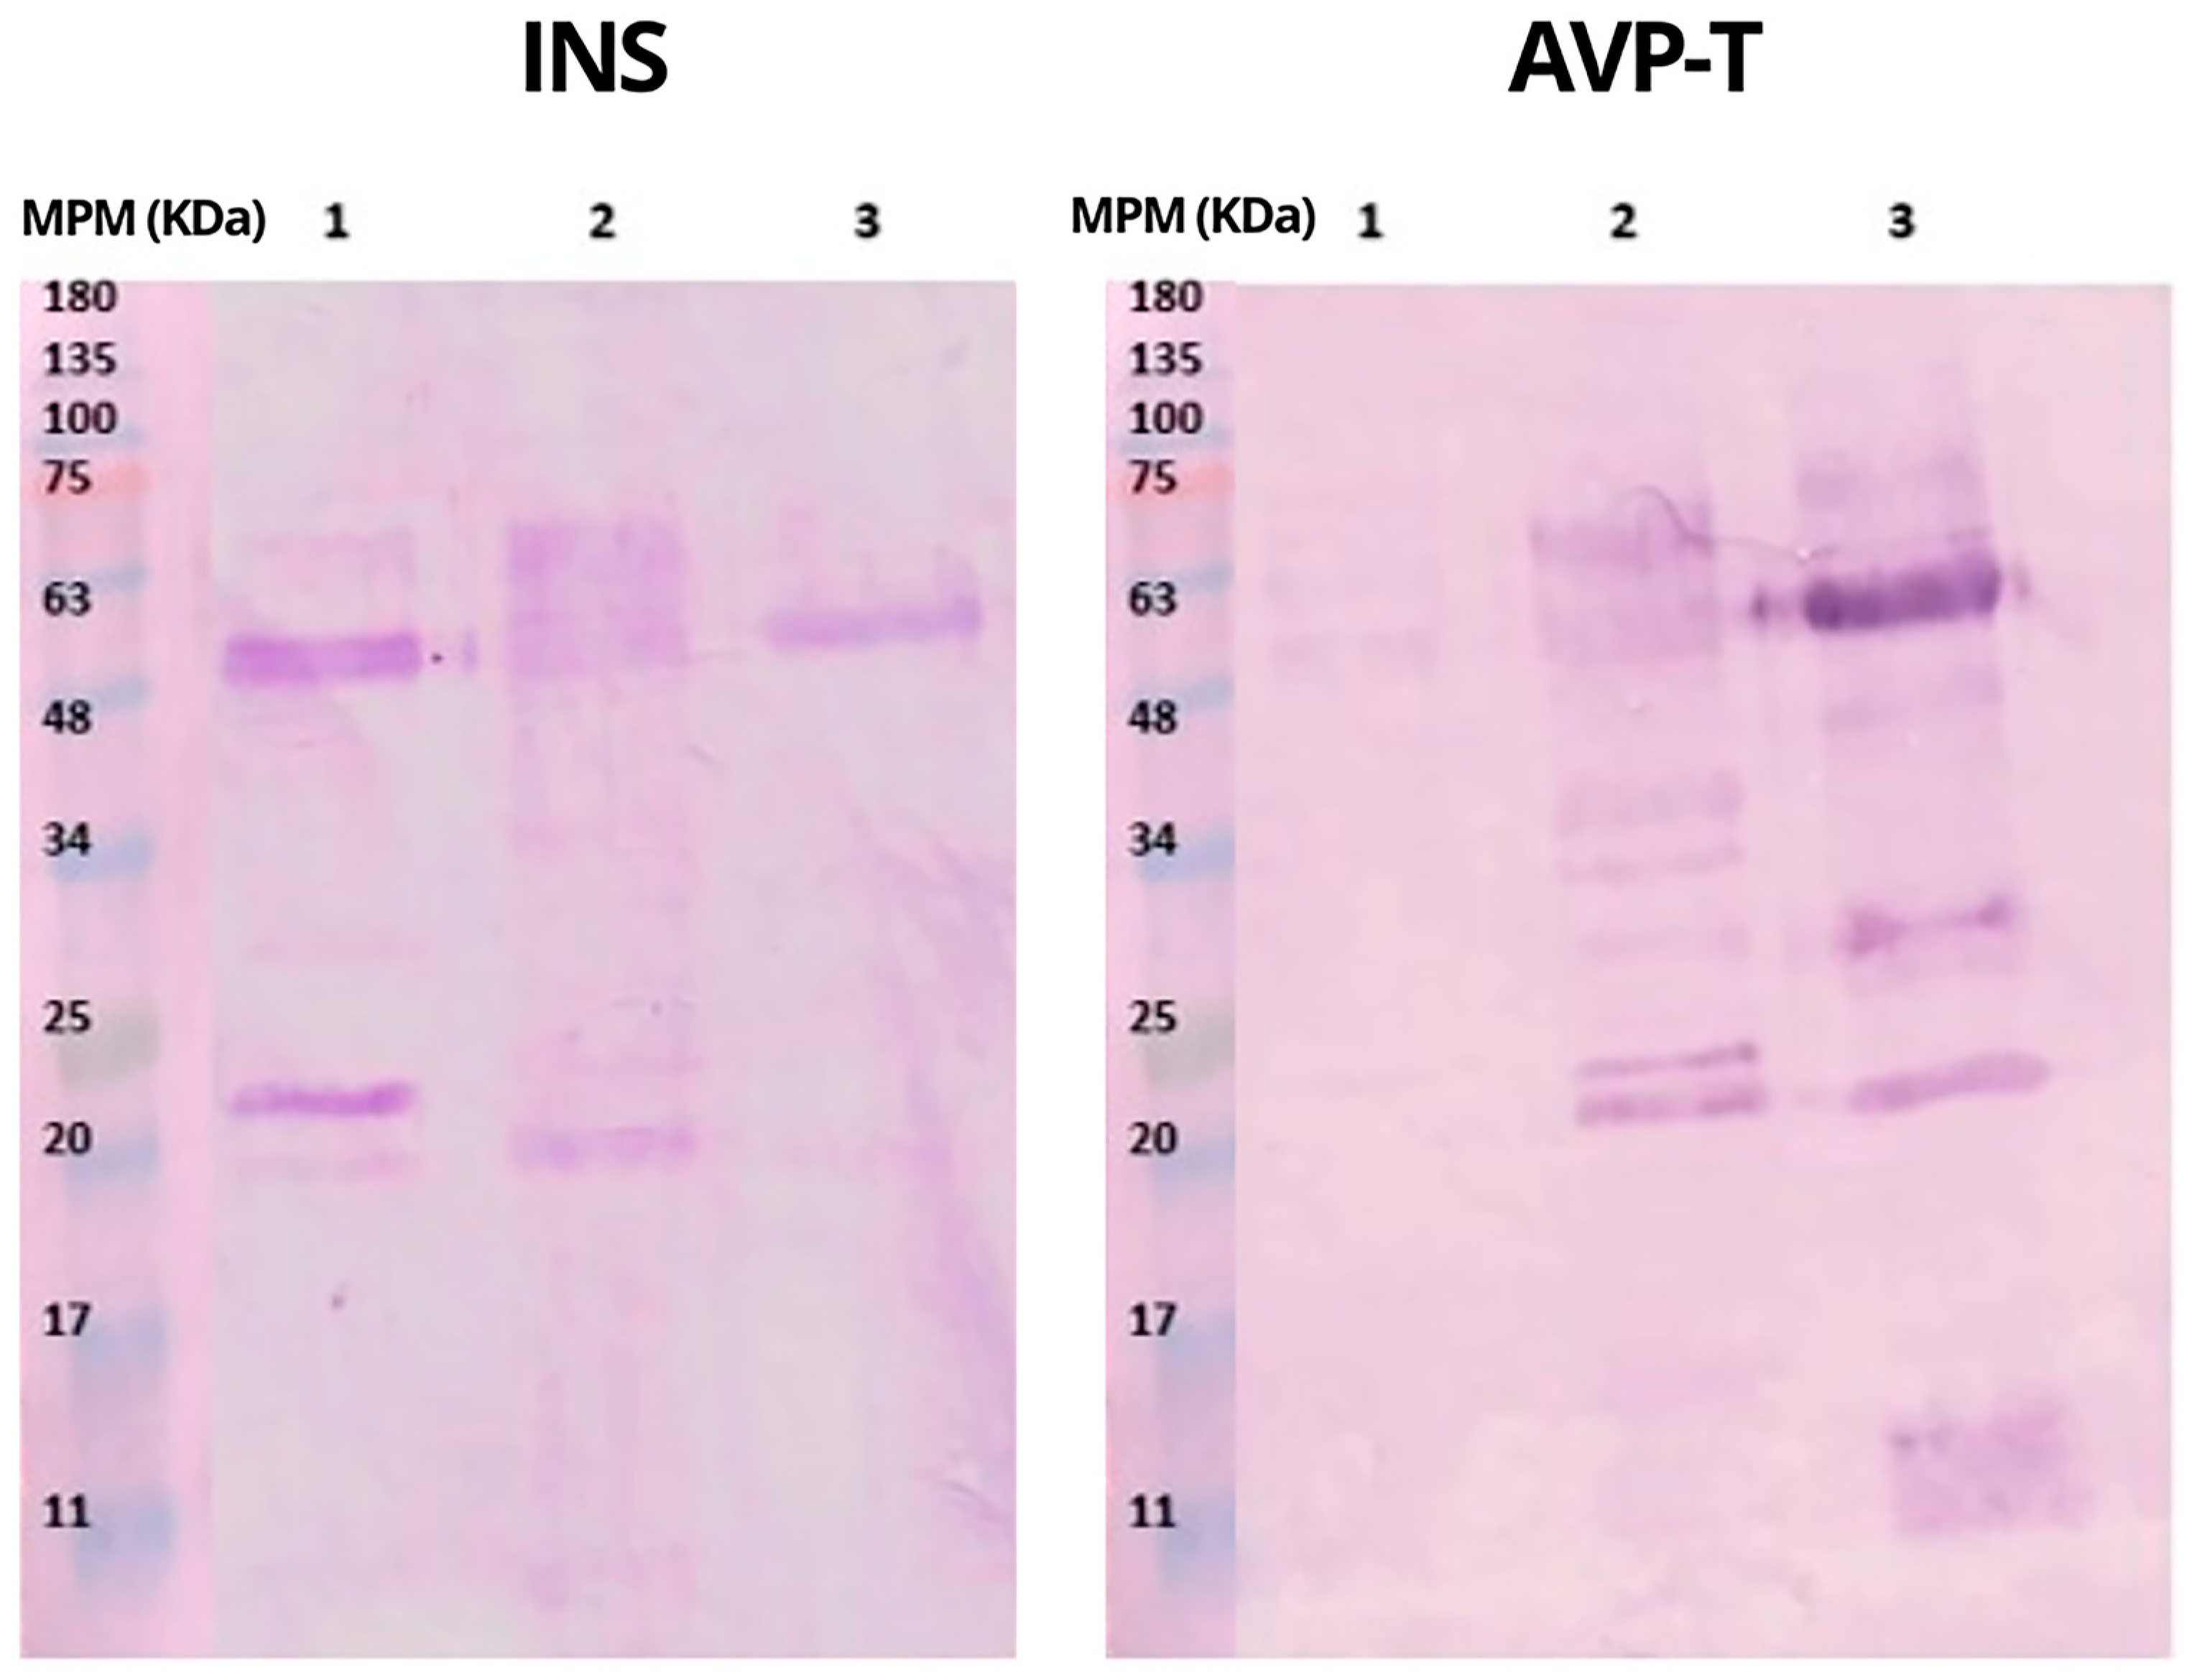
2.1. Protein Profile of Venoms and Antivenoms
The electrophoretic profiles of INS and AVP-T antivenoms and
B. rhombeatus venom are shown in
Figure 2. The electrophoretic and chromatographic analytical methods are used to make a qualitative comparison of the venoms’ protein compositions. Some authors state the importance of electrophoretic and chromatographic analytical results as a step before neutralizing capacity analysis or coupling essays, even before antivenom production, in order to perform an evaluation of their purity, optimize the antivenoms’ production, and identify new bioactive components [
14]. To corroborate the protein fractions found, the results are compared with global databases where the molecular weight of snake venom proteins has been standardized, e.g.,
www.rcsb.org (accesed on 15 January 2022)
www.uniprot.org (accesed on 20 July 2021).
Under reducing conditions, INS antivenom showed conspicuous protein bands between 48 and 70 kDa and bands of lower intensity between 25 and 30 kDa; in addition, a band at 70 kDa and another around 170 kDa indicated the presence of high-molecular-weight aggregates [
14], while, under non-reducing conditions, INS antivenom showed a band of 180 kDa. The AVP-T antivenom showed a large band between 20 and 30 kDa and two other bands of lower intensity at 63 and 75 kDa under reducing conditions (
Figure 2).
In
Figure 2 and
Figure 3, the venom of
B. rhombeatus showed four notable bands of 48, 25, 20, and 11 kDa and five bands of lower intensity of 63, 45, 34, 30, and 9 kDa. In
Figure 3, the electrophoretic profiles of the venom of
B. rhombeatus,
B. asper, and
B. atrox were compared under both reducing and non-reducing conditions. Under reducing conditions,
B. asper venom showed two high-intensity bands of 20 and 11 kDa, a series of lower-intensity bands between 48 and 75 kDa, and three other bands of 30, 20, and 15 kDa of low intensity. The
B. atrox venom showed two high-intensity bands at 48 and 20 kDa and lower-intensity bands at 75, 40, 34, 30, 30, 28, and 11 kDa. However, under non-reducing conditions, the venoms showed different profiles.
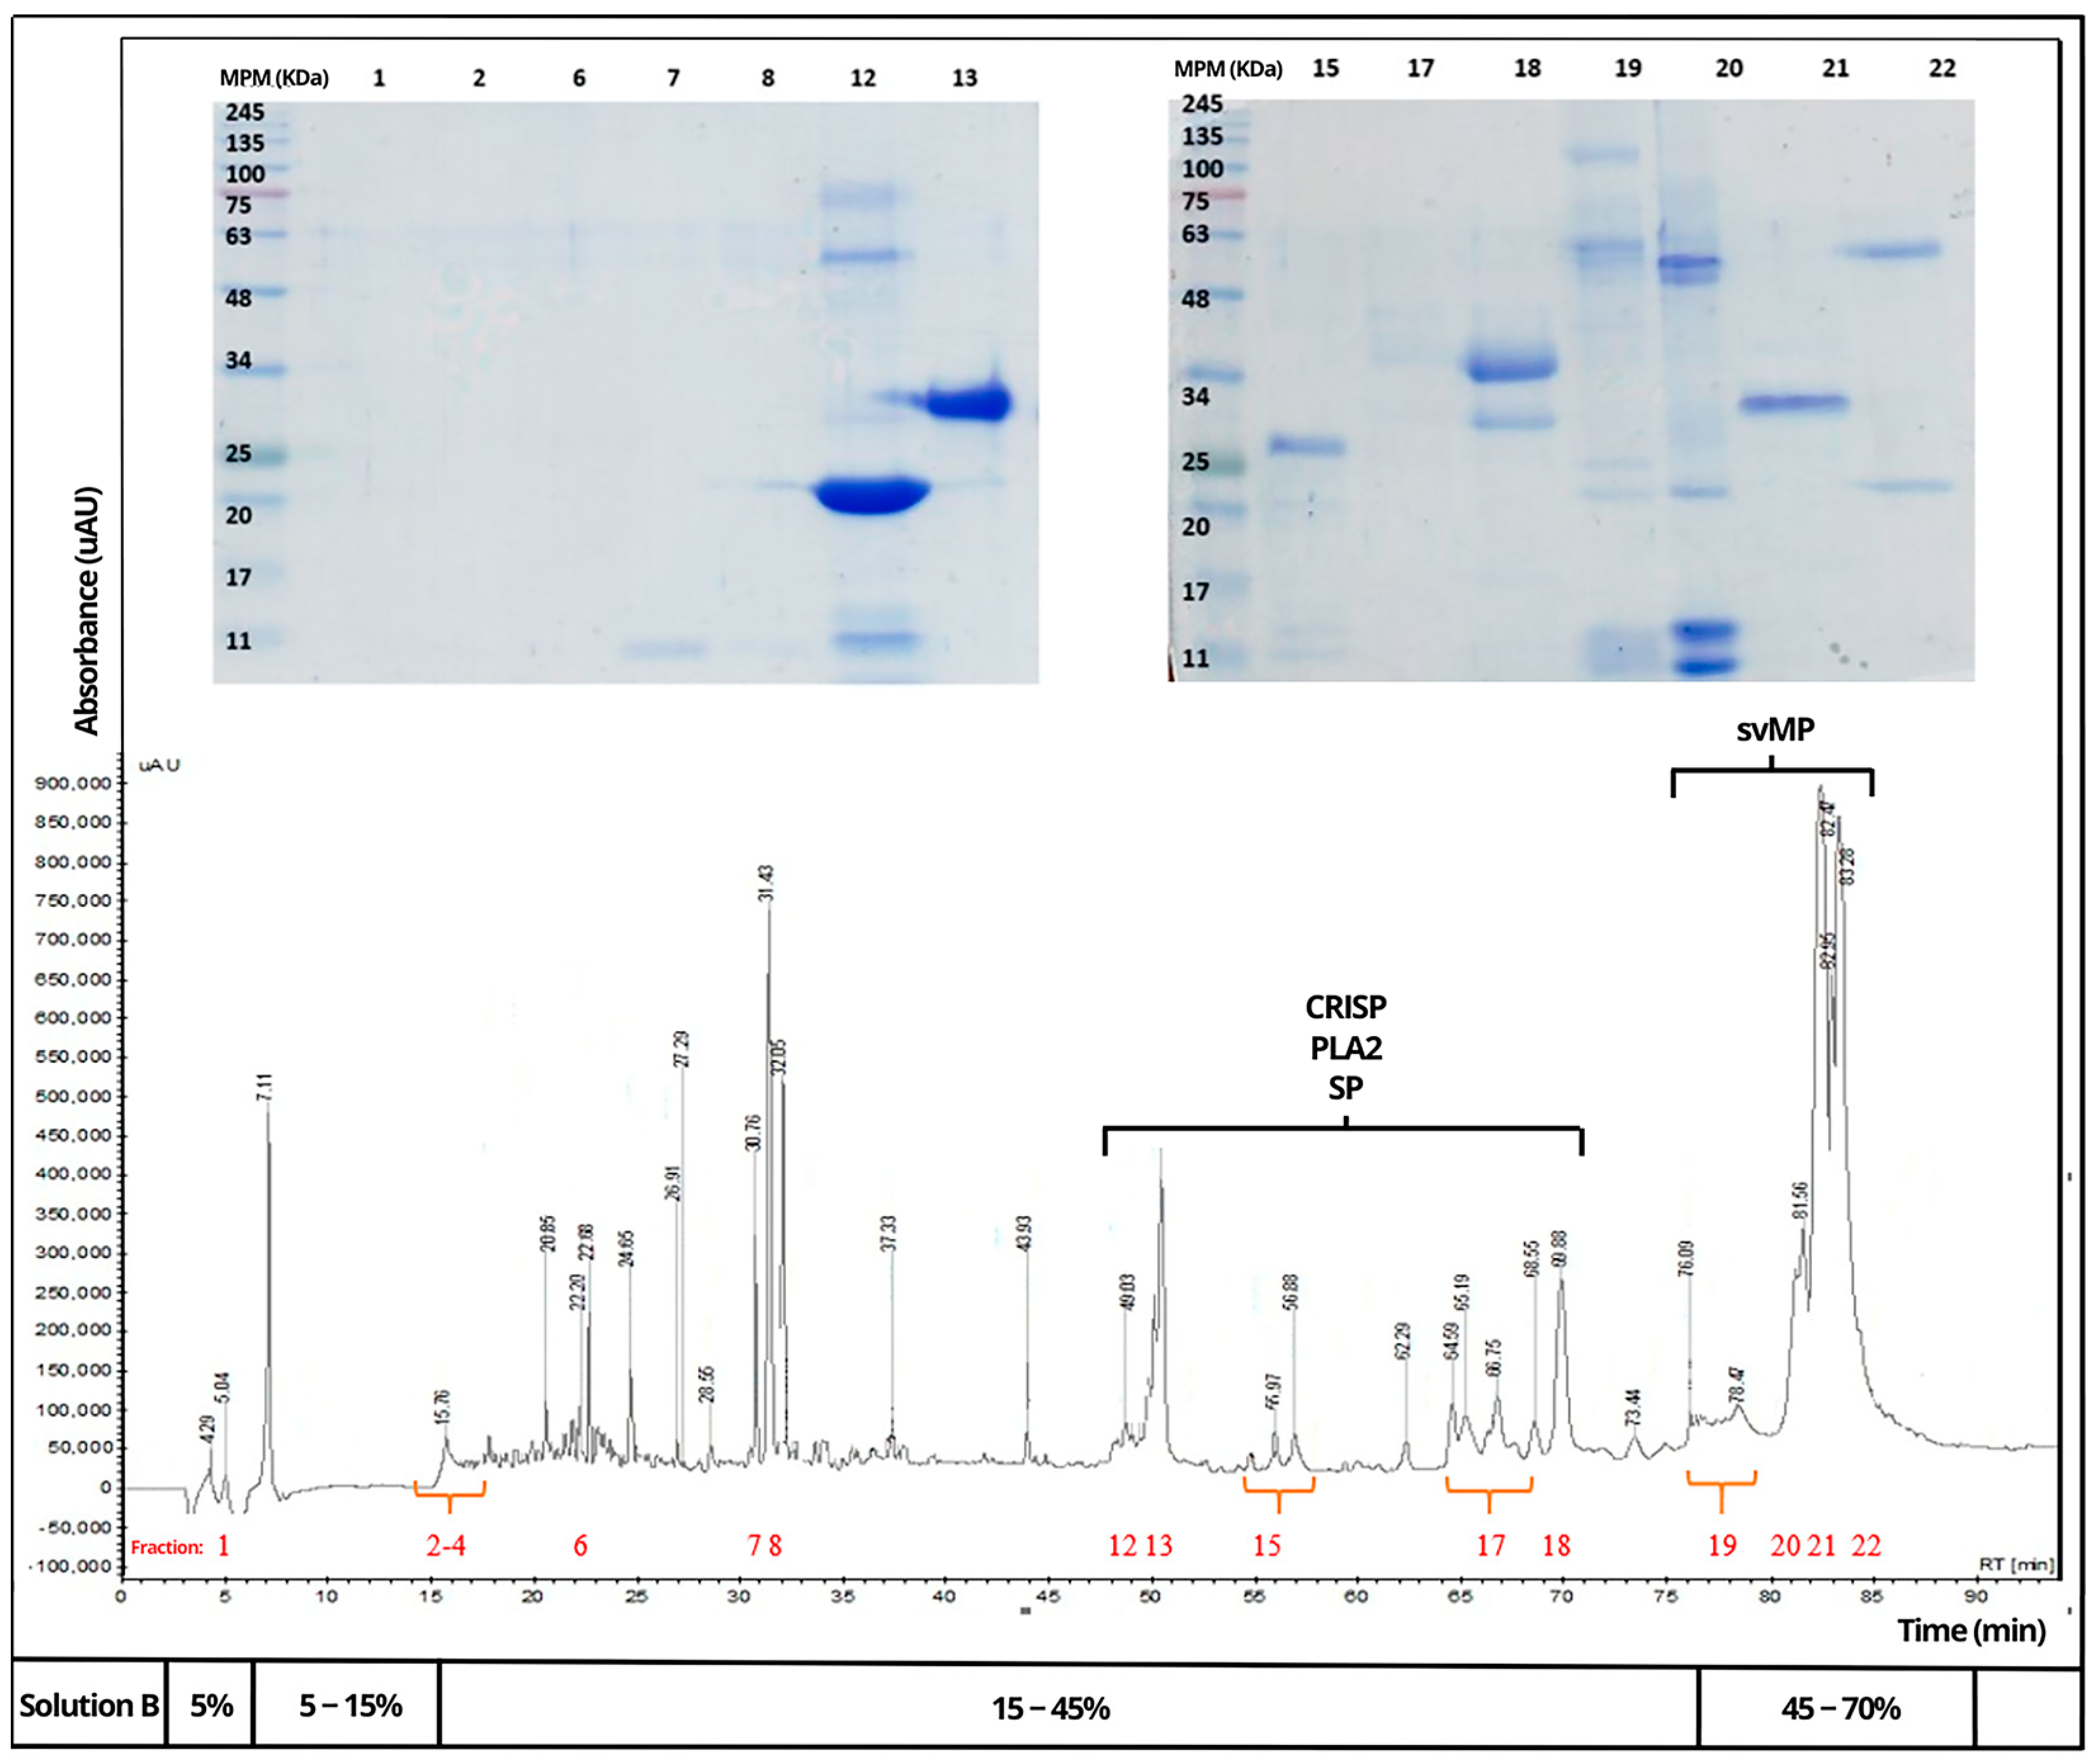
Venoms of
B. rhombeatus (
Figure 4),
B. asper (
Figure 5), and
B. atrox (
Figure 6) were analyzed by reverse-phase HPLC fractionation and SDS-PAGE following the suggestions from researchers considering the protein characterization of the
Viperidae family and specifically the
Bothrops genus in Latin America [
15,
16], and because of the previous analysis of a large diversity of viperid venoms, rapid comparison of toxin profiles and classification of chromatographic fractions into protein families was possible without the need for extensive structural characterization [
6].
Chromatograms of the three venoms showed that they share similar components within some protein families, mainly cysteine-rich secretory proteins (CRISPs), phospholipase A2 (PLA2), serine proteases (SPs), metalloproteinases (svMPs), and L-amino acid oxidases (LAAOs). In contrast, it was observed that the venom of B. rhombeatus presented a higher abundance of svMP III and I and PLA2, while a slight decrease in the concentration of svMP III and thrombin-like proteins was observed in the chromatograms of B. atrox, B. asper, and B. atrox.
2.2. Immunochemical Recognition
In ELISA tests, the level of recognition was expressed as a titer, defined as the concentration (μg mL) of antivenom required to achieve half of the maximum response (measured as Abs 405 nm) (
Table 1).
ELISA assays showed that a higher concentration of INS antivenom was required to achieve half the maximum recognition response to
B. rhombeatus venom compared to AVP-T antivenom. INS recognized
B. asper and
B. atrox venom, but it required higher concentrations to recognize the latter (
Table 1).
The AVP-T antivenom required the lowest concentration to recognize the components of
B. atrox venom, followed by
B. rhombeatus venom, and finally
B. asper (
Table 1 and
Figure 6). Statistical analysis with ANOVA showed statistically significant differences between the antivenoms concerning the amount of each antivenom required to reach half of the maximum recognition response to the antivenoms, performing the analysis by blocks according to each antivenom. With a calculated F value greater than the critical F and a
p less than 0.05, the hypothesis of equality with 95% confidence was rejected.
The ANOVA results indicate that, despite the observed immunochemical recognition, in clinical practice, different amounts of both antivenoms are required to achieve 50% recognition of a specific venom, confirming the fact that one vial of antivenom does not recognize the same amount of venom for an entire genus, as currently detailed in the inserts of the drugs in question, and furthermore, the need to promote region-specific antivenoms is indisputable since there should be more direct recognition than cross-reactivity. Although greater recognition by the homologous antivenom is expected, it is possible that a venom to which it is not immunized has a higher proportion of some well-recognized proteins and is, therefore, better recognized than the homologous antivenom, which has been described in different studies with
Bothrops venom [
17,
18].
Western blot (
Figure 7) evidenced immunochemical recognition of INS and AVP-T antivenoms; however, an adequate recognition of the protein components of
B. rhombeatus by AVP-T was not shown. On the other hand, both antivenoms demonstrated good recognition of
B. asper and
B. atrox venoms.
These results show the possible recognition of the protein fractions of the three venoms through the location of the bands. With AVP-T antivenom, mild-intensity recognition bands were observed around 50 kDa, possibly svMP III of B. rhombeatus venom. From B. asper venom, bands between 20 and 75 kDa, possibly svMP I and III, were observed, while for B. atrox venom, recognition around 48–50 kDa was observed, together with other bands of lower intensity of 75, 35, 25, 20, and 11 kDa, possibly svMP III and I and PLA2, respectively.
The INS antivenom also showed protein recognition in all three venoms. For the venoms of B. rhombeatus and B. asper, recognition of bands at 48 and 25 kDa, possibly svMP III and I, was observed, respectively; meanwhile, for the venom of B. atrox, recognition of a band around 50 kDa, possibly svMP III, was observed.
Comparing the results of this experiment with those obtained in the ELISA assays, it can be inferred that INS requires more antivenom to have a 50% recognition level and binds mainly to the svMP I and III fractions of B. rhombeatus venom, while AVP-T requires less antivenom to obtain the same recognition.
Both antivenoms were similar in terms of recognition of svMP III and I of
B. asper; however, in the ELISA results, a statistically significant difference was found in the amount of antivenom required for this recognition. It can be inferred that these antivenoms can easily identify
B. asper proteins, possibly secondary to the similarity of these proteins between species of the same genus reported by some researchers [
19,
20,
21]. The INS antivenom did not recognize the 11 kDa fractions, possibly the PLA2 of
B. atrox. AVP-T recognized the highest amount of
B. asper and
B. atrox venom fractions, similar to findings by other authors [
22,
23].
Affinity chromatography evidenced that both antivenoms were effectively bound to fractions isolated from
B. rhombeatus and
B. asper venoms. INS bound to
B. rhombeatus venom fractions at 94.2% while AVP-T bound at 90.4%. For
B. asper venom as a control, INS had 92.7% coupling while AVP-T had 96.6% (
Table 2), in concordance with Mora-Obando’s findings (
Table 1) [
19].
Considering the above tests, it can be deduced that the two antivenoms recognized most of the fractions of
B. rhombeatus and
B. asper venoms; however, both required high concentrations to achieve immunochemical recognition. The coupling of the antivenoms to the venoms was observed in the corresponding electrophoresis (
Figure 8). Recognition of the protein fractions of the venom of
B. rhombeatus and
B. asper with both antivenoms was found, possibly through heterologous recognition since many fractions of the venoms are similar between the species.
In
Figure 8, columns 1 to 4 correspond to fractions recognized in the
B. rhombeatus venom. Columns 1–2 correspond to INS and columns 3–4 to AVP-T. Column 1 (INS +
B. rhombeatus fractions 3–7) had the lowest recognition compared with columns 2 to 4. On the other hand, 5 to 8 correspond to fractions recognized in B. asper venom. Column 7 (AVP-T +
B asper fractions 3–7) showed the lowest recognition compared with the others. Both antivenoms were coupled to svMP I and svMP II with defined bands, while for PLA2, a better coupling signal with AVP-T was observed. These results suggest a high affinity of the two antivenoms to svMP I and II of
B. rhombeatus. For
B. asper venom, better binding was observed for most of the protein fractions to both antivenoms. Subsequently,
Table 3 shows an association of the fractions possibly recognized by the antivenoms according to the intensity level of the bands observed in electrophoresis. CRISP, svMP I, and SP proteins are found in a range between 20 and 25 kDa; therefore, differences found in the antivenom couplings for these proteins were measured together.
The intensity of the band’s electrophoretic coloration was measured subjectively and
Figure 8 demonstrated that the coupling of the collected second fraction by HPLC had a higher intensity than the first ones. CRISP, svMP I, and SP are located in the 20–25 kDa range, which suggests, because of the band’s intensity, a high coupling of both antivenoms with these proteins of
B. rhombeatus and
B. asper venoms (
Table 3).
INS and AVP-T antivenom recognized the B. rhombeatus venom fractions but to different extents, requiring more INS antivenom to have 50% immunochemical recognition (ED50). Similarly, AVP-T recognized svMP III fractions from B. rhombeatus venom and bound 90% of the venom used; however, it required less antivenom and showed a higher number of bound fractions in electrophoresis following affinity chromatography.
It should be recalled that both antivenoms presented a possible cross-reactivity coupling, since neither was elaborated with B. rhombeatus venom, and recognized some fractions of the venom mentioned previously, which are not necessarily those that present the greatest clinical effect or severity in ophidiotoxicosis, for which reason, it is not possible to conclude with certainty which antivenom is best for counteracting the clinical effects of B. rhombeatus venom, and it is necessary to perform a complete toxicological characterization for this venom.

 ,
, 


