Nanofractionation Analytics for Comparing MALDI-MS and ESI-MS Data of Viperidae Snake Venom Toxins

 , , and
Abstract
1. Introduction
2. Results and Discussion
3. Discussion
4. Conclusions
5. Experimental
5.1. Reagents
5.2. Venoms
5.3. Nanofractionation Analytics
5.4. MALDI-MS Measurements
5.5. Online (LC-)ESI-MS Measurements
5.6. Delay Time Calculation between LC-UV, LC-MS, and LC-Nano Fractionation
5.7. Coagulation Bioassay
Supplementary Materials
Author Contributions
Funding
Institutional Review Board Statement
Informed Consent Statement
Data Availability Statement
Conflicts of Interest
References
- Kasturiratne, A.; Wickremasinghe, A.R.; De Silva, N.; Gunawardena, N.K.; Pathmeswaran, A.; Premaratna, R.; Savioli, L.; Lalloo, D.G.; De Silva, H.J. The global burden of snakebite: A literature analysis and modelling based on regional estimates of envenoming and deaths. PLoS Med. 2008, 5, e218. [Google Scholar] [CrossRef]
- Williams, D.J.; Faiz, M.A.; Abela-Ridder, B.; Ainsworth, S.; Bulfone, T.C.; Nickerson, A.D.; Habib, A.G.; Junghanss, T.; Fan, H.W.; Turner, M.; et al. Strategy for a globally coordinated response to a priority neglected tropical disease: Snakebite envenoming. PLoS Negl. Trop. Dis. 2019, 13, e0007059. [Google Scholar] [CrossRef]
- Gutiérrez, J.M.; Calvete, J.J.; Habib, A.G.; Harrison, R.A.; Williams, D.J.; Warrell, D.A. Snakebite envenoming. Nat. Rev. Dis. Primers 2017, 3, 17063. [Google Scholar] [CrossRef] [PubMed]
- Lancet, T. Snakebite—Emerging from the shadows of neglect. Lancet 2019, 393, 2175. [Google Scholar] [CrossRef]
- Slagboom, J.; Kool, J.; Harrison, R.A.; Casewell, N.R. Haemotoxic snake venoms: Their functional activity, impact on snakebite victims and pharmaceutical promise. Br. J. Haematol. 2017, 177, 947–959. [Google Scholar] [CrossRef] [PubMed]
- Waheed, H.; Moin, S.F.; Choudhary, M.I. Snake Venom: From Deadly Toxins to Life-saving Therapeutics. Curr. Med. Chem. 2017, 24, 1874–1891. [Google Scholar] [CrossRef]
- Sanhajariya, S.; Duffull, S.B.; Isbister, G.K. Pharmacokinetics of Snake Venom. Toxins 2018, 10, 73. [Google Scholar] [CrossRef]
- Tasoulis, T.; Isbister, G.K. A Review and Database of Snake Venom Proteomes. Toxins 2017, 9, 290. [Google Scholar] [CrossRef]
- Kini, R.M. Toxins in thrombosis and haemostasis: Potential beyond imagination. J. Thromb. Haemost. 2011, 9, 195–208. [Google Scholar] [CrossRef]
- Kini, R.M. Serine proteases affecting blood coagulation and fibrinolysis from snake venoms. Pathophysiol. Haemost. Thromb. 2006, 34, 200–204. [Google Scholar] [CrossRef]
- Gutiérrez, J.M.; Escalante, T.; Rucavado, A.; Herrera, C. Hemorrhage Caused by Snake Venom Metalloproteinases: A Journey of Discovery and Understanding. Toxins 2016, 8, 93. [Google Scholar] [CrossRef]
- Preciado, L.M.; Pereañez, J.A.; Comer, J. Potential of Matrix Metalloproteinase Inhibitors for the Treatment of Local Tissue Damage Induced by a Type P-I Snake Venom Metalloproteinase. Toxins 2019, 12, 8. [Google Scholar] [CrossRef] [PubMed]
- Gutiérrez, J.M.; Rucavado, A. Snake venom metalloproteinases: Their role in the pathogenesis of local tissue damage. Biochimie 2000, 82, 841–850. [Google Scholar] [CrossRef] [PubMed]
- Sunagar, K.; Jackson, T.N.W.; Reeks, T.; Fry, B.G. Group I phospholipase A2 enzymes. In Venomous Reptiles and Their Toxins: Evolution, Pathophysiology and Biodiscovery; Oxford University Press: Oxford, UK, 2015; pp. 324–327. [Google Scholar]
- Xiao, H.; Pan, H.; Liao, K.; Yang, M.; Huang, C. Snake Venom PLA2, a Promising Target for Broad-Spectrum Antivenom Drug Development. BioMed Res. Int. 2017, 2017, 6592820. [Google Scholar]
- Slagboom, J.; Kaal, C.; Arrahman, A.; Vonk, F.J.; Somsen, G.W.; Calvete, J.J.; Wüster, W.; Kool, J. Analytical strategies in venomics. Microchem. J. 2022, 175, 107187. [Google Scholar] [CrossRef]
- El Aziz, T.M.A.; Bourgoin-Voillard, S.; Combemale, S.; Beroud, R.; Fadl, M.; Seve, M.; De Waard, M. Fractionation and proteomic analysis of the Walterinnesia aegyptia snake venom using OFFGEL and MALDI-TOF-MS techniques. Electrophoresis 2015, 36, 2594–2605. [Google Scholar] [CrossRef]
- Brinkman, D.; Burnell, J. Partial purification of cytolytic venom proteins from the box jellyfish, Chironex fleckeri. Toxicon 2008, 51, 853–863. [Google Scholar] [CrossRef]
- Carbajal-Saucedo, A.; López-Vera, E.; Bénard-Valle, M.; Smith, E.N.; Zamudio, F.; de Roodt, A.R.; Olvera-Rodríguez, A. Isolation, characterization, cloning and expression of an alpha-neurotoxin from the venom of the Mexican coral snake Micrurus laticollaris (Squamata: Elapidae). Toxicon 2013, 66, 64–74. [Google Scholar] [CrossRef] [PubMed]
- Sánchez, E.E.; Soliz, L.A.; Ramírez, M.S.; Pérez, J.C. Partial characterization of a basic protein from Crotalus molossus molossus (northern blacktail rattlesnake) venom and production of a monoclonal antibody. Toxicon 2001, 39, 523–537. [Google Scholar] [CrossRef] [PubMed]
- Slagboom, J.; Mladić, M.; Xie, C.; Kazandjian, T.D.; Vonk, F.; Somsen, G.W.; Casewell, N.R.; Kool, J. High throughput screening and identification of coagulopathic snake venom proteins and peptides using nanofractionation and proteomics approaches. PLoS Negl. Trop. Dis. 2020, 14, e0007802. [Google Scholar] [CrossRef]
- Xie, C.; Albulescu, L.-O.; Still, K.B.M.; Slagboom, J.; Zhao, Y.; Jiang, Z.; Somsen, G.W.; Vonk, F.J.; Casewell, N.R.; Kool, J. Varespladib inhibits the phospholipase A2 and coagulopathic activities of venom components from hemotoxic snakes. Biomedicines 2020, 8, 165. [Google Scholar] [CrossRef] [PubMed]
- Mladic, M.; de Waal, T.; Burggraaff, L.; Slagboom, J.; Somsen, G.W.; Niessen, W.M.A.; Kini, R.M.; Kool, J. Rapid screening and identification of ACE inhibitors in snake venoms using at-line nanofractionation LC-MS. Anal. Bioanal. Chem. 2017, 409, 5987–5997. [Google Scholar] [CrossRef]
- Xie, C.; Bittenbinder, M.A.; Slagboom, J.; Arrahman, A.; Bruijns, S.; Somsen, G.W.; Vonk, F.J.; Casewell, N.R.; García-Vallejo, J.J.; Kool, J. Erythrocyte haemotoxicity profiling of snake venom toxins after nanofractionation. J. Chromatogr. B Anal. Technol. Biomed. Life Sci. 2021, 1176, 122586. [Google Scholar] [CrossRef]
- Bittenbinder, M.A.; Capinha, L.; Pereira, D.D.C.; Slagboom, J.; van de Velde, B.; Casewell, N.R.; Jennings, P.; Kool, J.; Vonk, F.J. Development of a high-throughput in vitro screening method for the assessment of cell-damaging activities of snake venoms. PLoS Negl. Trop. Dis. 2023, 17, e0011564. [Google Scholar] [CrossRef]
- Bickler, P.E. Amplification of Snake Venom Toxicity by Endogenous Signaling Pathways. Toxins 2020, 12, 68. [Google Scholar] [CrossRef]
- Bohlen, C.J.; Chesler, A.T.; Sharif-Naeini, R.; Medzihradszky, K.F.; Zhou, S.; King, D.; Sánchez, E.E.; Burlingame, A.L.; Basbaum, A.I.; Julius, D. A heteromeric Texas coral snake toxin targets acid-sensing ion channels to produce pain. Nature 2011, 479, 410–414. [Google Scholar] [CrossRef] [PubMed]
- Suntravat, M.; Sanchez, O.; Reyes, A.; Cirilo, A.; Ocheltree, J.S.; Galan, J.A.; Salazar, E.; Davies, P.; Sanchez, E.E. Evaluation of signaling pathways profiling in human dermal endothelial cells treated by snake venom cysteine-rich secretory proteins (Svcrisps) from north american snakes using reverse phase protein array (rppa). Toxins 2021, 13, 613. [Google Scholar] [CrossRef]
- Gutiérrez, J.M.; Lomonte, B.; León, G.; Alape-Girón, A.; Flores-Díaz, M.; Sanz, L.; Angulo, Y.; Calvete, J.J. Snake venomics and antivenomics: Proteomic tools in the design and control of antivenoms for the treatment of snakebite envenoming. J. Proteom. 2009, 72, 165–182. [Google Scholar] [CrossRef]
- Fry, B.G.; Wüster, W.; Ramjan, S.F.R.; Jackson, T.; Martelli, P.; Kini, R.M. Analysis of Colubroidea snake venoms by liquid chromatography with mass spectrometry: Evolutionary and toxinological implications. Rapid Commun. Mass Spectrom. 2003, 17, 2047–2062. [Google Scholar] [CrossRef]
- Petras, D.; Heiss, P.; Süssmuth, R.D.; Calvete, J.J. Venom proteomics of indonesian king cobra, ophiophagus hannah: Integrating top-down and bottom-up approaches. J. Proteome Res. 2015, 14, 2539–2556. [Google Scholar] [CrossRef] [PubMed]
- Valente, R.H.; Nicolau, C.A.; Perales, J.; Neves-Ferreira, A.G. Snake Venom Proteopeptidomics: What Lies Behind the Curtain. In Venom Genomics and Proteomics; Springer: Dordrecht, The Netherlands, 2016. [Google Scholar] [CrossRef]
- Wilm, M. Principles of electrospray ionization. Mol. Cell. Proteom. 2011, 10, M111.009407. [Google Scholar] [CrossRef]
- Xie, C.; Albulescu, L.-O.; Bittenbinder, M.A.; Somsen, G.W.; Vonk, F.J.; Casewell, N.R.; Kool, J. Neutralizing effects of small molecule inhibitors and metal chelators on coagulopathic Viperinae snake venom toxins. Biomedicines 2020, 8, 297. [Google Scholar] [CrossRef]
- Laustsen, A.H. Guiding recombinant antivenom development by omics technologies. New Biotechnol. 2018, 45, 19–27. [Google Scholar] [CrossRef]
- Vonk, F.J.; Casewell, N.R.; Henkel, C.V.; Heimberg, A.M.; Jansen, H.J.; McCleary, R.J.R.; Kerkkamp, H.M.E.; Vos, R.A.; Guerreiro, I.; Calvete, J.J.; et al. The king cobra genome reveals dynamic gene evolution and adaptation in the snake venom system. Proc. Natl. Acad. Sci. USA 2013, 110, 20651–20656. [Google Scholar] [CrossRef]
- McCleary, R.J.; Kini, R.M. Non-enzymatic proteins from snake venoms: A gold mine of pharmacological tools and drug leads. Toxicon 2013, 62, 56–74. [Google Scholar] [CrossRef] [PubMed]
- Boldrini-França, J.; Pinheiro-Junior, E.L.; Peigneur, S.; Pucca, M.B.; Cerni, F.A.; Borges, R.J.; Costa, T.R.; Carone, S.E.I.; Fontes, M.R.d.M.; Sampaio, S.V.; et al. Beyond hemostasis: A snake venom serine protease with potassium channel blocking and potential antitumor activities. Sci. Rep. 2020, 10, 4476. [Google Scholar] [CrossRef]
- Wagstaff, S.C.; Sanz, L.; Juárez, P.; Harrison, R.A.; Calvete, J.J. Combined snake venomics and venom gland transcriptomic analysis of the ocellated carpet viper, Echis ocellatus. J. Proteom. 2009, 71, 609–623. [Google Scholar] [CrossRef]
- Alape-Girón, A.; Flores-Díaz, M.; Sanz, L.; Madrigal, M.; Escolano, J.; Sasa, M.; Calvete, J.J. Studies on the venom proteome of Bothrops asper: Perspectives and applications. Toxicon 2009, 54, 938–948. [Google Scholar] [CrossRef]
- Calvete, J.J.; Fasoli, E.; Sanz, L.; Boschetti, E.; Righetti, P.G. Exploring the venom proteome of the western diamondback rattlesnake, Crotalus atrox, via snake venomics and combinatorial peptide ligand library approaches. J. Proteome Res. 2009, 8, 3055–3067. [Google Scholar] [CrossRef]
- Sharma, M.; Das, D.; Iyer, J.K.; Kini, R.M.; Doley, R. Unveiling the complexities of Daboia russelii venom, a medically important snake of India, by tandem mass spectrometry. Toxicon 2015, 107, 266–281. [Google Scholar] [CrossRef]
- Dingwoke, E.J.; Adamude, F.A.; Mohamed, G.; Klein, A.; Salihu, A.; Abubakar, M.S.; Sallau, A.B. Venom proteomic analysis of medically important Nigerian viper Echis ocellatus and Bitis arietans snake species. Biochem. Biophys. Rep. 2021, 28, 101164. [Google Scholar] [CrossRef]
- Zelanis, A.; Menezes, M.C.; Kitano, E.S.; Liberato, T.; Tashima, A.K.; Pinto, A.F.; Sherman, N.E.; Ho, P.L.; Fox, J.W.; Serrano, S.M. Proteomic identification of gender molecular markers in Bothrops jararaca venom. J. Proteom. 2016, 139, 26–37. [Google Scholar] [CrossRef]
- Patra, A.; Kalita, B.; Chanda, A.; Mukherjee, A.K. Proteomics and antivenomics of Echis carinatus carinatus venom: Correlation with pharmacological properties and pathophysiology of envenomation. Sci. Rep. 2017, 7, 17119. [Google Scholar] [CrossRef]
- Damm, M.; Hempel, B.-F.; Süssmuth, R.D. Old world vipers-a review about snake venom proteomics of viperinae and their variations. Toxins 2021, 13, 427. [Google Scholar] [CrossRef]
- Sajevic, T.; Leonardi, A.; Križaj, I. Haemostatically active proteins in snake venoms. Toxicon 2011, 57, 627–645. [Google Scholar] [CrossRef] [PubMed]
- Schiller, J.; Müller, K.; Süß, R.; Arnhold, J.; Gey, C.; Herrmann, A.; Leßig, J.; Arnold, K.; Müller, P. Analysis of the lipid composition of bull spermatozoa by MALDI-TOF mass spectrometry—A cautionary note. Phys. Lipids 2003, 126, 85–94. [Google Scholar] [CrossRef]
- Favreau, P.; Cheneval, O.; Menin, L.; Michalet, S.; Gaertner, H.; Principaud, F.; Thai, R.; Ménez, A.; Bulet, P.; Stöcklin, R. The venom of the snake genus Atheris contains a new class of peptides with clusters of histidine and glycine residues. Rapid Commun. Mass Spectrom. 2007, 21, 406–412. [Google Scholar] [CrossRef]
- Wermelinger, L.S.; Dutra, D.L.S.; Oliveira-Carvalho, A.L.; Soares, M.R.; Bloch, C.; Zingali, R.B. Fast analysis of low molecular mass compounds present in snake venom: Identification of ten new pyroglutamate-containing peptides. Rapid Commun. Mass Spectrom. 2005, 19, 1703–1708. [Google Scholar] [CrossRef] [PubMed]
- Newton, K.A.; Clench, M.R.; Deshmukh, R.; Jeyaseelan, K.; Strong, P.N. Mass fingerprinting of toxic fractions from the venom of the Indian red scorpion, Mesobuthus tamulus: Biotope-specific variation in the expression of venom peptides. Rapid Commun. Mass Spectrom. 2007, 21, 3467–3476. [Google Scholar] [CrossRef] [PubMed]
- Schwartz, E.F.; Camargos, T.S.; Zamudio, F.Z.; Silva, L.P.; Bloch, C.; Caixeta, F.; Schwartz, C.A.; Possani, L.D. Mass spectrometry analysis, amino acid sequence and biological activity of venom components from the Brazilian scorpion Opisthacanthus cayaporum. Toxicon 2008, 51, 1499–1508. [Google Scholar] [CrossRef]
- Mott, T.M.; Everley, R.A.; Wyatt, S.A.; Toney, D.M.; Croley, T.R. Comparison of MALDI-TOF/MS and LC-QTOF/MS methods for the identification of enteric bacteria. Int. J. Mass Spectrom. 2010, 291, 24–32. [Google Scholar] [CrossRef]


| Venom Species | RT | m/z | Charge | Mass in ESI (Da) | Intensity | Mass in MALDI (Matched) | Intensity (S/N) | Mass diff (MALDI-ESI) (Da) | Mass in MALDI (Unmatched) | Intensity (S/N) | Mass Matching Coverage (%) |
|---|---|---|---|---|---|---|---|---|---|---|---|
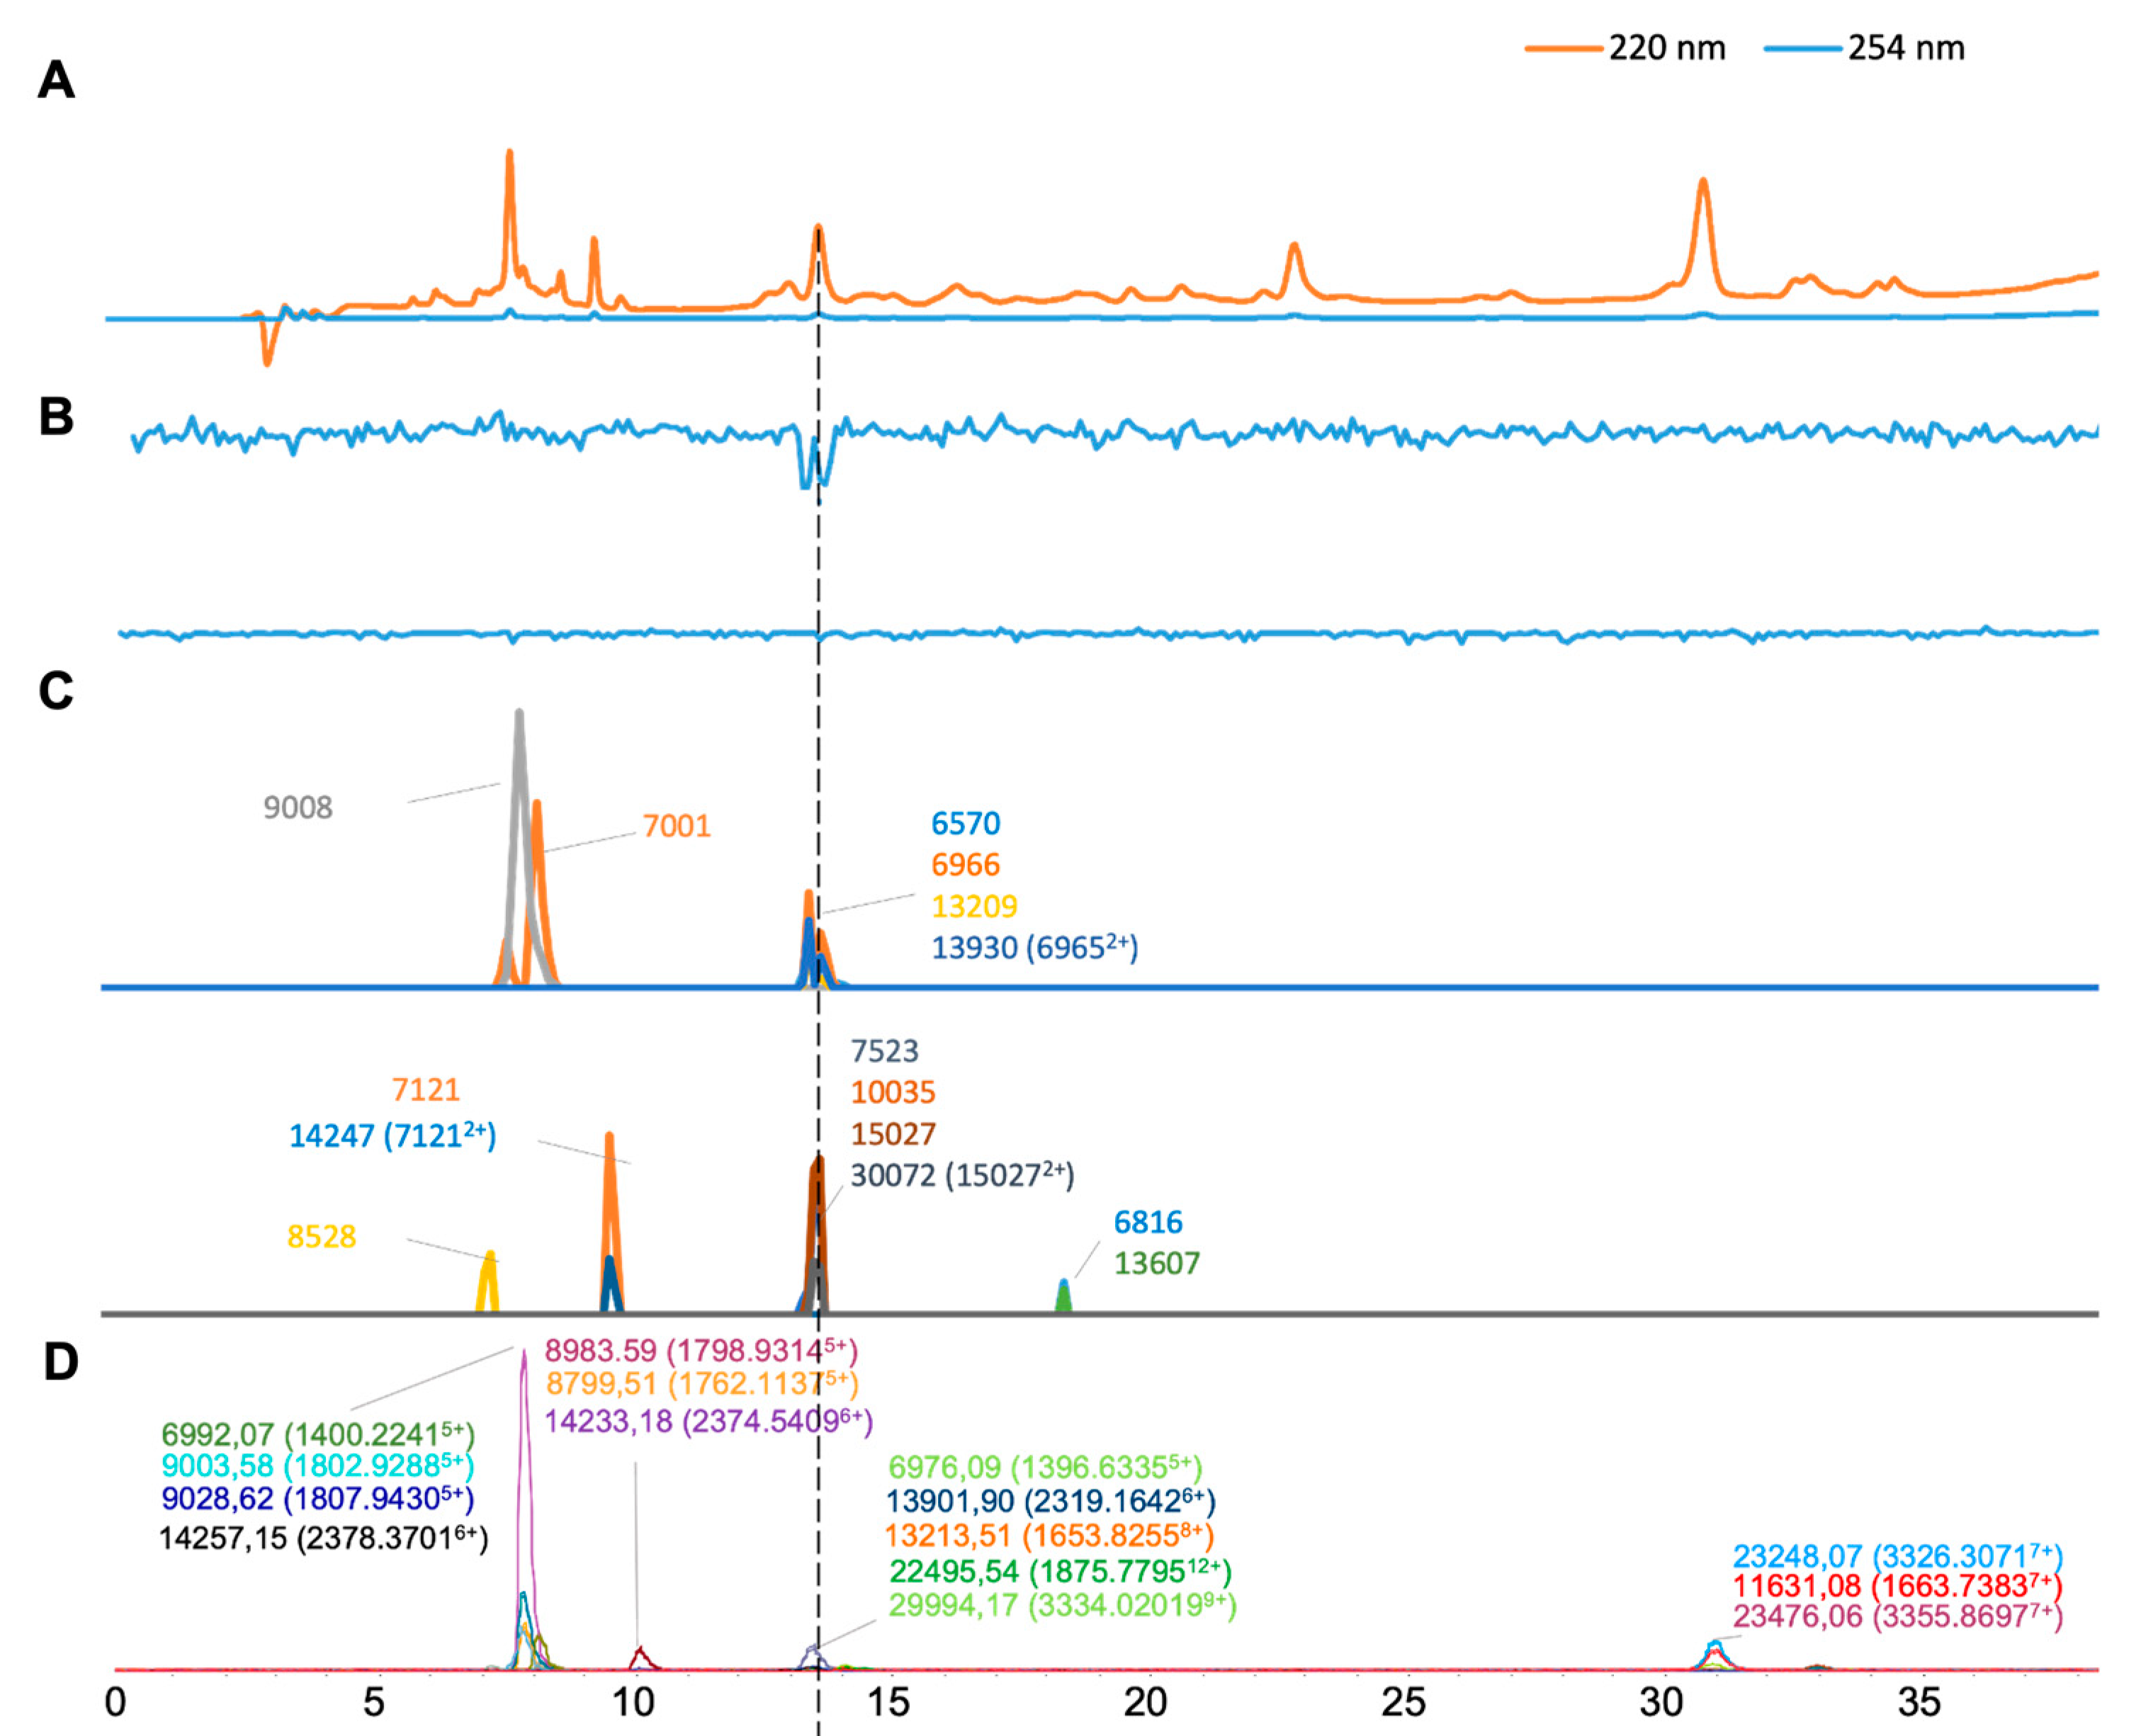
| Bitus arietans | 5.2–11.3 | 1400.2241 | 5 | 6992.07 | 12,306 | 7001 | 655 | 9 | 6570 | 237 | 25.00% |
| Figure 2 | 7.1–9.0 | 1396.6335 | 5 | 6976.09 | 1666 | 6966 | 607 | 10 | 8528 | 24 | |
| 7.3–11.1 | 1795.9314 | 5 | 8983.59 | 107,914 | 7523 | 17 | |||||
| 7.3–11.1 | 1802.9288 | 5 | 9003.58 | 14,870 | 9008 | 906 | 5 | 10,035 | 49 | ||
| 7.3–11.1 | 1807.943 | 5 | 9028.62 | 27,068 | 15,027 | 61 | |||||
| 7.3–11.1 | 1762.1137 | 5 | 8799.51 | 16,208 | 6816 | 13 | |||||
| 7.3–11.1 | 1807.943 | 5 | 9028.62 | 26,528 | 13,607 | 10 | |||||
| 9.8–10.8 | 2374.5409 | 6 | 14,233.18 | 7828 | 30,072 (15,0272+) | 21 | |||||
| 9.8–10.8 | 2378.3701 | 6 | 14,257.15 | 1140 | 13,930 (69662+) | 222 | |||||
| 12.5–13.7 | 1653.8255 | 8 | 13,213.51 | 1738 | 13,209 | 129 | 4 | 14,247 (71212+) | 22 | ||
| 12.5–13.7 | 2319.1642 | 6 | 13,901.89 | 8510 | |||||||
| 13.7–23.0 | 3334.0201 | 9 | 29,994.17 | 2114 | |||||||
| 13.7–23.0 | 1875.7795 | 12 | 22,495.54 | 1516 | |||||||
| 29.0–31.9 | 3326.3071 | 7 | 23,248.07 | 10,172 | |||||||
| 29.0–31.9 | 1663.7383 | 7 | 11,631.08 | 6924 | |||||||
| 31.8–36.7 | 3355.8697 | 7 | 23,476.06 | 2192 | |||||||
| Bothrops jararaca | 7.0–10.0 | 1554.6483 | 5 | 7756.07 | 36,618 | 7766 | 929 | 10 | 11,657 | 8 | 27.50% |
| Figure 3 | 7.0–10.0 | 1936.0262 | 4 | 7735.06 | 3556 | 23,287 | 3 | ||||
| 7.0–10.0 | 1464.6121 | 5 | 7313.01 | 8580 | 7309 | 277 | 4 | 7506 | 18 | ||
| 7.0–10.0 | 1504.6276 | 5 | 7514.07 | 4550 | 7505 | 18 | 9 | 7120 | 42 | ||
| 9.5–10.6 | 2766.5867 | 5 | 13,818.87 | 18,819 | 12 | 6851 | 55 | ||||
| 9.5–10.6 | 2286.4299 | 6 | 13,704.51 | 19,268 | 6901 | 42 | |||||
| 9.5–10.6 | 2758.799 | 5 | 13,780.39 | 5892 | 13,806 (69012+) | 14 | |||||
| 10.5–14.7 | 2467.7336 | 10 | 24,658.28 | 4216 | 9463 | 3 | |||||
| 14.8–21.2 | 2795.1658 | 9 | 25,142.31 | 3454 | 13,599 | 8 | |||||
| 14.8–21.2 | 3315.5253 | 8 | 26,512.17 | 2066 | 9885 | 3 | |||||
| 14.8–21.2 | 2036.9942 | 7 | 14,246.87 | 1794 | 14,240 (71192+) | 18 | 6.8 | 12,295 | 4 | ||
| 14.8–21.2 | 2281.9535 | 6 | 13,683.66 | 2650 | 13,684 | 38 | 0.44 | 16,367 | 6 | ||
| 20.9–24.0 | 2832.869 | 8 | 22,654.11 | 888 | 24,520 | 9 | |||||
| 23.9–24.9 | 3298.4789 | 7 | 23,075.34 | 1402 | 48,925 (24,5202+) | 8 | |||||
| 24.9–26.2 | 3287.0082 | 7 | 22,995.04 | 3146 | |||||||
| 26.3–27.3 | 1037.0304 | 6 | 6211.12 | 11,672 | |||||||
| 26.3–27.3 | 1646.8429 | 5 | 8224.16 | 2262 | 8220 | 3 | 4.16 | ||||
| 26.3–27.3 | 1769.5559 | 11 | 19,447.17 | 3096 | |||||||
| 26.3–27.3 | 2300.3188 | 10 | 22,978.01 | 3888 | |||||||
| 27.1–32.3 | 2897.6498 | 8 | 23,165.12 | 3588 | |||||||
| 32.2–37.1 | 2255.4149 | 11 | 24,778.20 | 3276 | |||||||
| 32.6–37.6 | 988.1154 | 10 | 9869.11 | 3034 | |||||||
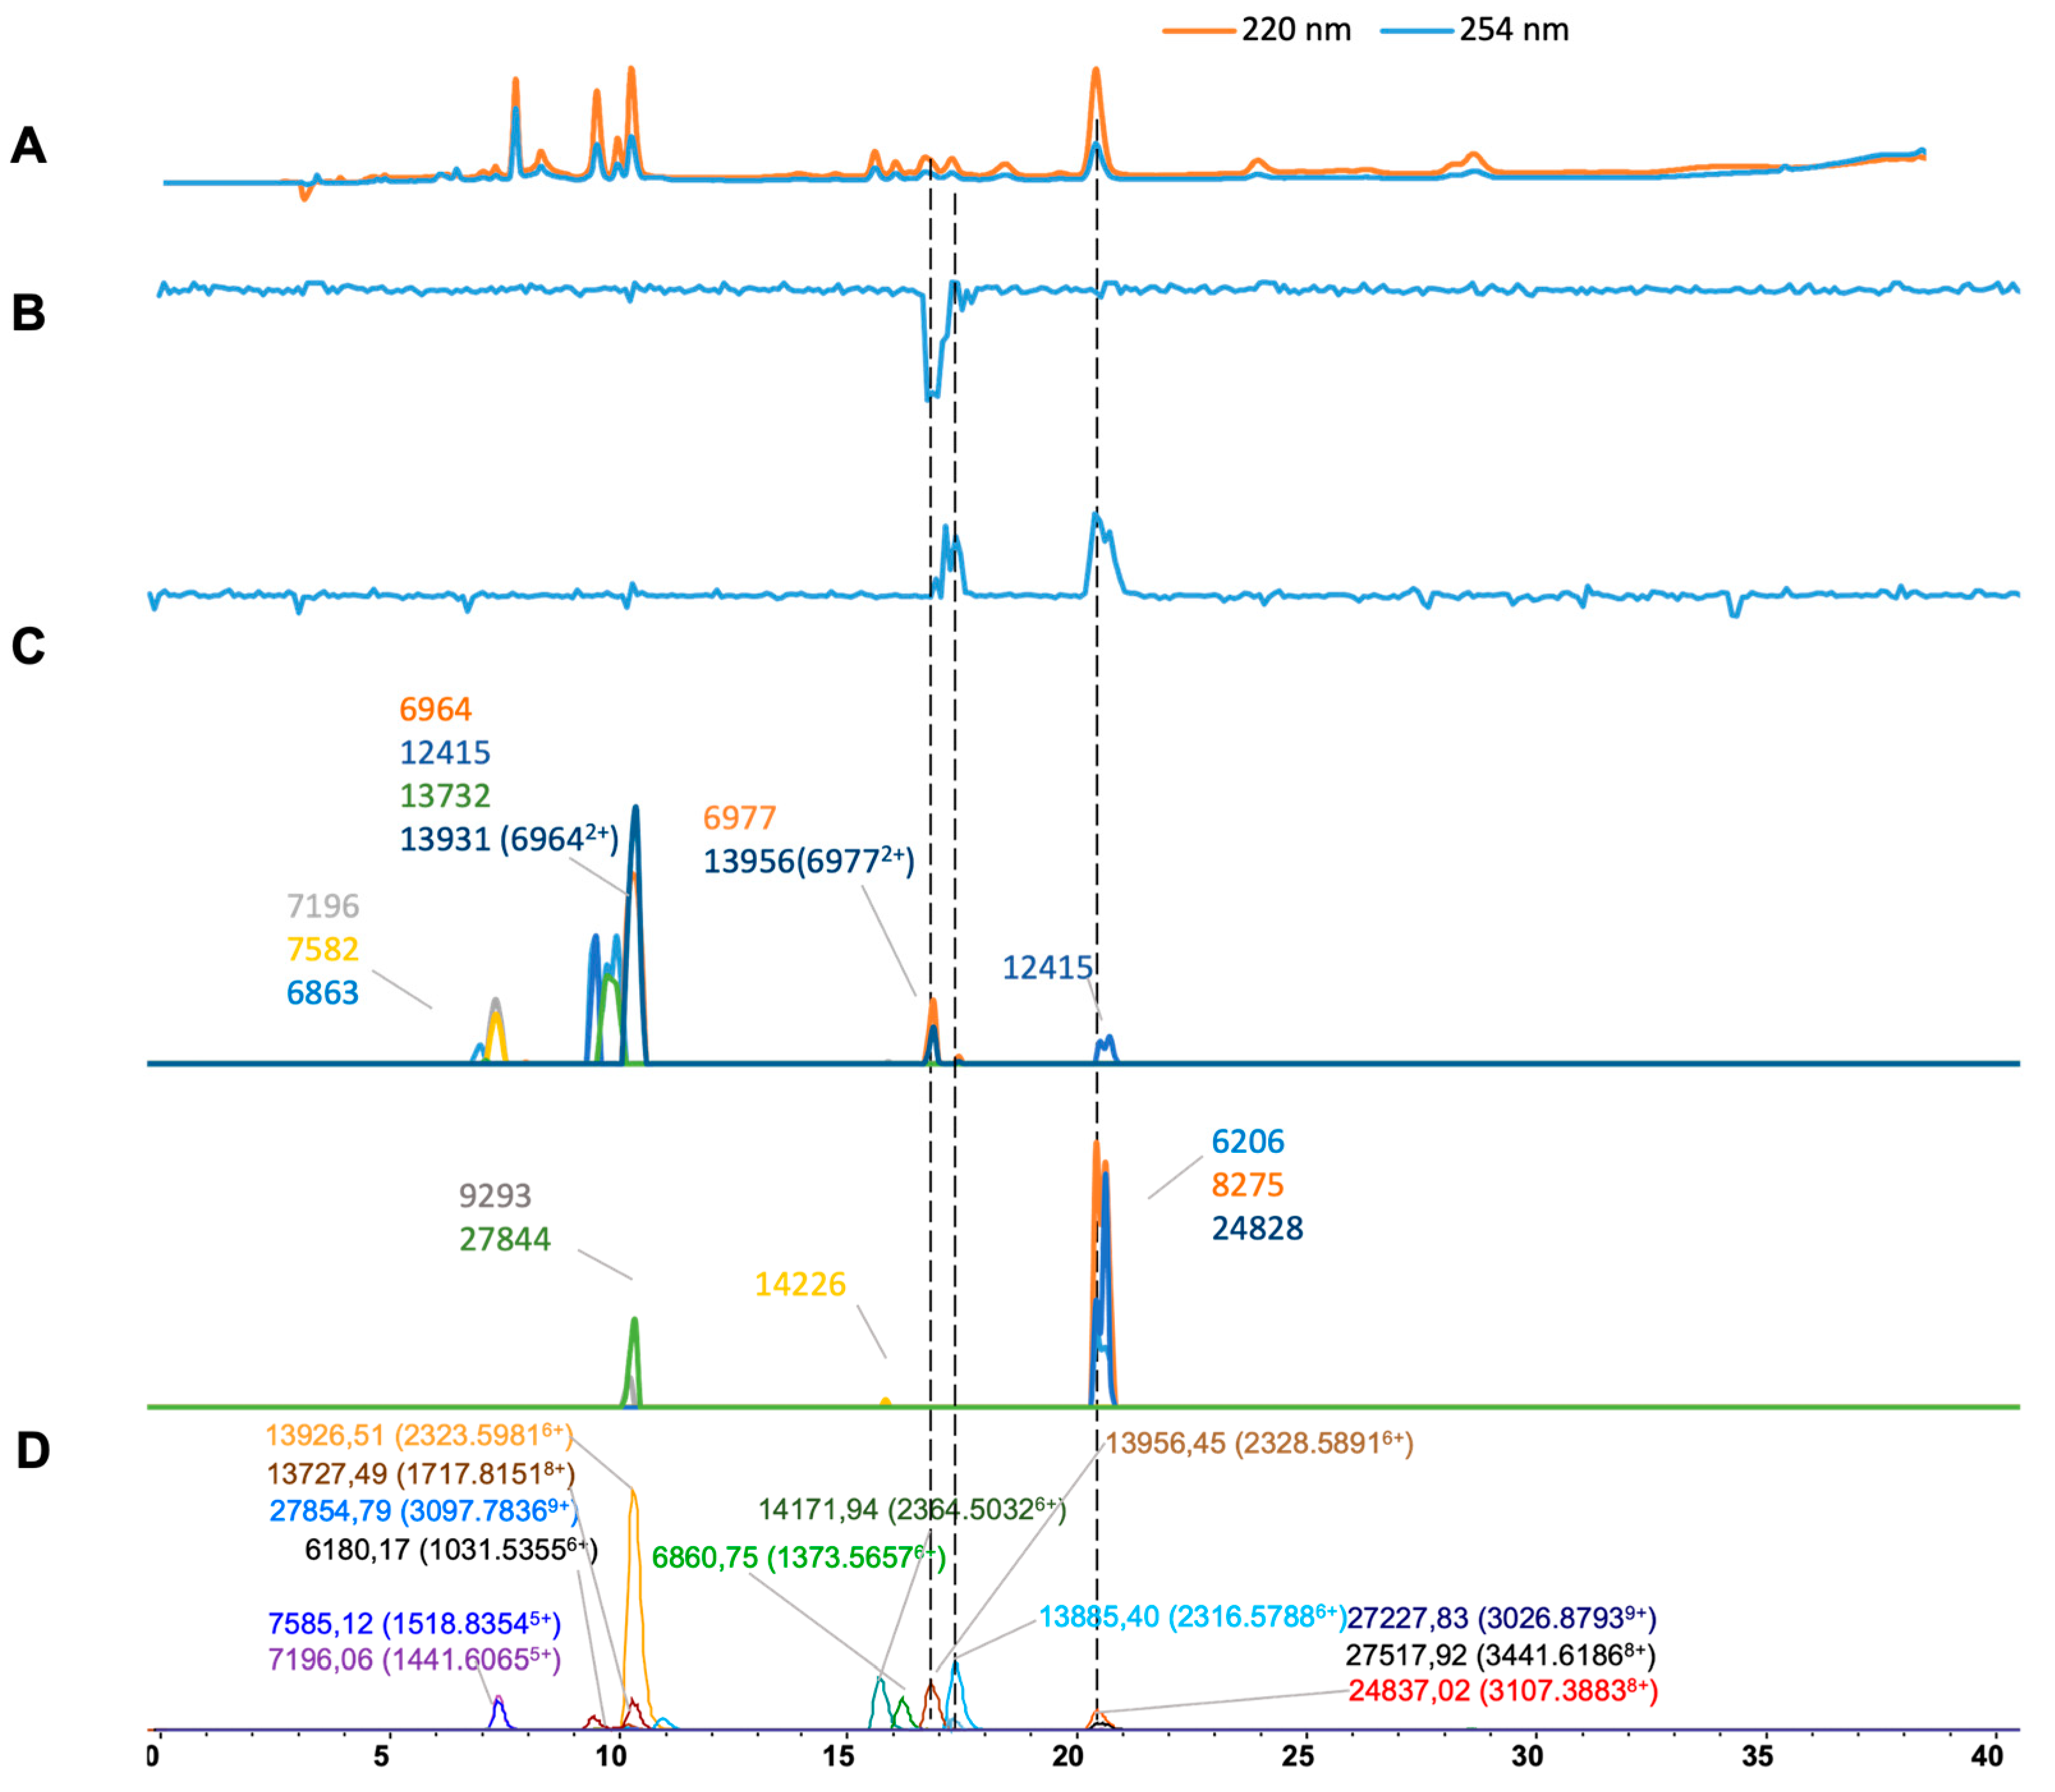
| Bothrops asper | 7.0–8.1 | 1441.6065 | 5 | 7198.98 | 26,068 | 7196 | 731 | 2.98 | 6964 | 2154 | 57.1 |
| Figure 4 | 7.0–8.1 | 1518.8354 | 5 | 7585.12 | 22,106 | 7582 | 561 | 3.12 | 12,415 | 1438 | |
| 7.0–8.1 | 1373.5657 | 5 | 6860.75 | 936 | 6863 | 1454 | 2.25 | 14,426 | 5 | ||
| 9.1–11.3 | 2323.5981 | 6 | 13,926.51 | 189,332 | 13,931 | 2868 | 5.5 | 6206 | 48 | ||
| 9.1–11.3 | 1717.8151 | 8 | 13,727.49 | 23,910 | 13,732 (69642+) | 997 | 5.6 | 9293 | 19 | ||
| 9.1–11.3 | 3097.7836 | 9 | 27,854.79 | 1676 | 27,844 | 55 | 10 | 8275 | 166 | ||
| 15.5–16.2 | 2364.5032 | 6 | 14,171.94 | 40,948 | |||||||
| 16.6–17.5 | 2316.5788 | 6 | 13,885.40 | 54,236 | |||||||
| 16.6–17.5 | 2328.5891 | 6 | 13,956.45 | 36,854 | 13,956 (69772+) | 222 | 0.45 | ||||
| 16.6–17.5 | 3026.8793 | 9 | 27,227.83 | 886 | |||||||
| 16.6–17.5 | 3441.6186 | 8 | 27,517.92 | 1010 | |||||||
| 20.1–21.7 | 3107.3883 | 8 | 24,837.02 | 15,140 | 24,828 | 149 | 9 | ||||
| 20.1–21.7 | 1031.5355 | 6 | 6180.17 | 5500 | |||||||
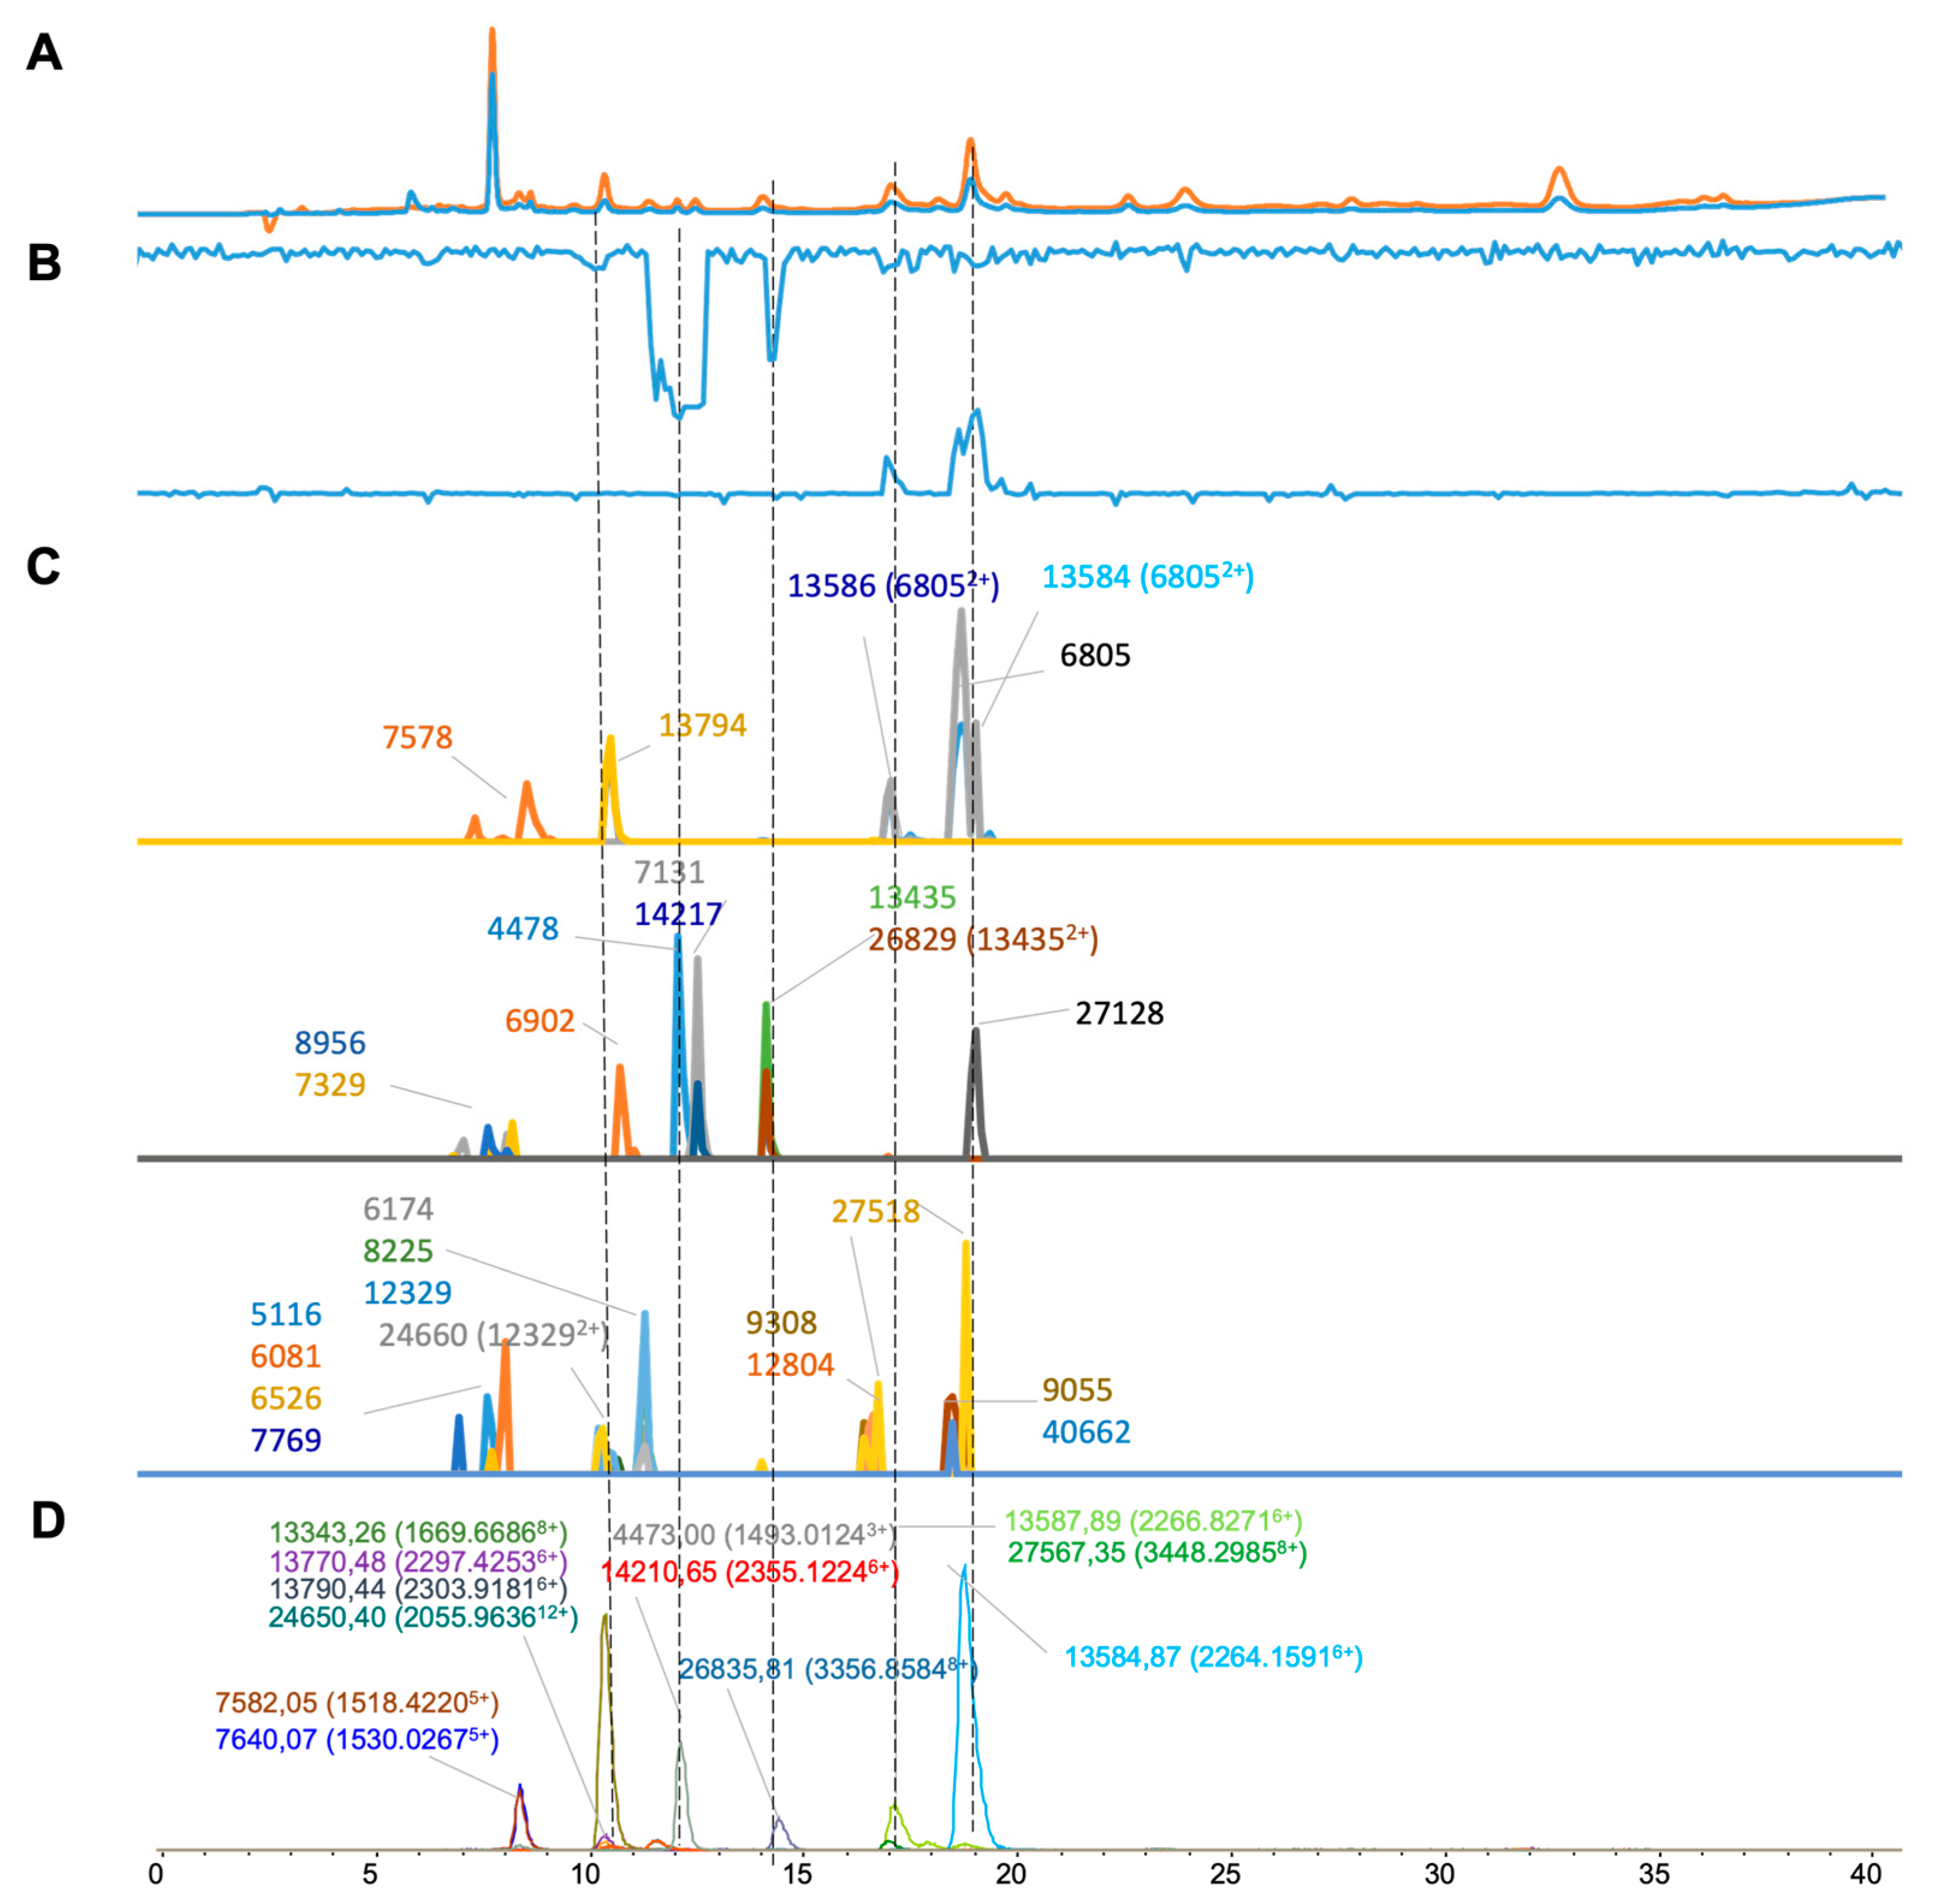
| Crotalus Atrox | 6.9–9.5 | 1530.0267 | 5 | 7640.07 | 27,004 | 6805 | 2425 | 27.2 | |||
| Figure 5 | 7.2–9.5 | 1518.422 | 5 | 7582.05 | 24,424 | 7578 | 1215 | 4 | 8576 | 90 | |
| 10.1–11.4 | 2297.4253 | 6 | 13,770.49 | 99,050 | 7329 | 103 | |||||
| 10.1–11.4 | 2303.9181 | 6 | 13,790.44 | 6602 | 13,794 | 2146 | 4 | 6902 | 260 | ||
| 10.1–11.4 | 1669.6686 | 8 | 13,343.26 | 3608 | 7131 | 567 | |||||
| 10.1–11.4 | 2055.9636 | 12 | 24,650.40 | 4116 | 14,217 | 214 | |||||
| 10.1–11.4 | 2466.7524 | 10 | 24,650.40 | 3812 | 24,660 | 11 | 10 | 13,435 | 437 | ||
| 11.4–13.7 | 1493.0124 | 3 | 4473.01 | 46,196 | 4478 | 632 | 5 | 26,829 (13,4352+) | 247 | ||
| 11.4–13.7 | 2355.1224 | 6 | 14,210.65 | 3588 | 14,217 | 236 | 7.6 | 27,128 | 364 | ||
| 13.9–16.1 | 3356.8584 | 8 | 26,835.81 | 13,386 | 26,829 | 247 | 6.8 | 5116 | 30 | ||
| 16.1–18.1 | 2266.8271 | 6 | 13,587.88 | 20,302 | 13,586 (68052+) | 1844 | 1.8 | 6080 | 51 | ||
| 16.1–18.1 | 3448.2985 | 8 | 27,567.35 | 3540 | 6525 | 9 | |||||
| 18.1–21.2 | 2264.1591 | 6 | 13,584.87 | 120,860 | 13,594 (68052+) | 4771 | 10 | 7769 | 22 | ||
| 6174 | 18 | ||||||||||
| 8225 | 49 | ||||||||||
| 12,329 | 62 | ||||||||||
| 24,660 (12,3292+) | 11 | ||||||||||
| 9308 | 20 | ||||||||||
| 12,804 | 23 | ||||||||||
| 9055 | 30 | ||||||||||
| 40,662 | 20 | ||||||||||
| 27,518 | 35 | ||||||||||
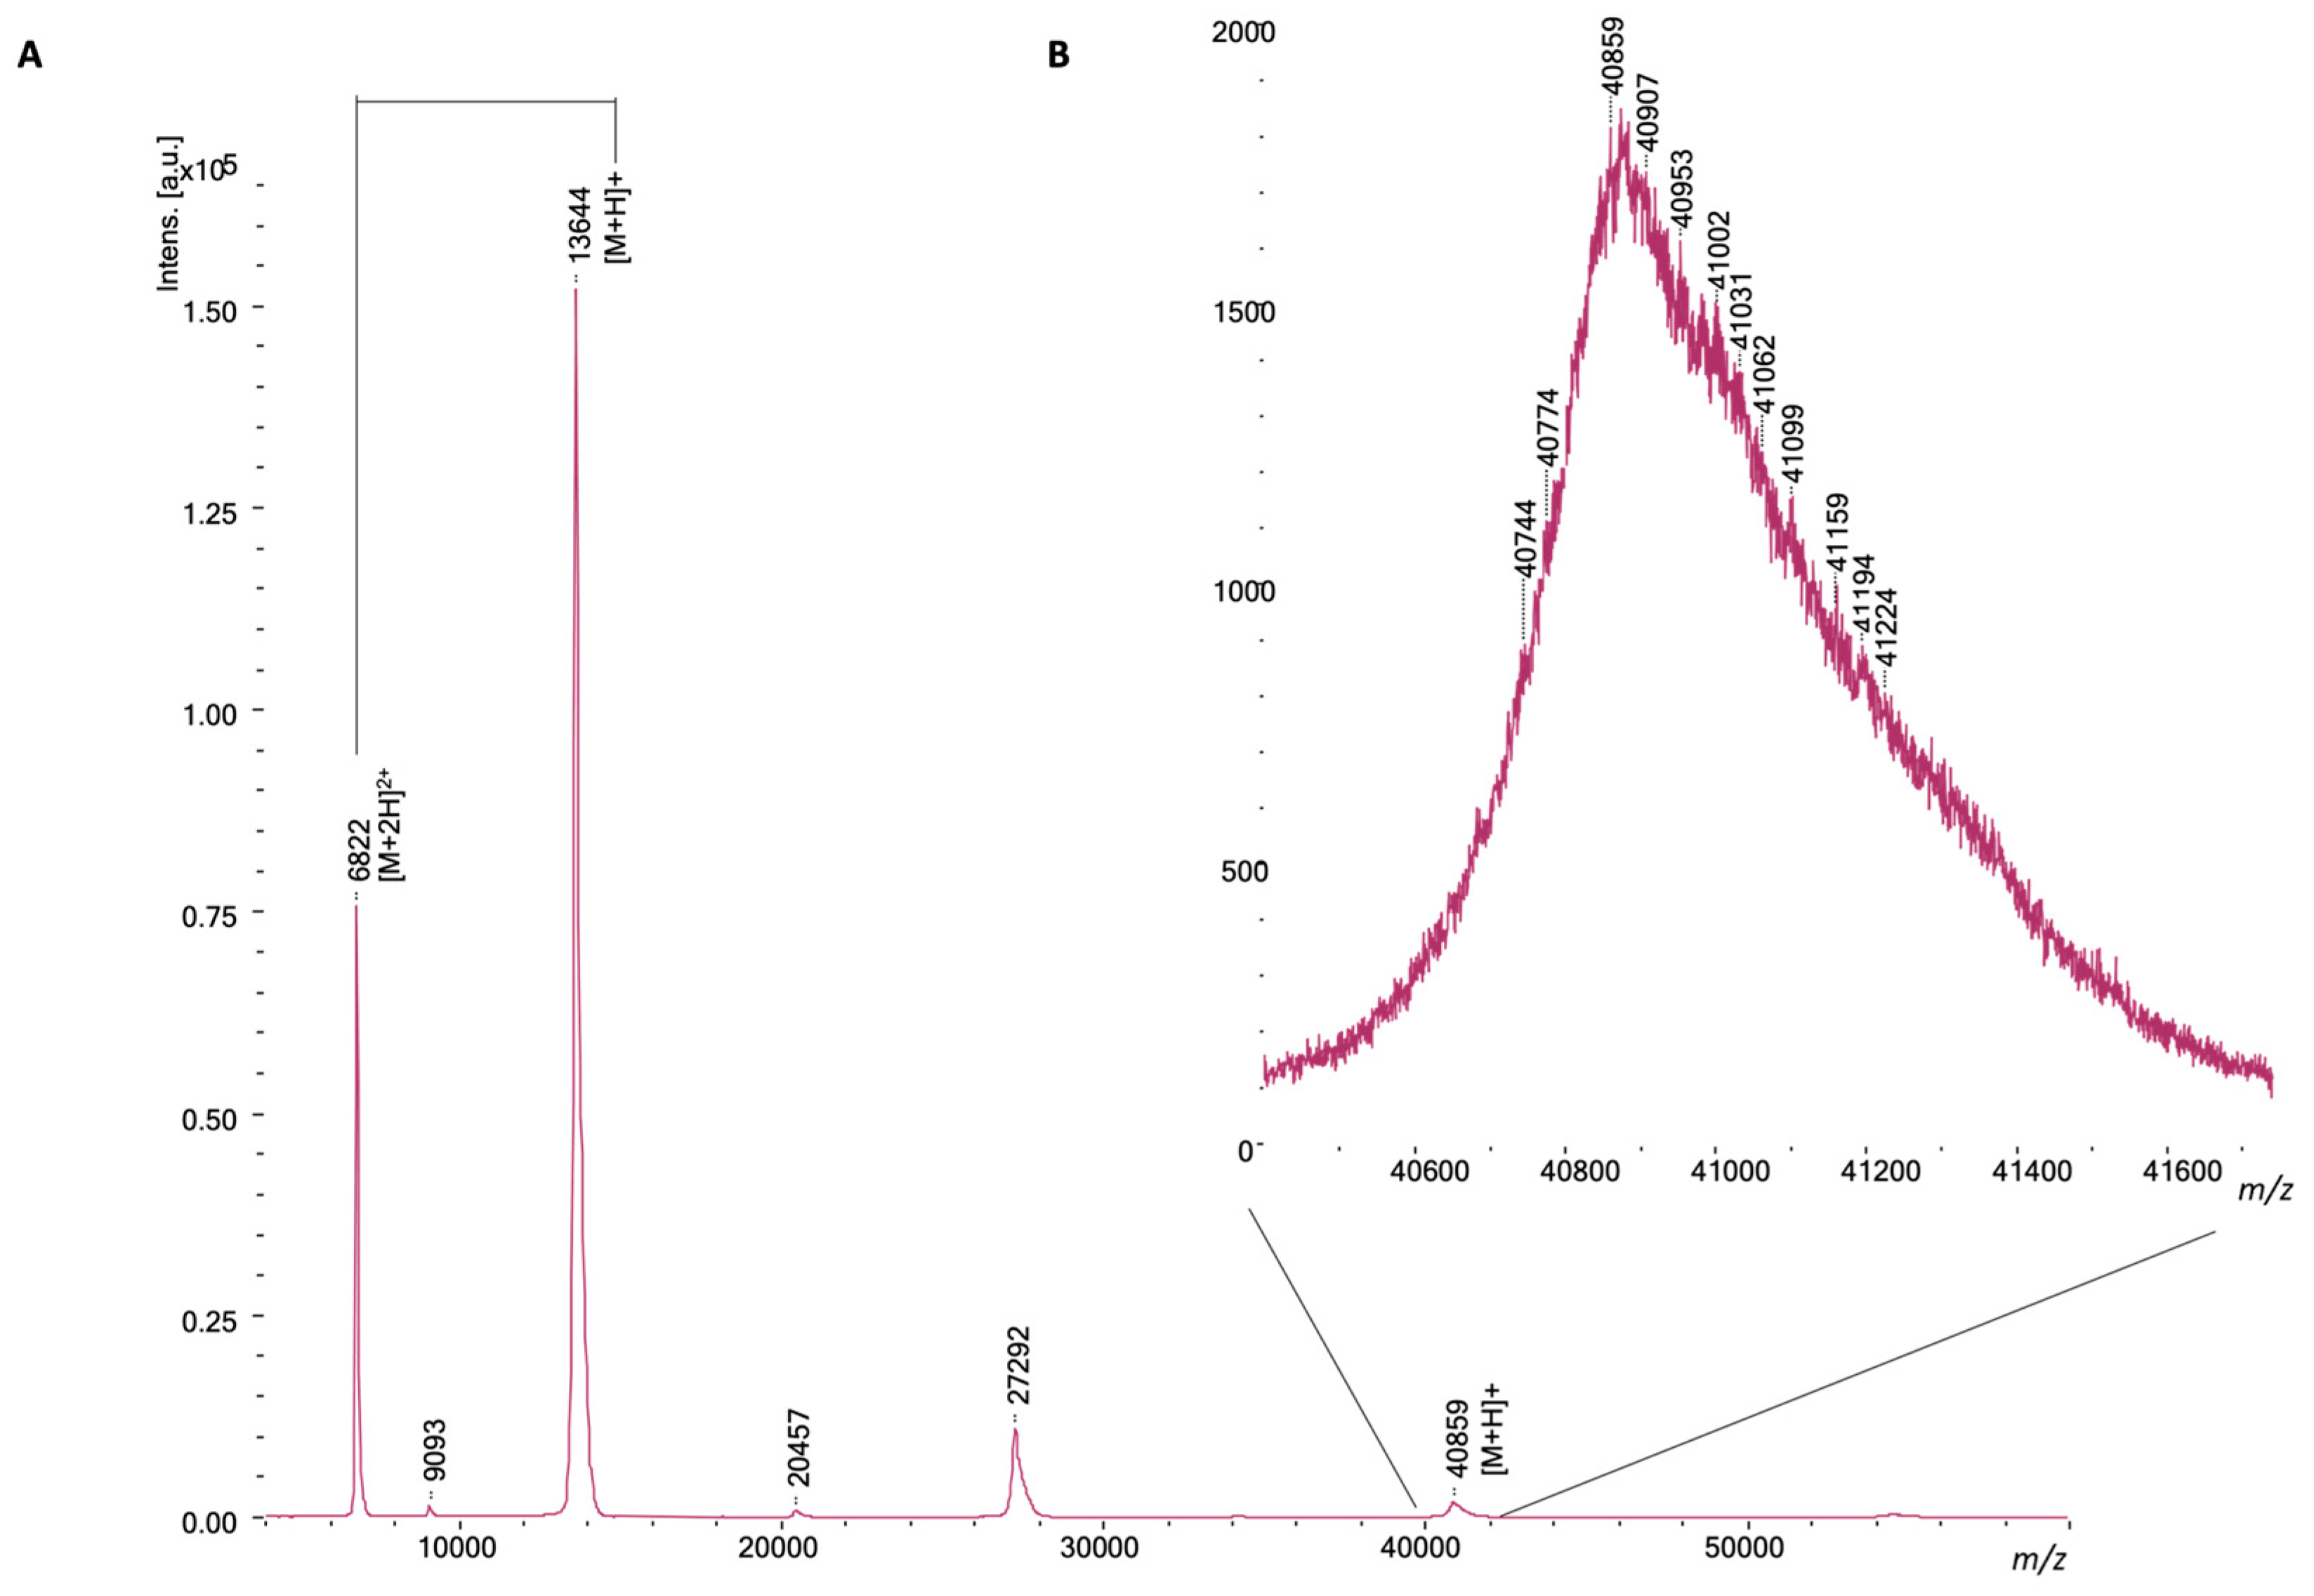
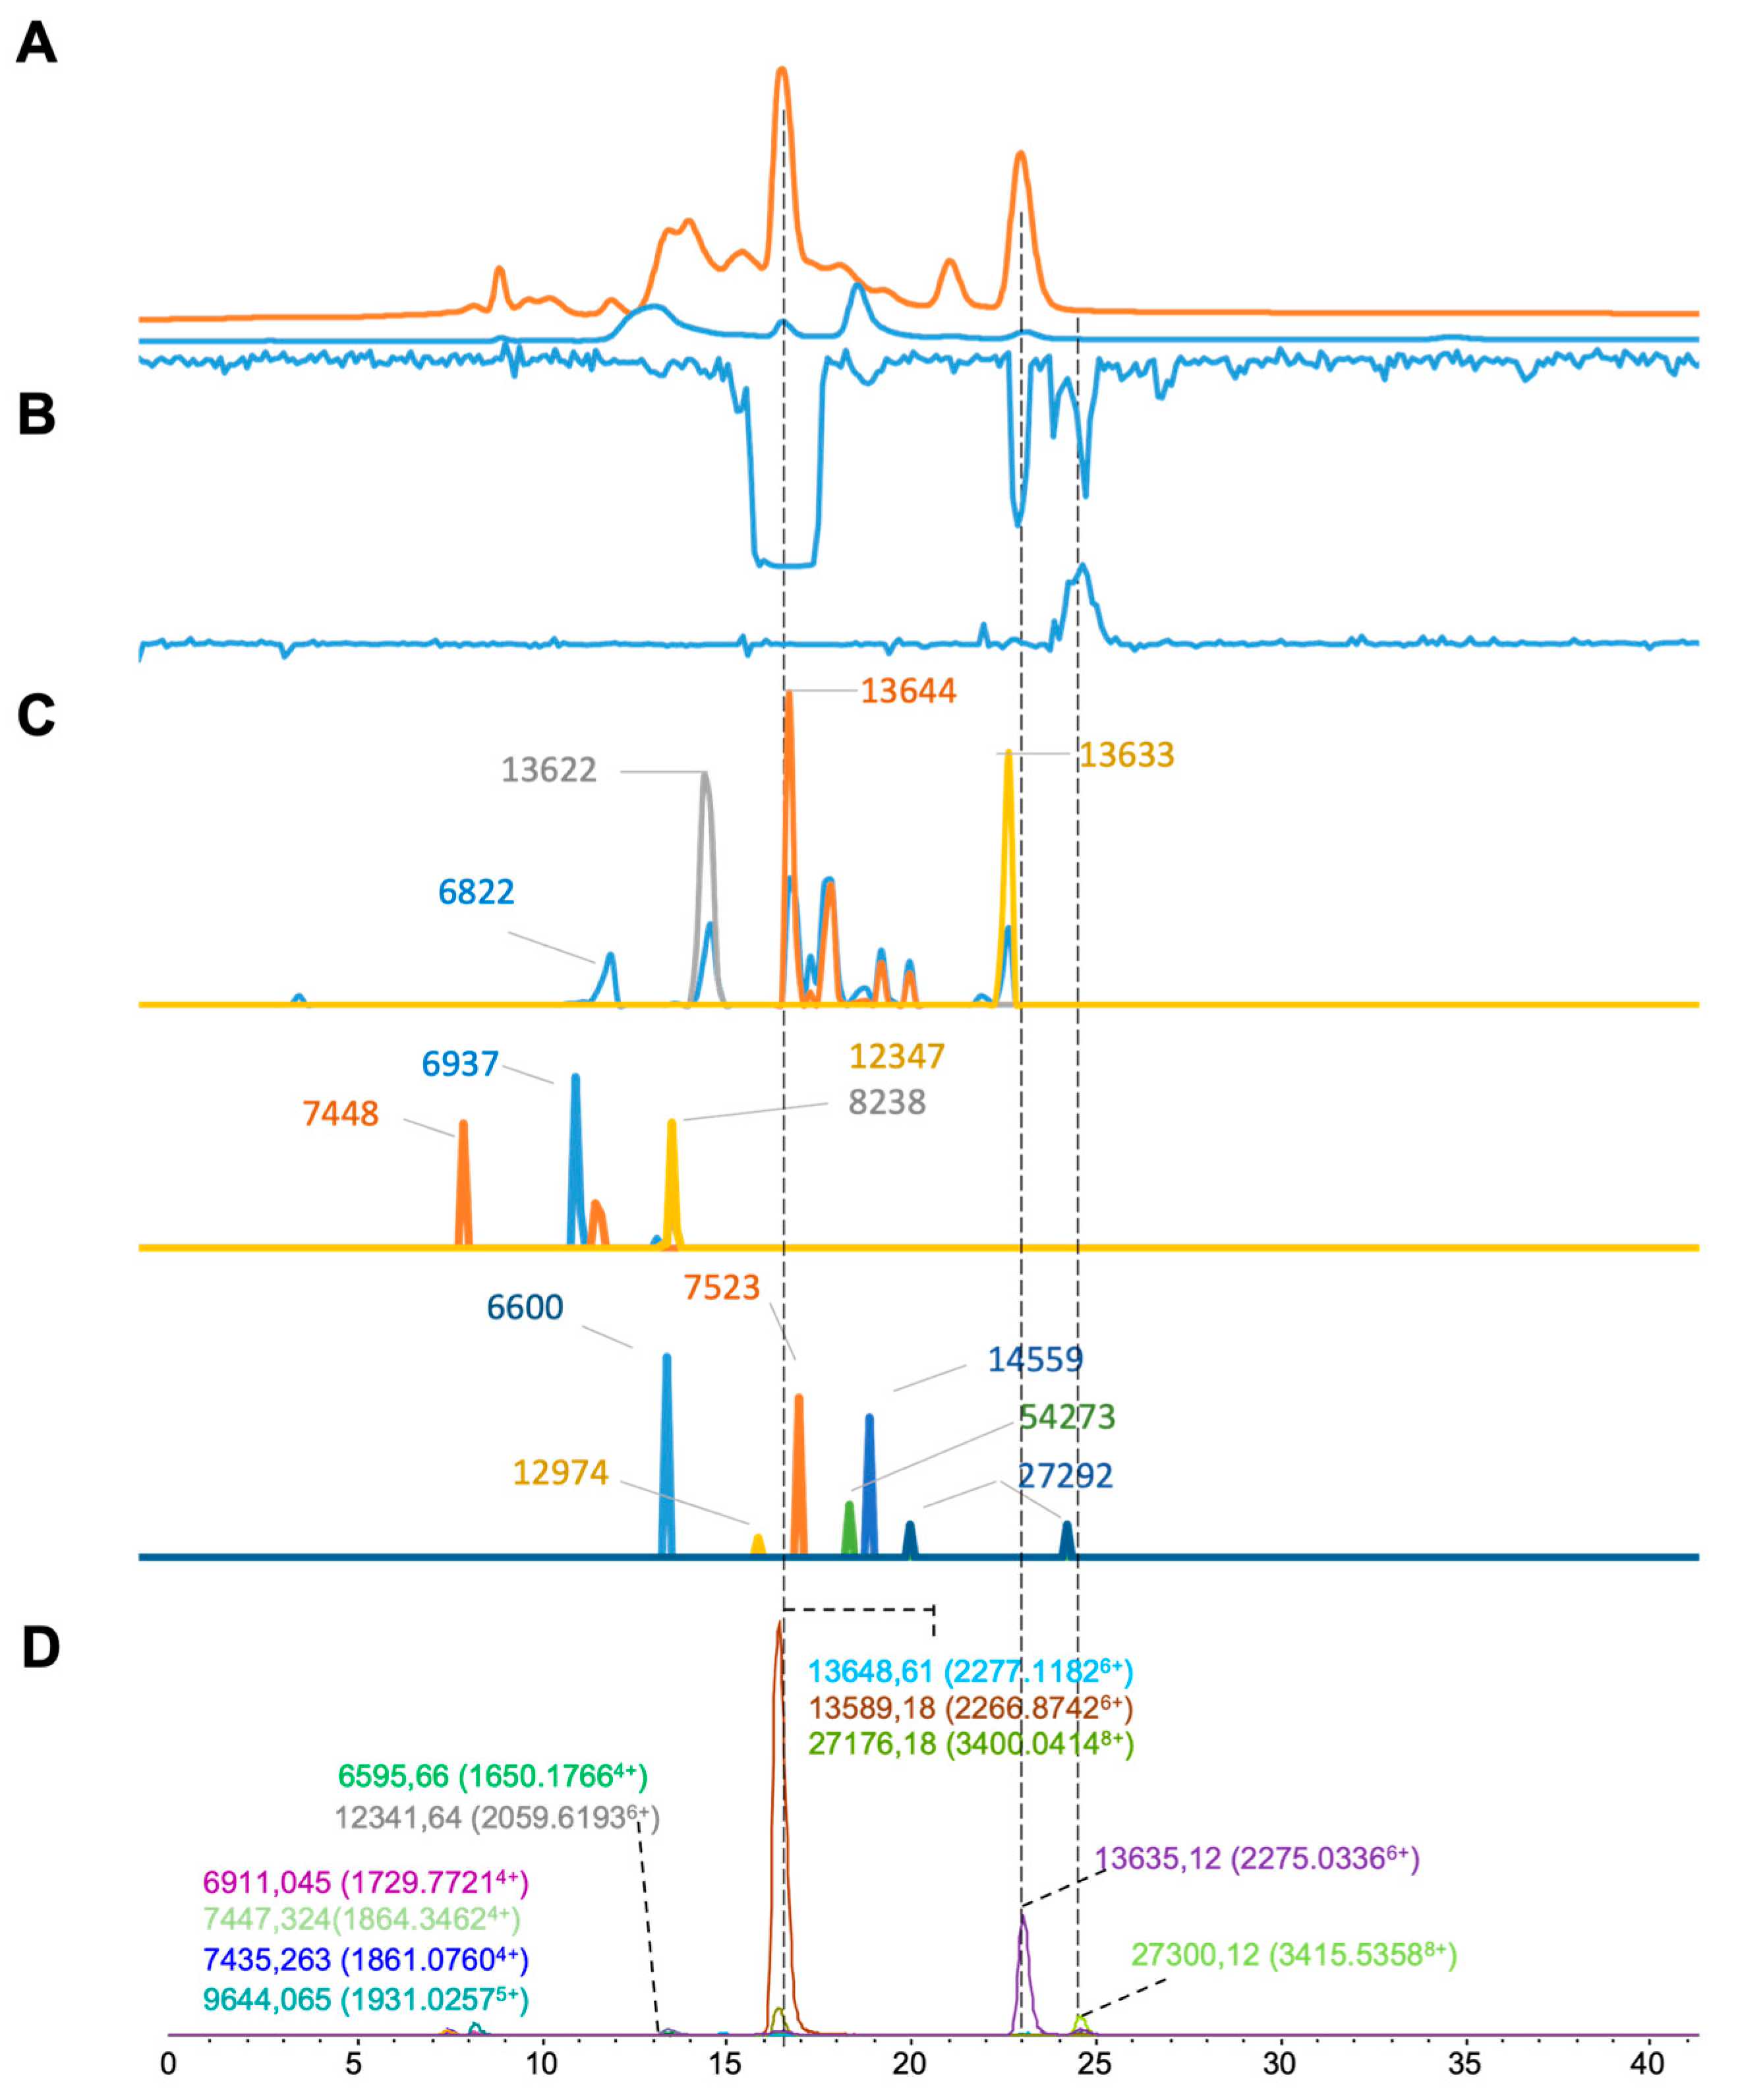
| Daboia russelli | 7.0–7.8 | 1729.7721 | 4 | 6911.04 | 3814 | 6822 | 1200 | 40 | |||
| Figure 6 | 7.0–7.8 | 1861.076 | 4 | 7435.26 | 6572 | 13,622 | 2256 | ||||
| 7.0–7.8 | 1864.3462 | 4 | 7447.32 | 5876 | 7448 | 227 | 1 | 6937 | 311 | ||
| 7.8–8.7 | 1931.0257 | 5 | 9644.06 | 13,522 | 8237 | 114 | |||||
| 12.7–14.3 | 2059.6193 | 6 | 12,341.64 | 7308 | 12,347 | 228 | 6 | 7523 | 24 | ||
| 12.7–14.3 | 1650.1766 | 4 | 6589.66 | 1042 | 6600 | 30 | 10 | 9679 | 18 | ||
| 14.3–15.4 | 2277.1182 | 6 | 13,648.61 | 1208 | 13,644 (68222+) | 3098 | 4.6 | 12,973 | 3 | ||
| 15.5–18.5 | 2266.8742 | 6 | 13,589.18 | 507,424 | 14,559 | 21 | |||||
| 15.5–18.5 | 3400.0414 | 8 | 27,176.18 | 33,140 | 54,273 | 8 | |||||
| 22.3–23.7 | 2275.0336 | 6 | 13,635.12 | 148,486 | 13,633 | 2504 | 2.1 | ||||
| 23.8–26.7 | 3415.5358 | 8 | 27,300.12 | 22,884 | 27,292 | 5 | 8 | ||||
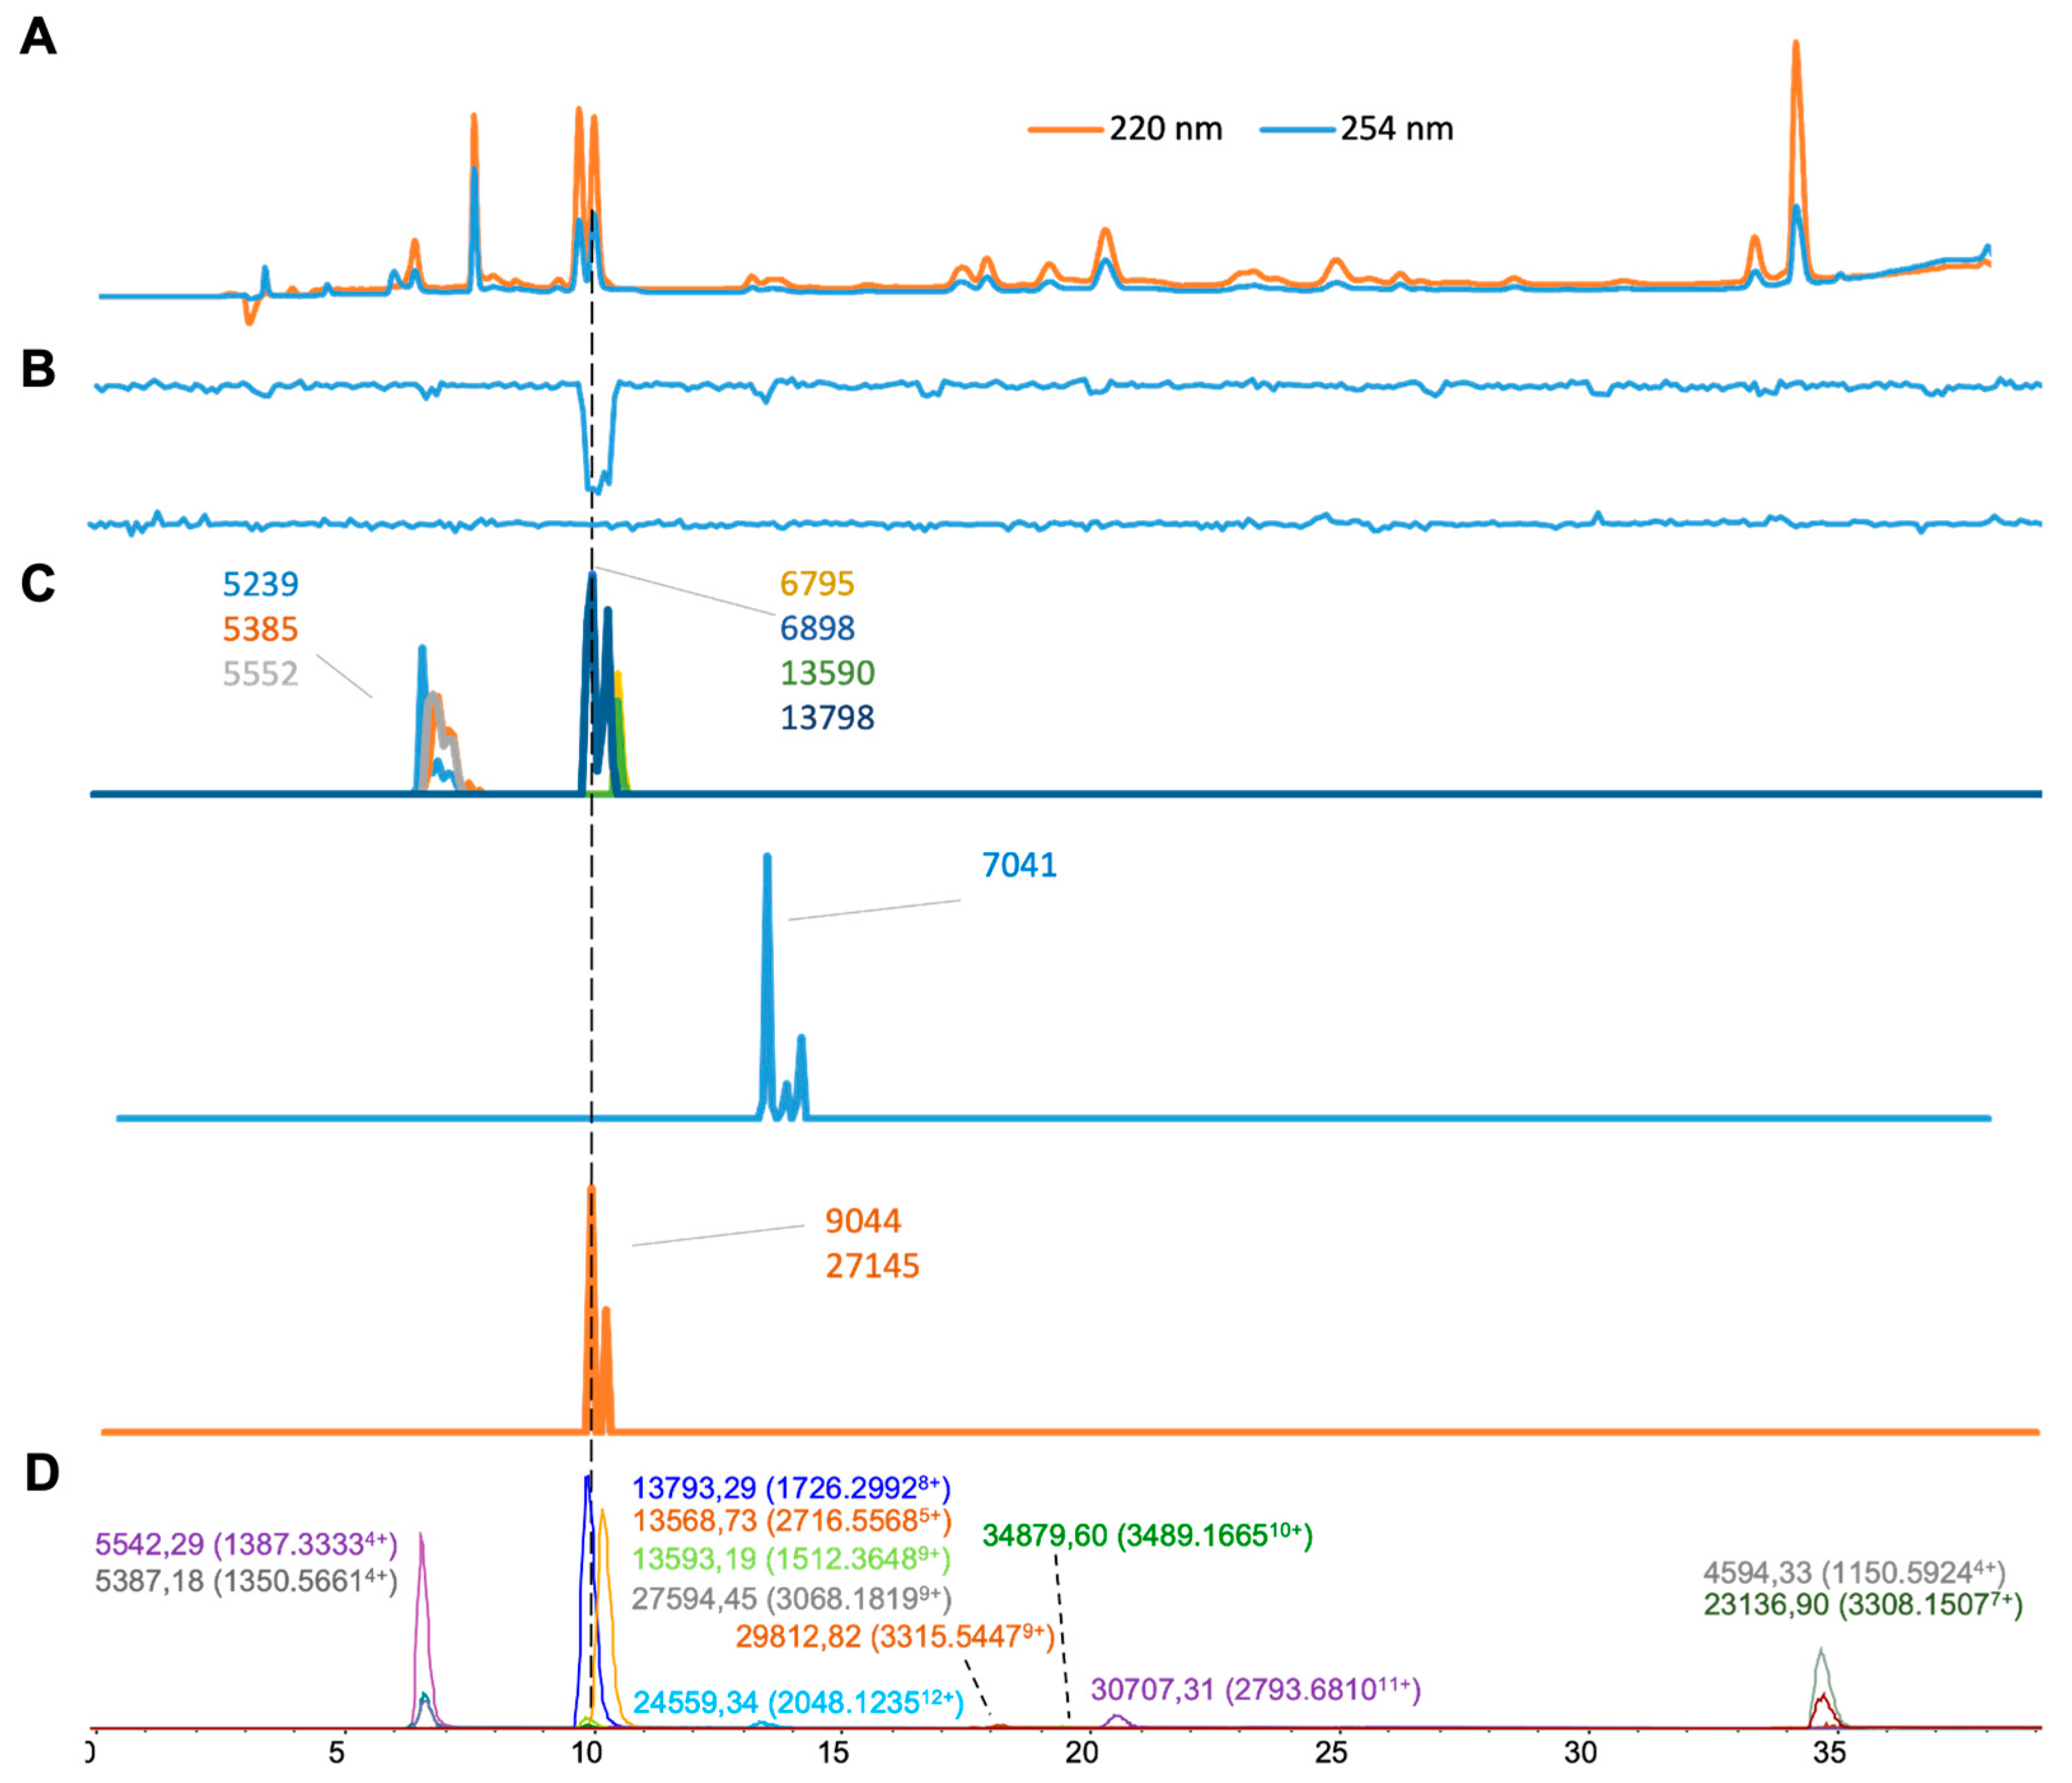
| Echis carinatus | 5.7–7.4 | 1387.3333 | 4 | 5542.29 | 120,170 | 5553 | 1274 | 10 | 6795 | 1528 | 38.4 |
| Figure 7 | 5.7–7.4 | 1312.05 | 4 | 5239.14 | 21,678 | 5239 | 1853 | 0.1 | 6898 | 2799 | |
| 5.7–7.4 | 1350.5661 | 4 | 5387.18 | 17,486 | 5385 | 1241 | 2.1 | 7041 | 930 | ||
| 9.1–12.4 | 1726.2992 | 8 | 13,793.29 | 157,468 | 13,798 | 2729 | 4.8 | 9044 | 32 | ||
| 9.1–12.4 | 2716.5568 | 5 | 13,568.73 | 136,396 | 27,145 | 35 | |||||
| 9.1–12.4 | 1512.3648 | 9 | 13,593.18 | 6742 | 13,590 | 1190 | 3.1 | ||||
| 9.1–12.4 | 3068.1819 | 9 | 27,594.45 | 1974 | |||||||
| 12.7–16.8 | 2048.1235 | 12 | 24,559.34 | 3664 | |||||||
| 16.8–19.3 | 3315.5447 | 9 | 29,812.82 | 1722 | |||||||
| 19.0–20.3 | 3489.1665 | 10 | 34,879.59 | 718 | |||||||
| 20.0–22.3 | 2793.681 | 11 | 30,707.31 | 7790 | |||||||
| 34.3–37.1 | 1150.5924 | 4 | 4594.33 | 47,050 | |||||||
| 34.3–37.1 | 3308.1507 | 7 | 23,136.91 | 20,660 | |||||||
| Echis Ocelattus | 5.8–7.6 | 1399.3083 | 4 | 5589.19 | 39,788 | 5585 | 997 | 4.1 | 6558 | 22 | 30 |
| Figure 8 | 5.8–7.6 | 1705.6812 | 3 | 5111.01 | 5854 | 5113 | 406 | 2 | 6949 | 2275 | |
| 7.2–9.2 | 2463.9245 | 10 | 24,626.11 | 560 | 7604 | 152 | |||||
| 9.1–10.9 | 2305.0528 | 6 | 138,15.24 | 235,156 | 138,19 | 30,745 | 3.8 | 8206 | 10 | ||
| 11.0–13.4 | 2311.8515 | 6 | 138,56.03 | 81,606 | 9207 | 27 | |||||
| 19.7–21.8 | 2764.4015 | 11 | 30,378.24 | 1656 | 10,434 | 37 | |||||
| 12,316 | 16 | ||||||||||
| 15,494 | 31 | ||||||||||
| 24,645 | 16 | ||||||||||
| 27,617 | 190 |
| Year | Analyte | Research Aims | Analyzer | Mass Cutoff (Da) | Reference |
|---|---|---|---|---|---|
| 2003 | Lipids | Investigate the phospholipid (PL) composition of organic extracts of bull spermatozoa | MALDI-TOF | 16 | [48] |
| 2015 | Walterinnesia aegyptia | Mass analysis to compare different separation and purification procedures | MALDI-TOF/TOF | 8 | [17] |
| 2007 | Atheris squamigera | Mass fingerprints for peptides | MALDI-TOF/MS and ESI-MS/MS | 11 | [49] |
| 2005 | B. insularis and B. jararaca venoms | Identify peptide content of crude snake venom | MALDI-TOF | 9 | [50] |
| 2007 | Mesobuthus tamulus | Mass fingerprints for biotope-specific variation | MALDI-TOF ESI-TOF | 8 | [51] |
| 2008 | Opisthacanthus cayaporum | Comparative analysis of amino acid sequence and biological activity for venom toxins | MALDI-TOF/TOF and ESI-MS/MS | 8 | [52] |
| 2010 | Enteric bacteria | Protein profile patterns and potential biomarkers for species and sub-species identification | MALDI-TOF/ ESI-TOF | 10 | [53] |
Disclaimer/Publisher’s Note: The statements, opinions and data contained in all publications are solely those of the individual author(s) and contributor(s) and not of MDPI and/or the editor(s). MDPI and/or the editor(s) disclaim responsibility for any injury to people or property resulting from any ideas, methods, instructions or products referred to in the content. |
© 2024 by the authors. Licensee MDPI, Basel, Switzerland. This article is an open access article distributed under the terms and conditions of the Creative Commons Attribution (CC BY) license (https://creativecommons.org/licenses/by/4.0/).
Share and Cite
Xu, H.; Mastenbroek, J.; Krikke, N.T.B.; El-Asal, S.; Mutlaq, R.; Casewell, N.R.; Slagboom, J.; Kool, J. Nanofractionation Analytics for Comparing MALDI-MS and ESI-MS Data of Viperidae Snake Venom Toxins. Toxins 2024, 16, 370. https://doi.org/10.3390/toxins16080370
Xu H, Mastenbroek J, Krikke NTB, El-Asal S, Mutlaq R, Casewell NR, Slagboom J, Kool J. Nanofractionation Analytics for Comparing MALDI-MS and ESI-MS Data of Viperidae Snake Venom Toxins. Toxins. 2024; 16(8):370. https://doi.org/10.3390/toxins16080370
Chicago/Turabian StyleXu, Haifeng, Jesse Mastenbroek, Natascha T. B. Krikke, Susan El-Asal, Rama Mutlaq, Nicholas R. Casewell, Julien Slagboom, and Jeroen Kool. 2024. "Nanofractionation Analytics for Comparing MALDI-MS and ESI-MS Data of Viperidae Snake Venom Toxins" Toxins 16, no. 8: 370. https://doi.org/10.3390/toxins16080370
APA StyleXu, H., Mastenbroek, J., Krikke, N. T. B., El-Asal, S., Mutlaq, R., Casewell, N. R., Slagboom, J., & Kool, J. (2024). Nanofractionation Analytics for Comparing MALDI-MS and ESI-MS Data of Viperidae Snake Venom Toxins. Toxins, 16(8), 370. https://doi.org/10.3390/toxins16080370