Abstract
By producing alpha toxin (PLC) and perfringolysin O (PFO), Clostridium perfringens type A strains are the most common cause of traumatic gas gangrene. C. perfringens cannot synthesize branched-chain amino acids (BCAAs), so BCAA transporters are essential for C. perfringens growth and survival. C. perfringens type A strain ATCC3624 encodes the BrnQ1, BrnQ2, and BrnQ3 BCAA transporters. RT-PCR analyses showed that, with increasing culture time in TY broth, brnQ2 and brnQ3 expression levels remained stable but brnQ1 expression levels declined. Single null mutants unable to produce one of the BrnQ proteins grew and survived similarly as wild type. However, these mutants all showed altered PLC production, especially in the early culture stage, and those effects were reversible by complementation. Therefore, the presence of BrnQ proteins impacts toxin production levels, even though they are not necessary for growth. Interestingly, a triple mutant that was unable to produce any BrnQ protein also grew similarly as ATCC3624. Since BCAA uptake is essential for C. perfringens, this strain must produce another (still to be identified) BCAA transporter.
Key Contribution:
C. perfringens must take up BCAAs from the environment for growth. This study determined that brnQ genes encoding BCAA transporters are not essential for C. perfringens type A growth, but they do affect PLC and PFO toxin production levels.
1. Introduction
Clostridium perfringens is a Gram-positive, spore-forming anaerobe that is ubiquitously distributed in the environment [1,2]. It also causes enteritis, enterotoxemias, and histotoxic infections (most notably gas gangrene) in both humans and other animals [1,2]. Toxins play a major role in the virulence of this pathogen [3,4]. Currently, C. perfringens isolates are classified into seven types (A–G) based upon which of the six typing toxin genes (plc, cpb, cpe, etx, iota, and netB) they carry [5].
The current study used C. perfringens strain ATCC3624, which classifies as type A. This strain carries both the plc gene encoding alpha toxin (PLC), which has phospholipase C and sphingomyelinase activities, and the pfoA gene encoding perfringolysin O (PFO), which is a pore-forming toxin [5,6,7,8]. Type A strains are the primary cause of traumatic gas gangrene (clostridial myonecrosis) in humans [9,10,11,12]. After entry into the body, type A isolates grow in muscle and produce PLC and PFO, as well as many exoenzymes. These toxins and enzymes destroy muscle and soft tissue, causing progressive necrosis. They also enter the circulation, which contributes to multiple organ failure and rapid death [9,10,11,12]. PLC and PFO reportedly have synergistic effects in gas gangrene [13]. Necrosis caused by PLC and PFO during gas gangrene involves an inhibition of the inflammatory response and impaired vascular flow [10,11]. We recently reported that, in vitro, ATCC3624 also upregulates PLC and PFO production in the presence of differentiated C2C12 muscle cells, and this effect liberates nutrients from these host cells to promote growth of this type A strain [6]. This upregulation involves the Agr-like quorum sensing system and both the VirS/VirR and EutV/EutW two-component regulatory systems [6].
Branched-chain amino acids (BCAAs), which include isoleucine, leucine, and valine, are essential for protein synthesis. BCAAs are also precursors for branched-chain fatty acids, which are the major fatty acids of the Gram-positive bacterial cell membrane [14]. However, the BCAA biosynthesis pathway is incomplete in C. perfringens [15]. Therefore, this bacterium must acquire BCAAs from the environment or, during infection, from the host. Consequently, BCAA transport is very important for C. perfringens growth; i.e., C. perfringens cannot grow without BCAA uptake [16,17].
Three brnQ BCAA transporter genes are present in the published closed C. perfringens genomes [15,18] or the >100 genomes deposited in GenBank, but those transporters have never been studied. However, BCAA transporters have been examined in other bacteria. In Bacillus subtilis, BrnQ, BcaP, and BraB are the major transporters for isoleucine, valine, and, possibly, leucine [19]. Corynebacterium glutamicum and Lactobacillus delbrueckii apparently only produce one BCAA transporter, but other bacteria can make multiple BCAA transporters [20,21]. S. aureus has three BCAA transporters, namely BrnQ1, BrnQ2, and BcaP [14,22]. Lactococcus lactis, Streptococcus aureus, B. subtilis, and Bacillus anthracis also carry multiple brnQ genes encoding BCAA transporters [23]. Some of those brnQ genes can contribute to virulence. For example, in B. anthracis, three brnQ transporters are associated with isoleucine and valine transport, and the gene encoding BrnQ3 also contributes to systemic lethality in a mouse model of anthrax [24].
This study constructed a series of isogenic brnQ mutants in ATCC3624 to evaluate the involvement of these transporters in growth, survival, and toxin production in vitro. In the culture conditions used, single mutants unable to express any one of these BCAA transporter genes still exhibited wild-type growth and long-term (24 h) viablility (i.e., survival). However, these mutations did affect toxin production, although the effect varied among the mutants. Surprisingly, a triple null mutant unable to produce any of these BCAA transporters also grew at the same rate as the wild-type strain and transiently produced even more PLC or PFO compared to the wild-type parent. These results support the existence of another BCAA transport pathway in C. perfringens.
2. Results
2.1. Expression of the BrnQ Genes During Growth
As mentioned in the Introduction Section, C. perfringens lacks BCAA biosynthesis genes, so this bacterium must acquire BCAAs from the environment. Three annotated BCAA transport genes named brnQ1, brnQ2, and brnQ3 are present in the sequenced C. perfringens genomes, including three published closed genomes [15,18] and ~100 others deposited in GenBank. Among these strains, the open reading frame sequence of each brnQ gene is ~99% conserved. Each of these genes appears to be monocistronic. The three BrnQ proteins encoded by these genes are similar in length; i.e., BrnQ1 consists of 428 amino acids (aa); BrnQ2 has 445 aa, and BrnQ3 is comprised of 424 aa. These three proteins share ~40% sequence identity and ~60% sequence similarity. All three proteins are predicted to have 12 transmembrane domains (Figure S1) (predicted by the TMHMM 2.0 program [TMHMM 2.0—DTU Health Tech—Bioinformatic Services]).
Since C. perfringens BrnQ antibodies are not available, this study used RT-PCR analyses to examine the expression of the three brnQ genes. An RT-PCR time course study showed that for wild-type ATCC3624 growing at 37 °C in the TY medium, the transcription of brnQ1, brnQ2, and brnQ3 starts by 2 h. However, the expression of brnQ1 then significantly decreases by 7 h of culture and remains very low at 9 h of culture (Figure 1A). Under the same culture conditions, both brnQ2 and brnQ3 expression remains very stable from 2 h to 9 h of culture (Figure 1A). Specifically, a comparison of the RT-PCR band intensity ratio between brnQ genes vs. the housekeeping recA gene using Image J software (V1.54K, National Institutes of Health, Bethesda, MD, USA) showed that only brnQ1 gene expression significantly decreases by 7 or 9 h of culture (Figure 1B). As a positive PCR control, ATCC3624’s DNA amplified products using all primers in the absence of RT. The RNA preparations used were not contaminated with DNA since recA PCR was performed with those RNA preparations, but in the absence of RT, no product was amplified.
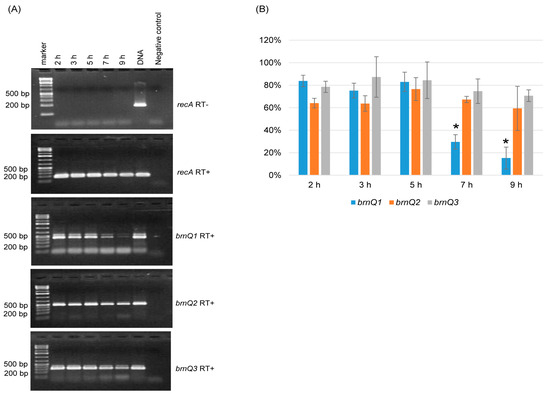
Figure 1.
Expression of brnQ genes during culture in TY cultures of ATCC3624. (A) RT-PCR analyses. The recA gene was used as a housekeeping gene, and a sample lacking reverse transcriptase (RT-) was run (top panel) in a PCR reaction with recA primers to show the absence of DNA contamination in these RNA samples; recA gene RT-PCR (2nd panel) showed that cDNA was present in all samples. Further RT-PCR analyses (bottom three panels) are shown using brnQ1 primers (for brnQ1 expression), brnQ2 primers (for brnQ2 expression), or brnQ3 primers (for brnQ3 expression) for wild-type ATCC3624 cultures at different time points. The expected size of each PCR product is listed in Table 1. The sample with ATCC3624 DNA served as the positive control, and the sample without ATCC3624 DNA served as the negative control. DNA size markers are shown on the left of each gel. The results shown are representative of three repetitions. (B) A comparison of the RT-PCR band intensity ratio between the brnQ gene vs. the housekeeping recA gene is shown using the Image J software. The mean values from three independent experiments are shown. The error bars indicate the S.D. * p < 0.05 relative to the 2 h result.

2.2. Preparation of BrnQ Single-Gene Mutants and Complementing Strains
To start characterizing the contributions of each BrnQ BCAA transporter to ATCC3624 growth, survival, and toxin production, single brnQ null mutant strains were constructed (Figure S2) using the Clostridium-modified group II TargeTron@ approach [25]. These single null mutant strains were prepared and named brnQ1KO, brnQ2KO, and brnQ3KO. Three complementing strains were also made using the E. coli and C. perfringens shuttle plasmid pJIR750 [26]. Each of the three complementing plasmids carried one brnQ open reading frame (ORF) and its own promoter (Figure S2).
The construction of the three single BrnQ BCAA transporter mutants and the three complementing strains was each confirmed by PCR reactions (Figure S3A). Using the same primers specific for internal brnQ ORF sequences, the PCR product amplified from wild-type ATCC3624 DNA was ~900 bp smaller than the PCR products amplified from each null mutant strain due to the targeted insertion of a 900 bp intron in each mutant. Using the same primers, PCR using DNA from the three complementing strains always amplified a product matching the size of the product amplified from the corresponding wild-type brnQ gene, and this is indicative of the restored presence of a wild-type copy of this gene in the complementing strain (Figure S3A).
Since these are targeted single brnQ-gene mutants, only one intron insertion should be detected in each mutant by intron-specific Southern blot analysis. The Southern blot result in Figure S3B showed that no intron hybridization band occurred using DNA from the wild-type parent and confirmed that only a single intron insertion was present in each single brnQ null mutant.
2.3. Characterization of the Single BrnQ Mutants and Complementing Strains
RT-PCR was first performed to confirm that, in 2 h TY broth cultures, the brnQ1 mutant had lost brnQ1 expression and complementation had restored brnQ1 expression. Control RT-PCR reactions demonstrated that RNA was not contaminated with DNA, and the quality of the RNA preparation was good. RT-PCR for the expression of the brnQ1 gene showed that the wild-type parent and complementing strains both express the brnQ1 transcript. However, no wild-type brnQ1 transcript was detected using RNA purified from the brnQ1 null mutant (Figure S4A).
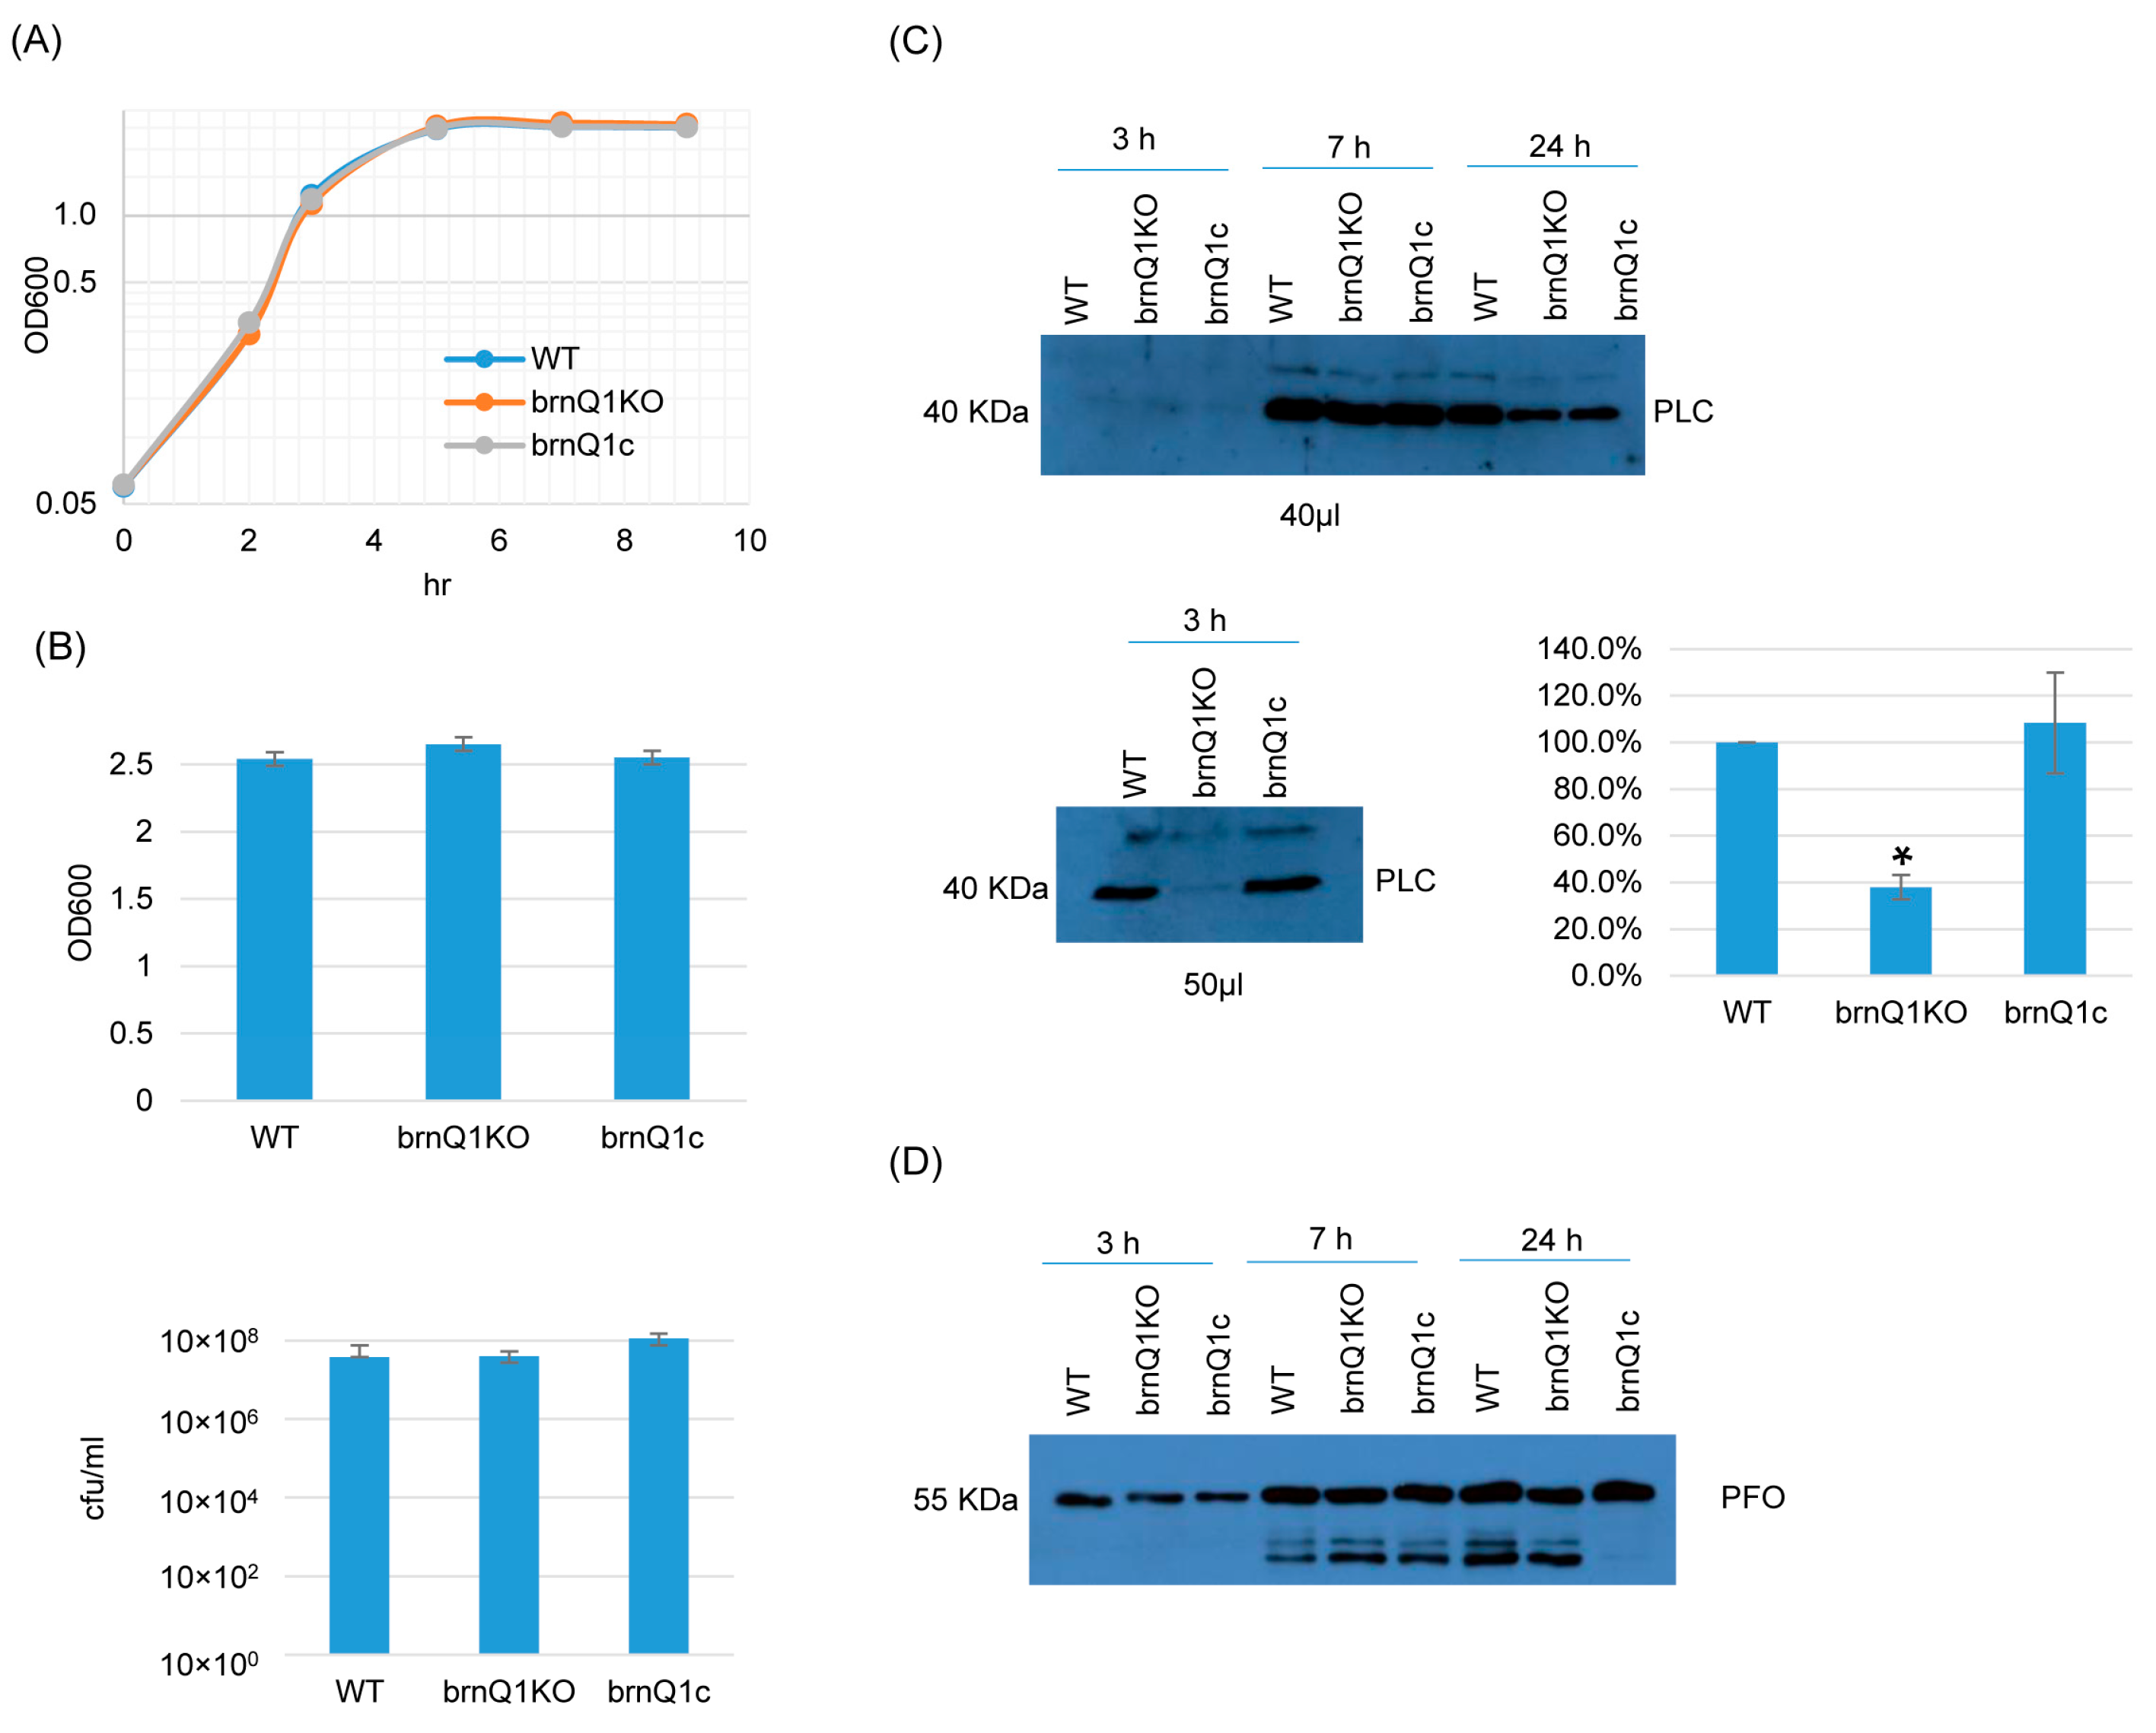
The results of growth curve experiments indicated that the wild-type parent, its isogenic brnQ1 null mutant (brnQ1KO), and the complementing strain (brnQ1c) all grow similarly in a TY medium when cultured up to 9 h at 37 °C (Figure 2A). Extending this analysis further to a 24 h culture time point, culture OD600 values and BHI agar plate counting (CFU) results were also similar for these three strains (Figure 2B).
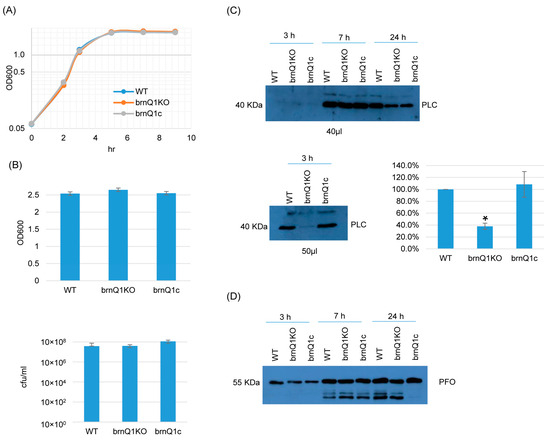
Figure 2.
A comparison of post-inoculation changes in culture OD600, vegetative cell viability, and PLC or PFO production levels for ATCC3624 (WT), its brnQ1 null mutant (brnQ1KO), and the complementing strain (brnQ1c) when cultured in a TY medium. (A) Post-inoculation changes in the OD600 of TY cultures of these strains from 0 to 9 h at 37 °C. The result shown is representative of three repetitions. (B) OD600 of TY cultures at 24 h at 37 °C (top). The same samples were also used for colony counting of viable vegetative cells (bottom). The mean values from three independent experiments are shown. The error bars indicate the S.D. (C) Western blot analyses of PLC level in supernatants of 3, 7, and 24 h culture samples (top panel). The PLC blot was also repeated using 10 µL more of the sample from the same 3 h TY sample, with longer film exposure (bottom left blot), to allow for a better comparison of PLC production between the brnQ1 null mutant vs. wild-type ATCC3624 or the complementing strain. The size of proteins in kiloDaltons (kDa) is shown on the left. A comparison of the Western blot band intensity ratio is shown between 3 h samples (bottom right graph) using Image J software. The graph shows the mean values from three independent experiments. The error bars indicate the S.D. * p < 0.05 relative to wild type. Similar Image J analyses did not detect PLC production differences among these strains in 7 or 24 h samples (Figure S5A). (D) Western blot analyses of the PFO level in supernatants of 3, 7, and 24 h culture samples. The results shown are representative of three repetitions. The size of proteins in kiloDaltons (kDa) is shown on the left. Image J analyses did not detect significant differences in PFO production among these strains at any time points (Figure S5A).
Using supernatants from those same 3, 7, or 24 h TY cultures, PLC and PFO Western blotting were performed. These experiments showed that limited PLC production by these strains began even by 3 h of culture. At this early time point, PLC production by the brnQ1 null mutant strain was lower compared to its wild-type parent, as better visualized by Western blotting more volume of the same 3 h culture supernatants and exposing the film longer (Figure 2C, bottom panel, left). The complementation of the mutant restored wild-type levels of PLC production. Using Image J software to compare the Western blot band intensity ratio among the wild-type sample, the null mutant and complementing strains confirmed that 3 h cultures of the brnQ1 null mutant strain makes less PLC compared to the wild-type and complementing strains (Figure 2C). In contrast to those PLC results, no differences in PFO production were noted among the wild-type parent, the brnQ1 mutant, or the complementing strain at any culture time point (Figure 2D).
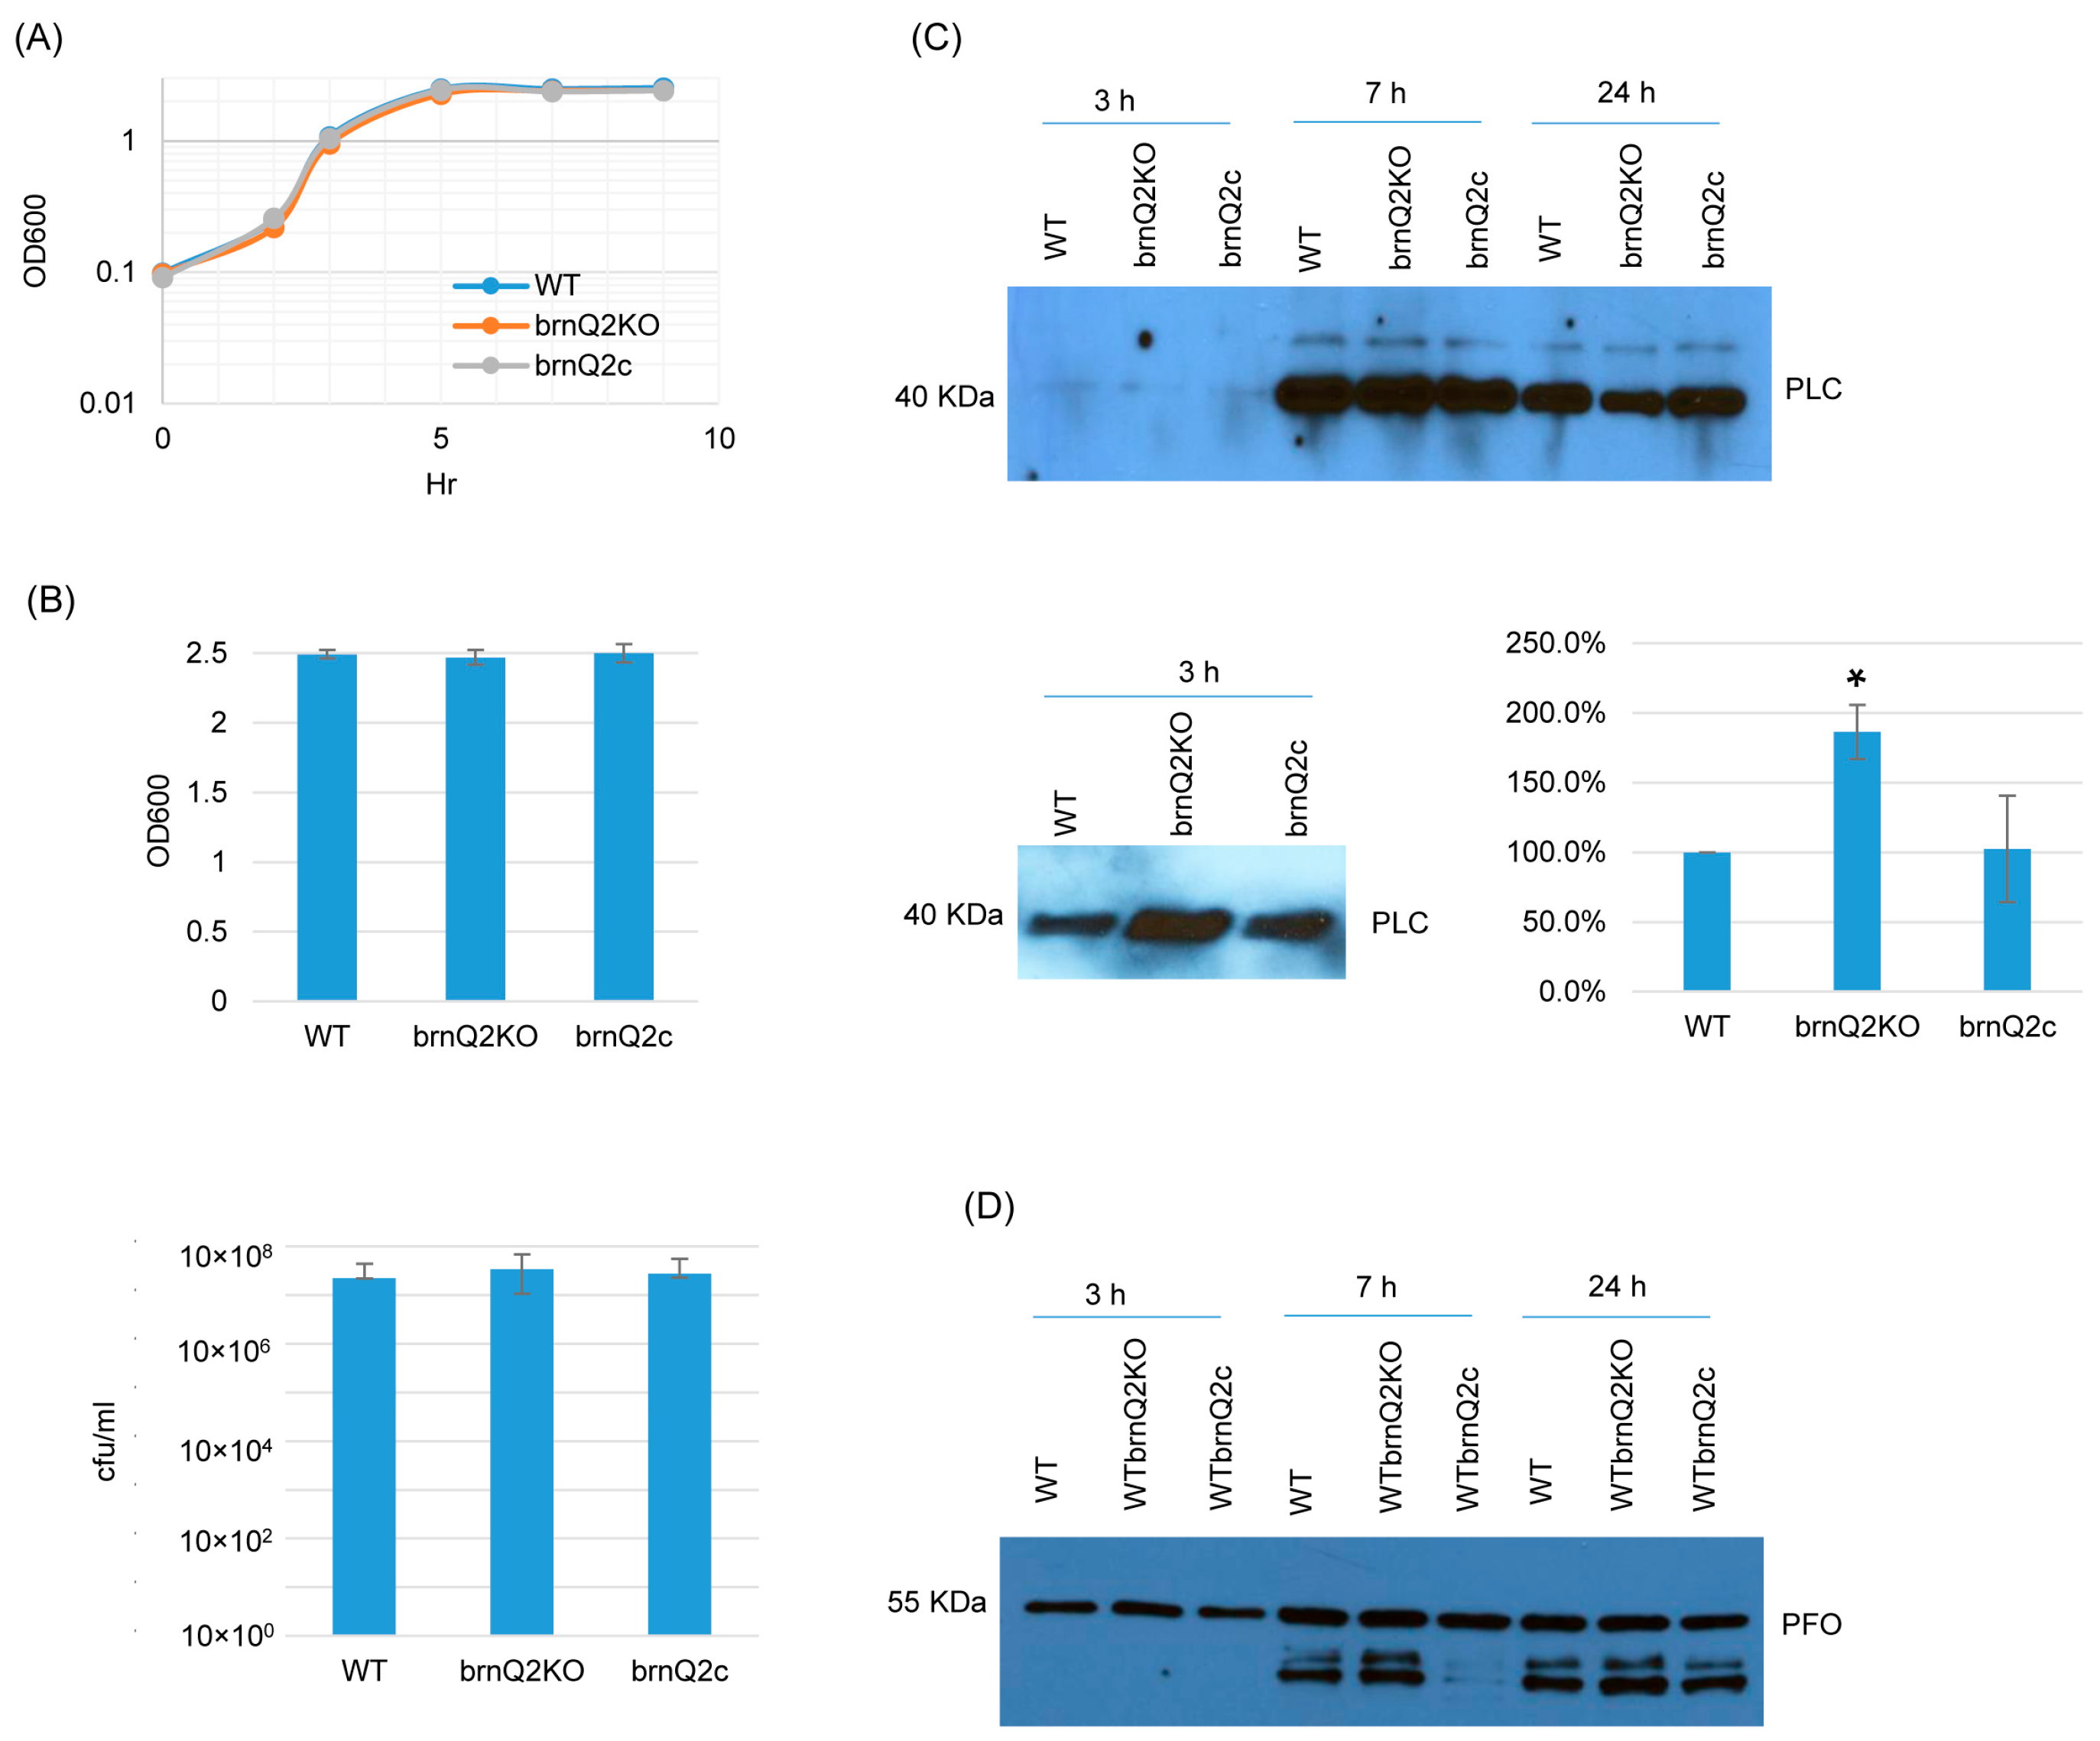
For the brnQ2 null mutant, RT-PCR confirmed that it does not express brnQ2, and complementation restored the expression of this transporter gene (Figure S4B). In TY medium at 37 °C, the brnQ2 mutant and complementing strain both grew similarly as the wild-type strain (Figure 3A) up to 9 h. Even at a 24 h culture time point, culture OD600 values and BHI agar plate counting (CFU) results remained similar for all three strains (Figure 3B). However, in contrast to the brnQ1 mutant, the brnQ2 mutant produced more PLC than ATCC3624 after 3 h of culture, and this effect was substantially reversed by complementation (Figure 3C). Using Image J software to compare the Western blot band intensity ratio among the wild-type, null mutant, and complementing strains for 3 h culture confirmed that the brnQ2 null mutant strain makes more PLC compared to the wild type and complementing strains. By 7 or 24 h of culture, PLC production by the brnQ2 mutant reverted to wild-type levels (Figure 3C). Similarly, as observed for the brnQ1 mutant, no differences in PFO production were noted between the brnQ2 mutant vs. its wild-type parent or complementing strain at any time point (Figure 3D).

Figure 3.
A comparison of post-inoculation changes in culture OD600, vegetative cell viability, and PLC or PFO production levels for ATCC3624 (WT), its brnQ2 null mutant (brnQ2KO), and the complementing strain (brnQ2c) when cultured in TY medium. (A) Post-inoculation changes in the OD600 of TY cultures of these strains from 0 to 9 h at 37 °C. The result shown is representative of three repetitions. (B) The OD600 of TY cultures at 24 h at 37 °C (top). The same samples were used for colony counting of viable vegetative cells (bottom). The mean values from three independent experiments are shown. The error bars indicate the S.D. (C) Western blot analyses of PLC levels in supernatants of 3, 7, and 24 h culture samples (top panel). The PLC blot was also repeated using 10 µL more of the same 3 h TY samples, with longer film exposure (bottom left blot), to allow for a better comparison of PLC production between the brnQ2 null mutant vs. wild-type ATCC3624 or the complementing strain. The size of proteins in kiloDaltons (kDa) is shown on the left. A comparison of the Western blot band intensity ratio is shown between 3 h samples (bottom right graph) using Image J software. The mean values from three independent experiments are shown. The error bars indicate the S.D. * p < 0.05 relative to the wild type. Similar analyses did not detect PLC production differences among the strains in 7 or 24 h samples (Figure S5B). (D) Western blot analyses of PFO levels in supernatants of 3, 7, and 24 h culture samples. The results shown are representative of three repetitions. The size of proteins in kiloDaltons (kDa) is shown at left. Image J software did not detect significant differences in PFO production among the strains at any time points (Figure S5B).
Lastly, RT-PCR showed that the brnQ3 mutant does not express this transporter gene, and complementation reversed that defect (Figure S4C). The brnQ3 mutant also grew similarly as its wild-type parent or complementing strain at all time points (Figure 4A,B). For PLC production, the behavior of the brnQ3 null mutant resembled that of the brnQ1 null mutant; i.e., this null mutant produced less PLC compared to the wild-type parent or complementing strain, but only for 3 h of culture. Using Image J software to compare the Western blot band intensity ratio among the wild-type, null mutant, and complementing strains for the 3 h culture confirmed that the brnQ3 null mutant strain makes less PLC compared to the wild-type and complementing strains (Figure 4C). No differences in PFO production were observed between brnQ3 vs. wild-type ATCC3624 or the complementing strain at any tested time point (Figure 4D).
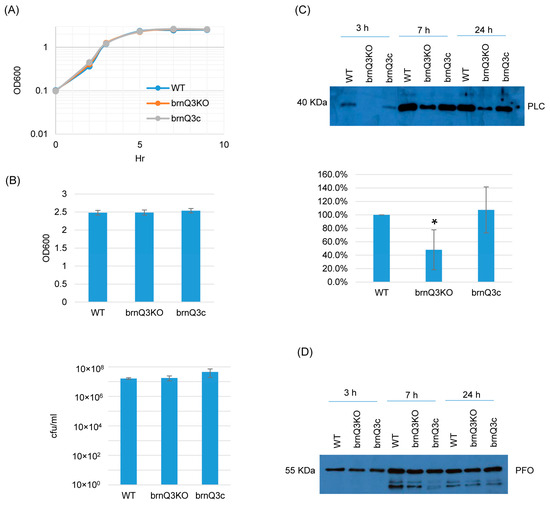
Figure 4.
A comparison of the post-inoculation changes in culture OD600, vegetative cell viability, and PLC or PFO production levels for ATCC3624 (WT), its brnQ3 null mutant (brnQ3KO), and the complementing strain (brnQ3c) when cultured in a TY medium. (A) Post-inoculation changes in the OD600 of TY cultures from 0 to 9 h at 37 °C. The result shown is representative of three repetitions. (B) The OD600 of TY cultures at 24 h at 37 °C (top). The same samples were also used for colony counting of viable vegetative cells (bottom). The mean values from three independent experiments are shown. The error bars indicate the S.D. (C) Western blot analyses of PLC levels in supernatants of 3, 7, and 24 h culture samples (top panel). The size of proteins in kiloDaltons (kDa) is shown on the left. A comparison of the Western blot band intensity ratio is shown between 3 h samples (bottom graph) using Image J software. The mean values from three independent experiments are shown. The error bars indicate the S.D. * p < 0.05 relative to the wild type. Similar analyses did not detect PLC production differences among these strains in 7 or 24 h samples (Figure S5C). (D) Western blot analyses of PFO levels in supernatants of 3, 7, and 24 h culture samples. The results shown are representative of three repetitions. The size of proteins in kiloDaltons (kDa) is shown on the left. Image J analyses did not detect significant differences in PFO production among these strains at any time points (Figure S5C).
2.4. Expression of Each BrnQ Gene Affects the Expression of the Other BrnQ Genes
In S. aureus USA300 strains, the mutation of brnQ2 results in the overexpression of brnQ1 [14]. Therefore, the current study performed qRT-PCR to evaluate if eliminating the expression of one C. perfringens brnQ gene affected the expression of the other two brnQ genes. The results, shown in Figure 5A, indicated that the brnQ1 null mutant exhibits increased brnQ2 expression but decreased brnQ3 expression. Results for the brnQ3 null mutant were similar; i.e., for this mutant, the expression of brnQ2 increased, but the expression of brnQ1 decreased (Figure 5C). However, for the brnQ2 null mutant, both brnQ1 and brnQ3 expression levels significantly decreased (Figure 5B). Collectively, these results showed that the expression of any brnQ gene impacts the expression of the other two brnQ genes, but the nature of this regulatory effect varies among the three brnQ genes.
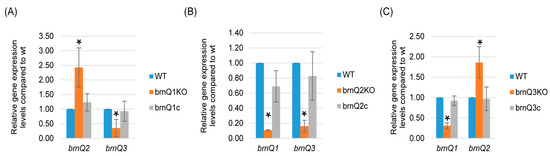
Figure 5.
A comparison of expression of the brnQ genes by wild-type ATCC3624, its isogenic brnQ null mutants, and complementing strains. ATCC3624, the single brnQ null mutants, or complementing strains were inoculated into TY broth and then incubated anaerobically for 2 h at 37 °C. Bacteria were collected and pelleted via centrifugation. Total RNA was extracted from the pellets, and cDNA was made for RT-qPCR analyses. Average CT values were normalized to the housekeeping recA gene, and the fold differences in expression were calculated using the comparative CT method (2−ΔΔCT). The mean values from three independent experiments are shown. The error bars indicate the S.D. (A) RT-qPCR for the expression of brnQ2 or brnQ3 was performed using cDNA from the wild-type parent, the brnQ1 null mutant, and the complementing strain after their incubation in a TY medium for 2 h. The mean values from three independent experiments are shown. The error bars indicate the S.D. * p < 0.05 relative to the wild type. (B) RT-qPCR for the expression of brnQ1 or brnQ3 was performed using cDNA from the wild type-parent, the brnQ2 null mutant, and the complementing strain after their incubation in TY medium for 2 h. The mean values from three independent experiments are shown. The error bars indicate the S.D. * p < 0.05 relative to the wild type. (C) RT-qPCR for the expression of brnQ1 or brnQ2 was performed using cDNA from the wild-type parent, the brnQ3 null mutant, and the complementing strain after their incubation in TY medium for 2 h. The mean values from three independent experiments are shown. The error bars indicate the S.D. * p < 0.05 relative to the wild type.
2.5. Preparation and Characterization of BrnQ Double Null Mutant Strains
To begin testing for functional redundancy among the BrnQ BCAA transporters for C. perfringens growth and toxin production, we prepared three brnQ double null mutant strains named brnQ2/Q3DKO, brnQ1/Q3DKO, and brnQ1/Q2DKO. PCR confirmed that the only wild-type brnQ gene remaining in brnQ2/Q3DKO was the brnQ1 gene, the only wild-type brnQ gene remaining in brnQ1/Q3DKO was the brnQ2 gene, and the only wild-type brnQ gene remaining in brnQ1/Q2DKO was the brnQ3 gene (Figure S6A). After curing the mutagenesis plasmid from each double mutant, DNA from the wild-type parent and each brnQ double null mutant was subjected to Southern blot analysis using an intron-specific probe. No probe hybridization to wild-type ATCC3624 DNA was detected, but two intron insertions were detected using DNA from each double null mutant (Figure S6B). RT-PCR specific for each brnQ gene confirmed that the only brnQ gene expressed by brnQ2/Q3DKO was brnQ1, the only brnQ gene expressed by brnQ1/Q3DKO was brnQ2, and the only brnQ gene expressed by brnQ1/Q2DKO was brnQ3 (Figure S6C).
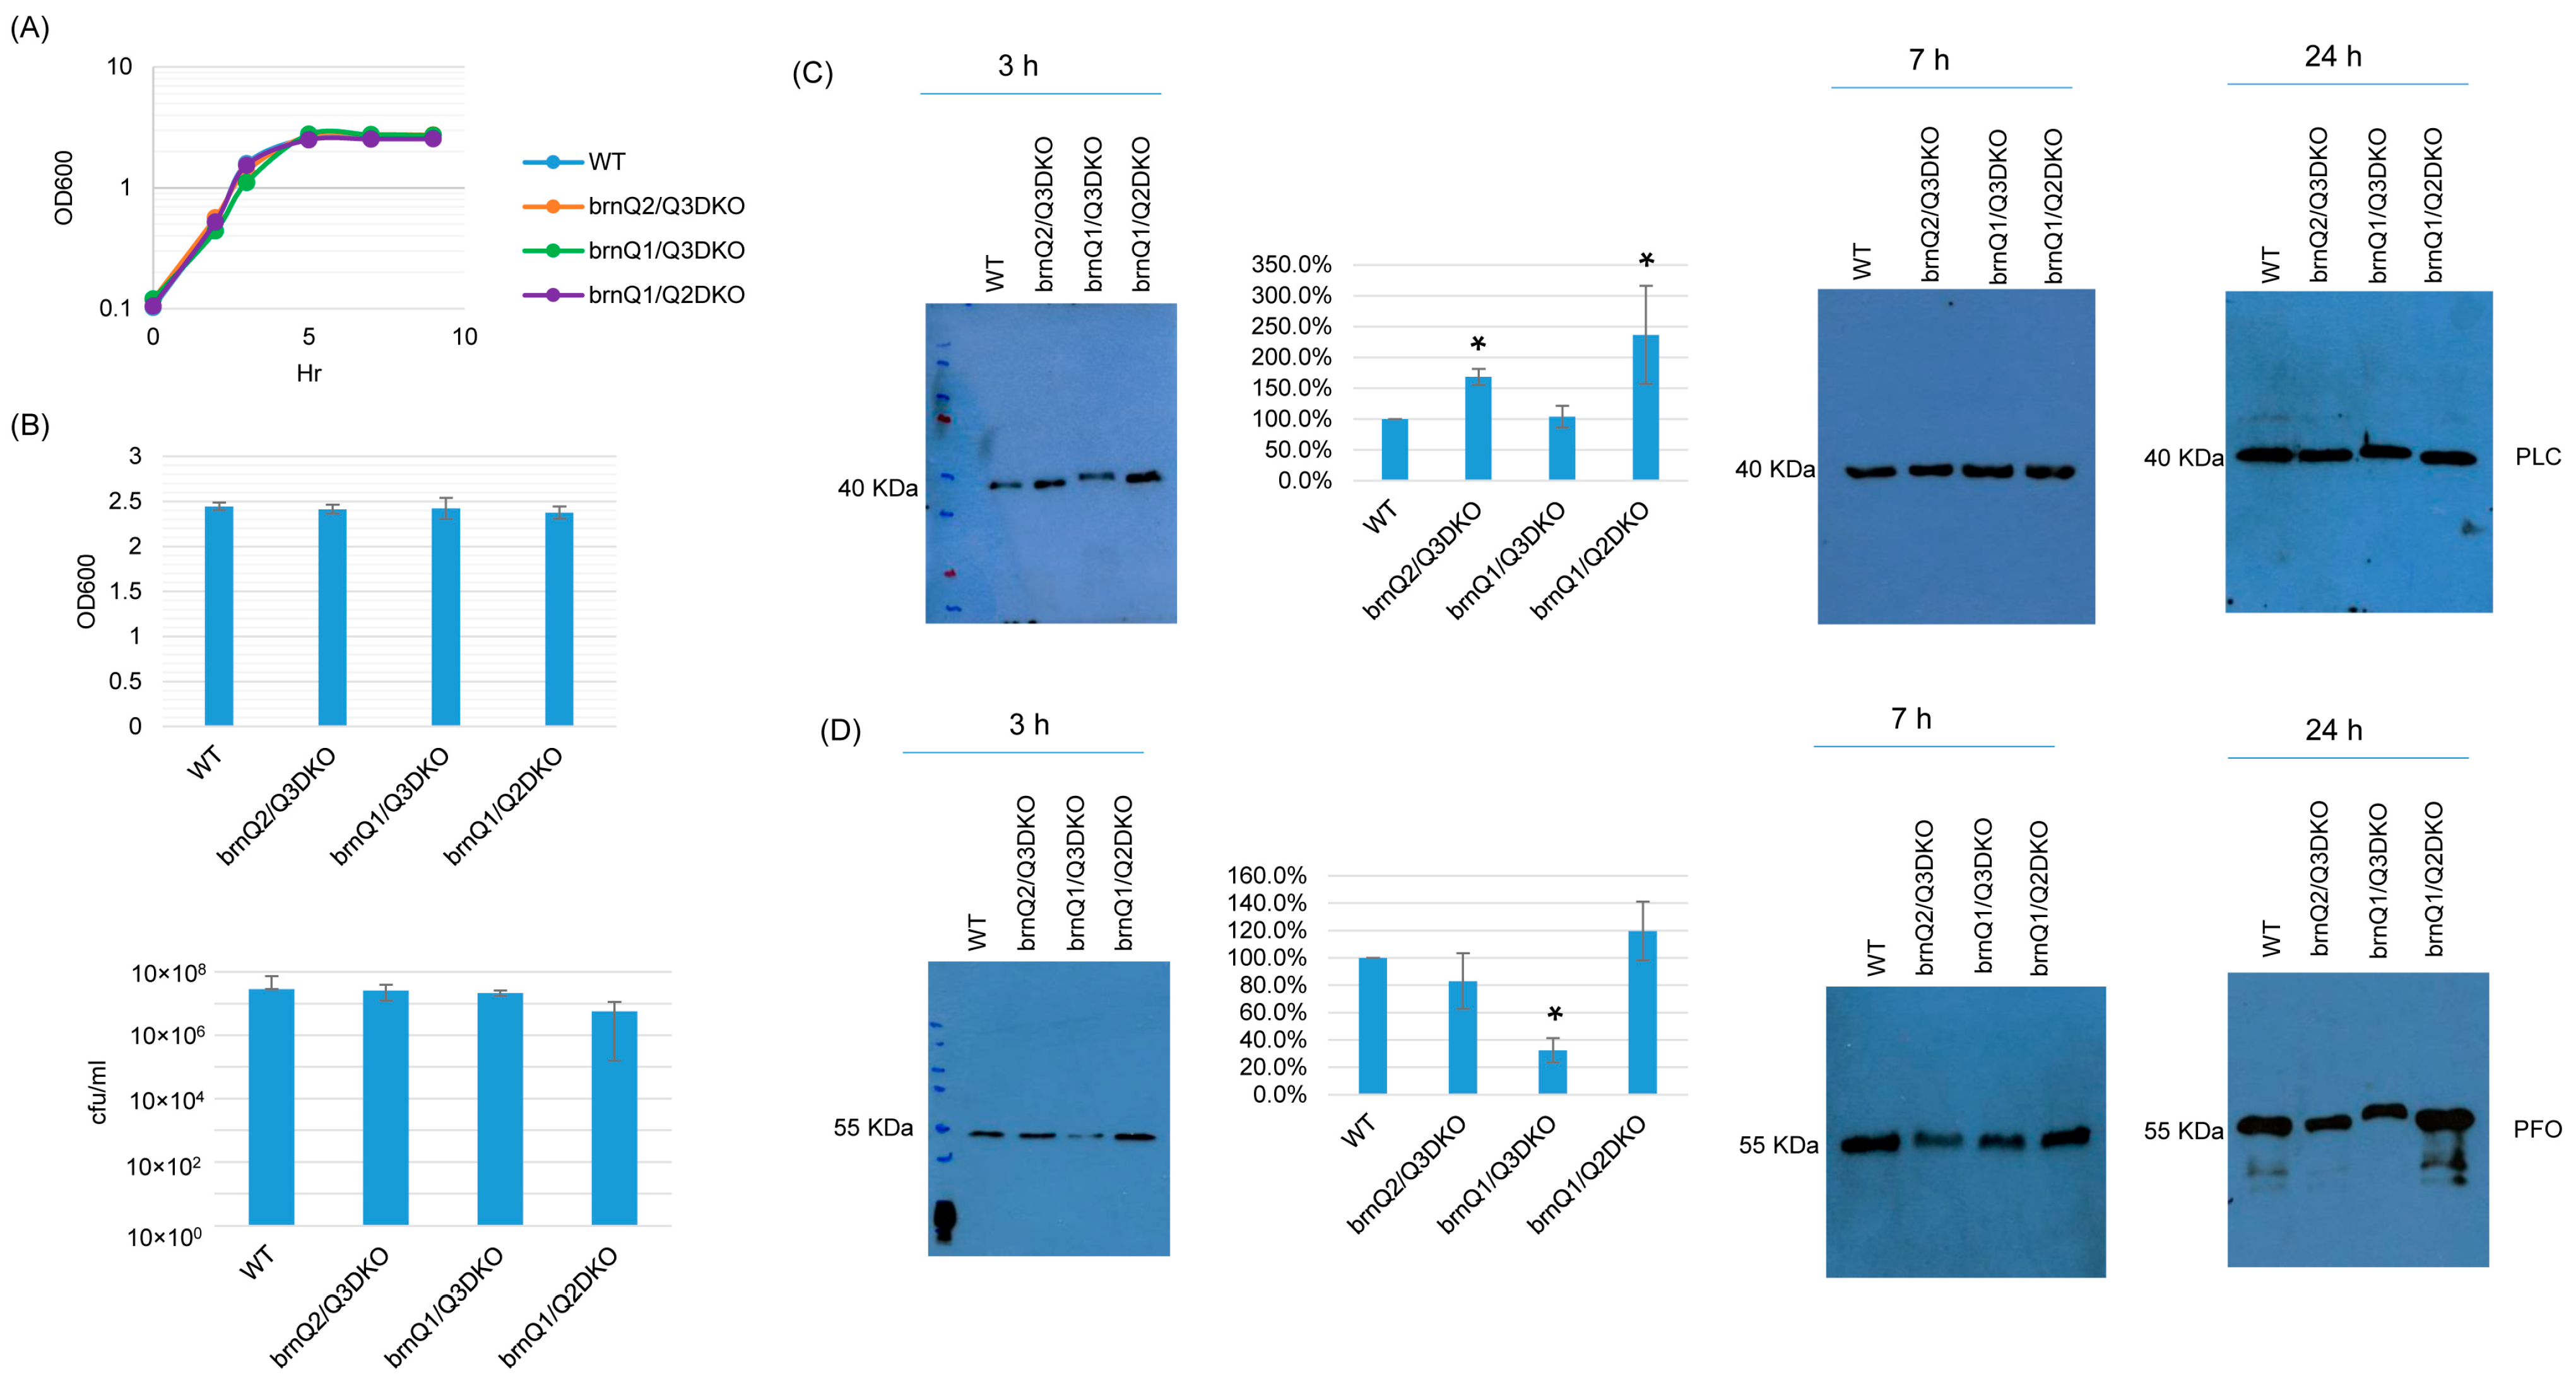
TY culture growth curves showed that the double null mutants grew similarly as their wild-type parent (Figure 6A). When culture was extended to 24 h, the OD600 and plate count results (CFU) for the double null mutants were also the same as for the wild type (Figure 6B). With respect to toxin production, both PLC and PFO production were impacted by the absence of two brnQ genes, but only at 3 h. At that time point, the brnQ2/Q3DKO and brnQ1/Q2DKO mutants produced more PLC compared to their wild-type parent. However, the brnQ1/Q3DKO mutant still produced PLC at wild-type levels. Using Image J software to compare the Western blot band intensity ratio among the wild type and double null mutants for 3 h cultures, the result also confirmed that brnQ2/Q3DKO and brnQ1/Q2DKO make more PLC compared to the wild type (Figure 6C). While there was no effect on PFO production for the single brnQ null mutants, PFO production decreased for the brnQ1/Q3DKO strain at 3 h. Using Image J software to compare the Western blot band intensity ratio among the wild type and double null mutants for 3 h cultures, the results also confirmed that only brnQ1/Q3DKO makes less PLC compared to the wild type. (Figure 6D).
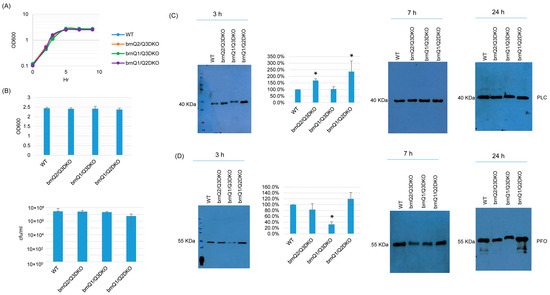
Figure 6.
The characterization of double brnQ null mutant strains in a TY medium. (A) Post-inoculation changes in the OD600 of TY cultures from 0 to 9 h at 37 °C. The result shown is representative of three repetitions. (B) The OD600 of TY cultures at 24 h at 37 °C (top). The same samples were used for colony counting of viable vegetative cells (bottom). The mean values from three independent experiments are shown. The error bars indicate the S.D. (C) Western blot analyses of PLC levels in the supernatants of some panel A and panel B samples (3 h, 7 h, and 24 h culture). The results shown are representative of three repetitions. The size of proteins in kiloDaltons (kDa) is shown on the left. A comparison of the Western blot band intensity ratio between 3 h samples (graph) using the Image J software. The mean values from three independent experiments are shown. The error bars indicate the S.D. * p < 0.05 relative to the wild type. Similar analyses did not detect any PLC production differences among these strains in 7 or 24 h samples (Figure S7A). (D) Western blot analyses of PFO levels in the supernatants of 3, 7, and 24 h culture samples. The results shown are representative of three repetitions. The size of proteins in kiloDaltons (kDa) is shown on the left. A comparison of the Western blot band intensity ratio is shown between 3 h samples (graph) using Image J software. The mean values from three independent experiments are shown. The error bars indicate the S.D. * p < 0.05 relative to the wild type. Similar analyses did not detect any PFO production differences among these strains in 7 or 24 h samples (Figure S7B).
Results in Figure 6 suggest that, at the early culture stage, BrnQ2 is important for normal PLC production, and BrnQ1 and BrnQ3 together are important for normal PFO production. To confirm these relationships, we complemented the brnQ2/Q3DKO and brnQ1/Q2DKO mutants using a shuttle plasmid containing the brnQ2 gene. We also prepared complementing strains where the brnQ1 or brnQ2 gene were separately transformed into the brnQ1/Q2DKO mutant. Both PCR and RT-PCR results (Figure S8A,B) showed restored brnQ2 gene expression when the brnQ2/Q3DKO or brnQ1/Q2DKO mutants were complemented with the brnQ2 gene. Similarly, brnQ1 or brnQ3 expression was restored when the brnQ1/Q3DKO mutant was complemented with, respectively, either the brnQ1 or brnQ3 gene. Western blot and image J results then revealed that the restoration of brnQ2 expression via the complementation of brnQ2/Q3DKO or brnQ1/Q2DKO decreased PLC production. After transforming the brnQ1 or brnQ3 gene back into the brnQ1/Q3DKO mutant, these complemented strains produced wild-type levels of PFO (Figure 7A,B).
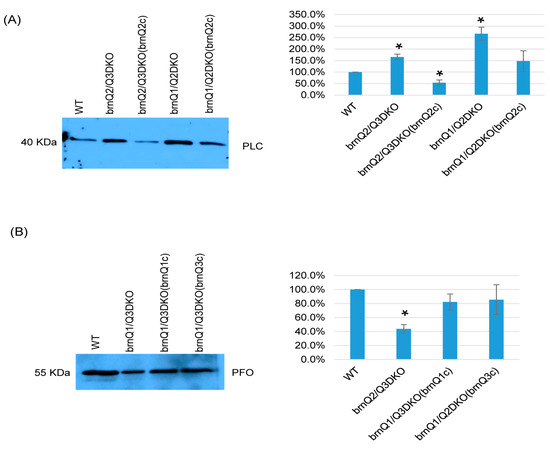
Figure 7.
A comparison of PLC or PFO production levels for wild-type ATCC3624, its double null mutants, and the complementing strain when cultured in a TY medium. Western blot analyses of PLC (A) and PFO (B) levels in supernatants of the wild type, double null mutants, and their complementing strains in the early-stage culture (3 h). The results shown are representative of three repetitions. The size of proteins in kiloDaltons (kDa) is shown on the left. The right figure in panels A and B show the comparison of Western blot intensities determined by Image J. The mean values from three independent experiments are shown. The error bars indicate the S.D. * p < 0.05 relative to the wild type.
2.6. BrnQ Triple Null Mutant Preparation and Characterization
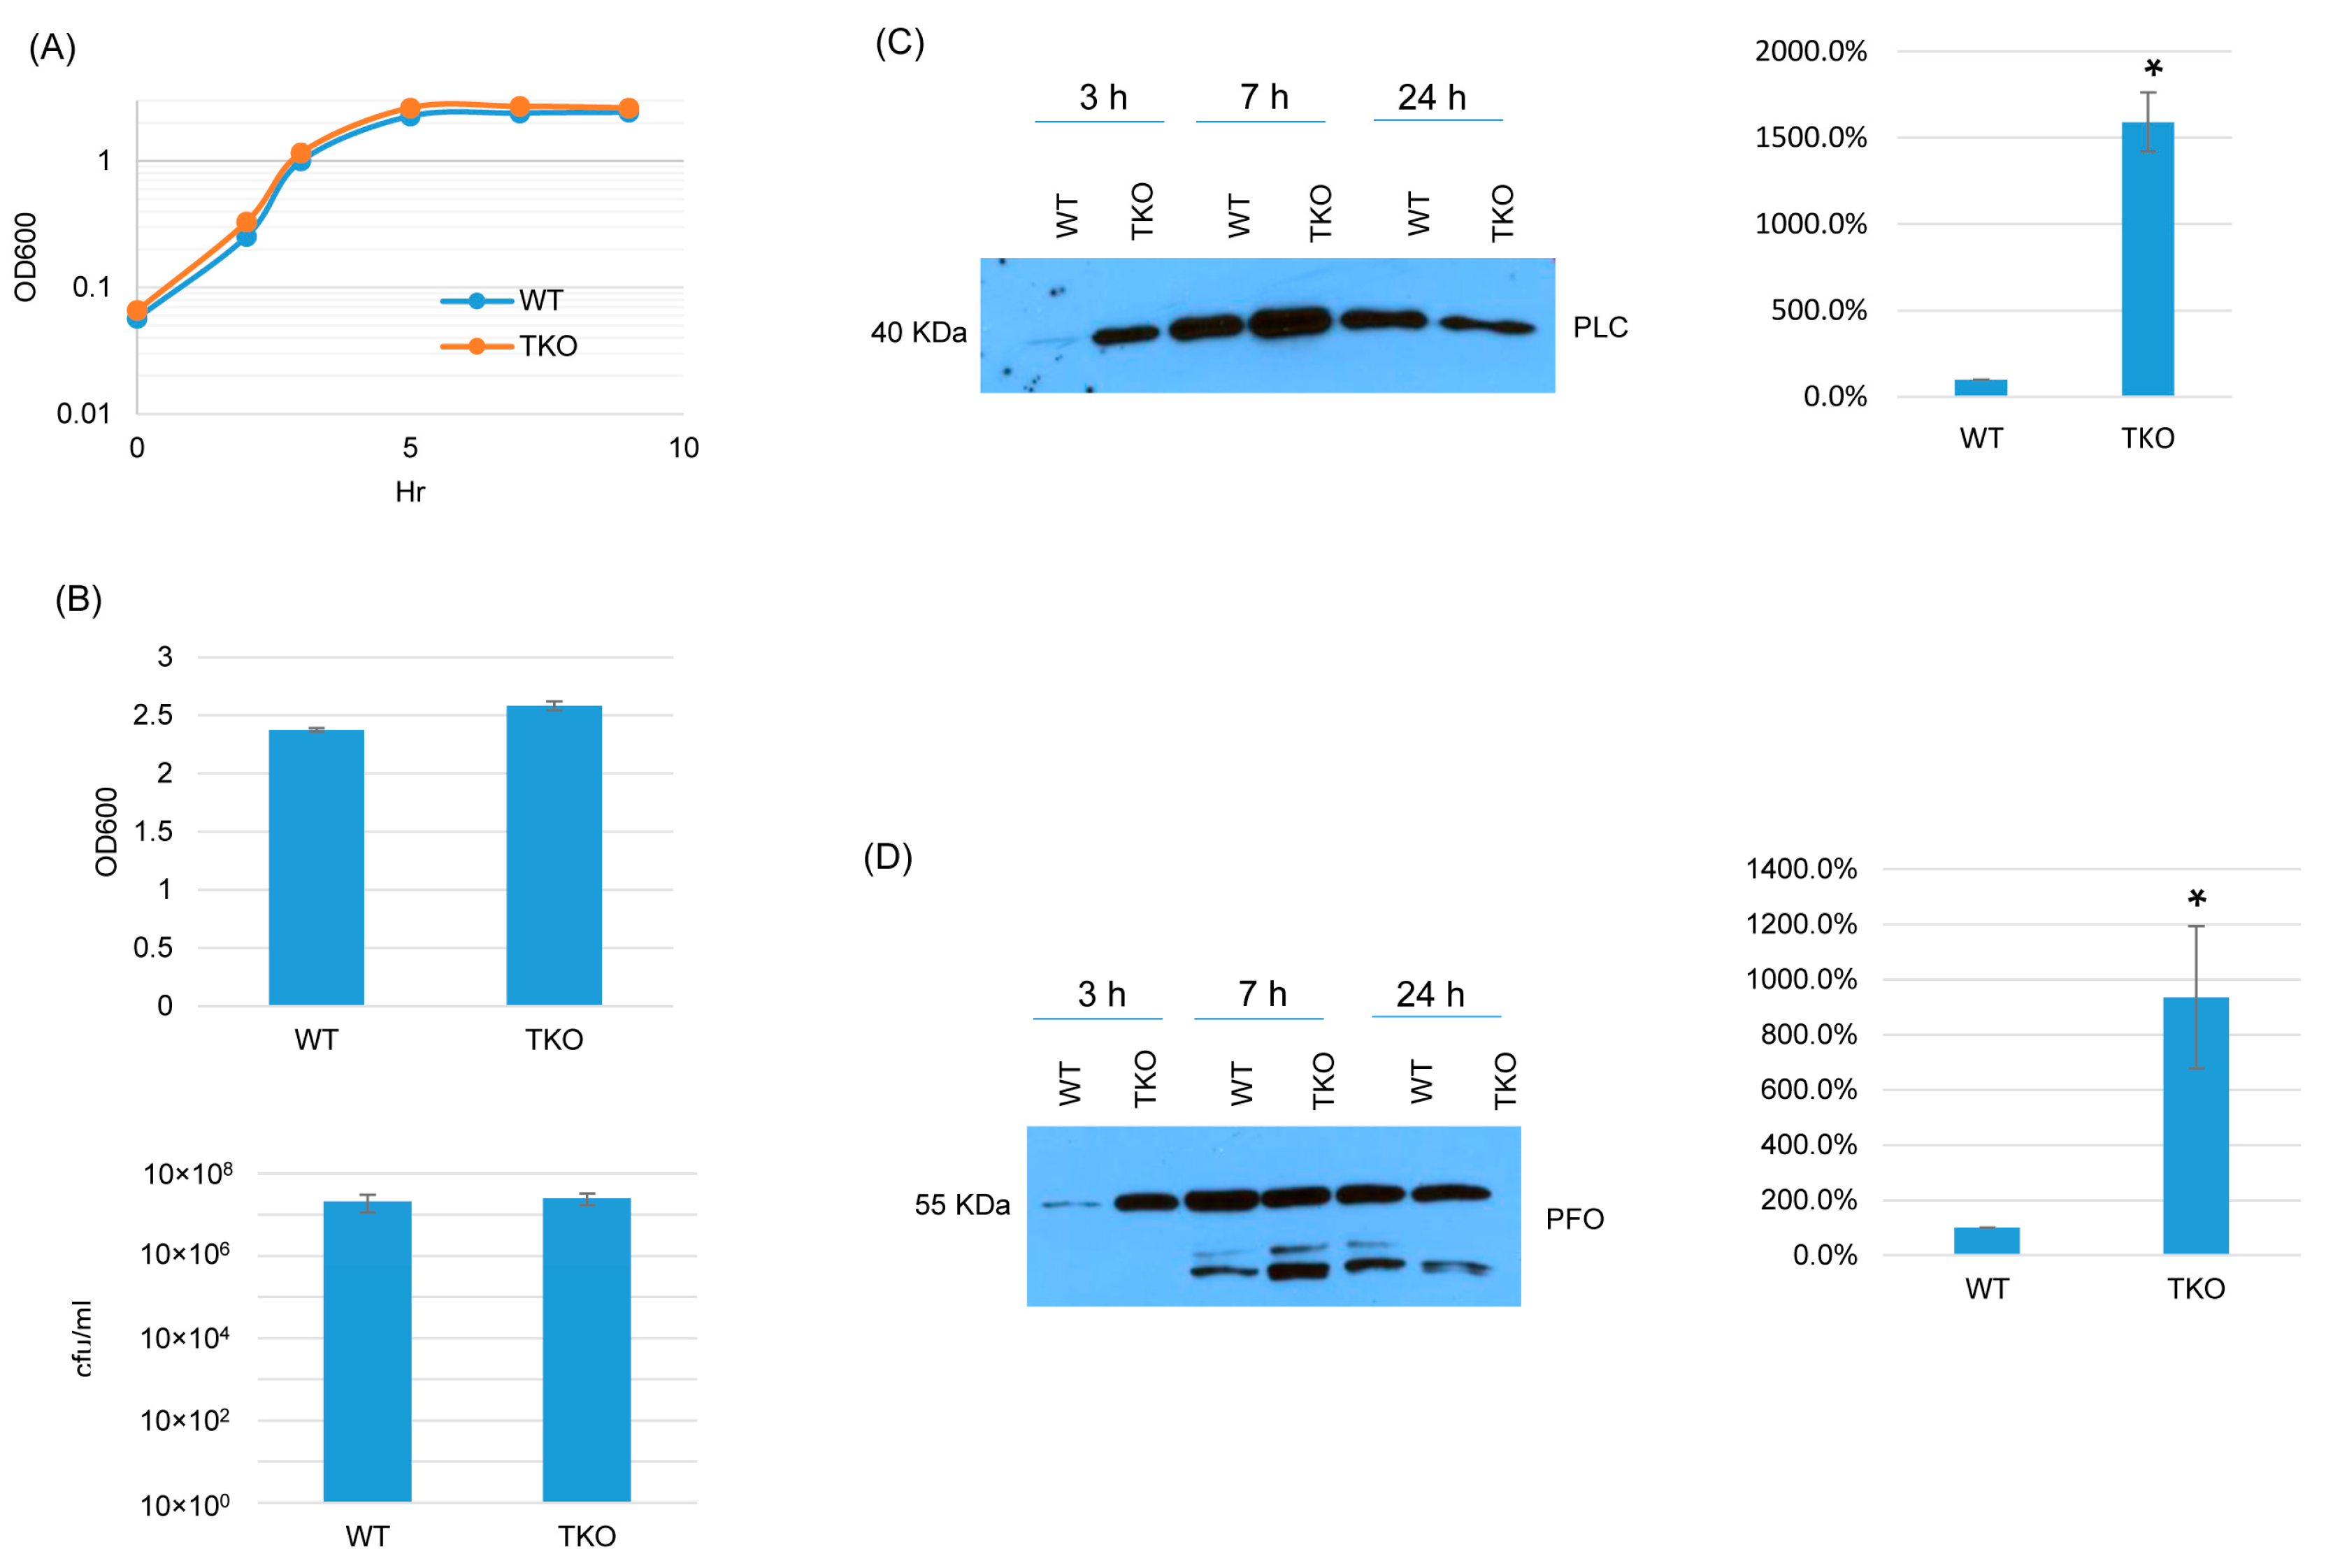
Since BCAA uptake is essential for C. perfringens growth and survival [16,17], we explored whether the three BrnQ transporters together are essential for growth and survival but have functional redundancy. If these three transporters are completely redundant but at least one is essential for growth and survival, it should not be possible to construct a triple brnQ null mutant. Surprisingly, a triple brnQ null mutant strain of ATCC3624 (TKO) was obtained. PCR showed that all three brnQ genes contained an intron insertion (Figure S9A). An intron-specific Southern blot indicated that three introns had inserted in the triple null mutant genome (Figure S9B). RT-PCR did not detect the expression of any of these three BrnQ genes in this triple null mutant (Figure S9C).
In TY medium, this triple brnQ null mutant grew and survived similarly as wild-type ATCC3624 (Figure 8A,B). Interestingly, after the inactivation of all three brnQ genes, both PLC and PFO increased compared to wild-type ATCC3624, especially in the early culture stage. Using the Image J software to compare the Western blot band intensity ratio among the wild type and triple null mutants for the 3 h culture, the result also confirmed that TKO makes more PLC and PFO compared to the wild type (Figure 8C,D).

Figure 8.
A comparison of post-inoculation changes in culture OD600, vegetative cell viability, or PLC and PFO production levels for ATCC3624 (WT) vs. the triple null mutant (TKO) when cultured in a TY medium. (A) Post-inoculation changes in the OD600 of TY cultures incubated for up to 9 h at 37 °C. The results shown are representative of three repetitions. (B) The OD600 of TY cultures after 24 h of incubation at 37 °C (top). The same samples were used for colony counting of viable vegetative cells (bottom). The mean values from three independent experiments are shown. The error bars indicate the S.D. (C) Western blot analyses of PLC levels in the supernatants of panel A and B samples (3 h, 7 h and 24 h). The results shown are representative of three repetitions. The size of proteins in kiloDaltons (kDa) is shown on the left. A comparison of the Western blot band intensity ratio between 3 h samples (right graph) using Image J software. The mean values from three independent experiments are shown. The error bars indicate the S.D. * p < 0.05 relative to the wild type. Similar analyses did not detect any PLC production differences among these strains in 7 or 24 h samples (Figure S10A). (D) Western blot analyses of PFO levels in the supernatants of panel A and B samples (3 h, 7 h and 24 h). The results shown are representative of three repetitions. The size of proteins in kiloDaltons (kDa) is shown on the left. The right graph in panel D shows the comparison of the Western blot band intensity ratio between 3 h samples using the Image J software. The mean values from three independent experiments are shown. The error bars indicate the S.D. * p < 0.05 relative to the wild type. Similar analyses did not detect any PFO production differences among these strains in 7 or 24 h samples (Figure S10B).
3. Discussion
Since C. perfringens cannot synthesize BCAAs, the uptake of BCAAs from the environment is essential for its growth and survival [15,16,17]. Despite their importance, the BCAA transporters of C. perfringens have not been investigated until now. This study examined the role of BrnQ proteins in C. perfringens growth and toxin production since these are important BCAA transporters for several other bacteria. Mutants that are unable to produce one or several of the three BrnQ transporters encoded in the C. perfringens genome, namely BrnQ1, BrnQ2 and BrnQ3, were constructed. Notably other pathogenic clostridia, including Clostridiodes difficile and Clostridium botulinum, also produce BrnQ proteins, but the role of those proteins for the growth of these other clostridial pathogens has not been explored, even though they require BCAA supplementation for growth [27,28,29].
The first finding of the current study is confirmation that all three brnQ genes are expressed by C. perfringens type A strain ATCC3624. This expression begins during early log phase growth. However, the expression of brnQ1 later decreased, while brnQ2 and brnQ3 expression remained constant into the stationary phase. Furthermore, loss of the expression of one brnQ gene was found to affect the expression of the other two brnQ genes in C. perfringens, although the nature of this effect was variable. The expression of the brnQ1 gene decreased for both the brnQ2 and brnQ3 mutants, and similarly, the expression of brnQ3 decreased for both the brnQ1 and brnQ2 mutants. These effects were all reversible through complementation. In contrast, mutants unable to express either brnQ1 or brnQ3 increased brnQ2 expression, and this effect was also reversible via complementation. Collectively, these results indicate that, in C. perfringens, brnQ2 expression is regulated differently from the expression of the other two brnQ genes. This observation is similar to reports with other bacteria where mutating one brnQ gene also affected the expression of another brnQ gene; e.g., the mutation of brnQ2 in S. aureus resulted in the overexpression of brnQ1 [14]. To our knowledge, the basis for these regulatory effects of brnQ mutations or the expression of other brnQ genes is not yet clear for any bacteria.
The current study then used these single, double, and triple brnQ null mutants to probe BCAA transporter contributions to ATCC3624 growth and survival in the TY culture. All mutants, even the triple mutant, grew similarly as the wild-type parent. Similarly, there was no difference in 24 h vegetative cell viability (i.e., survival) between the triple brnQ mutant vs. the wild type under this culture condition. Determining that these three BCAA transporter genes are not essential for the growth and survival of this strain, at least under these culture conditions, was somewhat surprising since C. perfringens cannot synthesize its own BCAAs [15,16,17]. Therefore, these findings imply that there should be another pathway for ATCC3624 to obtain BCAAs from the environment. In other bacteria, this has been established; e.g., B. subtilis makes several other permeases, including BcaP and BraB, that (in addition to a BrnQ protein) help mediate BCAA uptake [19]. However, even a triple brnQ, bcaP, and braB null mutant of a B. subtilis auxotroph remained viable, indicating that this bacterium still produces at least one additional BCAA transporter [19]. Genes encoding BcaP or BraB homologues were not identifiable in C. perfringens genomes. Inspection of C. perfringens genomes deposited in GenBank did detect genes encoding 10 annotated amino acid ABC transporters. Those genes are worthy of further investigation [15,18] since the ABC transporter permease LivJHMGF mediates branched-chain amino acid uptake and virulence in Streptococcus pneumoniae [30]. Future studies are also needed to distinguish whether, for C. perfringens, there is functional redundancy between the BrnQ transporters and the still unidentified non-BrnQ BCAA transporter or if that unidentified transporter is essential for growth.
A final contribution of the current study is demonstrating that the presence of brnQ genes impacts toxin production levels by ATCC3624. Previous studies with other pathogens, such as S. aureus, hypothesized that the effects of brnQ expression on toxin production might explain the virulence attenuation observed for some brnQ mutants of those pathogens [22]. However, demonstrating altered toxin production by those brnQ null mutants was either not attempted or was inconclusive [24].
For C. perfringens, it is notable that the effects of brnQ expression on PLC production occur mainly at the early growth stage, a time when all three brnQ genes are well expressed. Control of toxin production via the expression of brnQ genes does not involve their impact on C. perfringens’s growth rate since, as mentioned above, all brnQ null mutants grew similarly as the wild-type parent. In addition, while all three single brnQ mutants exhibited altered PLC production, their phenotypes varied. Both the single brnQ1 and brnQ3 null mutants produced less PLC compared to their wild-type parent in the 3 h culture samples, and those mutants also exhibited significantly more brnQ2 expression compared to the wild type. In contrast, the brnQ2 null mutant produced more PLC compared to wild-type ATCC3624 but also showed decreased expression of the brnQ1 and brnQ3 genes. Those effects were all reversible through complementation. Double null mutant strains and their complementing strains provided further insights into the effects of brnQ gene expression on PLC production. Double mutants that only express brnQ1 or brnQ3, i.e., double mutants lacking brnQ2 expression, made more PLC at 3 h compared to their wild-type parent. The same phenotype was observed for the triple brnQ mutant. Collectively, these results suggest that mutants unable to express brnQ2, which also express lower levels of both the brnQ1 and brnQ3 genes, sense nutrient stress, i.e., a lower intracellular BCAA pool. In response, C. perfringens may try to compensate for this deficit by transiently increasing the production of PLC, which we have shown recently is upregulated in the presence of host cells and can release nutrients (presumably including BCAAs) from those host cells [6].
In contrast to the effects of brnQ expression on PLC production, all three single null mutants produced similar PFO levels as wild-type ATCC3624. However, double null mutant strains and their complementing strains showed that the simultaneous loss of expression of both brnQ1 and brnQ3 transiently impacts PFO production since a double mutant only expressing brnQ2 made less PFO than its wild-type parent after 3 h of culture. After complementing one of the inactivated brnQ genes in each double mutant, PFO production recovered to wild-type levels. PFO production also transiently increased for the triple mutant, further supporting the importance of the simultaneous expression of brnQ1 (or brnQ3) and brnQ2 for wild-type levels of PFO production. The profound decreases in expression levels of brnQ genes impact PFO production, which also supports the hypothesis that reduced brnQ gene expression levels signal C. perfringens to nutrient stress, so a transient increase in toxin production is warranted to gain access to more nutrients [6].
The mechanisms behind the regulatory effects of brnQ expression on toxin production will require further study. It is not surprising that some brnQ mutants showed phenotypic divergence in the production of PLC vs. PFO considering that the regulation of production of these two toxins only partially overlaps [31,32,33]. For some other bacteria, BCAA transporters alter intracellular BCAA levels to regulate the regulatory activity of the BCAA-binding transcriptional regulatory protein CodY, which then impacts toxin production [19,34]. A similar mechanism may also apply to C. perfringens. However, a CodY mutant of a C. perfringens type D strain did not show altered PLC or PFO activity relative to its parent [35], so the situation could be more complicated in C. perfringens and warrants future study.
Lastly, the expression and functional importance of brnQ genes may differ in the host versus lab medium. These relationships may even vary among different people. For example, C. perfringens is a leading cause of gas gangrene in diabetics [36], who have abnormally high blood BCAA levels [37]. C. perfringens growth or virulence in diabetics may be enhanced when those very high levels of BCAAs are taken up by the BCAA transporters of this bacterium. As mentioned, some BCAA transporter mutants of other bacteria can show altered virulence. Our C. perfringens brnQ mutants were not tested for their virulence in this initial study for ethical reasons; i.e., it is premature to use animals until the BCAA transporter situation in C. perfringens becomes clearer. However, when more information becomes available, future studies should test the most relevant C. perfringens BCAA transporter mutants in animal virulence models.
4. Materials and Methods
4.1. Media and Chemicals
C. perfringens was stored in a cooked meat medium (CMM, Oxoid) at −20 °C. Escherichia coli DH5α competent cells were kept in as glycerol stocks at −80 °C. The following media were used for the growth of C. perfringens wild-type ATCC3624, its isogenic brnQ null mutants, and complementing strains: fluid thioglycolate medium (FTG) (Difco Laboratories, Detroit, MI, USA); TY broth (3% tryptic soy broth [Becton-Dickinson Franklin Lakes, NJ, USA], 1% yeast extract [Becton Dickinson], and 0.1% sodium thioglycolate [Sigma-Aldrich, St. Louis, MO, USA]); or TGY broth (TY broth supplemented with 2% glucose [Sigma-Aldrich]). Brain–heart infusion (BHI) agar (Research Products International, Mt. Prospect, IL, USA) plates, with or without 15 μg mL−1 chloramphenicol (CM, Sigma-Aldrich), were used to count vegetative cells (CFU) or to select brnQ mutants and complementing strains. For anaerobic culture of C. perfringens, an MGC AnaeroPack®-Anaero (Mitsubishi Gas Chemical CO. INC, Tokyo, Japan) container system was used. To culture DH5α, Luria–Bertani, Miller (LB) broth, or LB agar (Fisher Scientific, Waltham, MA, USA) was used. All bacteria were cultured at 37 °C.
All other chemical reagents used in this study were purchased from Fisher Scientific, Bio-Rad (Hercules, CA, USA), or Sigma Aldrich.
4.2. Bacteria Strains, Plasmids, and Primers
The current study used C. perfringens type A strain ATCC3624 (ATCC®, Manassas VA, USA) and E. coli DH5α competent cells [New England Biolabs (NEB), Ipswich, MA, USA]. The plasmid vectors used in this study were the E. coli–C. perfringens shuttle plasmid pJIR750ai (for making brnQ mutants) and pJIR750 (for making brnQ complementing strains) [25,26]. The brnQ null mutants of ATCC3624 were prepared via the Clostridium-modified group II TargeTron@ approach [25] using the targeted mutagenesis plasmids pJIR750brnQ1i, pJIR750brnQ2i, and pJIR750brnQ3i. The complementing vectors were pJIR750brnQ1comp, pJIR750brnQ2comp, and pJIR750brnQ3comp. The transformation of ATCC3624 or the brnQ null mutant and complementing strains was performed via electroporation and screened using colony PCR [25]. For the preparation of brnQ mutants, the intron on the newly constructed brnQ mutagenesis plasmids was inserted (in the anti-sense orientation) into the brnQ1, 2, or 3 ORF. The insertion site of each mutant is listed in Table 2 and shown in Figure S2. As previously described [25], the 350 bp intron PCR products amplified using those primers were inserted into pJIR750ai between the HindIII and BsrGI enzyme sites. To construct double brnQ mutants, the brnQ1 gene was inactivated in the brnQ2KO null mutant to create BrnQ1/2DKO, the brnQ1 gene was inactivated in the brnQ3KO null mutant to create BrnQ1/Q3DKO, and the brnQ2 gene was inactivated in the brnQ3KO null mutant to create BrnQ2/Q3DKO. To construct the triple brnQ mutant (TKO), we inactivated the brnQ1 gene in the BrnQ2/Q3DKO double null mutant.

Table 1.
Primers used in this study.
Table 1.
Primers used in this study.
| Primer | Sequence | Size | Purpose |
|---|---|---|---|
| brnQ1-809|810a -IBS | AAAAAAGCTTATAATTATCCTTAAACATCA TAGTGGTGCGCCCAGATAGGGTG | 350 bp | brnQ1 null mutant plasmid (pJIR750brnQ1i) |
| brnQ1-809|810a -EBS1d | CAGATTGTACAAATGTGGTGATAACAGATA AGTCATAGTGCCTAACTTACCTTTCTTTGT | ||
| brnQ1-809|810a -EBS2 | TGAACGCAAGTTTCTAATTTCGGTTATGTTC CGATAGAGGAAAGTGTCT | ||
| EBS universal | CGAAATTAGAAACTTGCGTTCAGTAAAC | ||
| brnQ2-209|210a-IBS | AAAAAAGCTTATAATTATCCTTATGTAACC CTCCTGTGCGCCCAGATAGGGTG | 350 bp | brnQ2 null mutant plasmid (pJIR750brnQ2i) |
| brnQ2-209|210a-EBS1d | CAGATTGTACAAATGTGGTGATAACAGATA AGTCCCTCCTGATAACTTACCTTTCTTTGT | ||
| brnQ2-209|210a-EBS2 | TGAACGCAAGTTTCTAATTTCGGTTTTACAT CGATAGAGGAAAGTGTCT | ||
| EBS universal | CGAAATTAGAAACTTGCGTTCAGTAAAC | ||
| brnQ3- 581|582a-IBS | AAAAAAGCTTATAATTATCCTTAGCTGCCA TTGCAGTGCGCCCAGATAGGGTG | 350 bp | brnQ3 null mutant plasmid (pJIR750brnQ3i) |
| brnQ3- 581|582a-EBS1d | CAGATTGTACAAATGTGGTGATAACAGATA AGTCATTGCATCTAACTTACCTTTCTTTGT | ||
| brnQ3- 581|582a-EBS2 | TGAACGCAAGTTTCTAATTTCGATTGCAGC TCGATAGAGGAAAGTGTCT | ||
| EBS universal | CGAAATTAGAAACTTGCGTTCAGTAAAC | ||
| brnQ1KOF | AGGAACTGGAGGAATTGTAGCA | 442 bp (WT) 1342 bp (KO) | brnQ1 null mutant screening, RT-PCR |
| brnQ1KOR | GCAGTTTCTAAGGCTGGATCT | ||
| brnQ2KOF | AGTTAATAAAAAAGAAATGGGGTCA | 454 bp (WT) 1354 bp (KO) | brnQ2 null mutant screening, RT-PCR |
| brnQ2KOR | TGATAAAGATAGCCAATATGCAAC | ||
| brnQ3KOF | ATCTTTGTATTAAAGCCATCAAAAG | 291 bp (WT) 1191 bp (KO) | brnQ3 null mutant screening, RT-PCR |
| brnQ3KOR | TGCAATAACTGCTGCTTTAATAAG | ||
| brnQ1compF | ATTCgagctcTTAATAGAGGACCTTAAAGGGG TAA (SacI) * | 2273 bp | brnQ1 complementing plasmid (pJIR750brnQ1comp) |
| brnQ1comR | GCAGgtcgacGGGAAAATATATTCTGAGCTTT TAA (SalI) * | ||
| brnQ2compF | ATTCgagctcAAAAAATACACTTAAGGTTGAC AGC (SacI) * | 2030 bp | brnQ2 complementing plasmid (pJIR750brnQ2comp) |
| brnQ2comR | GCAGgtcgacTGCTTGTGATTTTGCTTAATTTA TT (SalI) * | ||
| brnQ3compF | ATTCgagctcCAGTTTTTTATAGCGCCTAAGTA AT (SacI) * | 2516 bp | brnQ3 complementing plasmid (pJIR750brnQ3comp) |
| brnQ3comR | GCAGgtcgacCCCCTCCTACTAAACCAACTAT TAA (SalI) * | ||
| recAF | CTGGTAAAACAACAGTGGCTTT | 167 bp | RT-PCR and RT-qPCR for recA house-keeping gene [38] |
| recAR | AGCTTGTTCTCCTGTATCTGGT | ||
| brnQ1qF | GCAGTTTCTAAGGCTGGATCT | 122 bp | brnQ1 RT-qPCR |
| brnQ1qR | GCAGTCCTTGGCACTACTAAT | ||
| brnQ2qF | CAATAGGACCTGGCTTAGGAATAC | 144 bp | brnQ2 RT-qPCR |
| brnQ2qR | GCCAATATGCAACTGCGAAA | ||
| brnQ3qF | GCAATCGGAGGACTAGCAATAA | 134 bp | brnQ3 RT-qPCR |
| brnQ3qR | GCACCTGCATGTCCTAGAATAC |
* Lower letters represent enzyme digestion site.
Table 2.
C. perfringens strains used in this study.
Table 2.
C. perfringens strains used in this study.
| Isolate | Description | Origin |
|---|---|---|
| ATCC3624 | Wild type | Purchased from ATCC |
| brnQ1KO | brnQ1 gene single null mutant strain | This study |
| brnQ1c | brnQ1 single null mutant strain complementing the brnQ1 gene | This study |
| brnQ2KO | brnQ2 gene single null mutant strain | This study |
| brnQ2c | brnQ2 single null mutant strain complementing the brnQ2 gene | This study |
| brnQ3KO | brnQ3 gene single null mutant strain | This study |
| brnQ3c | brnQ3 single null mutant strain complementing the brnQ3 gene | This study |
| brnQ2/Q3DKO | brnQ2 and brnQ3 genes double null mutant strain | This study |
| brnQ1/Q3DKO | brnQ1 and brnQ3 genes double null mutant strain | This study |
| brnQ1/Q2DKO | brnQ1 and brnQ2 genes double null mutant strain | This study |
| brnQ2/Q3DKO(brnQ2c) | brnQ2 and brnQ3 genes double null mutant strain complemented with the brnQ2 gene | This study |
| brnQ1/Q2DKO(brnQ2c) | brnQ1 and brnQ2 genes double null mutant strain complemented with the brnQ2 gene | This study |
| brnQ1/Q3DKO(brnQ1c) | brnQ1 and brnQ2 genes double null mutant strain complemented with the brnQ1 gene | This study |
| brnQ1/Q3DKO(brnQ3c) | brnQ1 and brnQ2 genes double null mutant strain complemented with the brnQ3 gene | This study |
| TKO | brnQ1, brnQ2, and brnQ3 genes triple null mutant strain | This study |
The primer sequences used for this purpose are listed in Table 1. All RT-PCR and RT-qRCR primers used for assessing the expression of the brnQ1, brnQ2, and brnQ3 genes are also listed in Table 1. In this study, the recA gene served as a control housekeeping gene for RT-PCR or RT-qPCR experiments [38]. Primers were designed using the software, Vector NTI (version 11.0, 2008), and synthesized using Integrated DNA Technologies (IDT) (Coralville, IO, USA).
4.3. C. perfringens DNA Isolation and PCR and Southern Blot Analyses
According to the manufacturer’s instructions, DNA was isolated using the MasterPure Gram-Positive DNA purification kit (Epicenter). Pelleted cells from an aliquot of 3.0 mL of an overnight TGY culture were used to prepare the DNA, and the extracted DNA was then dissolved in ddH2O. The annealing temperature for all PCR reactions was 55 °C, with an extension time of 1 min per kb, for a total of 35 cycles. The extension temperature was 72 °C for the DreamTaq Green PCR Master Mix (2X) (Fisher Scientific) and 65 °C for the LongAmp® Taq 2X Mix (New England Biolabs).
For Southern blot analyses, a 4 µg aliquot of each DNA was first digested overnight with PstI or BsrGI at 37 °C (New England Biolabs). Each digested DNA was electrophoresed on a 1% agarose gel before being transferred to a positively charged nylon membrane (Roche, Basel, Switzerland). Those blots were then hybridized with an intron-specific probe that had been prepared with the PCR DIG Probe Synthesis Kit (Roche). All protocols were conducted according to the manufacturer’s instructions.
4.4. C. perfringens RNA Isolation and RT-PCR and RT-qPCR Analyses
To obtain RNA from wild-type ATCC3624, bacterial pellets were collected from TY broth cultures grown for 2, 3, 5, 7, and 9 h at 37 °C. A 1 mL aliquot of each culture was removed for optical density measurement at 600 nm (OD600) using a Bio-Rad Smart Spectrophotometer. Equivalent OD600 values were adjusted to 0.25 for each culture, and those cultures were then pelleted to prepare the RNA. For the RNA preparation of the brnQ null mutants and complementing strains, the pellets from two-hour TY cultures were used.
As previously described [35], RNA was extracted using the saturated phenol (Fisher Scientific) method and purified using TRIzol and chloroform (Life technologies [Carlsbad, CA, USA] and Sigma). The purified RNA was then quantified by measuring the absorbance at 260 nm with a Bio-Rad Smart Spectrophotometer. Before being used in RT-PCR or RT-qRCR experiments, an aliquot (50 ng) of every isolated RNA was subjected to PCR (no RT) for recA to confirm the purity of the RNA samples.
To perform RT-PCR or RT-qPCR, an aliquot (100 ng) of purified RNA was used for first-strand cDNA synthesis with the Thermo Scientific Maxima First Strand cDNA synthesis kit. Reaction mixtures were incubated in a thermal cycler for 10 min at 25 °C, 30 min at 50 °C, and 5 min at 85 °C to allow for cDNA synthesis. For both RT-PCR and RT-qRCR, recA was amplified from samples and utilized as a loading control. RT-PCR used 10–25 ng of cDNA, while RT-qPCR used 5 ng of cDNA, and it was performed as previously described [6]. The Image J software was used to compare the RT-PCR band intensity.
4.5. Measurement of the Growth and Survival of ATCC3624, Its BrnQ Null Mutants, and Complementing Strains in a TY Medium
For the analysis of C. perfringens growth and long-term viability (survival) in TY, 0.2 mL aliquots from overnight FTG cultures of the wild type, null mutants, or complementing strains were inoculated into 10 mL of TY medium. After overnight culture, a 0.2 mL aliquot from each TY cultures was transferred again to 10 mL of TY medium for another overnight culture. The cultures were incubated at 37 °C; a 1 mL aliquot of the culture was then removed to measure OD600 at 0, 2, 3, 5, 7, 9, and 24 h culture times. In addition, to enumerate the survival of the viable vegetative cells of wild-type ATCC3624 and derivative strains, an aliquot of the 24 h TY culture of each sample was serially diluted in sterile PBS (phosphate-buffered saline) and plated onto BHI agar plates. After overnight anaerobic incubation at 37 °C, the colonies on each BHI plate were counted.
4.6. Western Blot Analyses of PLC and PFO Production
The TY cultures of the wild-type, null mutant, or complementing strains were adjusted to an equal OD600 of ~0.1. A 40 to 50 µL aliquot of supernatants from those cultures was then used for PLC and PFO Western blot analyses, performed as previously described [6]. Image J software was used to compare the Western blot band intensity.
Supplementary Materials
The following supporting information can be downloaded at https://www.mdpi.com/article/10.3390/toxins17040187/s1, Figure S1: Predicted BrnQ1, BrnQ2, and BrnQ3 protein transmembrane domains; Figure S2: Diagram illustrating preparation of brnQ null mutants from ATCC3624; Figure S3: PCR and an intron-specific Southern blot verification of each ATCC3624 brnQ single null mutant and complementing strain; Figure S4: Characterization of brnQ1, brnQ2 and brnQ3 expression by RT-PCR for ATCC3624, its brnQ single null mutants and complementing strains when cultured in TY medium: Figure S5: Comparison of Western blot intensities as determined by Image J; Figure S6: Verification of ATCC3624 double brnQ null mutants by PCR, an intron-specific Southern blot, and RT-PCR analysis; Figure S7: Comparison of Western blot intensities as determined by Image J for wild type (WT) and double null mutant strains; Figure S8: Characterization of complementing strains of brnQ double null mutants cultured in TY medium; Figure S9: Confirmation of an ATCC3624 brnQ triple null mutant by PCR, an intron-specific Southern blot, and RT-PCR analysis; Figure S10: Comparison of Western blot intensities as determined by Image J for wild type (WT) and triple null mutant strain (TKO).
Author Contributions
Conceptualization, J.L. and B.A.M.; Methodology, J.L., I.M.G. and I.Z.; Investigation, J.L.; Writing—original draft, J.L., I.M.G. and B.A.M.; Writing—review and editing, J.L., I.M.G., I.Z. and B.A.M.; Project administration, B.A.M. All authors have read and agreed to the published version of the manuscript.
Funding
This work was generously supported by grant R21AI178207-02 from the National Institute of Allergy and Infectious Disease. The content is solely the responsibility of the authors and does not necessarily represent the official views of the National Institutes of Health.
Institutional Review Board Statement
Not applicable.
Informed Consent Statement
Not applicable.
Data Availability Statement
The authors confirm that the data supporting the findings of this study are available within the article.
Statistical Analyses
All results were compared pairwise against wild-type results using Student’s t-test via Excel. Differences were considered significant when the p value was less than 0.05.
Conflicts of Interest
The authors declare no conflicts of interest.
References
- Mehdizadeh Gohari, I.; Navarro, M.A.; Li, J.; Shrestha, A.; Uzal, F.; McClane, B.A. Pathogenicity and virulence of Clostridium perfringens. Virulence 2021, 12, 723–753. [Google Scholar] [CrossRef] [PubMed]
- Grenda, T.; Jarosz, A.; Sapala, M.; Grenda, A.; Patyra, E.; Kwiatek, K. Clostridium perfringens-Opportunistic foodborne pathogen, its diversity and epidemiological significance. Pathogens 2023, 12, 768. [Google Scholar] [CrossRef]
- Navarro, M.A.; McClane, B.A.; Uzal, F.A. Mechanisms of action and cell death associated with Clostridium perfringens toxins. Toxins 2018, 10, 212. [Google Scholar] [CrossRef] [PubMed]
- Camargo, A.; Ramirez, J.D.; Kiu, R.; Hall, L.J.; Munoz, M. Unveiling the pathogenic mechanisms of Clostridium perfringens toxins and virulence factors. Emerg. Microbes Infect. 2024, 13, 2341968. [Google Scholar] [CrossRef] [PubMed]
- Rood, J.I.; Adams, V.; Lacey, J.; Lyras, D.; McClane, B.A.; Melville, S.B.; Moore, R.J.; Popoff, M.R.; Sarker, M.R.; Songer, J.G.; et al. Expansion of the Clostridium perfringens toxin-based typing scheme. Anaerobe 2018, 53, 5–10. [Google Scholar] [CrossRef]
- Li, J.; Sayeed, S.; McClane, B.A. The presence of differentiated C2C12 muscle cells enhances toxin production and growth by Clostridium perfringens type A strain ATCC3624. Virulence 2024, 15, 2388219. [Google Scholar] [CrossRef]
- Xu, C.; She, Y.; Fu, F.; Xu, C.; Peng, K. Review of advances in molecular structure and biological function of alpha toxin of Clostridium perfringens. Can. J. Vet. Res. 2024, 88, 138–144. [Google Scholar]
- Verherstraeten, S.; Goossens, E.; Valgaeren, B.; Pardon, B.; Timbermont, L.; Haesebrouck, F.; Ducatelle, R.; Deprez, P.; Wade, K.R.; Tweten, R.; et al. Perfringolysin O: The underrated Clostridium perfringens toxin? Toxins 2015, 7, 1702–1721. [Google Scholar] [CrossRef]
- Rood, J.I. Clostridium perfringens and histotoxic disease. In The Prokaryotes, 3rd ed.; Dworkin, M., Falkow, S., Rosenburg, E., Schleifer, H., Stackebrandt, E., Eds.; Springer Press: New York, NY, USA, 2006; pp. 753–770. [Google Scholar]
- Stevens, D.L.; Tweten, R.K.; Awad, M.M.; Rood, J.I.; Bryant, A.E. Clostridial gas gangrene: Evidence that alpha and theta toxins differentially modulate the immune response and induce acute tissue necrosis. J. Infect. Dis. 1997, 176, 189–195. [Google Scholar] [CrossRef]
- Bryant, A.E.; Stevens, D.L. Clostridial myonecrosis: New insights in pathogenesis and management. Curr. Infect. Dis. Rep. 2010, 12, 383–391. [Google Scholar] [CrossRef]
- Stevens, D.L.; Rood, J.I. Histotoxic Clostridia. In Gram-Positive Pathogens; Fischetti, V.A., Novick, R.P., Ferretti, J.J., Portnoy, D.A., Rood, J.I., Eds.; ASM Press: Washington, DC, USA, 2000; pp. 563–572. [Google Scholar]
- Awad, M.M.; Ellemor, D.M.; Boyd, R.L.; Emmins, J.J.; Rood, J.I. Synergistic effects of alpha-toxin and perfringolysin O in Clostridium perfringens-mediated gas gangrene. Infect. Immun. 2001, 69, 7904–7910. [Google Scholar] [CrossRef] [PubMed]
- Kaiser, J.C.; Omer, S.; Sheldon, J.R.; Welch, I.; Heinrichs, D.E. Role of BrnQ1 and BrnQ2 in branched-chain amino acid transport and virulence in Staphylococcus aureus. Infect. Immun. 2015, 83, 1019–1029. [Google Scholar] [CrossRef] [PubMed]
- Shimizu, T.; Ohtani, K.; Hirakawa, H.; Ohshima, K.; Yamashita, A.; Shiba, T.; Ogasawara, N.; Hattori, M.; Kuhara, S.; Hayashi, H. Complete genome sequence of Clostridium perfringens, an anaerobic flesh-eater. Proc. Natl. Acad. Sci. USA 2002, 99, 996–1001. [Google Scholar] [CrossRef] [PubMed]
- Fuchs, A.R.; Bonde, G.J. The nutritional requirements of Clostridium perfringens. J. Gen. Microbiol. 1957, 16, 317–329. [Google Scholar] [CrossRef]
- Goldner, S.B.; Solberg, M.; Post, L.S. Development of a minimal medium for Clostridium perfringens by using an anaerobic chemostat. Appl. Environ. Microbiol. 1985, 50, 202–206. [Google Scholar] [CrossRef]
- Myers, G.S.; Rasko, D.A.; Cheung, J.K.; Ravel, J.; Seshadri, R.; DeBoy, R.T.; Ren, Q.; Varga, J.; Awad, M.M.; Brinkac, L.M.; et al. Skewed genomic variability in strains of the toxigenic bacterial pathogen, Clostridium perfringens. Genome Res. 2006, 16, 1031–1040. [Google Scholar] [CrossRef]
- Belitsky, B.R. Role of branched-chain amino acid transport in Bacillus subtilis CodY activity. J. Bacteriol. 2015, 197, 1330–1338. [Google Scholar] [CrossRef]
- Stucky, K.; Hagting, A.; Klein, J.R.; Matern, H.; Henrich, B.; Konings, W.N.; Plapp, R. Cloning and characterization of brnQ, a gene encoding a low-affinity, branched-chain amino acid carrier in Lactobacillus delbruckii subsp. lactis DSM7290. Mol. Gen. Genet. 1995, 249, 682–690. [Google Scholar] [CrossRef]
- Tauch, A.; Hermann, T.; Burkovski, A.; Kramer, R.; Puhler, A.; Kalinowski, J. Isoleucine uptake in Corynebacterium glutamicum ATCC 13032 is directed by the brnQ gene product. Arch. Microbiol. 1998, 169, 303–312. [Google Scholar] [CrossRef]
- Kaiser, J.C.; Sen, S.; Sinha, A.; Wilkinson, B.J.; Heinrichs, D.E. The role of two branched-chain amino acid transporters in Staphylococcus aureus growth, membrane fatty acid composition and virulence. Mol. Microbiol. 2016, 102, 850–864. [Google Scholar] [CrossRef]
- Kaiser, J.C.; Heinrichs, D.E. Branching out: Alterations in bacterial physiology and virulence due to branched-chain amino acid deprivation. mBio 2018, 9, e01188-18. [Google Scholar] [CrossRef] [PubMed]
- Dutta, S.; Corsi, I.D.; Bier, N.; Koehler, T.M. BrnQ-Type branched-chain amino acid transporters influence Bacillus anthracis growth and virulence. mBio 2022, 13, e0364021. [Google Scholar] [CrossRef]
- Chen, Y.; McClane, B.A.; Fisher, D.J.; Rood, J.I.; Gupta, P. Construction of an alpha toxin gene knockout mutant of Clostridium perfringens type A by use of a mobile group II intron. Appl. Environ. Microbiol. 2005, 71, 7542–7547. [Google Scholar] [CrossRef] [PubMed]
- Bannam, T.L.; Rood, J.I. Clostridium perfringens-Escherichia coli shuttle vectors that carry single antibiotic resistance determinants. Plasmid 1993, 29, 233–235. [Google Scholar] [CrossRef] [PubMed]
- Haslam, S.C.; Ketley, J.M.; Mitchell, T.J.; Stephen, J.; Burdon, D.W.; Candy, D.C. Growth of Clostridium difficile and production of toxins A and B in complex and defined media. J. Med. Microbiol. 1986, 21, 293–297. [Google Scholar] [CrossRef]
- Whitmer, M.E.; Johnson, E.A. Development of improved defined media for Clostridium botulinum serotypes A, B, and E. Appl. Environ. Microbiol. 1988, 54, 753–759. [Google Scholar] [CrossRef]
- Karasawa, T.; Ikoma, S.; Yamakawa, K.; Nakamura, S. A defined growth medium for Clostridium difficile. Microbiology 1995, 141 Pt 2, 371–375. [Google Scholar] [CrossRef]
- Basavanna, S.; Khandavilli, S.; Yuste, J.; Cohen, J.M.; Hosie, A.H.; Webb, A.J.; Thomas, G.H.; Brown, J.S. Screening of Streptococcus pneumoniae ABC transporter mutants demonstrates that LivJHMGF, a branched-chain amino acid ABC transporter, is necessary for disease pathogenesis. Infect. Immun. 2009, 77, 3412–3423. [Google Scholar] [CrossRef]
- Ohtani, K.; Yuan, Y.; Hassan, S.; Wang, R.; Wang, Y.; Shimizu, T. Virulence gene regulation by the agr system in Clostridium perfringens. J. Bacteriol. 2009, 191, 3919–3927. [Google Scholar] [CrossRef]
- Okumura, K.; Ohtani, K.; Hayashi, H.; Shimizu, T. Characterization of genes regulated directly by the VirR/VirS system in Clostridium perfringens. J. Bacteriol. 2008, 190, 7719–7727. [Google Scholar] [CrossRef]
- Ohtani, K.; Shimizu, T. Regulation of toxin production in Clostridium perfringens. Toxins 2016, 8, 207. [Google Scholar] [CrossRef] [PubMed]
- Bouillaut, L.; Dubois, T.; Sonenshein, A.L.; Dupuy, B. Integration of metabolism and virulence in Clostridium difficile. Res. Microbiol. 2015, 166, 375–383. [Google Scholar] [CrossRef] [PubMed]
- Li, J.; Ma, M.; Sarker, M.R.; McClane, B.A. CodY is a global regulator of virulence-associated properties for Clostridium perfringens type D strain CN3718. mBio 2013, 4, e00770-13. [Google Scholar] [CrossRef]
- Buboltz, J.B.; Murphy-Lavoie, H.M. Gas Gangrene. In StatPearls; StatPearls Publishing: Treasure Island, FL, USA, 2025. [Google Scholar] [PubMed]
- Mosley, J.D.; Shi, M.; Agamasu, D.; Vaitinadin, N.S.; Murthy, V.L.; Shah, R.V.; Bagheri, M.; Ferguson, J.F. Branched-chain amino acids and type 2 diabetes: A bidirectional Mendelian randomization analysis. Obesity 2024, 32, 423–435. [Google Scholar] [CrossRef]
- Williams, M.L.; Ghanem, M. Evaluation of candidate reference genes stability for gene expression analysis by reverse transcription qPCR in Clostridium perfringens. Sci. Rep. 2022, 12, 19434. [Google Scholar] [CrossRef]


Disclaimer/Publisher’s Note: The statements, opinions and data contained in all publications are solely those of the individual author(s) and contributor(s) and not of MDPI and/or the editor(s). MDPI and/or the editor(s) disclaim responsibility for any injury to people or property resulting from any ideas, methods, instructions or products referred to in the content. |
© 2025 by the authors. Licensee MDPI, Basel, Switzerland. This article is an open access article distributed under the terms and conditions of the Creative Commons Attribution (CC BY) license (https://creativecommons.org/licenses/by/4.0/).