Abstract
Breast milk is the ideal source of nutrition for infant growth and development. However, when nursing mothers consume aflatoxin B1 (AFB1)-contaminated food, the hydroxylated form aflatoxin M1 (AFM1) is transferred to breast milk and urine. AFB1 and its metabolite AFM1 are potent carcinogens and can pose significant risks to food safety and public health worldwide. This study determined the prevalence of AFM1 in the breast milk and urine of nursing mothers in Bangladesh and estimated infant exposure to this toxin. Breast milk and urine samples (72 each), collected from nursing mothers in three different regions of the country, were analyzed for AFM1 occurrence via a sensitive enzyme-linked immunosorbent assay (ELISA). AFM1 was present in 88.9% of urine samples, with a mean concentration of 109.9 ± 52.8 pg/mL, ranging from 40.0 to 223.8 pg/mL. AFM1 was also detected in 50% of the breast milk samples, with a mean concentration of 4.6 ± 0.7 pg/mL, ranging from 4.0 to 6.1 pg/mL. A strong correlation (r = 0.72) was observed between milk and urinary AFM1 levels, indicating these as suitable biomarkers of AFB1 exposure. Yet, no significant correlations were identified between AFM1 levels in either milk or urine and the food items typically consumed by nursing mothers. The average estimated daily intake (EDI) for AFM1 with breast milk was 0.59 ng/kg bw/day, with no significant difference between infants (0.57 ng/kg bw/day) and toddlers (0.65 ng/kg bw/day). A comparison of computed EDI ranges for AFM1 with a proposed tolerable daily intake value resulted in Hazard Indices below 1 for all exposure scenarios. This indicates that the AFM1 concentrations in breast milk from three regions of Bangladesh raise no concern. Also, the measured levels were far lower than the maximal levels set in the EU regulations for AFM1 in dairy milk and infant formula (50 ng/kg and 25 ng/kg, respectively).
Key Contribution:
The presence of AFM1 in a mother’s milk and urine indicates her dietary exposure to AFB1. The concentrations of AFM1 found in milk were relatively low; meaning that the intake levels of AFM1 for breastfed infants do not raise concern.
1. Introduction
Breast milk is the ideal source of nutrition for newborns and infants due to its unique composition, which encompasses essential nutrients, bioactive factors, and immune-enhancing components [1,2]. The World Health Organization recommends exclusive breastfeeding for the first six months of life, with a continued focus on breastfeeding until the child is two years old or even longer [3]. This underscores the vital role of breastfeeding in fostering optimal health and development during early childhood. However, mycotoxins such as aflatoxins can transfer to breast milk when nursing mothers ingest these toxins, thereby potentially exposing their infants [4,5].
Aflatoxins, a group of fungal toxins produced mainly by Aspergillus flavus and Aspergillus parasiticus, are important contaminants in feed and food [6,7]. They pose a significant public health risk due to severe toxic effects on animals and humans, best documented for the most potent mycotoxin aflatoxin B1 (AFB1) [8,9,10]. All aflatoxins are classified as human carcinogens based on sufficient evidence from both experimental studies and epidemiological data on liver cancer, applying biomarkers [11,12].
AFB1 metabolism primarily occurs in the liver and involves the action of phase I and phase II enzymes that convert AFB1 into several metabolites [13,14]. One key process is the bioactivation of AFB1 via cytochrome P450 enzymes to the DNA-reactive intermediate AB1-8,9-epoxide, which is detoxified via conjugation with glutathione. Additionally, AFB1 is hydroxylated to aflatoxin M1 (AFM1), a carcinogenic and hepatotoxic metabolite that can undergo bioactivation to a mutagenic epoxide. AFB1 is also converted to aflatoxin Q1 and other less toxic metabolites [14].
In humans, the ingestion of AFB1 will result in the excretion of AFM1 in breast milk and urine [15]. Mycotoxin exposure occurs mainly through the consumption of maize and its derivatives, nuts, dairy products, sunflower oil, bread, and whole grain cereals [8,16]. In children from low- and middle-income countries, aflatoxin exposure has been associated with growth retardation and weakened immune function [17,18]. Children are more susceptible to aflatoxins than adults because of their smaller body weight, decreased ability to detoxify these toxins, and reliance on cereal-based post-weaning foods [19,20].
To protect consumers, many countries have established regulatory standards for aflatoxins in food and feed [7]. Bangladesh also introduced regulations on aflatoxin contamination for specific food items, including groundnuts, almonds, Brazil nuts, hazelnuts, pistachios, and for AFM1 in dairy milk [21]. Yet, data on AFB1 and its metabolite AFM1 in food commodities in Bangladesh is scarce due to the absence of regular surveillance for these contaminants [9,22]. In such a situation, the analysis of biological samples (blood, breast milk, and urine) offers valuable insights into human mycotoxin exposure [18]. AFM1 is excreted in both urine and human milk, and is thus a valuable biomeasure of AFB1 exposure from food [23,24]. Our previous biomonitoring studies analyzed AFM1 in urine samples collected in several districts of Bangladesh from adults and young children [25,26,27]. The data revealed some regional and seasonal fluctuation in AFM1 levels, indicative of widespread yet variable dietary mycotoxin exposure in the population. A first study on AFM1 presence in human milk samples in the Sylhet region of Bangladesh then served to estimate the exposure of nursed infants [28]. The present study analyzed AFM1 occurrence in both urine and milk samples collected from mothers in three different regions of Bangladesh with the aim of further assessing maternal and infant exposure. Although AFB1 is more potent than its metabolite AFM1, they have similar toxic properties regarding carcinogenic and hepatotoxic effects and bioactivation to mutagenic epoxides [8,15].
2. Results
2.1. Characteristics of the Study Participants
The participants’ characteristics are summarized in Table 1. The average age of the participants was 25.4 ± 5.4 years, with a BMI of 21.9 ± 4.2 kg/m2. A small percentage of nursing mothers completed secondary (5.4%) and graduate-level education (9.5%); most had only completed elementary (39.2%) or secondary (40.5%) education. In terms of socioeconomic status, most participants belonged to a low (47.2%)- or medium (43.1%)-socioeconomic groups. Notably, the majority of the mothers exhibited limited knowledge of diet and nutrition. The infants’ and toddlers’ ages ranged from 15 days to 12 months and from 13 to 30 months, respectively. The average body weight was 6.6 ± 1.8 kg for infants and 9.3 ± 1.9 kg for toddlers. The average urinary creatinine concentration among the participants was 0.76 ± 0.54 mg/mL.

Table 1.
Characteristics of the nursing mothers and their children.
2.2. AFM1 in Milk and Urine Samples
The levels, detection frequency, and distribution of AFM1 determined in milk and urine samples are detailed in Table 2 and Figure 1. AFM1 was found in breast milk at an average concentration of 4.6 ± 0.7 pg/mL, with a range from 4 to 6.1 pg/mL. In urine samples, AFM1 was present at a mean concentration of 109.9 ± 52.8 ng/L, with a range from 40 to 223.8 pg/mL. The creatinine-adjusted mean AFM1 concentration in the urine of all mothers was 235.4 ± 260.7 pg/mg creatinine. There was no statistical significance in the average AFM1 levels for either milk or urine samples taken from the three regions. The co-occurrence of AFM1 in both milk and urine samples was 47.2%. There was a strong and significant correlation (r = 0.719, p = 0.001) between the AFM1 concentration in milk and in urine, as shown in Figure 1. This supports the view that biomarker measurements in both matrices reflect maternal dietary exposure to AFB1 well.
Table 2.
Levels of AFM1 in milk and urine samples of nursing mothers.
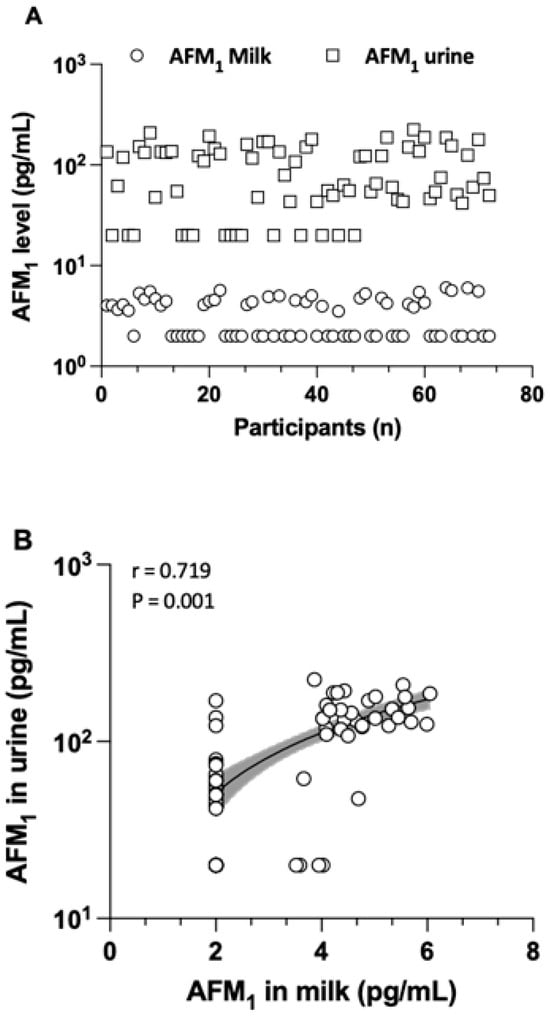
Figure 1.
The distribution of AFM1 in both milk and urine samples (A) and the correlation between their levels in urine and milk (B), depicted with a logarithmic scale on the Y-axis. Samples with AFM1 levels below the MDL were considered as half of the MDL for the analysis of distribution and correlation. Only the samples that tested positive (≥MDL) were included to assess the co-occurrence of AFM1 in both milk and urine samples.
2.3. Estimation of AFM1 Intake with Breast Milk and Risk Assessment Approach
The average estimated daily intake (EDI) for AFM1 was 0.59 ± 0.25 ng/kg bw/day, with a range from 0.30 to 1.12 ng/kg bw/day. Infants had an EDI of 0.57 ± 0.25 ng/kg bw/day (range: 0.30–1.04 ng/kg bw/day), while toddlers had a higher EDI of 0.65 ± 0.26 ng/kg bw/day (range: 0.37–1.12 ng/kg bw/day) (Table 3). Among infants, those aged 1–2 months had a slightly higher mean AFM1 intake of 0.61 ± 0.25 ng/kg bw/day compared to other infant age groups, but still lower than the intake for toddlers (0.65 ± 0.26 ng/kg bw/day). Nevertheless, the differences in the EDI were not statistically significant. It is worth noting that an EDI for toddlers may not be a reliable estimate since children >13 months typically consume breast milk only occasionally, primarily relying on post-weaning foods that could have higher levels of contaminants than human milk.
Table 3.
Estimated daily intake (EDI) of AFM1 (ng/kg bw/day) for infants and toddlers.
To assess the EDI values for AFM1 in nursed children in terms of risk, one can compare them with the TDI value of 2 ng/kg bw/day proposed by Kuiper-Goodman (1994) [29], an approach also applied previously (see Section 5 on AFM1 exposure and risk assessment approach for more details). Table 3 lists the outcomes for all infant age groups and toddlers and for several exposure scenarios: the calculated mean Hazard Index (HI) for AFM1 was 0.27 (with a median of 0.19 and a maximum of 0.52) in infants and 0.32 (with a median of 0.37 and a maximum of 0.56) in toddlers. The 95% confidence intervals for the lower and upper bounds were 0.25 and 0.32, respectively, in infants, and 0.26 and 0.39, respectively, in the toddler group. Overall, the outcomes—with all HI values < 1—do not raise a concern. Further aspects related to potential risks of AFM1 exposure in infants through breast milk are considered in the Section 3.
2.4. Correlation Between AFM1 Biomarker Levels and Food Consumption
A potential correlation between the dietary habits of mothers and their AFM1 levels in milk and urine samples was examined. We applied Spearman’s correlation analysis and focused on key food items, such as rice, wheat/maize, milk and dairy products, and groundnuts (see Table 4). Significant correlations were not detected between AFM1 concentrations in breast milk samples and the consumption frequency of rice (p = 0.192), wheat/maize (p = 0.449), milk and dairy products (p = 0.516), or groundnuts (p = 0.724). Likewise, no noteworthy correlation was found between urinary AFM1 levels and the intake of any of the aforementioned food items.
Table 4.
Correlation between AFM1 levels and typical food consumption.
3. Discussion
This biomonitoring study provides new insights on the aflatoxin exposure of nursing women in Bangladesh, their breastfed infants, and the potential risks associated with AFM1 in human milk. Analysis of urine from our cohort found AFM1 in 89% of the samples at a mean concentration of 110 ± 53 pg/mL (range 40–224 pg/mL, Table 2), related to dietary AFB1 exposure in mothers from three different districts in Bangladesh. The new urinary AFM1 biomarker data resemble the findings of a recent study on workers of grain mills and persons with no occupational contact with crops: in both groups, AFM1 was found in most of their urine (96.1% and 92%), at similar mean concentrations (106.5 ± 35.0 pg/mL 123.3 ± 52.4 pg/mL) and ranges [30]. An early study on rural and urban residents of the Rajshahi district of Bangladesh detected AFM1 in 46% of urine samples at 80 ± 60 pg/mL in a range from 31 to 348 pg/mL [25]. Two additional studies reported similar or lower levels of AFM1 in the urine of adults, pregnant women, and children [26,27]. Overall, these data suggest widespread exposure to dietary AFB1, along with some regional differences in the frequency of detection and levels of the AFM1 biomarker. These variations may be related to differences in dietary practices and/or the mycotoxin contamination of foods consumed by the Bangladeshi population.
Along with the presence of biomarkers in the urine of nursing women, AFM1 was also detected in 50% of human milk samples at 4.6 ± 0.7 pg/mL (range from 4 to 6.05 pg/mL), i.e., at concentrations clearly lower than those measured in urine. This finding is in line with early studies reporting that a higher fraction of ingested AFB1 (1 to 3%) occurs as AFM1 in urine [23] than that (0.1 to 0.43%) transferred to breast milk [24]. In the present study, a strong correlation (r = 0.72) was observed between milk and urinary AFM1 levels (Figure 1), suggesting its analysis in both matrices as a useful biomarker of exposure.
The level and detection frequency of AFM1 in the present study closely resemble those in our previous analysis, which detected AFM1 in 51.6% of 62 breast milk samples, with a range from 4 to 6.66 pg/mL and a mean level of 4.42 ± 0.56 pg/mL [28]. Our data on AFM1 in human breast milk in Bangladesh can be compared to findings from other countries: for instance, mean concentrations of 17 pg/mL in Mexico [31], 74.4 pg/mL in Egypt [32], and 401 pg/mL in Sudan [33]. These levels are far higher than those found in breast milk from our Sylhet cohort of nursing women. AFM1 prevalence and levels in breast milk can vary considerably between countries, regions, and seasons [15,28]. This has been related to the AFB1 contamination of local foods and to maternal dietary habits.
In our cohort, we looked for a correlation between the AFM1 biomarker level and the frequency of consuming staple food such as rice, wheat/maize, and other items (groundnuts and milk and dairy products). The analysis (Table 4) did not reveal any significant correlations with the consumed food items, which may be attributed to rather low AFM1 concentrations detected in Bangladeshi mothers. In similar studies involving cohorts of women with higher AFM1 levels in breast milk, stronger correlations with their consumption of specific food groups, such as egg, cola drink, sunflower oil, bread, bakery products, and cured pork meat, have been observed [34,35].
Data on the presence of aflatoxins and other mycotoxins in food commodities in Bangladesh is limited [26,36]. One study on AFB1 analysis in rice, lentils, wheat flour, dates, betelnut, red chili powder, ginger, and groundnuts reported that five out of the eight commodities surpassed EU regulatory limits, with the highest concentrations detected in dates and groundnuts [37]. Another study analyzed total aflatoxins (AFB1, AFB2, AFG1, and AFG2) in cereal crops collected in six districts over one year. It found that maize had the highest levels of aflatoxins, while rice and wheat showed lower contamination, with all having considerable seasonal variability [38]. Two more recent studies have measured AFM1 contamination in raw and processed dairy milk. Tarannum et al. [39] analyzed samples collected in the Dhaka district and reported higher mean concentrations of AFM1 in raw milk (699 ng/L) than in processed milk (pasteurized and UHT milk with 100 and 36 ng/L, respectively). About 75% of all positive samples were above the EU regulatory limit for AFM1. Also, Sumon et al. [40] found that 78.6% of all milk samples contained AFM1, ranging from 5.0 to 198.7 ng/L. About one-third of raw, pasteurized, and UHT milk samples exceeded the EU limit of 50 ng/L for AFM1. Notably, the levels of AFM1 in dairy milk were considerably higher than those found in human breast milk, indicating that dairy milk is less safe for infants than their mother’s milk.
Regarding the exposure of infants in Bangladesh, AFM1 concentrations detected in breast milk were used to determine the EDI values for infants across different age categories. The AFM1 intake ranged between 0.3 and 1.04 ng/kg bw/day, with a mean of 0.57 ng/kg bw/day for all infants, values slightly lower than those for toddlers (Table 3). To assess risks related to AFM1 exposure, we chose an approach used before by others comparing the EDI values to a TDI value of 2 ng/kg bw/day (see Section 5). The EDI scenarios (95th CI for means) for infants or toddlers did not exceed this TDI value, and expressed as the HI, all ratios were below 1 (Table 3). This assessment indicates that the low AFM1 exposure in breastfed infants does not raise concern. Furthermore, AFM1 levels in breast milk samples from Bangladesh in this study and our previous one [28] are lower than the strict limit of 25 ng/kg established for AFM1 in infant formula [41].
Higher EDI values for AFM1 in breastfed infants have been reported in some countries. However, switching to infant formula is not a feasible alternative in developing countries with financial constraints [42]. Given its well-known benefits, breastfeeding should be promoted rather than discouraged, and measures should be implemented to enhance food safety and minimize human exposure to mycotoxins.
Our study has several limitations. Firstly, while it includes three different regions of Bangladesh, the participant count was fairly low, and our results may not reflect the scenario in Bangladesh completely. Secondly, we collected milk and urine samples just once, which fails to examine seasonal variations in AFM1 biomarker levels. Third, ELISA is a rapid and sensitive method, but focused on measuring AFM1 in breast milk and urine. Future studies that apply sensitive LC-MS/MS multi-biomarker methods for the analysis of milk and urine samples could enhance our understanding of the concurrent exposure to various mycotoxins of nursing mothers in Bangladesh and their infants.
4. Conclusions
In conclusion, AFM1 was detected in half of the milk samples (range 4.0 to 6.1 pg/mL) and nearly ninety percent of the urine samples (range 40.0 to 223.8 pg/mL) from nursing women in Bangladesh, indicative of their dietary exposure to AFB1. The AFM1 concentrations in human milk were found to be rather low and result in AFM1 intake values for breastfed infants that do not raise concern. However, this study is based on a limited number of participants and only one sampling period. Therefore, further research involving a larger cohort from different regions of the country, alongside the application of sensitive and targeted biomarker analysis methods, is recommended to gather more comprehensive insights into maternal exposure as well as infant exposure through breast milk in Bangladesh.
5. Materials and Methods
5.1. Study Participants and Areas
This cross-sectional study was carried out between March 2021 and November 2021, with all laboratory analysis conducted at the Department of Biochemistry and Molecular Biology at Shahjalal University of Science and Technology in Sylhet, Bangladesh. A total of 72 nursing mothers from three regions—Sylhet, Cumilla, and Mymensingh—took part in the study. Women who faced any acute or chronic illnesses during their pregnancy were not included. The study focused on healthy mothers and their breastfed offspring, which comprised 53 infants aged 12 months or younger and 19 toddlers aged 13 to 30 months. Mothers completed a brief questionnaire that gathered information on anthropometrics, socio-demographics, economic status, and general dietary habits. Written consent was obtained from participants prior to their inclusion in the study. The Internal Ethics Review Board at the Department of Biochemistry and Molecular Biology, School of Life Sciences, Shahjalal University of Science and Technology in Sylhet, Bangladesh approved the research (Reference number: 01/BMB/2020).
5.2. Food Consumption Information
The nursing mothers were asked to fill out a short food frequency questionnaire (FFQ) about their usual eating habits. This FFQ featured food items frequently consumed in Bangladesh, including rice, wheat, maize, groundnuts, and a variety of milk and dairy products. Among these items, rice was consumed regularly by most of the participants, with some reporting intake up to three times a day. The frequency of food consumption was assessed on a scale of 1 to 5 (see Table 4) and as described before [43].
5.3. Sample Collection and Preparation
Approximately 10–15 mL of both urine and breast milk samples was collected from every participant in sterile tubes. Although we supplied breast pumps for the mothers, the majority chose to express their milk manually. The urine samples collected were spot samples. These urine samples were then transported in an icebox and stored at −20 °C in the laboratory for AFM1 analysis. The urine’s creatinine content was quantified using a colorimetric method following the manufacturer’s guidelines (HUMAN Gesellschaft für Biochemica und Diagnostica mbH, Wiesbaden, Germany) and a semi-automatic biochemistry analyzer (Humalyzer 3000, Medicon Services, Tuttlingen, Germany). AFM1 concentrations in both breast milk and urine were assessed through a competitive enzyme-linked immunosorbent assay (ELISA) using a commercial kit from Helica Biosystems Inc. (Santa Ana, CA, USA; catalog no. 961AFLM01M-96 for milk and Cat. No. 991AFLM01U-96 for urine), following the manufacturer’s instructions and previously established methods [25,28]. In brief, the milk samples were refrigerated overnight to promote the coagulation of fat molecules. Subsequently, samples were centrifuged at 2500× g for 10 min at RT to enable the separation of the upper fatty layer and facilitate its removal via aspiration; the remaining lower layer of skimmed milk was utilized directly for the assay. Urine samples were centrifuged at 3030× g for 5 min, and the supernatant was then used for AFM1 determination according to the specified protocol.
5.4. Determination of AFM1 in Milk and Urine Samples
The concentration of AFM1 in milk samples was measured as described elsewhere [28]. Briefly, 200 μL of standard and test samples was added in duplicate to pre-coated plates. After 2 h of incubation at RT, the wells were emptied and washed three times with washing buffer. Then, 100 μL of conjugate was added and incubated for 15 min. Following another wash, 100 μL of enzyme substrate was added and incubated for another 15 min. Finally, 100 μL of stop solution was added, mixed gently, and absorbance at 450 nm was measured with an ELISA plate reader (Apollo 11 LB 913, Berthold, Germany) within 15 min.
As described before [25], the analysis of AFM1 in urine involves diluting AFM1 standards and urine samples with distilled water at ratios of 1:20 or 1:5. A volume of 100 μL from each sample is mixed with 200 μL of assay buffer and transferred to antibody-coated microtiter wells, where it is incubated at room temperature for 1 h. Following incubation, the plate is washed three times with the provided washing solution. Subsequently, 100 μL of AFM1 conjugate is added to each well and incubated for an additional 15 min. The plate is then washed again to eliminate any unbound conjugate. After washing, 100 μL of substrate reagent is added for the color reaction to develop for 15 min in the dark. Then, 100 μL of stop solution is added, and the absorbance is measured at 450 nm with a microplate reader (Apollo 11 LB 913, Berthold, Germany). The absorption intensity is inversely related to the AFM1 concentration in the samples. The AFM1 levels were determined using the standard curves for the AFM1 solutions of each plate.
All milk and urine samples were analyzed in duplicate, with the average values calculated. Recovery studies used spiking skimmed milk samples with AFM1 concentrations of 5 pg/mL and 10 pg/mL, while urine samples were spiked with AFM1 concentrations of 20 and 50 pg/mL. The repeatability showed acceptable precision, with relative standard deviations (RSDs) below 5% for milk and 6% for urine. Recovery rates were 97–102% for milk and 88–120% for urine. The method detection limit (MDL) was 4 pg/mL for milk and 40 pg/mL for urine.
5.5. AFM1 Exposure and Risk Assessment Approach
The daily intake estimate (EDI) of AFM1 for breastfeeding infants was determined using the following equation:
EDIAFM1 (ng/kg bw/day) = (VBM × CAFM1)/BW, where VBM represents the typical volume of milk an infant consumes daily (L), CAFM1 is the concentration of AFM1 (ng/L), and BW denotes the baby’s body weight (kg). For infants up to 2 months old, the average daily milk consumption is around 150 mL; for those aged 2 to 4 months and older, the average intake is estimated to be 185 mL per day, according to EFSA [44]. The body weights used were those of the individual infants. The risks associated with the ingestion of AFM1 through breast milk were evaluated by comparing the EDI results to a tolerable daily intake (TDI) of 2 ng/kg bw/day, a value proposed before [29] and applied in previous studies on AFM1 exposure from milk [29,45,46]. The hazard quotient (HI, or Hazard Index, which is also referred to as the %TDI) was computed using the following formula: HI = EDI/TDI.
5.6. Statistical Analysis
Statistical data analysis was conducted using IBM SPSS Statistics version 26.0. The results were expressed as percentages (%), means, medians, and percentiles. An independent-sample t-test was performed to compare the EDI of AFM1 between the groups of infants and toddlers. To determine the correlation between maternal milk AFM1 levels and urinary AFM1 levels, Spearman’s correlation coefficient test was applied (two-tailed). Spearman’s correlation coefficient test (two-tailed) was also used to analyze the relationships between AFM1 levels in breast milk and urine samples with the frequency of food consumption data. A p-value of less than 0.05 was deemed statistically significant.
Author Contributions
Conceptualization, N.A.; Data curation, H.R.T.; Formal analysis, H.R.T. and S.R.; Funding acquisition, K.A.F.; Investigation, K.A.F. and N.A.; Methodology, H.R.T., S.R., and K.A.F.; Supervision, N.A.; Validation, G.H.D.; Writing—original draft, G.H.D. and N.A.; Writing—review and editing, G.H.D. and N.A. All authors have read and agreed to the published version of the manuscript.
Funding
This study was not externally funded but supported by an internal grant provided by the SUST Research Center (LS/2021/1/05).
Institutional Review Board Statement
This study was approved by the Internal Ethics Review Board at the Department of Biochemistry and Molecular Biology, Shahjalal University of Science and Technology, Sylhet, Bangladesh (Reference number: 01/BMB/2020, approval date: 29 June 2020).
Informed Consent Statement
Written consent was obtained from all participants before they were included in the study.
Data Availability Statement
The original contributions presented in this study are included in the article. Further inquiries can be directed to the corresponding author.
Acknowledgments
The authors would like to express their gratitude towards all the nursing mothers for their active participation.
Conflicts of Interest
The authors declare no conflicts of interest.
References
- Ballard, O.; Morrow, A.L. Human Milk Composition: Nutrients and Bioactive Factors. Pediatr. Clin. N. Am. 2013, 60, 49–74. [Google Scholar] [CrossRef] [PubMed]
- Mosca, F.; Giannì, M.L. Human Milk: Composition and Health Benefits. Pediatr. Med. Chir. 2017, 39, 155. [Google Scholar] [CrossRef]
- WHO Word Health Organization. Continued Breastfeeding for Healthy Growth and Development of Children; WHO Word Health Organization: Geneva, Switzerland, 2017; Available online: https://Www.Who.Int/Tools/Elena/Commentary/Continued-Breastfeeding2017 (accessed on 10 May 2025).
- Cherkani-Hassani, A.; Mojemmi, B.; Mouane, N. Occurrence and Levels of Mycotoxins and Their Metabolites in Human Breast Milk Associated to Dietary Habits and Other Factors: A Systematic Literature Review, 1984–2015. Trends Food Sci. Technol. 2016, 50, 56–69. [Google Scholar] [CrossRef]
- Warth, B.; Braun, D.; Ezekiel, C.N.; Turner, P.C.; Degen, G.H.; Marko, D. Biomonitoring of Mycotoxins in Human Breast Milk: Current State and Future Perspectives. Chem. Res. Toxicol. 2016, 29, 1087–1097. [Google Scholar] [CrossRef] [PubMed]
- FAO/WHO Food and Agriculture Organization of the United Nations/World Health Organization. Aflatoxins. Safety Evaluation of Certain Contaminants in Food: Prepared by the 83rd Meeting of the Joint FAO/WHO Expert Committee on Food Additives (JECFA); WHO Additives Series; FAO/WHO Food and Agriculture Organization of the United Nations: Rome, Italy; World Health Organization: Geneva, Switzerland, 2018; No 74; pp. 2–280. [Google Scholar]
- Eskola, M.; Kos, G.; Elliott, C.T.; Hajšlová, J.; Mayar, S.; Krska, R. Worldwide Contamination of Food-Crops with Mycotoxins: Validity of the Widely Cited ‘FAO Estimate’ of 25%. Crit. Rev. Food Sci. Nutr. 2020, 60, 2773–2789. [Google Scholar] [CrossRef]
- European Commission. EFSA CONTAM Panel: Scientific Opinion-Risk Assessment of Aflatoxins in Food. Eur. Food Saf. Auth. 2020, 18, e06040. [Google Scholar] [CrossRef]
- International Agency for Research on Cancer. Mycotoxin Control in Low-and Middle Income Countries; Wild, C.P., Miller, J.D., Groopman, J.D., Eds.; IARC Working Group Report No. 9; International Agency for Research on Cancer: Lyon, France, 2015; Available online: https://Publications.Iarc.Fr/Book-And-Report-Series/Iarc-Working-Group-Reports/Mycotoxin-Control-In-Low—And-Middle-Income-Countries (accessed on 15 May 2025).
- Kensler, T.W.; Roebuck, B.D.; Wogan, G.N.; Groopman, J.D. Aflatoxin: A 50-Year Odyssey of Mechanistic and Translational Toxicology. Toxicol. Sci. 2011, 120, S28–S48. [Google Scholar] [CrossRef] [PubMed]
- IARC International Agency for Research on Cancer. Aflatoxins. Chemical Agents and Related Occupations; IARC Monographs on the Evaluation of Carcinogenic Risks to Humans, Vol. 100F; IARC Press: Lyon, France, 2012; pp. 225–248. [Google Scholar]
- Kensler, T.W.; Eaton, D.L. 65 Years on—Aflatoxin Biomarkers Blossoming: Whither Next? Toxins 2024, 16, 496. [Google Scholar] [CrossRef]
- Eaton, D.L.; Williams, D.E.; Coulombe, R.A. Species Differences in the Biotransformation of Aflatoxin B1: Primary Determinants of Relative Carcinogenic Potency in Different Animal Species. Toxins 2025, 17, 30. [Google Scholar] [CrossRef] [PubMed]
- Gerdemann, A.; Cramer, B.; Degen, G.H.; Veerkamp, J.; Günther, G.; Albrecht, W.; Behrens, M.; Esselen, M.; Ghallab, A.; Hengstler, J.G.; et al. Comparative Metabolism of Aflatoxin B1 in Mouse, Rat and Human Primary Hepatocytes Using HPLC–MS/MS. Arch. Toxicol. 2023, 97, 3179–3196. [Google Scholar] [CrossRef]
- Benkerroum, N.; Ismail, A. Human Breast Milk Contamination with Aflatoxins, Impact on Children’s Health, and Possible Control Means: A Review. Int. J. Environ. Res. Public Health 2022, 19, 16792. [Google Scholar] [CrossRef]
- Awuchi, C.G.; Ondari, E.N.; Ogbonna, C.U.; Upadhyay, A.K.; Baran, K.; Okpala, C.O.R.; Korzeniowska, M.; Guiné, R.P. Mycotoxins Affecting Animals, Foods, Humans, and Plants: Types, Occurrence, Toxicities, Action Mechanisms, Prevention, and Detoxification Strategies—A Revisit. Foods 2021, 10, 1279. [Google Scholar] [CrossRef]
- Gong, Y.; Hounsa, A.; Egal, S.; Turner, P.C.; Sutcliffe, A.E.; Hall, A.J.; Cardwell, K.; Wild, C.P. Postweaning Exposure to Aflatoxin Results in Impaired Child Growth: A Longitudinal Study in Benin, West Africa. Environ. Health Perspect. 2004, 112, 1334–1338. [Google Scholar] [CrossRef]
- Turner, P.C. The Molecular Epidemiology of Chronic Aflatoxin Driven Impaired Child Growth. Scientifica 2013, 2013, 152879. [Google Scholar] [CrossRef] [PubMed]
- Sherif, S.O.; Salama, E.E.; Abdel-Wahhab, M.A. Mycotoxins and Child Health: The Need for Health Risk Assessment. Int. J. Hyg. Environ. Health 2009, 212, 347–368. [Google Scholar] [CrossRef]
- Ismail, A.; Naeem, I.; Gong, Y.Y.; Routledge, M.N.; Akhtar, S.; Riaz, M.; Ramalho, L.N.Z.; De Oliveira, C.A.F.; Ismail, Z. Early Life Exposure to Dietary Aflatoxins, Health Impact and Control Perspectives: A Review. Trends Food Sci. Technol. 2021, 112, 212–224. [Google Scholar] [CrossRef]
- BFSA Bangladesh Food Safety Authority. Food Safety Regulations. Available online: http://Www.Bfsa.Gov.Bd/Sites/Default/Files/Files/Bfsa.Portal.Gov.Bd/Law/81690675_9a69_483b_8915_1fe8f6b2ddd0/Food-Safety-(Contaminants,-Toxins-and-Harmful-Residues)-Regulations,-2017.Pdf.2017 (accessed on 10 May 2025).
- Islam, G.M.R.; Hoque, M.M. Food Safety Regulation in Bangladesh, Chemical Hazard and Some Perception to Overcome the Dilemma. Int. Food Res. J. 2013, 20, 47. [Google Scholar]
- Zhu, J.; Zhang, L.; Hu, X.; Xiao, Y.; Chen, J.; Xu, Y.; Fremy, J.; Chu, F.S. Correlation of Dietary Aflatoxin B1 Levels with Excretion of Aflatoxin M1 in Human Urine. Cancer Res. 1987, 47, 1848–1852. [Google Scholar]
- Zarba, A.; Wild, C.P.; Hall, A.J.; Montesano, R.; Hudson, G.J.; Groopman, J.D. Aflatoxrn M1 in Human Breast Milk from The Gambia, West Africa, Quantified by Combined Monoclonal Antibody Immunoaffinity Chromatography and HPLC. Carcinogenesis 1992, 13, 891–894. [Google Scholar] [CrossRef]
- Ali, N.; Hossain, K.; Blaszkewicz, M.; Rahman, M.; Mohanto, N.C.; Alim, A.; Degen, G.H. Occurrence of Aflatoxin M1 in Urines from Rural and Urban Adult Cohorts in Bangladesh. Arch. Toxicol. 2016, 90, 1749–1755. [Google Scholar] [CrossRef]
- Ali, N.; Blaszkewicz, M.; Hossain, K.; Degen, G.H. Determination of Aflatoxin M1 in Urine Samples Indicates Frequent Dietary Exposure to Aflatoxin B1 in the Bangladeshi Population. Int. J. Hyg. Environ. Health 2017, 220, 271–281. [Google Scholar] [CrossRef]
- Ali, N.; Manirujjaman, M.; Rana, S.; Degen, G.H. Determination of Aflatoxin M1 and Deoxynivalenol Biomarkers in Infants and Children Urines from Bangladesh. Arch. Toxicol. 2020, 94, 3775–3786. [Google Scholar] [CrossRef]
- Islam, F.; Das Trisha, A.; Hafsa, J.M.; Hasan, A.; Degen, G.H.; Ali, N. Occurrence of Aflatoxin M1 in Human Breast Milk in Bangladesh. Mycotoxin Res. 2021, 37, 241–248. [Google Scholar] [CrossRef] [PubMed]
- Kuiper-Goodman, T. Prevention of Human Mycotoxicoses through Risk Assessment and Risk Management. In Mycotoxins in Grain. Compounds Other than Aflatoxin; Miller, J.D., Trenholm, H.L., Eds.; Eagan Press: St. Paul, MN, USA, 1994; pp. 439–469. [Google Scholar]
- Ali, N.; Habib, A.; Mahmud, F.; Tuba, H.R.; Degen, G.H. Aflatoxin M1 Analysis in Urine of Mill Workers in Bangladesh: A Pilot Study. Toxins 2024, 16, 45. [Google Scholar] [CrossRef] [PubMed]
- Salas, R.; Acosta, N.; Garza, A.D.J.; Tijerina, A.; Dávila, R.; Jiménez-Salas, Z.; Otero, L.; Santos, M.; Trujillo, A.-J. Levels of Aflatoxin M1 in Breast Milk of Lactating Mothers in Monterrey, Mexico: Exposure and Health Risk Assessment of Newborns. Toxins 2022, 14, 194. [Google Scholar] [CrossRef]
- Wael, F.; El-Kady, N.N.; Tayel, A.A. Infants Exposure to Aflatoxin M1 as a Novel Foodborne Zoonosis. Food Chem. Toxicol. 2011, 49, 2816–2819. [Google Scholar] [CrossRef]
- Elzupir, A.O.; Fadul, M.H.; Modwi, A.K.; Ali, N.M.; Jadian, A.F.; Ahmed, N.A.A.; Adam, S.Y.; Ahmed, N.A.; Khairy, A.A.; Khalil, E.A. Aflatoxin M 1 in Breast Milk of Nursing Sudanese Mothers. Mycotoxin Res. 2012, 28, 131–134. [Google Scholar] [CrossRef] [PubMed]
- Cantú-Cornelio, F.; Aguilar-Toalá, J.E.; de León-Rodríguez, C.I.; Esparza-Romero, J.; Vallejo-Cordoba, B.; González-Córdova, A.F.; García, H.S.; Hernández-Mendoza, A. Occurrence and Factors Associated with the Presence of Aflatoxin M1 in Breast Milk Samples of Nursing Mothers in Central Mexico. Food Control 2016, 62, 16–22. [Google Scholar] [CrossRef]
- Galvano, F.; Pietri, A.; Bertuzzi, T.; Gagliardi, L.; Ciotti, S.; Luisi, S.; Bognanno, M.; La Fauci, L.; Iacopino, A.M.; Nigro, F. Maternal Dietary Habits and Mycotoxin Occurrence in Human Mature Milk. Mol. Nutr. Food Res. 2008, 52, 496–501. [Google Scholar] [CrossRef] [PubMed]
- Ali, N.; Blaszkewicz, M.; Alim, A.; Hossain, K.; Degen, G.H. Urinary Biomarkers of Ochratoxin A and Citrinin Exposure in Two Bangladeshi Cohorts: Follow-up Study on Regional and Seasonal Influences. Arch. Toxicol. 2016, 90, 2683–2697. [Google Scholar] [CrossRef]
- Roy, M.; Harris, J.; Afreen, S.; Deak, E.; Gade, L.; Balajee, S.A.; Park, B.; Chiller, T.; Luby, S. Aflatoxin Contamination in Food Commodities in Bangladesh. Food Addit. Contam. Part B 2013, 6, 17–23. [Google Scholar] [CrossRef] [PubMed]
- Bhuiyan, M.N.H.; Hassan, M.T.; Begum, M.; Ahan, M.; Rahim, M. Occurrence and Seasonal Trends of Aflatoxin in Rice, Maize and Wheat in Bangladesh. Int. J. Sustain. Agric. Technol. 2013, 9, 8–14. [Google Scholar]
- Tarannum, N.; Nipa, M.N.; Das, S.; Parveen, S. Aflatoxin M1 Detection by ELISA in Raw and Processed Milk in Bangladesh. Toxicol. Rep. 2020, 7, 1339–1343. [Google Scholar] [CrossRef] [PubMed]
- Sumon, A.H.; Islam, F.; Mohanto, N.C.; Kathak, R.R.; Molla, N.H.; Rana, S.; Degen, G.H.; Ali, N. The Presence of Aflatoxin M1 in Milk and Milk Products in Bangladesh. Toxins 2021, 13, 440. [Google Scholar] [CrossRef]
- European Commission. Commission Regulation (EU) 2023/915 of 25 April 2023 on Maximum Levels for Certain Contaminants in Food and Repealing Regulation (EC) No 1881/2006; L 119, 5.5.2023; Official Journal of the European Union: Luxembourg, 2023; pp. 103–157. Available online: http://Data.Europa.Eu/Eli/Reg/2023/915/Oj2023 (accessed on 10 May 2025).
- Hernández, M.; Juan-García, A.; Moltó, J.C.; Mañes, J.; Juan, C. Evaluation of Mycotoxins in Infant Breast Milk and Infant Food, Reviewing the Literature Data. Toxins 2021, 13, 535. [Google Scholar] [CrossRef] [PubMed]
- Das Trisha, A.; Hafsa, J.M.; Hasan, A.; Habib, A.; Tuba, H.R.; Degen, G.H.; Ali, N. Occurrence of Ochratoxin A in Breast Milk and Urine Samples of Nursing Mothers in Bangladesh. Mycotoxin Res. 2024, 40, 135–146. [Google Scholar] [CrossRef]
- EFSA Scientific Committee; Hardy, A.; Benford, D.; Halldorsson, T.; Jeger, M.J.; Knutsen, H.K.; More, S.; Naegeli, H.; Noteborn, H.; Ockleford, C. Guidance on the Risk Assessment of Substances Present in Food Intended for Infants below 16 Weeks of Age. EFSA J. 2017, 15, e04849. [Google Scholar] [CrossRef]
- Tsakiris, I.N.; Tzatzarakis, M.N.; Alegakis, A.K.; Vlachou, M.I.; Renieri, E.A.; Tsatsakis, A.M. Risk Assessment Scenarios of Children’s Exposure to Aflatoxin M1 Residues in Different Milk Types from the Greek Market. Food Chem. Toxicol. 2013, 56, 261–265. [Google Scholar] [CrossRef]
- Quevedo-Garza, P.A.; Amador-Espejo, G.G.; Salas-García, R.; Ramos-Peña, E.G.; Trujillo, A.-J. Aflatoxin M1 Determination in Infant Formulae Distributed in Monterrey, Mexico. Toxins 2020, 12, 100. [Google Scholar] [CrossRef]

Disclaimer/Publisher’s Note: The statements, opinions and data contained in all publications are solely those of the individual author(s) and contributor(s) and not of MDPI and/or the editor(s). MDPI and/or the editor(s) disclaim responsibility for any injury to people or property resulting from any ideas, methods, instructions or products referred to in the content. |
© 2025 by the authors. Licensee MDPI, Basel, Switzerland. This article is an open access article distributed under the terms and conditions of the Creative Commons Attribution (CC BY) license (https://creativecommons.org/licenses/by/4.0/).