
A Nanoscale Structure Based on an MIM Waveguide Coupled with a Q Resonator for Monitoring Trace Element Concentration in the Human Body

 , ,
, ,
Abstract
:1. Introduction
2. Materials and Methods
3. Results
4. Discussion
5. Conclusions
Author Contributions
Funding
Conflicts of Interest
References
- Motil, A.; Danon, O.; Peled, Y.; Tur, M. Pump-Power-Independent Double Slope-Assisted Distributed and Fast Brillouin Fiber-Optic Sensor. IEEE Photonics Technol. Lett. 2014, 26, 797–800. [Google Scholar] [CrossRef]
- Liu, L.; Liu, Z.; Zhang, Y.; Liu, S. V-shaped micro-structure optical fiber surface plasmon resonance sensor for the simultaneous measurement of the refractive index and temperature. Opt. Lett. 2019, 44, 5093–5096. [Google Scholar] [CrossRef]
- Allsop, T.; Neal, R. A Review: Evolution and Diversity of Optical Fibre Plasmonic Sensors. Sensors 2019, 19, 4874. [Google Scholar] [CrossRef] [Green Version]
- Liu, Z.; Liu, W.; Lai, B.; Zhang, Y.; Zhang, Y.; Yang, X.; Zhang, J.; Yuan, L. SPR sensor based on Bessel-like beam. Opt. Express 2021, 29, 18305–18314. [Google Scholar] [CrossRef]
- Barnes, W.L.; Dereux, A.; Ebbesen, T.W. Surface plasmon subwavelength optics. Nature 2003, 424, 824–830. [Google Scholar] [CrossRef] [PubMed]
- Chen, Z.; Yu, L. Multiple Fano Resonances Based on Different Waveguide Modes in a Symmetry Breaking Plasmonic System. IEEE Photonics J. 2014, 6, 1–8. [Google Scholar] [CrossRef]
- Gramotnev, D.K.; Bozhevolnyi, S.I. Plasmonics beyond the diffraction limit. Nat. Photonics 2010, 4, 83–91. [Google Scholar] [CrossRef]
- Dai, M.; Chen, Z.; Zhao, Y.; Gandhi, M.; Fu, H. State-of-the-Art Optical Microfiber Coupler Sensors for Physical and Biochemical Sensing Applications. Biosensors 2020, 10, 179. [Google Scholar] [CrossRef] [PubMed]
- Shi, X.; Ma, L.; Zhang, Z.; Yue, T.; Zhang, Y.; Han, J.; Sun, Y. Dual Fano resonance control and refractive index sensors based on a plasmonic waveguide-coupled resonator system. Opt. Commun. 2018, 427, 326–330. [Google Scholar] [CrossRef]
- Chen, P.; Liang, R.; Huang, Q.; Yu, Z.; Xu, X. Plasmonic filters and optical directional couplers based on wide metal-insulator-metal structure. Opt. Express 2011, 19, 7633. [Google Scholar] [CrossRef]
- Wang, S.; Li, Y.; Xu, Q.; Li, S. A MIM Filter Based on a Side-Coupled Crossbeam Square-Ring Resonator. Plasmonics 2016, 11, 1–6. [Google Scholar] [CrossRef]
- Fan, Z. A Tunable High-Sensitivity Refractive Index of Analyte Biosensor Based on Metal-Nanoscale Covered Photonic Crystal Fiber with Surface Plasmon Resonance. IEEE Photonics J. 2019, 11, 1–14. [Google Scholar] [CrossRef]
- Huang, Y.X.; Xie, Y.Y.; Zhao, W.L.; Che, H.J.; Li, J.C. A plasmonic refractive index sensor based on a MIM waveguide with a side-coupled nanodisk resonator. In Proceedings of the 2014 IEEE 20th International Conference on Embedded and Real-Time Computing Systems and Applications (RTCSA), Chongqing, China, 20–22 August 2014. [Google Scholar]
- Pathak, A.K.; Singh, V.K. SPR Based Optical Fiber Refractive Index Sensor Using Silver Nanowire Assisted CSMFC. IEEE Photonics Technol. Lett. 2020, 32, 465–468. [Google Scholar] [CrossRef]
- Li, Z.; Wen, K.; Chen, L.; Lei, L.; Zhou, J.; Zhou, D.; Fang, Y.; Wu, B. Refractive index sensor based on multiple Fano resonances in a plasmonic MIM structure. Appl. Opt. 2019, 58, 4878–4883. [Google Scholar] [CrossRef]
- Vasić, B. Semi-analytical approach for refractive index sensors based on reflective metasurfaces. J. Opt. Soc. Am. B 2021, 38, 1676–1683. [Google Scholar] [CrossRef]
- Fang, M.; Shi, F.; Chen, Y. Unidirectional All-Optical Absorption Switch Based on Optical Tamm State in Nonlinear Plasmonic Waveguide. Plasmonics 2016, 11, 1–7. [Google Scholar] [CrossRef]
- Jin, T.; Qi, J.W.; Xu, G.H. All-Optical Plasmonic Switches Based on Coupled Nano-disk Cavity Structures Containing Nonlinear Material. Plasmonics 2011, 6, 753–759. [Google Scholar]
- Fitrakis, E.P.; Kamalakis, T.; Sphicopoulos, T. Slow light in insulator–metal–insulator plasmonic waveguides. JOSA B 2011, 28, 2159–2164. [Google Scholar] [CrossRef]
- Yi, X.; Tian, J.; Yang, R. Tunable Fano resonance in plasmonic MDM waveguide with a square type split-ring resonator. Optik 2018, 171, 139–148. [Google Scholar] [CrossRef]
- Zhang, Y.; Kuang, Y.; Zhang, Z.; Tang, Y.; Han, J.; Wang, R.; Cui, J.; Hou, Y.; Liu, W. High-sensitivity refractive index sensors based on Fano resonance in the plasmonic system of splitting ring cavity-coupled MIM waveguide with tooth cavity. Appl. Phys. 2019, 125, 1–5. [Google Scholar] [CrossRef]
- Ren, X.; Ren, K.; Cai, Y. Tunable compact nanosensor based on Fano resonance in a plasmonic waveguide system. Appl. Opt. 2017, 56, H1–H9. [Google Scholar] [CrossRef]
- Kekatpure, R.D.; Hryciw, A.C.; Barnard, E.S.; Brongersma, M.L. Solving dielectric and plasmonic waveguide dispersion relations on a pocket calculator. Opt. Express 2009, 17, 24112–24129. [Google Scholar] [CrossRef] [PubMed] [Green Version]
- Dionne, J.A.; Sweatlock, L.A.; Atwater, H.A.; Polman, A. Plasmon slot waveguides: Towards chip-scale propagation with subwavelength-scale localization. Phys. Rev. B 2006, 73, 035407. [Google Scholar] [CrossRef] [Green Version]
- Gai, H.; Wang, J.; Qian, T. Modified Debye model parameters of metals applicable for broadband calculations. Appl. Opt. 2007, 46, 2229–2233. [Google Scholar] [CrossRef] [PubMed]
- Hu, F.; Yi, H.; Zhou, Z. Wavelength demultiplexing structure based on arrayed plasmonic slot cavities. Opt. Lett. 2011, 36, 1500–1502. [Google Scholar] [CrossRef] [PubMed]
- Butt, M.A.; Kazanskiy, N.L.; Khonina, S.N. Nanodots decorated asymmetric metal–insulator–metal waveguide resonator structure based on Fano resonances for refractive index sensing application. Laser Phys. 2020, 30, 076204. [Google Scholar] [CrossRef]
- Butt, A.; Khonina, S.N.; Kazanskiy, N.L. Highly Sensitive Refractive Index Sensor Based on Plasmonic Bow Tie Configuration. Photonic Sens. 2020, 10, 223–232. [Google Scholar] [CrossRef]
- Qiao, L.; Zhang, G.; Wang, Z.; Fan, G.; Yan, Y. Study on the Fano resonance of coupling M-type cavity based on surface plasmon polaritons. Opt. Commun. 2019, 433, 144–149. [Google Scholar] [CrossRef]
- Nejat, M.; Nozhat, N. Multi-band MIM refractive index biosensor based on Ag-air grating with equivalent circuit and T-matrix methods in near-infrared region. Sci. Rep. 2020, 10, 1–12. [Google Scholar] [CrossRef]
- Chen, J.; Yang, H.; Fang, Z.; Zhao, M.; Xie, C. Refractive Index Sensing Based on Multiple Fano Resonances in a Split-Ring Cavity-Coupled MIM Waveguide. Photonics 2021, 8, 472. [Google Scholar] [CrossRef]
- Wu, T.; Liu, Y.; Yu, Z.; Peng, Y.; Shu, C.; Ye, H. The sensing characteristics of plasmonic waveguide with a ring resonator. Opt. Express 2014, 22, 7669–7677. [Google Scholar] [CrossRef]
- Phan, Q.H.; Lai, Y.R.; Xiao, W.Z.; Pham, T.T.; Lien, C.H. Surface plasmon resonance prism coupler for enhanced circular birefringence sensing and application to non-invasive glucose detection. Opt. Express 2020, 28, 24889–24899. [Google Scholar] [CrossRef] [PubMed]
- Weng, S.; Pei, L.; Liu, C.; Wang, J.; Li, J.; Ning, T. Double-Side Polished Fiber SPR Sensor for Simultaneous Temperature and Refractive Index Measurement. IEEE Photonics Technol. Lett. 2016, 28, 1916–1919. [Google Scholar] [CrossRef]
- Xiao, F.; Michel, D.; Li, G.; Xu, A.; Alameh, K. Simultaneous Measurement of Refractive Index and Temperature Based on Surface Plasmon Resonance Sensors. J. Lightwave Technol. 2014, 32, 4169–4173. [Google Scholar] [CrossRef]
- Zhang, R.; Pu, S.; Li, X. Gold-Film-Thickness Dependent SPR Refractive Index and Temperature Sensing with Hetero-Core Optical Fiber Structure. Sensors 2019, 19, 4345. [Google Scholar] [CrossRef] [Green Version]
- Yasli, A.; Ademgil, H. Modeling the Photonic Crystal Fiber based Surface Plazmon Resonance Biosensor to Detect Blood Components. In Proceedings of the 2021 29th Signal Processing and Communications Applications Conference (SIU), Istanbul, Turkey, 9–11 June 2021; pp. 1–4. [Google Scholar]
- Sharma, A.K. Plasmonic biosensor for detection of hemoglobin concentration in human blood: Design considerations. J. Appl. Phys. 2013, 114, 237–244. [Google Scholar] [CrossRef]
- Hassan, M.F.; Sagor, R.H.; Amin, M.R.; Islam, M.R.; Alam, M.S. Point of Care Detection of Blood Electrolytes and Glucose Utilizing Nano-Dot Enhanced Plasmonic Biosensor. IEEE Sens. J. 2021, 21, 17749–17757. [Google Scholar] [CrossRef]


| Reference | Structure | Sensitivity | Operating Wavelength Range |
|---|---|---|---|
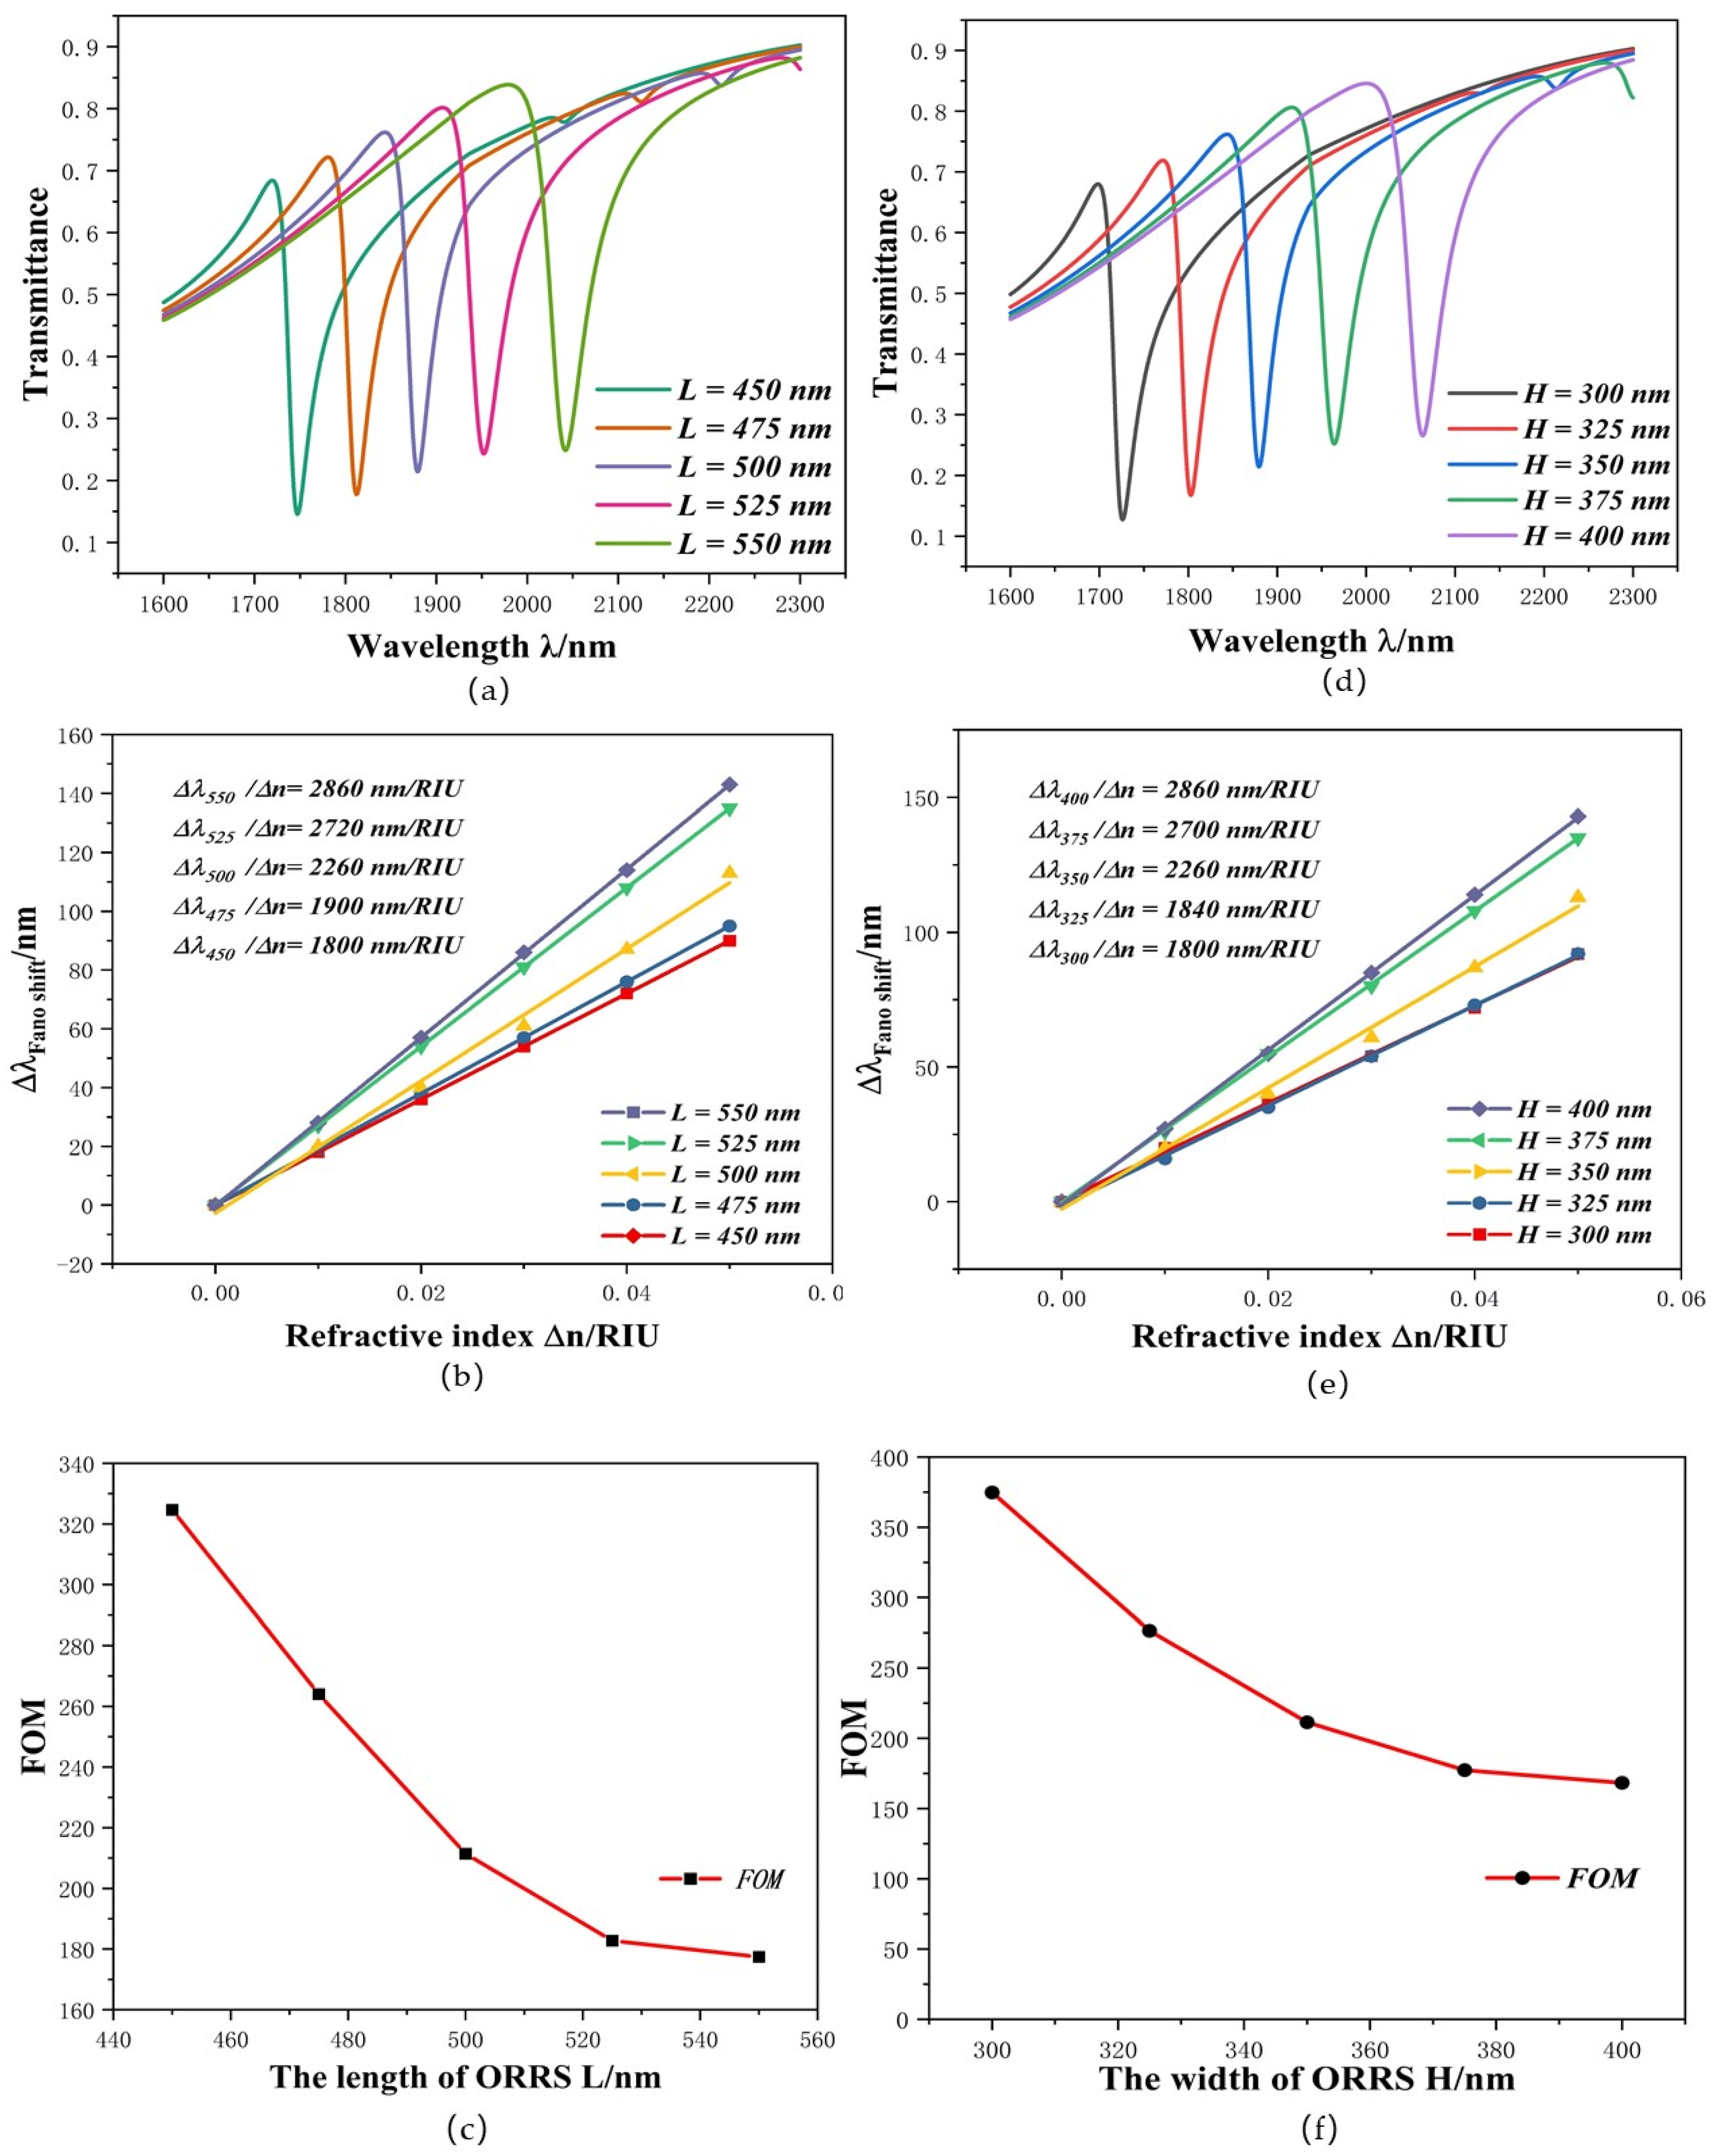
| This paper | Orthogon ring resonance with short column | 2260 nm/RIU | 1500 nm < λ < 2000 nm |
| [22]/2017 | A side-coupled split-ring resonator | 1400 nm/RIU | 800 nm < λ < 1400 nm |
| [21]/2018 | Split ring resonator with rectangular short column | 1200 nm/RIU | 800 nm < λ < 1400 nm |
| [20]/2018 | Split rectangular ring resonator with rectangular | 1800 nm/RIU | 800 nm < λ < 1400 nm |
| [29]/2019 | Symmetric M-type resonator with baffle | 780 nm/RIU | 800 nm < λ < 1600 nm |
| [28]/2020 | Bow-tie resonator | 2300 nm/RIU | 800 nm < λ < 2300 nm |
| [30]/2020 | Ag-air grating | 2000 nm/RIU | 800 nm < λ < 2000 nm |
| [31]/2021 | A split-ring resonance cavity and a double symmetric rectangular stub waveguide | 1328.8 nm/RIU | 800 nm < λ < 1500 nm |
| Structure | Sensitivity | FOM | Operating Wavelength Range |
|---|---|---|---|
| ORRS | 2260 nm/RIU | 211.42 | 1500 nm < λ < 2000 nm |
| ORRS without Stub-2 | 2200 nm/RIU | 219.51 | 1500 nm < λ < 2100 nm |
| Square Resonators without Stub-2 | 2100 nm/RIU | 231.81 | 1500 nm < λ < 2000 nm |
Publisher’s Note: MDPI stays neutral with regard to jurisdictional claims in published maps and institutional affiliations. |
© 2021 by the authors. Licensee MDPI, Basel, Switzerland. This article is an open access article distributed under the terms and conditions of the Creative Commons Attribution (CC BY) license (https://creativecommons.org/licenses/by/4.0/).
Share and Cite
Li, T.; Yan, S.; Liu, P.; Zhang, X.; Zhang, Y.; Shen, L.; Ren, Y.; Hua, E. A Nanoscale Structure Based on an MIM Waveguide Coupled with a Q Resonator for Monitoring Trace Element Concentration in the Human Body. Micromachines 2021, 12, 1384. https://doi.org/10.3390/mi12111384
Li T, Yan S, Liu P, Zhang X, Zhang Y, Shen L, Ren Y, Hua E. A Nanoscale Structure Based on an MIM Waveguide Coupled with a Q Resonator for Monitoring Trace Element Concentration in the Human Body. Micromachines. 2021; 12(11):1384. https://doi.org/10.3390/mi12111384
Chicago/Turabian StyleLi, Tingsong, Shubin Yan, Pengwei Liu, Xiaoyu Zhang, Yi Zhang, Lifang Shen, Yifeng Ren, and Ertian Hua. 2021. "A Nanoscale Structure Based on an MIM Waveguide Coupled with a Q Resonator for Monitoring Trace Element Concentration in the Human Body" Micromachines 12, no. 11: 1384. https://doi.org/10.3390/mi12111384