
Numerical Study of the Microflow Characteristics in a V-ball Valve


Abstract
:1. Introduction
2. Methods
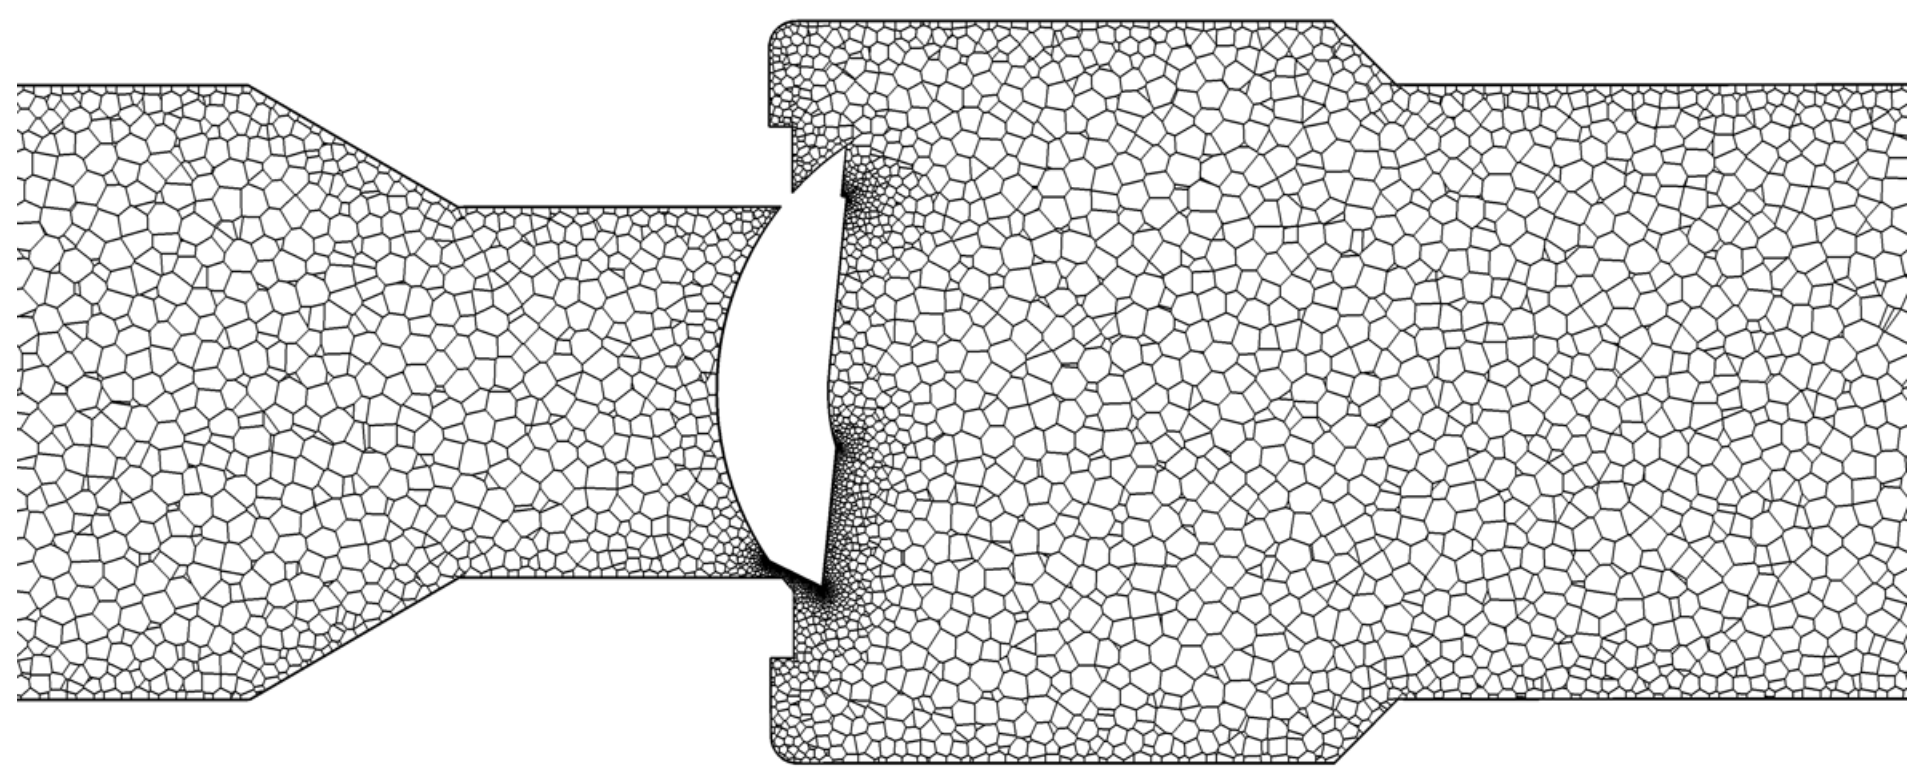
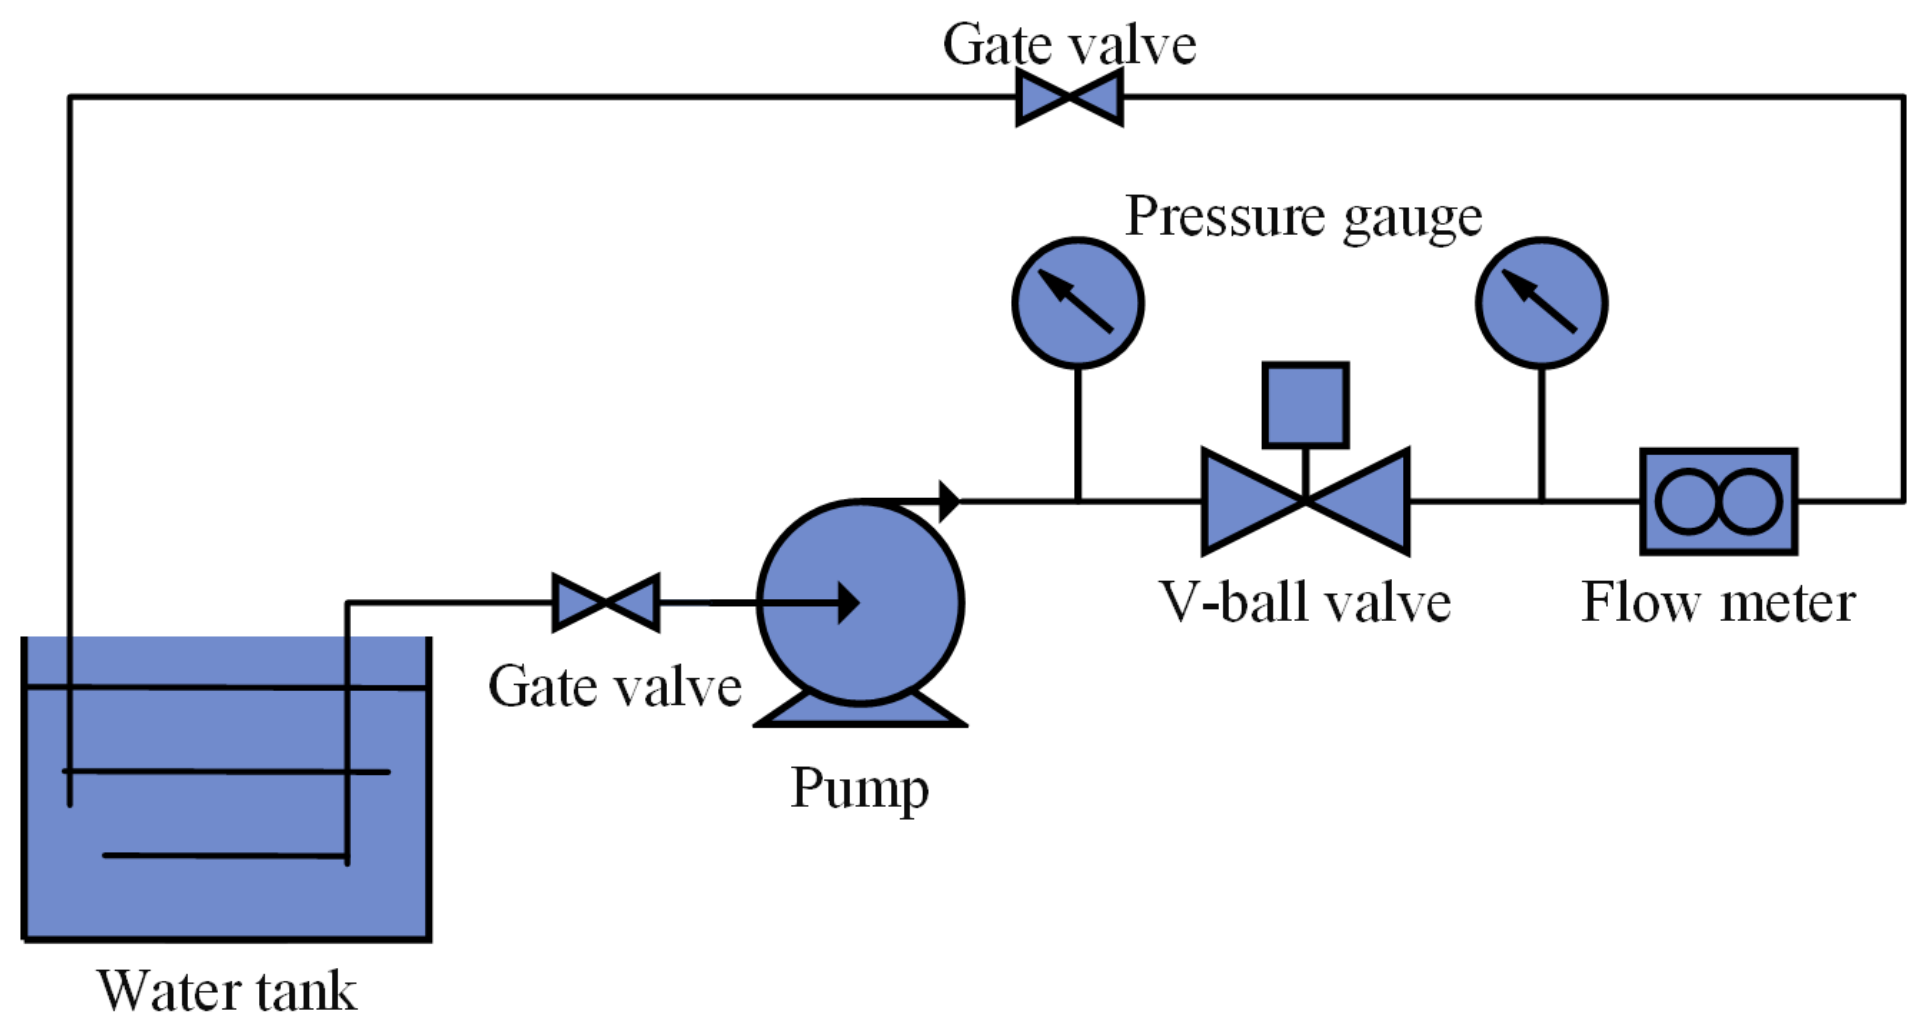
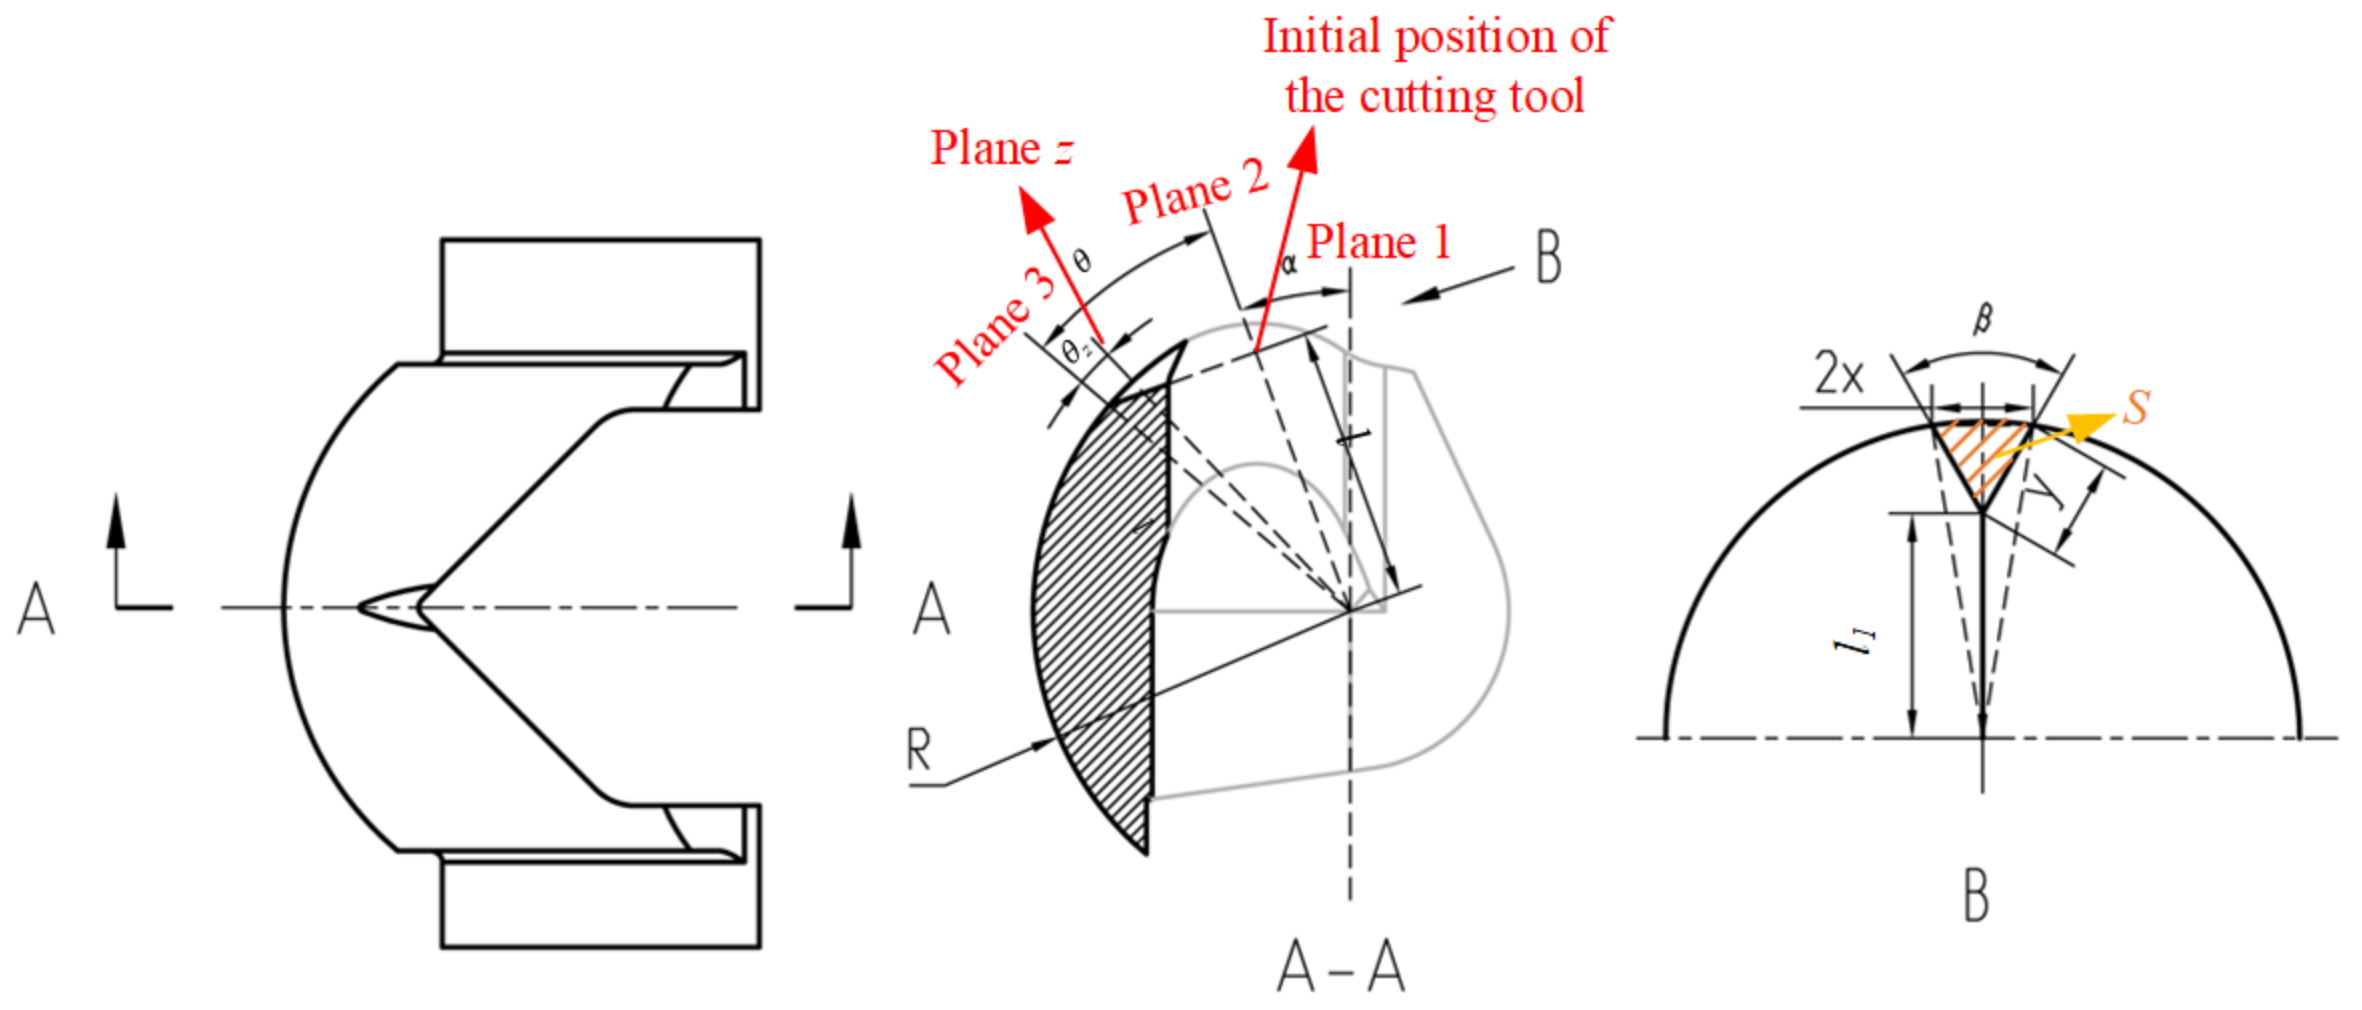
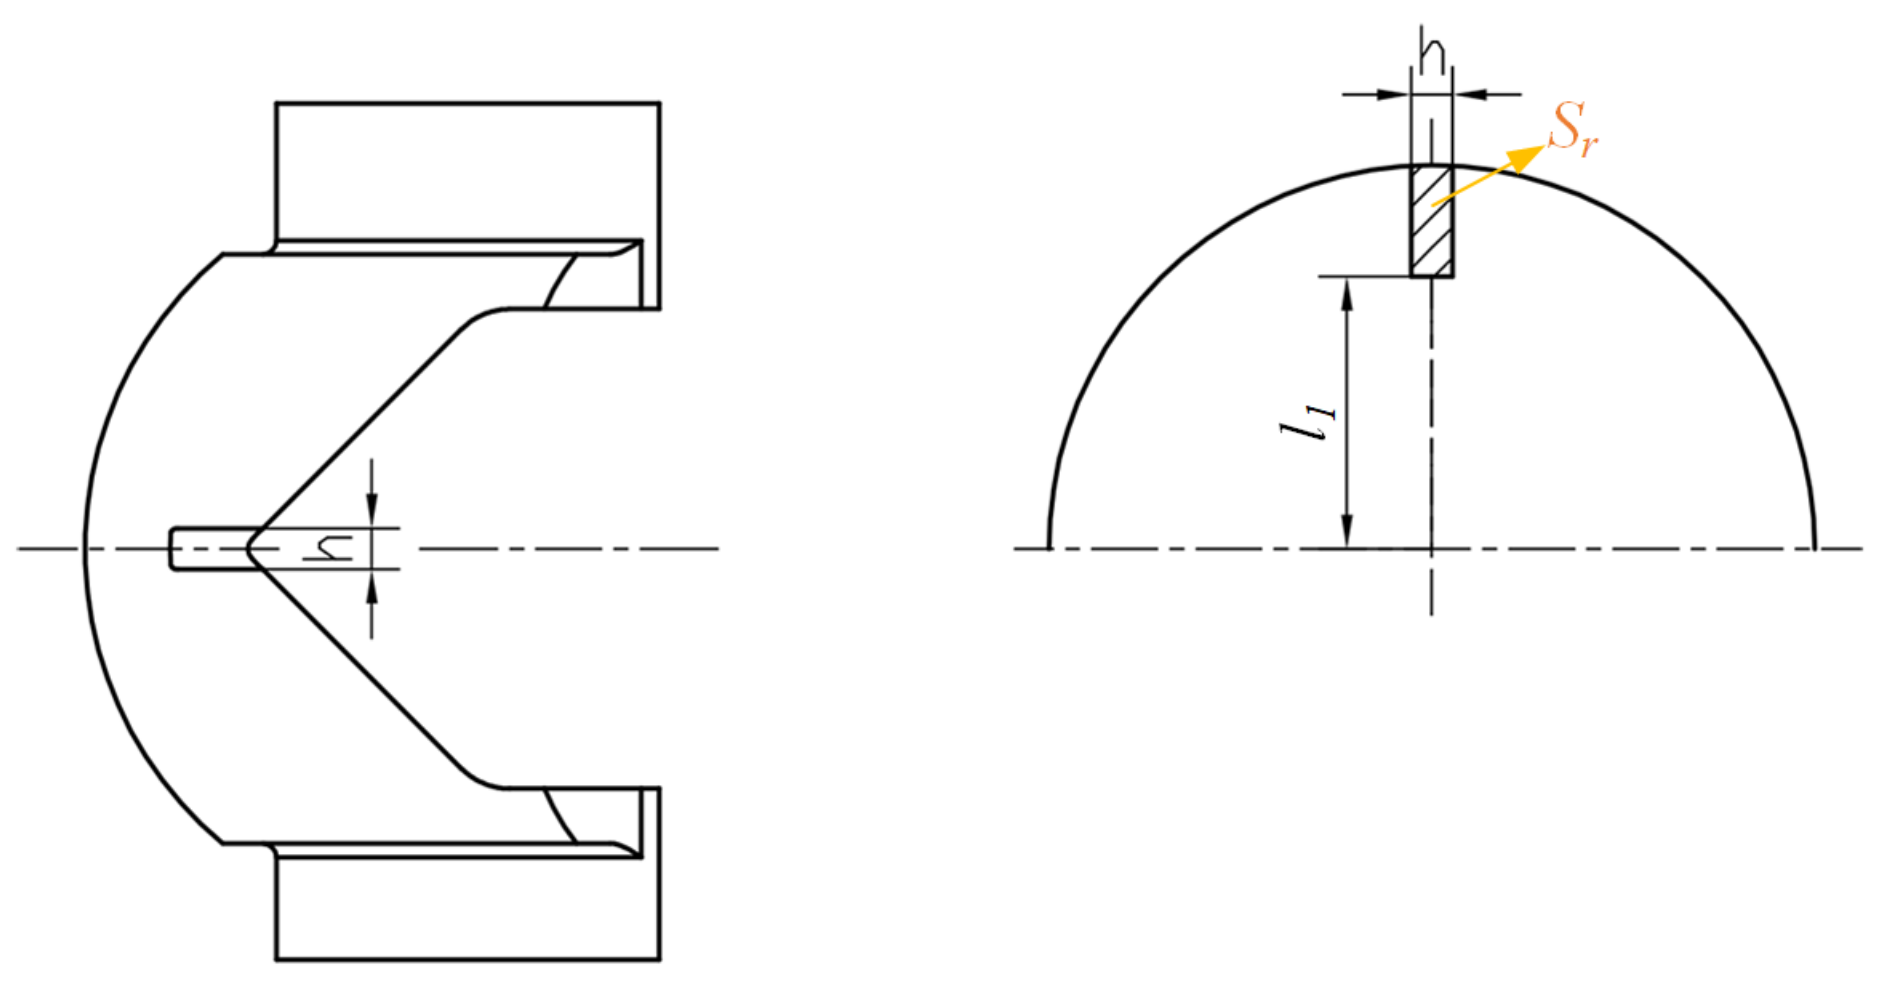
2.1. Physical Model
2.2. Numerical Model
2.3. Analysis Method
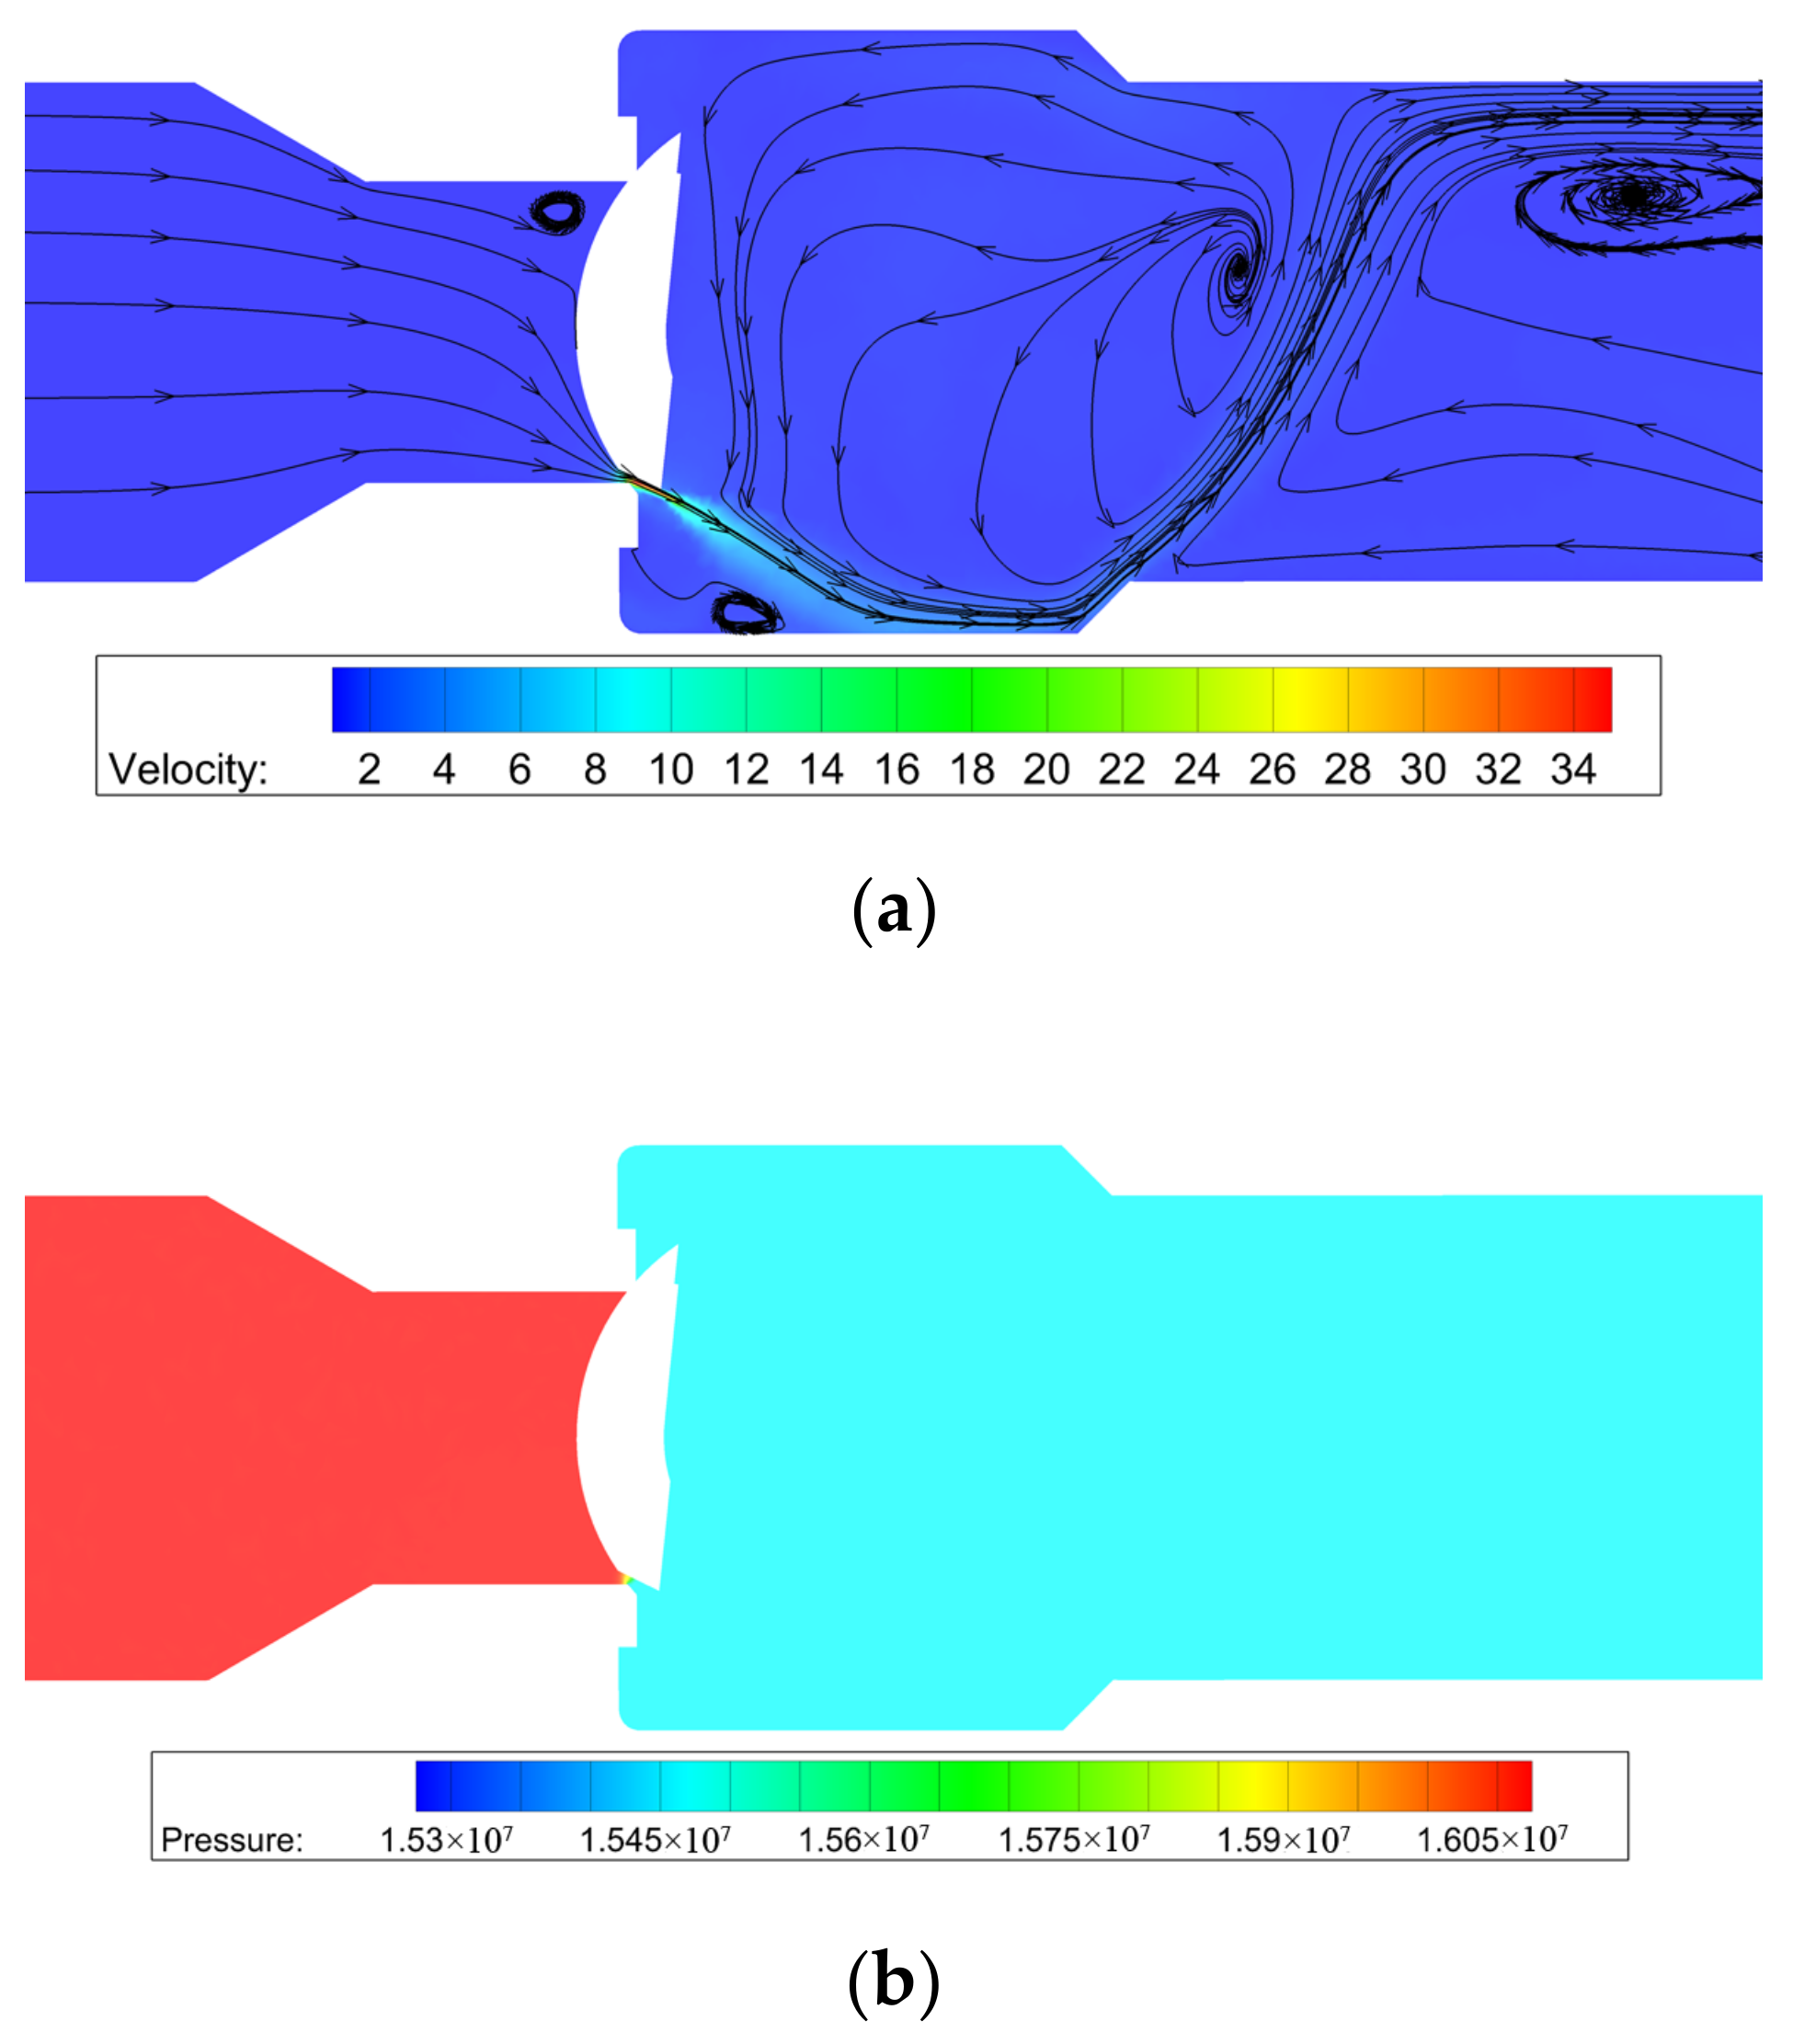
3. Results
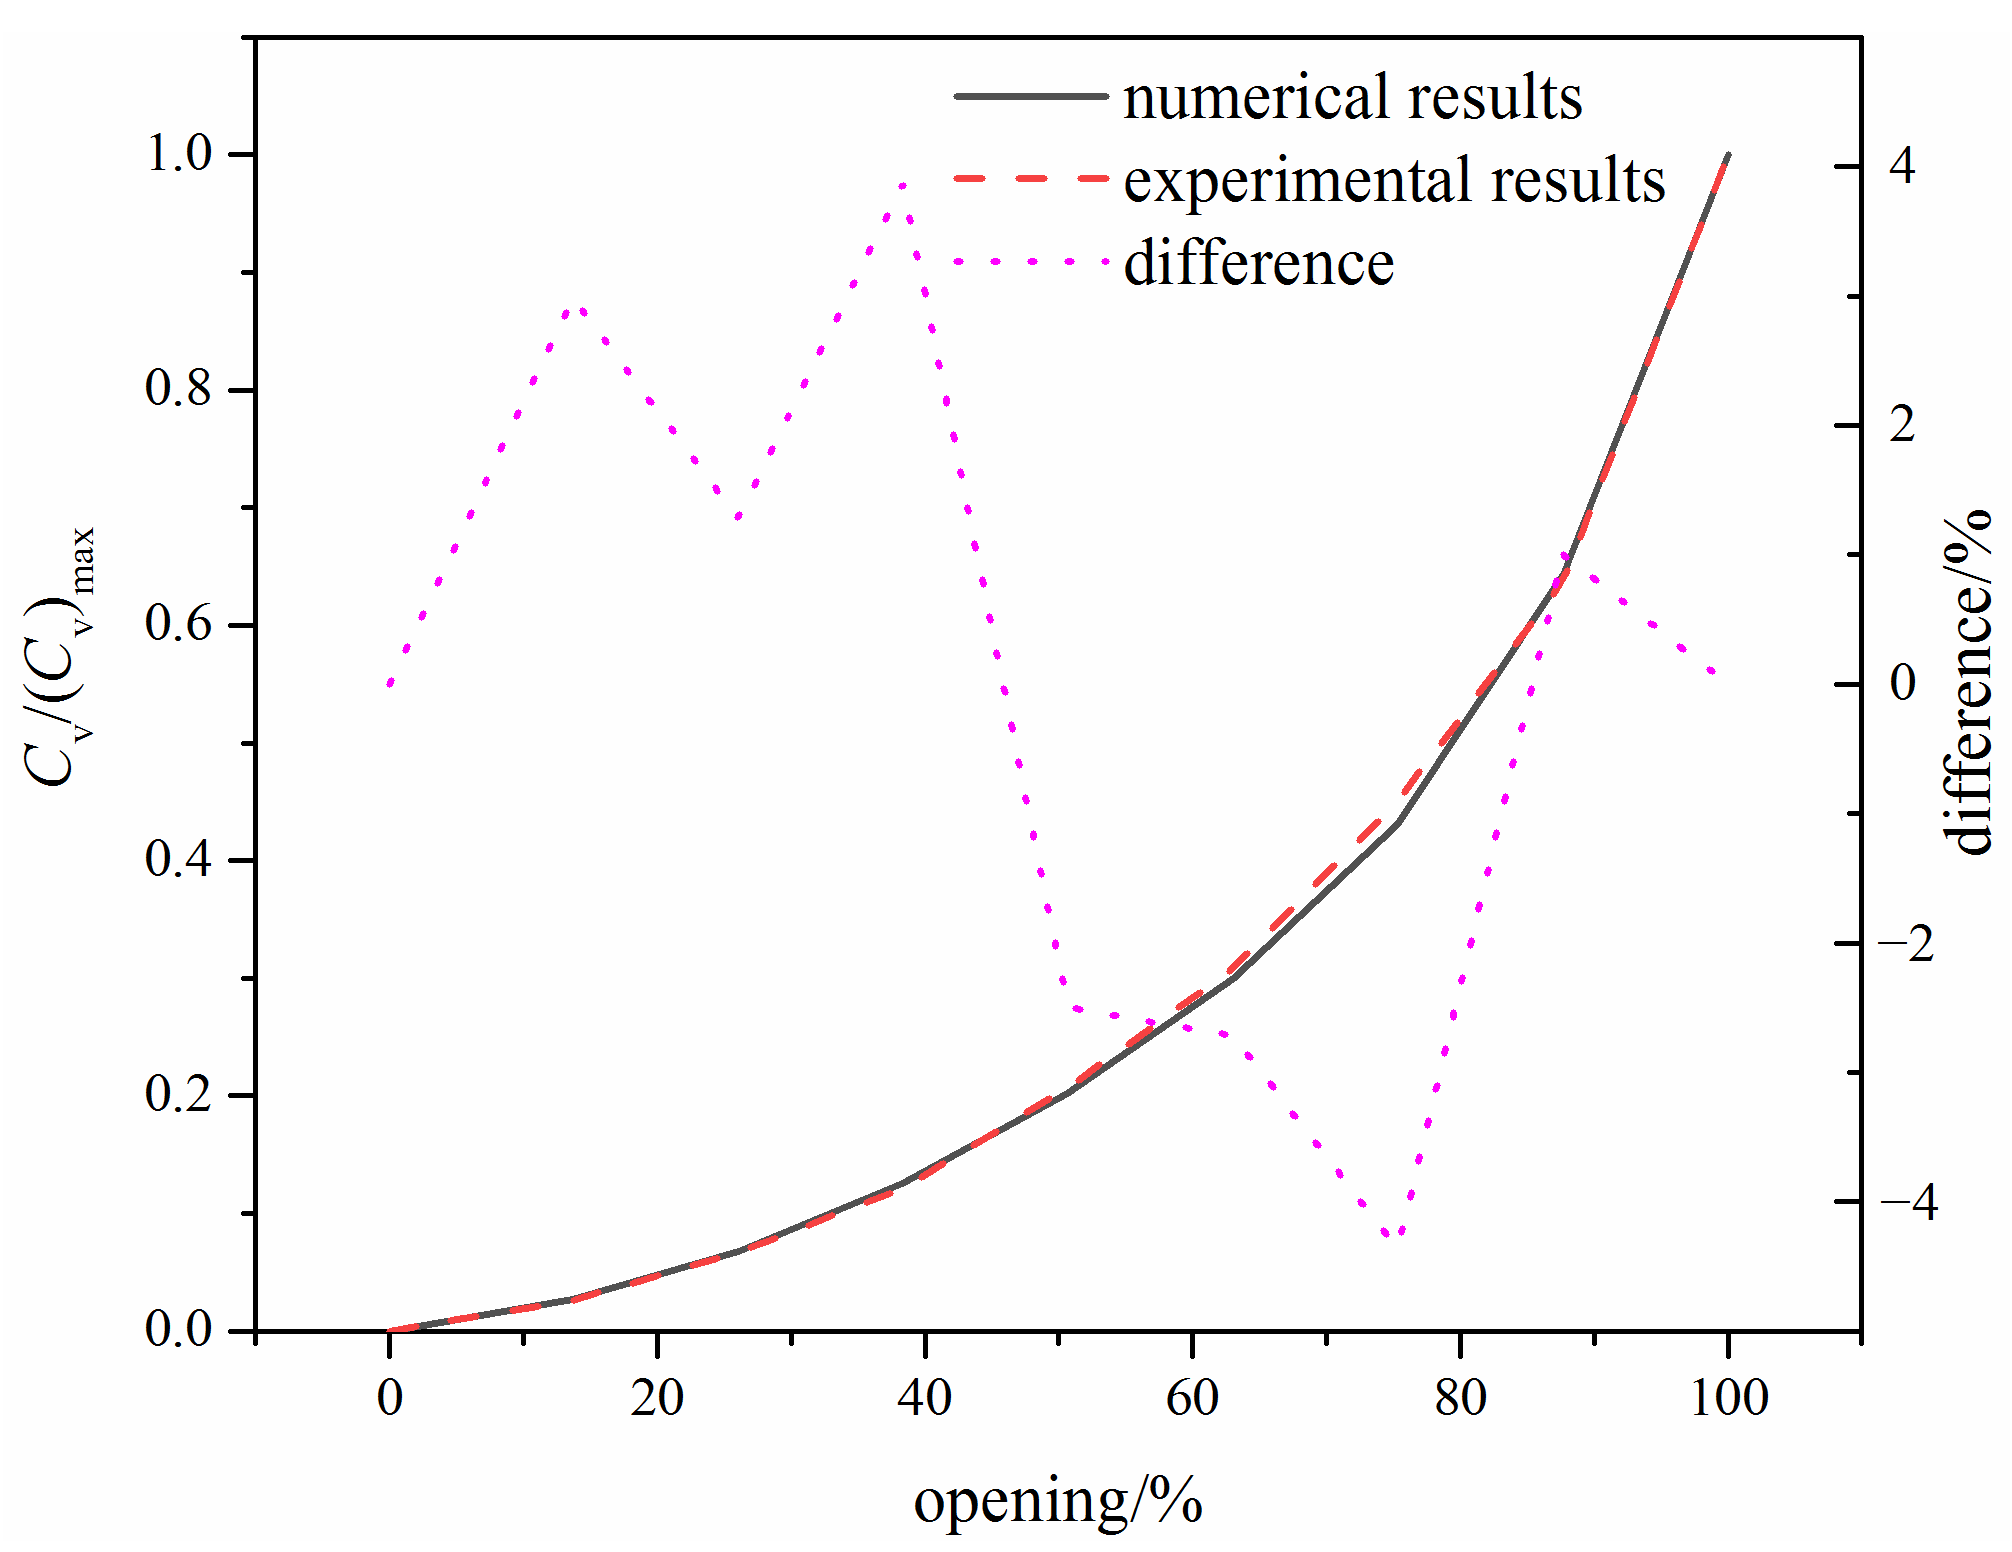
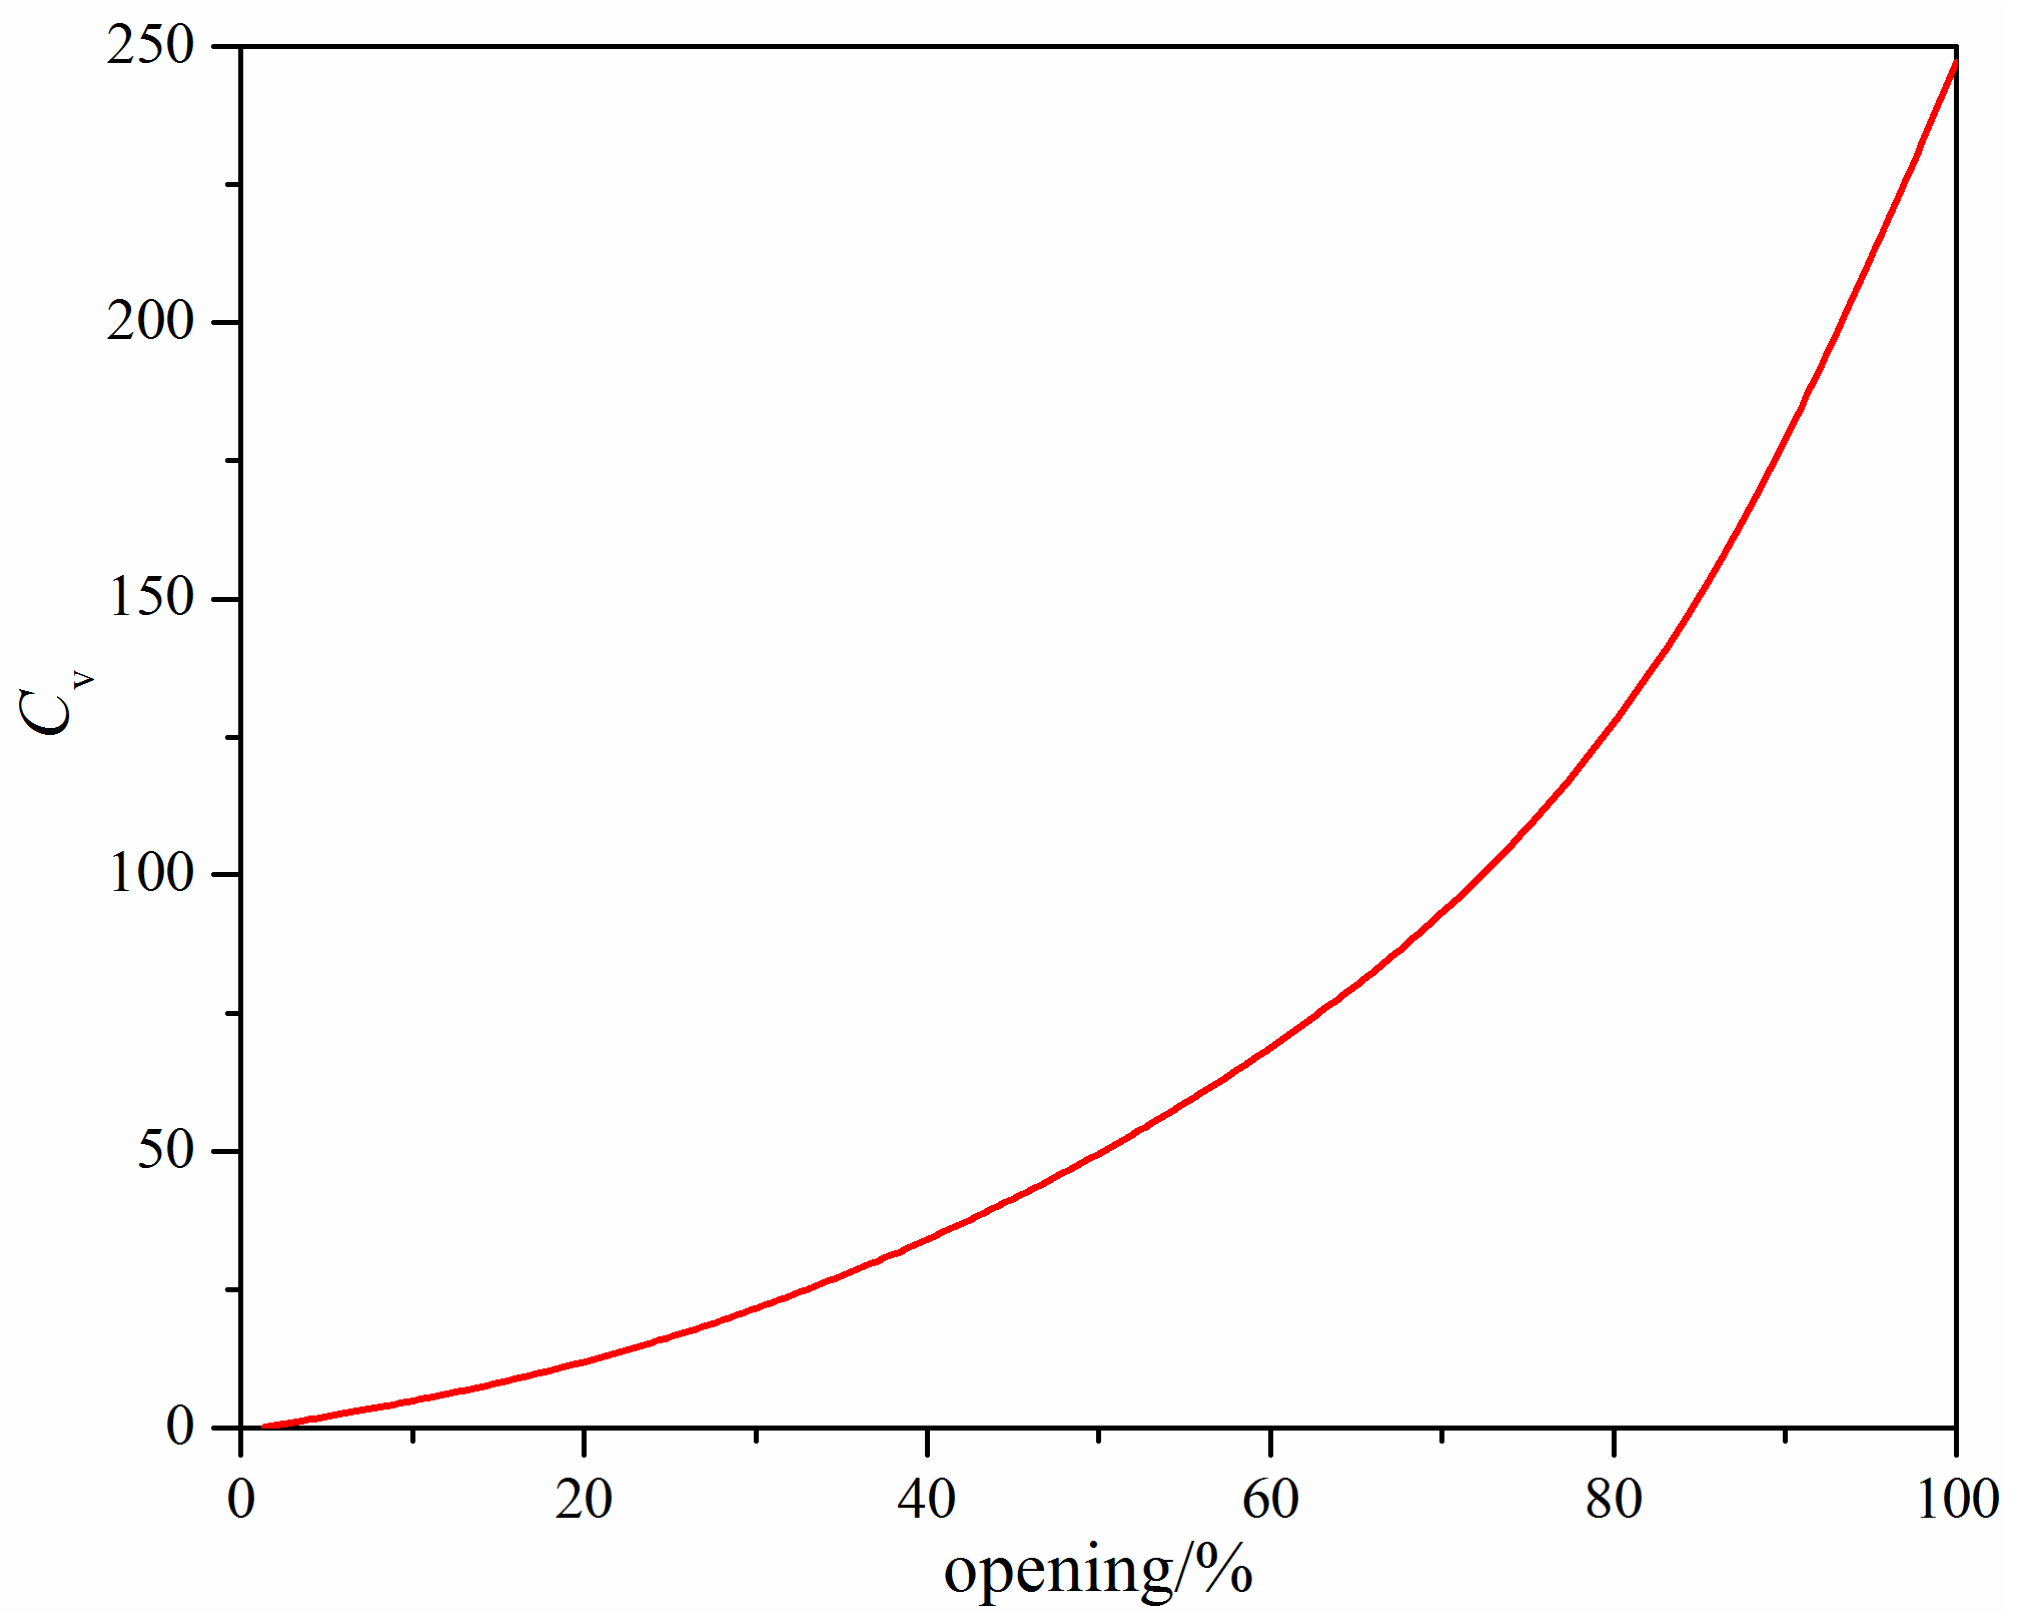
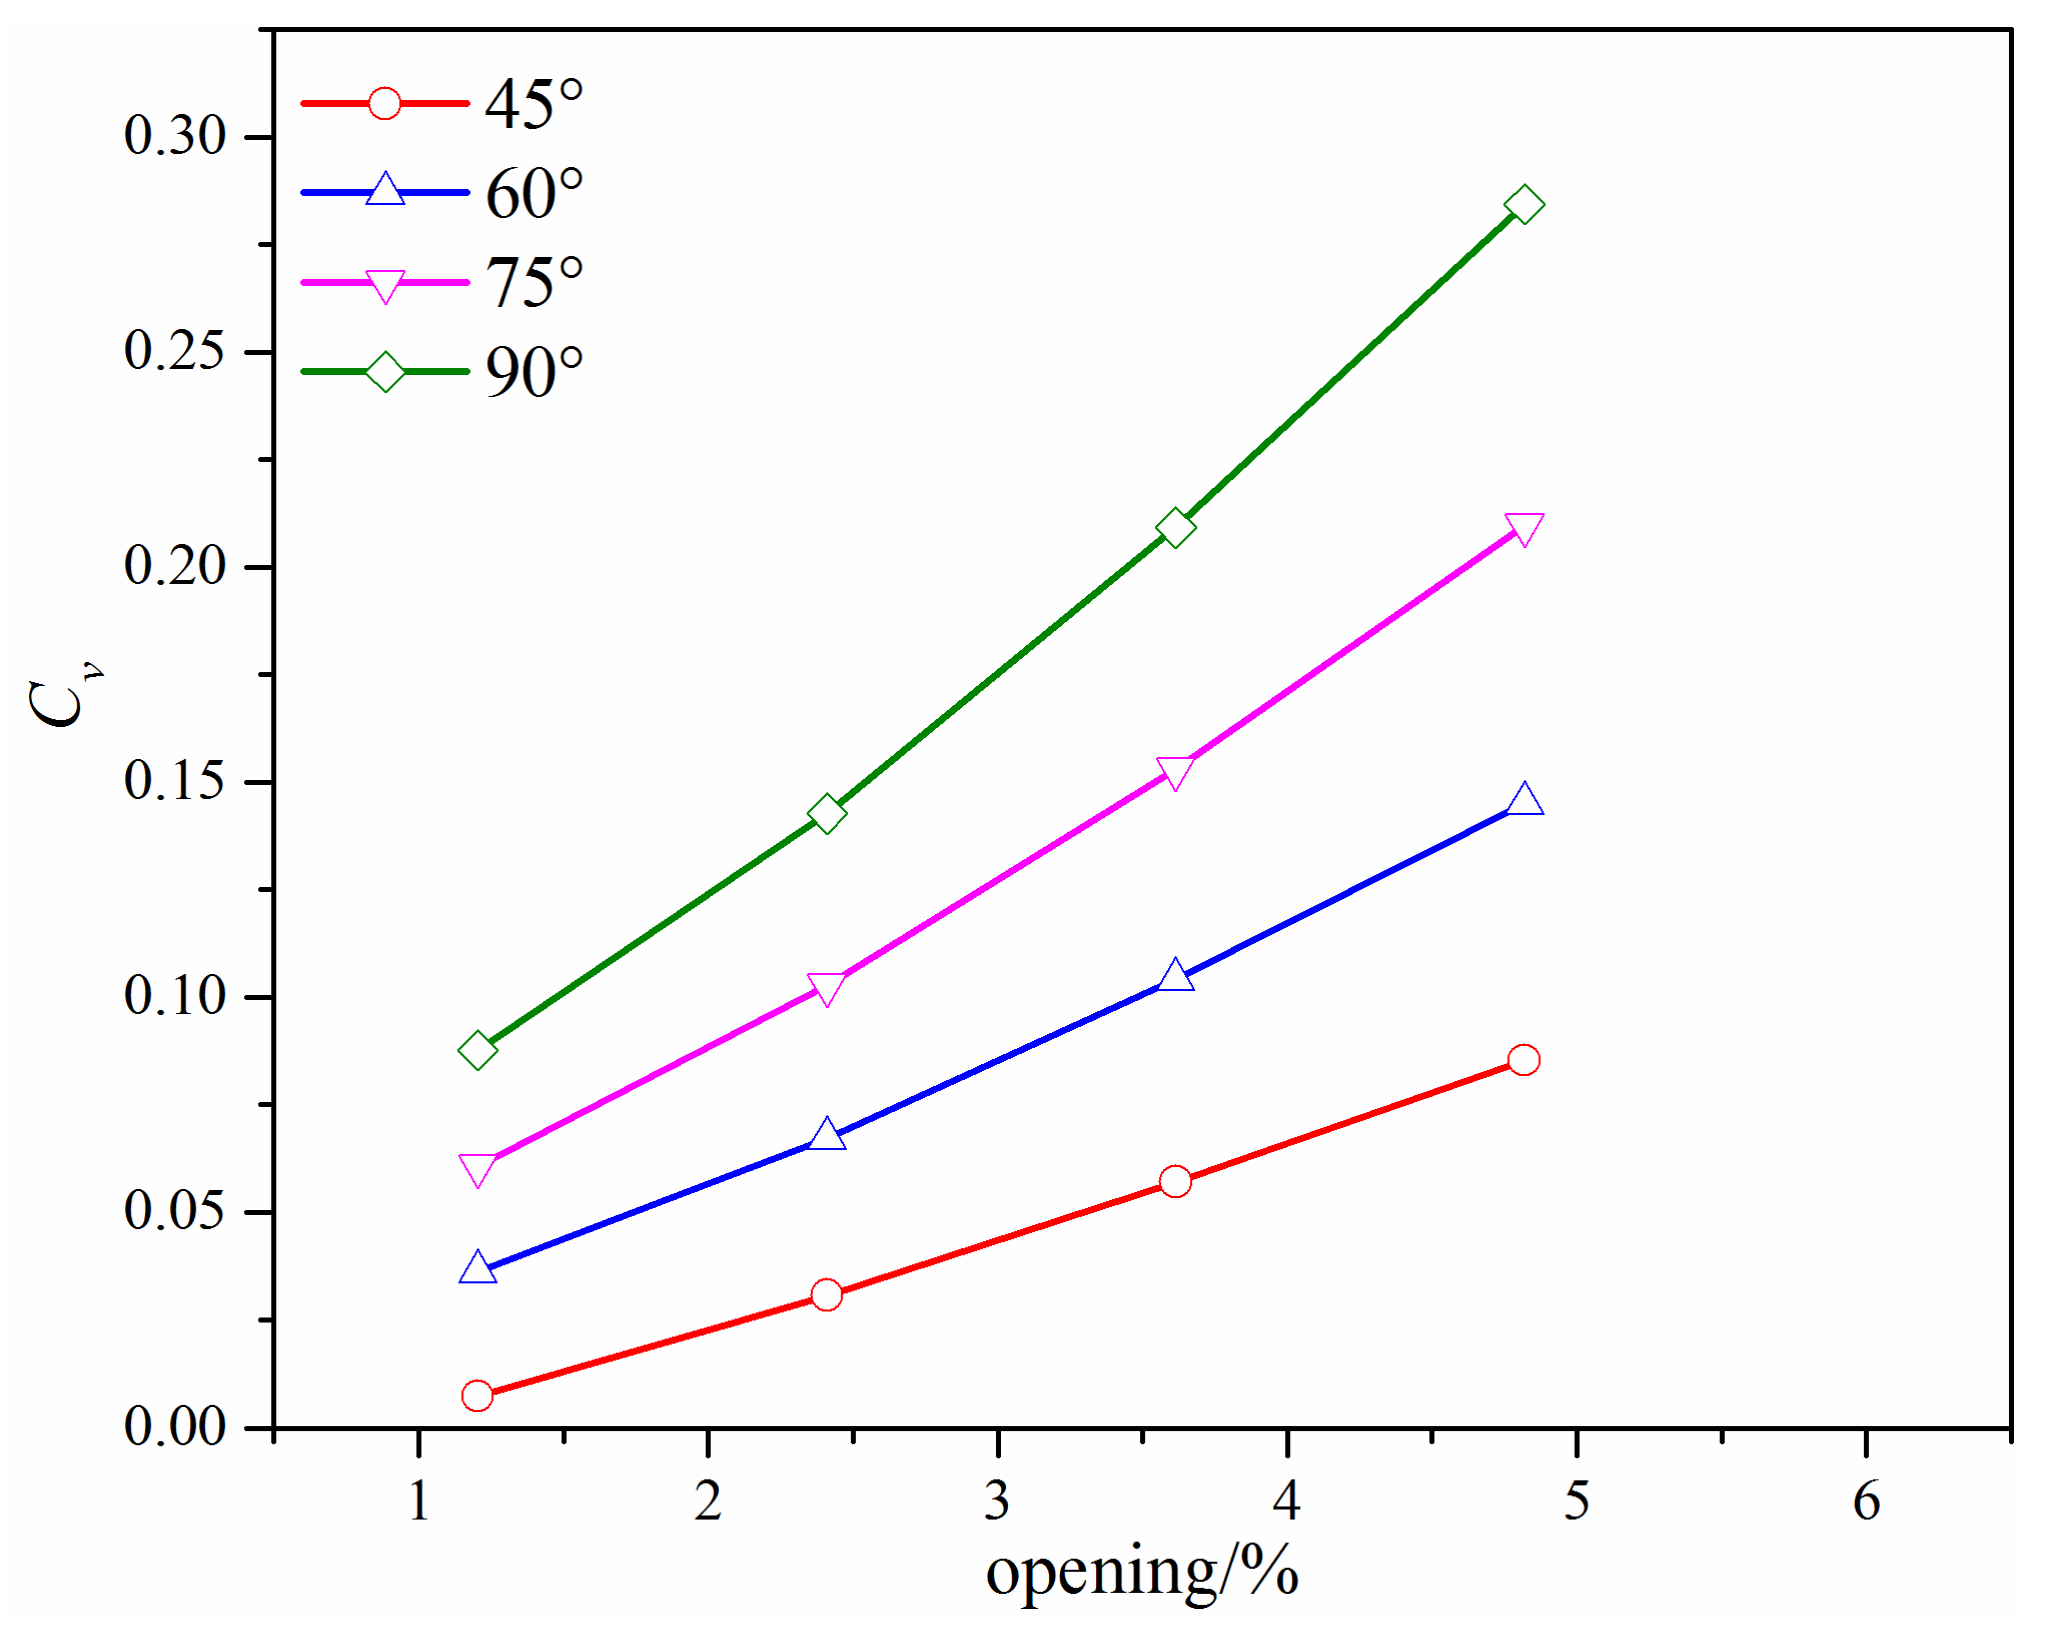
3.1. Flow Coefficient
3.2. Loss Coefficient
4. Conclusions
Author Contributions
Funding
Conflicts of Interest
References
- Yonezawa, K.; Ogawa, R.; Ogi, K.; Takino, T.; Tsujimoto, Y.; Endo, T.; Tezuka, K.; Morita, R.; Inada, F. Flow-induced vibration of a steam control valve. J. Fluids Struct. 2012, 35, 76–88. [Google Scholar] [CrossRef]
- Zeng, L.F.; Liu, G.W.; Mao, J.R.; Wang, S.S.; Yuan, Q.; Yuan, H.; Wang, K.G.; Zhang, J.J.; Xu, Y.T. Flow-induced vibration and noise in control valve. Proc. Inst. Mech. Eng. Part C J. Eng. Mech. Eng. Sci. 2015, 229, 3368–3377. [Google Scholar] [CrossRef]
- Li, L.; Yan, H.; Zhang, H.; Li, J. Numerical simulation and experimental research of the flow force and forced vibration in the nozzle-flapper valve. Mech. Syst. Signal Proc. 2018, 99, 550–566. [Google Scholar] [CrossRef]
- Jin, Z.; Qiu, C.; Jiang, C.; Wu, J.; Qian, J. Effect of valve core shapes on cavitation flow through a sleeve regulating valve. J. Zhejiang Univ. Sci. A 2020, 21, 1–14. [Google Scholar] [CrossRef]
- Jin, Z.; Gao, Z.; Qian, J.; Wu, Z.; Sunden, B. A parametric study of hydrodynamic cavitation inside globe valves. ASME J. Fluids Eng. 2018, 140, 031208. [Google Scholar] [CrossRef]
- Li, J.Y.; Gao, Z.X.; Wu, H.; Jin, Z.J. Numerical Investigation of methodologies for cavitation suppression inside globe valves. Appl. Sci. 2020, 10, 5541. [Google Scholar] [CrossRef]
- Li, W.; Gao, Z.; Jin, Z.; Qian, J. Transient study of flow and cavitation inside a bileaflet mechanical heart valve. Appl. Sci. 2020, 10, 2548. [Google Scholar] [CrossRef] [Green Version]
- Qian, J.Y.; Gao, Z.X.; Li, W.Q.; Jin, Z.J. Cavitation suppression of bileaflet mechanical heart valves. Cardiovasc. Eng. Technol. 2020, 11, 1–12. [Google Scholar] [CrossRef]
- Sreekala, S.; Thirumalini, S. Investigation on aerodynamic noise evaluation and attenuation in a globe valve using CFD analysis. Int. J. Multiphys. 2016, 10, 43–52. [Google Scholar]
- Qian, J.; Chen, M.; Jin, Z.; Chen, L.; Sundén, B. A numerical study of heat transfer effects and aerodynamic noise reduction in superheated steam flow passing a temperature and pressure regulation valve. Numer. Heat Transf. Part A 2020, 77, 873–889. [Google Scholar] [CrossRef]
- Qian, J.; Chen, M.; Gao, Z.; Jin, Z. Mach number and energy loss analysis inside multi-stage Tesla valves for hydrogen decompression. Energy 2019, 179, 647–654. [Google Scholar] [CrossRef]
- Qian, J.Y.; Wu, J.Y.; Gao, Z.X.; Jin, Z.J. Pilot pipe and damping orifice arrangements analysis of a pilot-control globe valve. ASME J. Fluids Eng. 2020, 142, 101210. [Google Scholar] [CrossRef]
- Qian, J.Y.; Hou, C.W.; Mu, J.; Gao, Z.X.; Jin, Z.J. Valve core shapes analysis on flux through control valves in nuclear power plants. Nucl. Eng. Technol. 2020, 52, 2173–2182. [Google Scholar] [CrossRef]
- Qian, J.Y.; Wu, J.Y.; Gao, Z.X.; Jin, Z.J. Effects of throttling window on flow rate through feed-water valves. ISA Trans. 2020, 104, 393–405. [Google Scholar] [CrossRef]
- Nguyen, Q.K.; Jung, K.H.; Lee, G.N.; Suh, S.B.; To, P. Experimental study on pressure distribution and flow coefficient of globe valve. Processes 2020, 8, 875. [Google Scholar] [CrossRef]
- Singh, D.; Charlton, M.; Asim, T.; Mishra, R.; Townsend, A.; Blunt, L. Quantification of additive manufacturing induced variations in the global and local performance characteristics of a complex multi-stage control valve trim. J. Pet. Sci. Eng. 2020, 190, 107053. [Google Scholar] [CrossRef]
- Iravani, M.; Toghraie, D. Design a high-pressure test system to investigate the performance characteristics of ball valves in a compressible choked flow. Measurement 2020, 151, 107200. [Google Scholar] [CrossRef]
- Asim, T.; Mishra, R.; Oliveira, A.; Charlton, M. Effects of the geometrical features of flow paths on the flow capacity of a control valve trim. J. Pet. Sci. Eng. 2019, 172, 124–138. [Google Scholar] [CrossRef] [Green Version]
- Chern, M.J.; Wang, C.H.; Lu, G.T.; Tseng, P.Y.; Cheng, Y.J.; Lin, C.A.; Hu, C.M. Design of cages in globe valve. Proc. Inst. Mech. Eng. Part C J. Eng. Mech. Eng. Sci. 2015, 229, 476–484. [Google Scholar] [CrossRef]
- Zhang, J.; Yang, M.; Xu, B. Design and experimental research of a miniature digital hydraulic valve. Micromachines 2018, 9, 283. [Google Scholar] [CrossRef] [Green Version]
- Qian, J.; Hou, C.; Li, X.; Jin, Z. Actuation mechanism of microvalves: A review. Micromachines 2020, 11, 172. [Google Scholar] [CrossRef] [Green Version]
- Qian, J.Y.; Li, X.J.; Wu, Z.; Jin, Z.J.; Sunden, B. A comprehensive review on liquid–liquid two-phase flow in microchannel: Flow pattern and mass transfer. Microfluid. Nanofluid. 2019, 23, 116. [Google Scholar] [CrossRef]
- Gao, Z.X.; Liu, P.; Yue, Y.; Li, J.Y.; Wu, H. Comparison of swing and tilting check valves flowing compressible fluids. Micromachines 2020, 11, 758. [Google Scholar] [CrossRef] [PubMed]
- Lisowski, E.; Filo, G.; Rajda, J. Analysis of flow forces in the initial phase of throttle gap opening in a proportional control valve. Flow Meas. Instrum. 2018, 59, 157–167. [Google Scholar] [CrossRef]
- Qiu, T.; Dai, H.; Lei, Y.; Liu, Y. Effects of valve needle speed on flow characteristics in control valve for unit pump fuel system. Adv. Mech. Eng. 2018, 10, 1687814018770791. [Google Scholar] [CrossRef] [Green Version]
- Chern, M.J.; Wang, C.C. Control of volumetric flow-rate of ball valve using V-port. ASME J. Fluids Eng. 2004, 126, 471–481. [Google Scholar] [CrossRef]
- Zhang, H.N.; Wang, G.F.; Zhao, Q.N. Design optimization of V-sector ball valve core. IOP Conf. Ser. Earth Environ. Sci. 2019, 267, 032076. [Google Scholar] [CrossRef]
- Tao, J.; Lin, Z.; Ma, C.; Ye, J.; Zhu, Z.; Li, Y.; Mao, W. An experimental and numerical study of regulating performance and flow loss in a V-port ball valve. ASME J. Fluids Eng. 2020, 142, 021207. [Google Scholar] [CrossRef]
- Industrial-Process Control Valves-Part 2-1: Flow Capacity-Sizing Equations for Fluid Flow under Installed Conditions; IEC 60534-2-1; IEC: Geneva, Switzerland, 2011.


| Grid Set | Grid Number × 105 | Flow Rate/m3h−1 | Difference/% |
|---|---|---|---|
| #1 | 5.59 | 0.378 | 7.1 |
| #2 | 9.16 | 0.353 | - |
| #3 | 21.22 | 0.363 | 2.8 |
Publisher’s Note: MDPI stays neutral with regard to jurisdictional claims in published maps and institutional affiliations. |
© 2021 by the authors. Licensee MDPI, Basel, Switzerland. This article is an open access article distributed under the terms and conditions of the Creative Commons Attribution (CC BY) license (http://creativecommons.org/licenses/by/4.0/).
Share and Cite
Gao, Z.-x.; Yue, Y.; Yang, J.-m.; Li, J.-y.; Wu, H.; Jin, Z.-j. Numerical Study of the Microflow Characteristics in a V-ball Valve. Micromachines 2021, 12, 155. https://doi.org/10.3390/mi12020155
Gao Z-x, Yue Y, Yang J-m, Li J-y, Wu H, Jin Z-j. Numerical Study of the Microflow Characteristics in a V-ball Valve. Micromachines. 2021; 12(2):155. https://doi.org/10.3390/mi12020155
Chicago/Turabian StyleGao, Zhi-xin, Yang Yue, Jia-ming Yang, Jun-ye Li, Hui Wu, and Zhi-jiang Jin. 2021. "Numerical Study of the Microflow Characteristics in a V-ball Valve" Micromachines 12, no. 2: 155. https://doi.org/10.3390/mi12020155