
Dual-Function Metasurface for Tunable Selective Absorption
Abstract
:1. Introduction
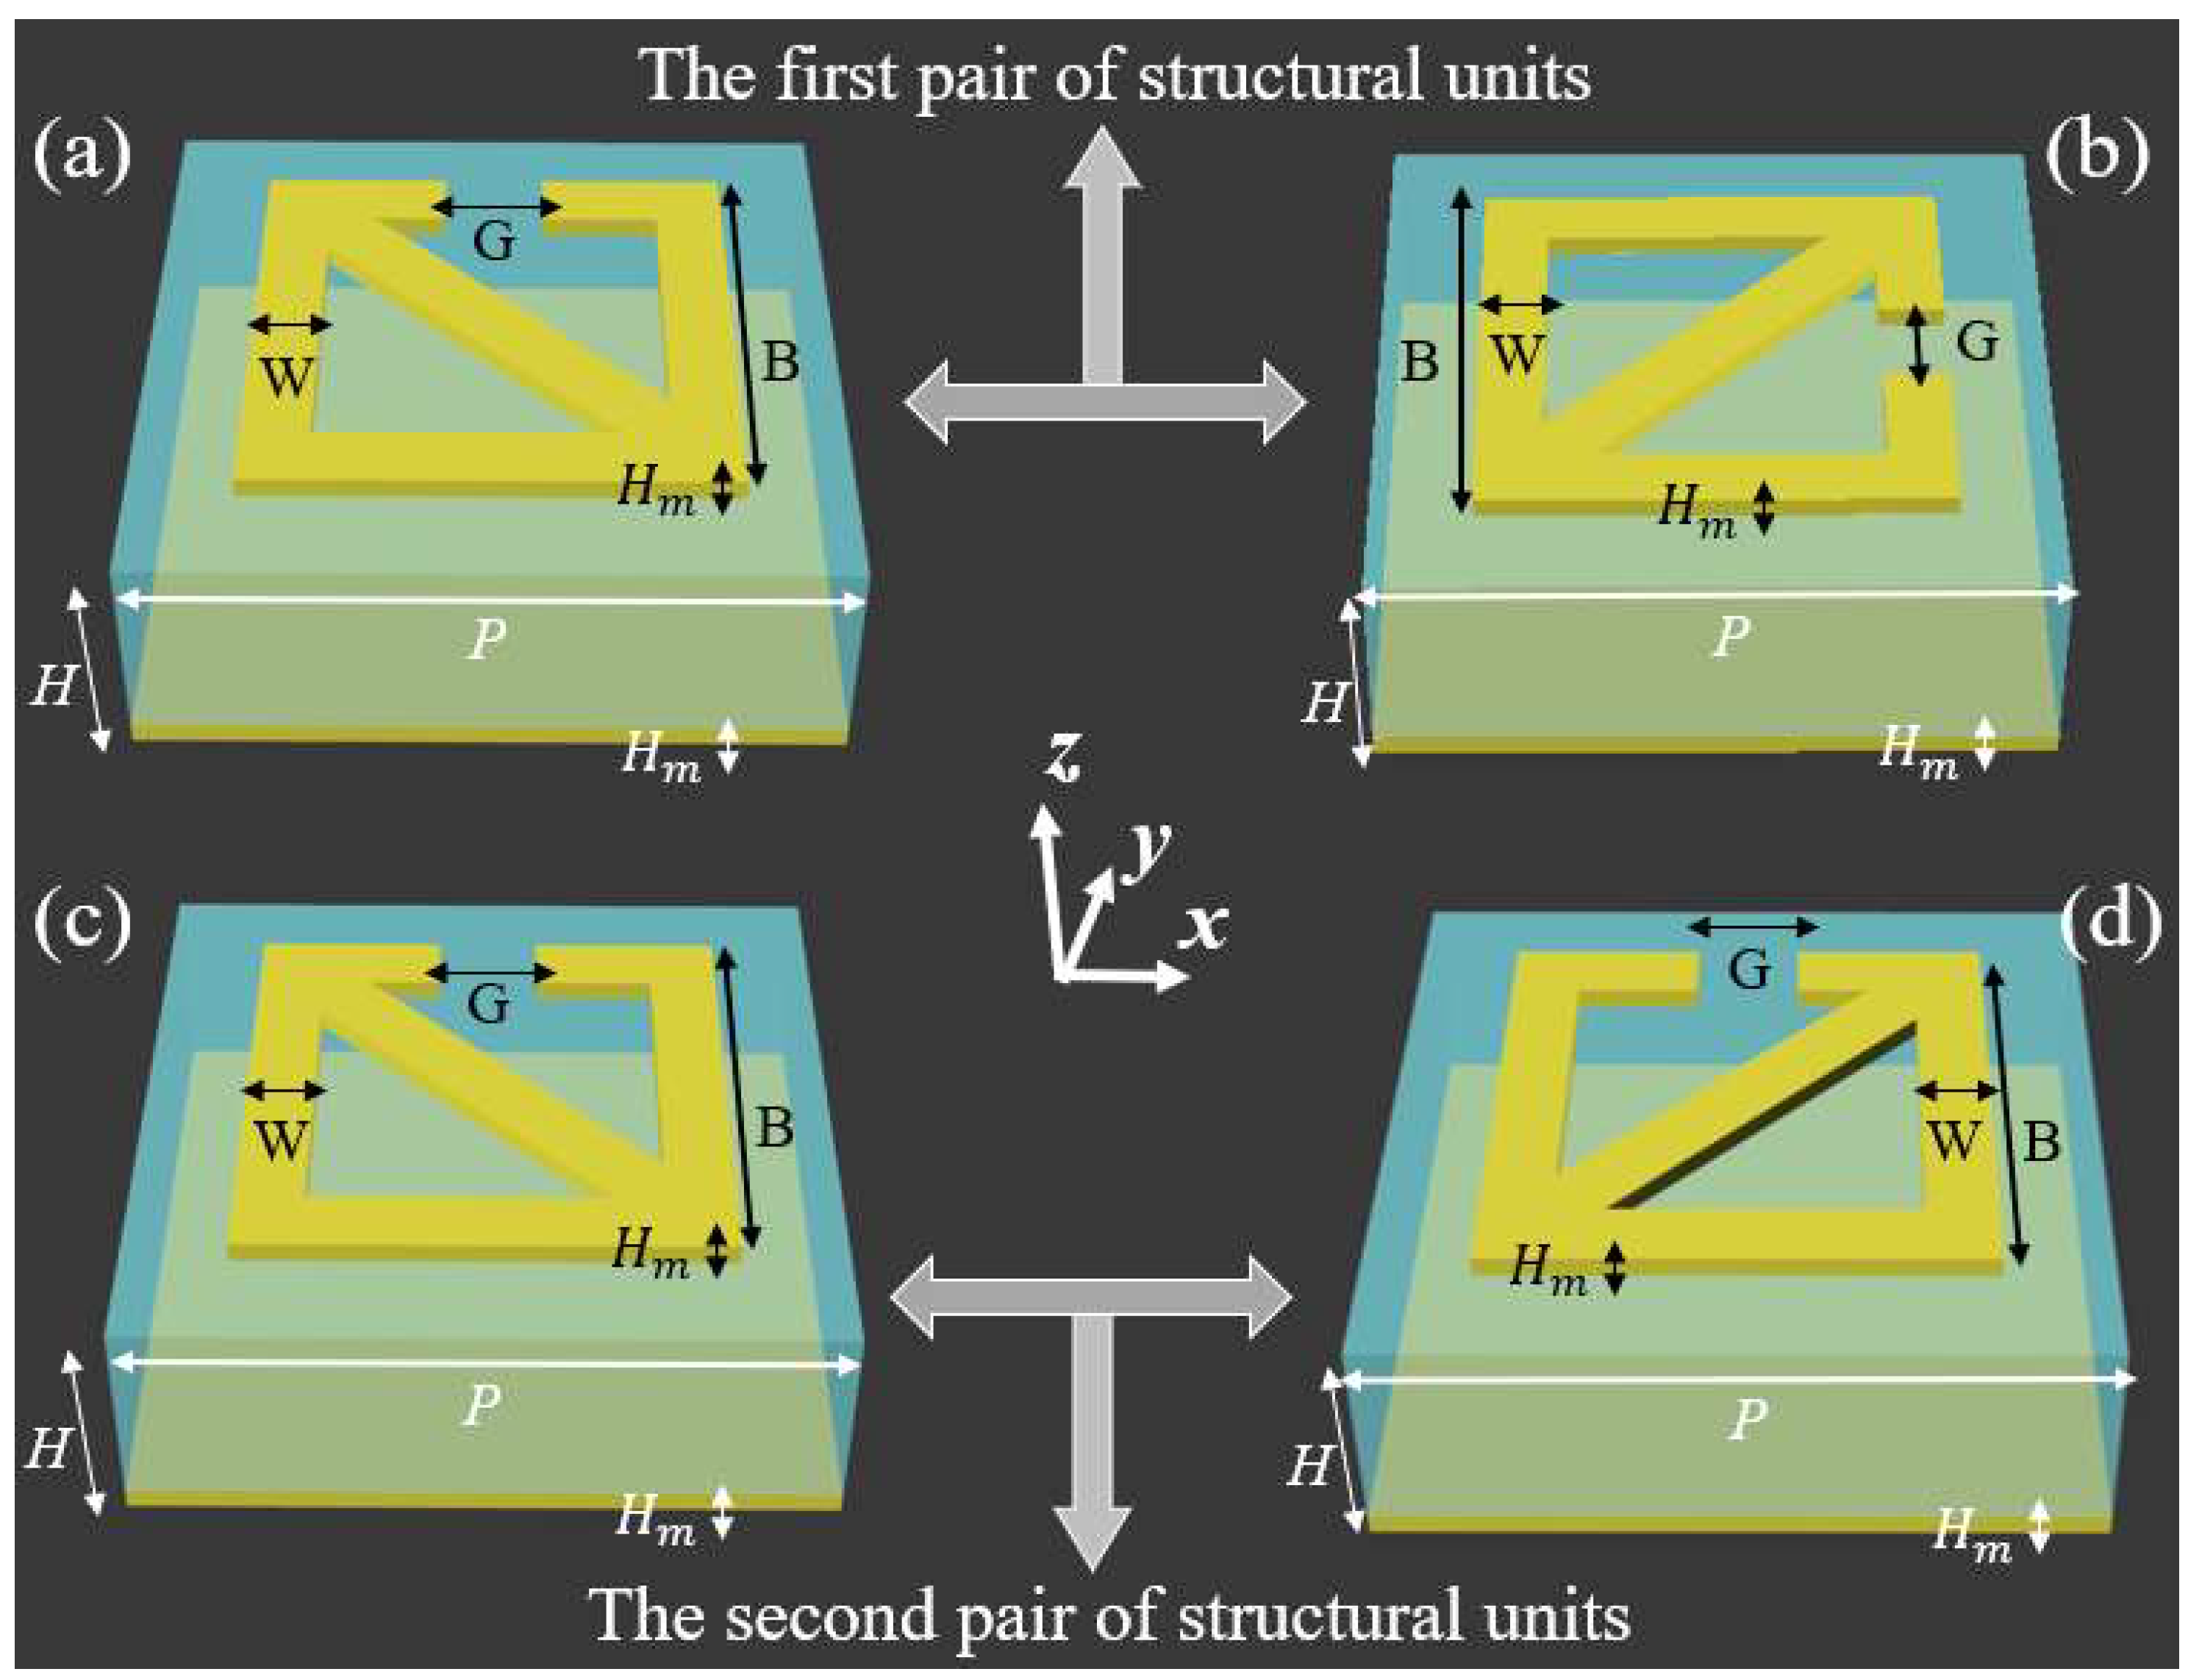
2. Design and Methods
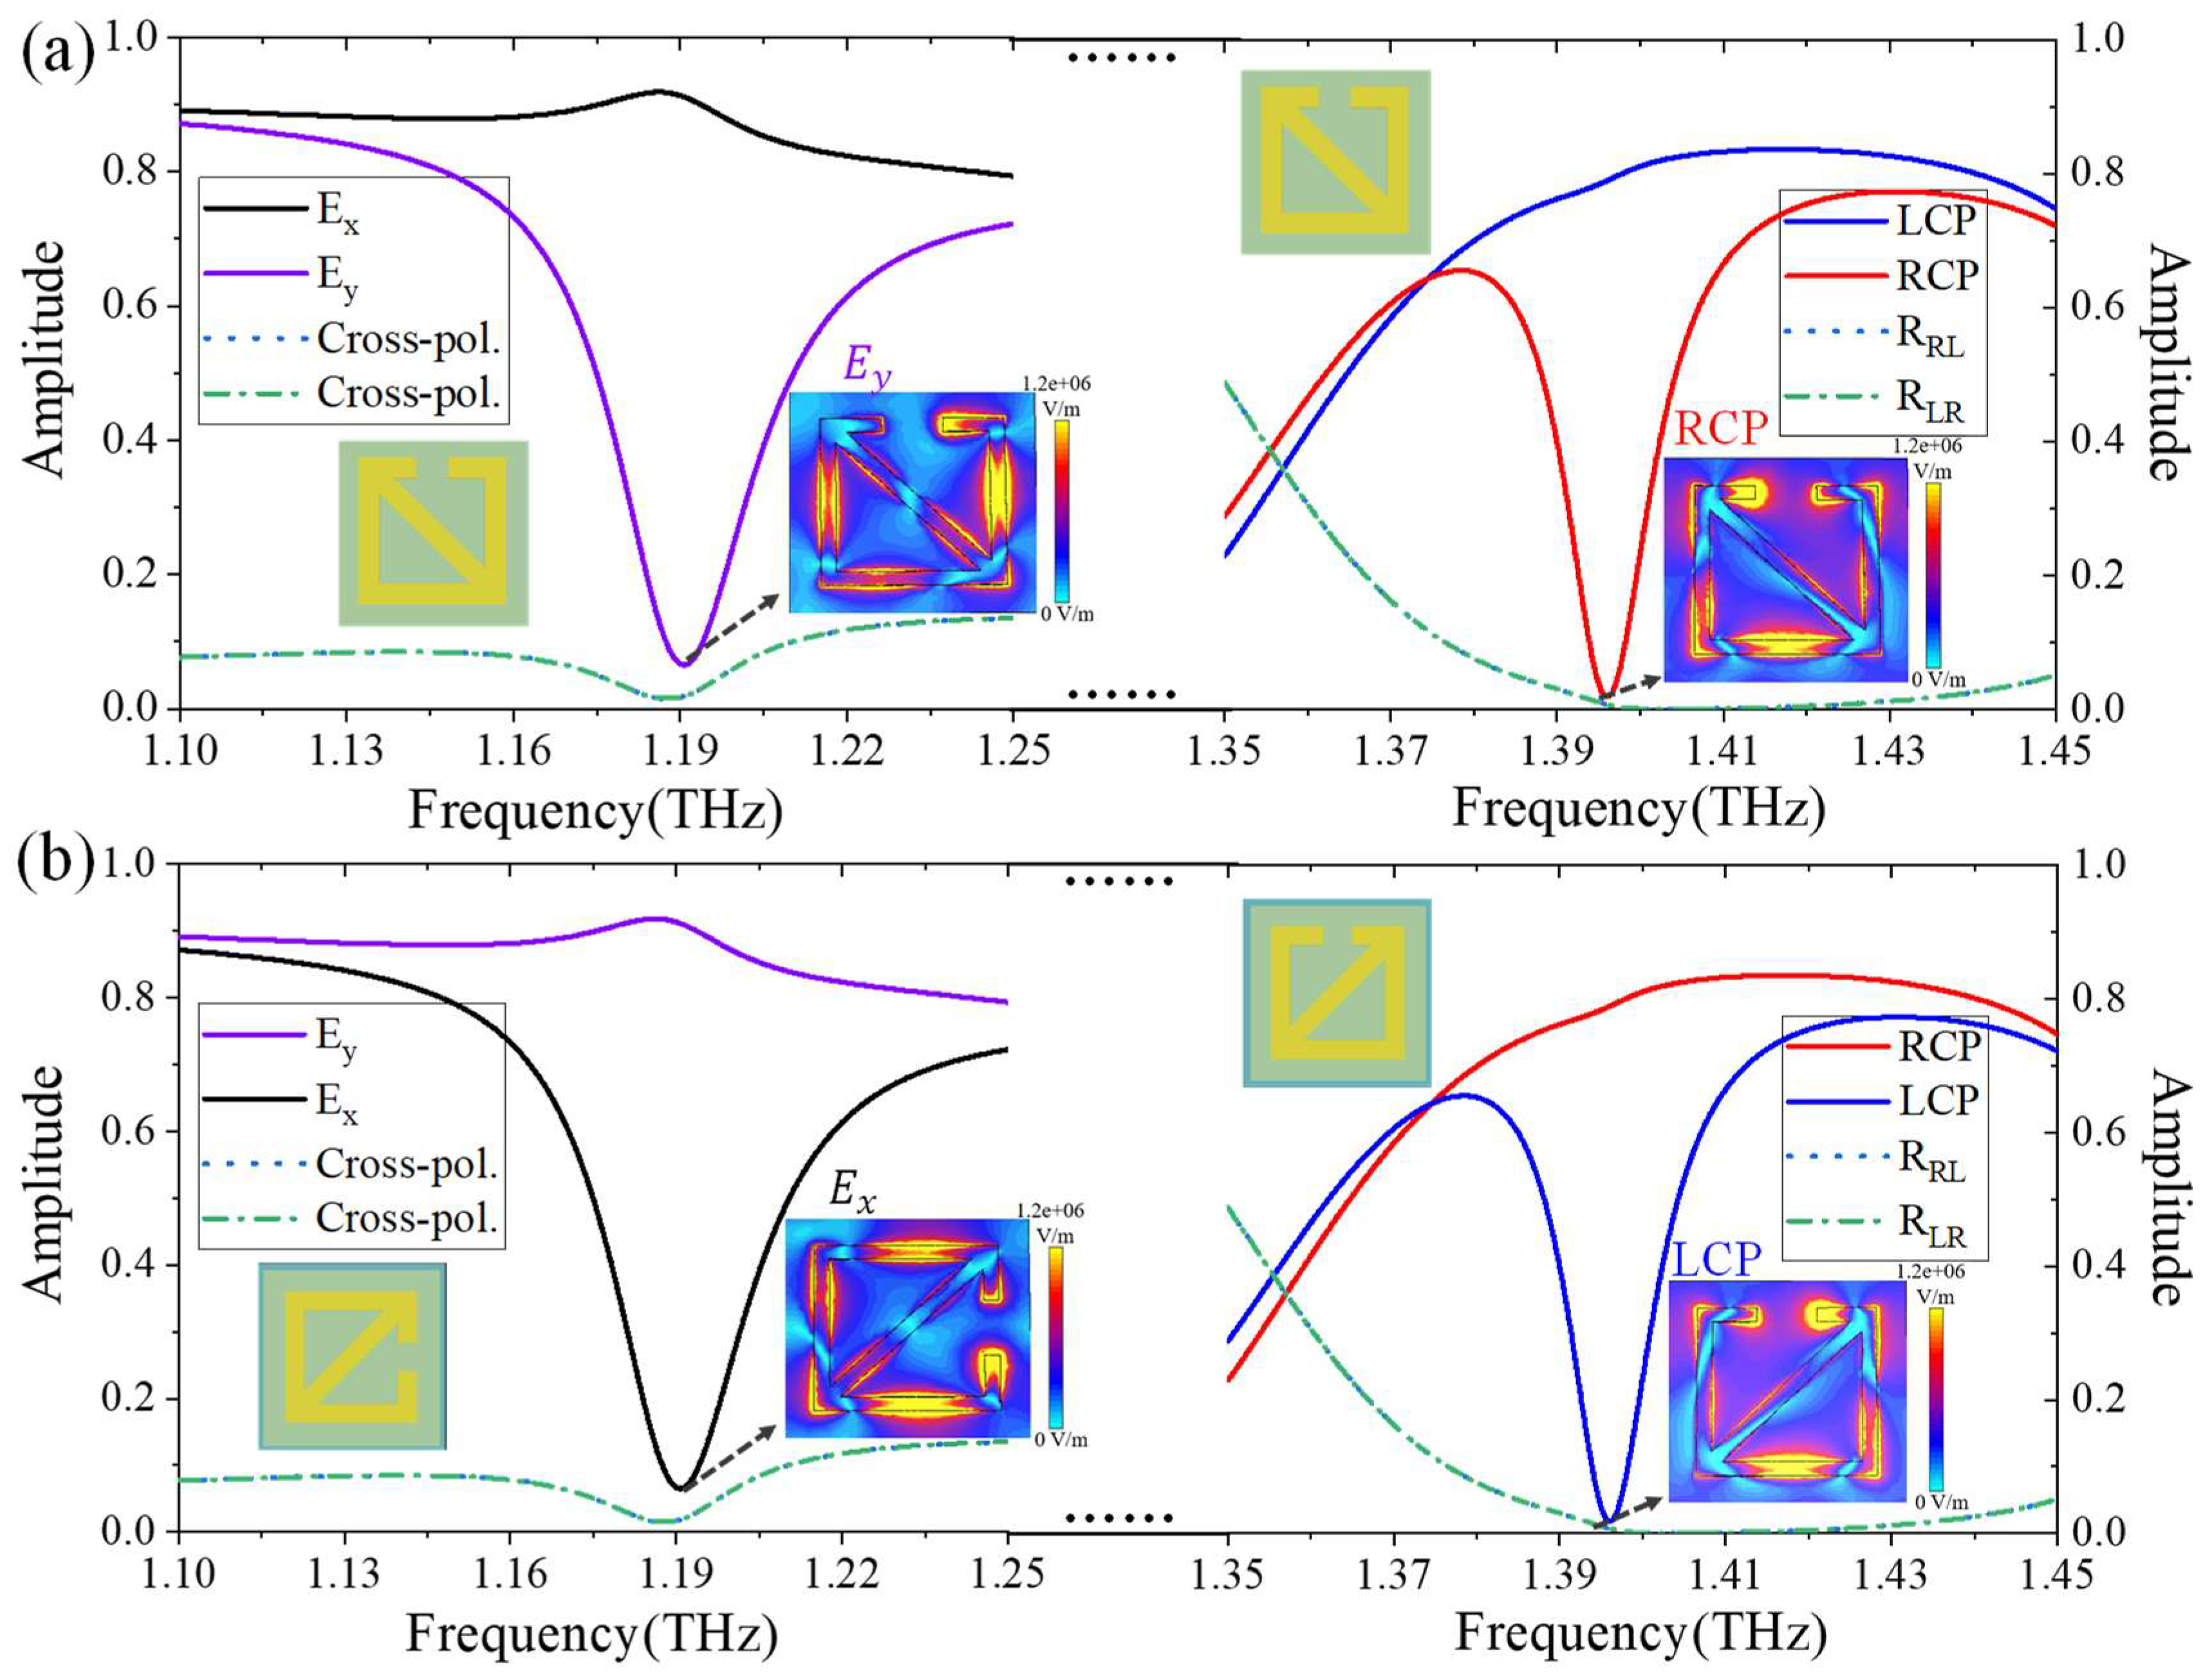
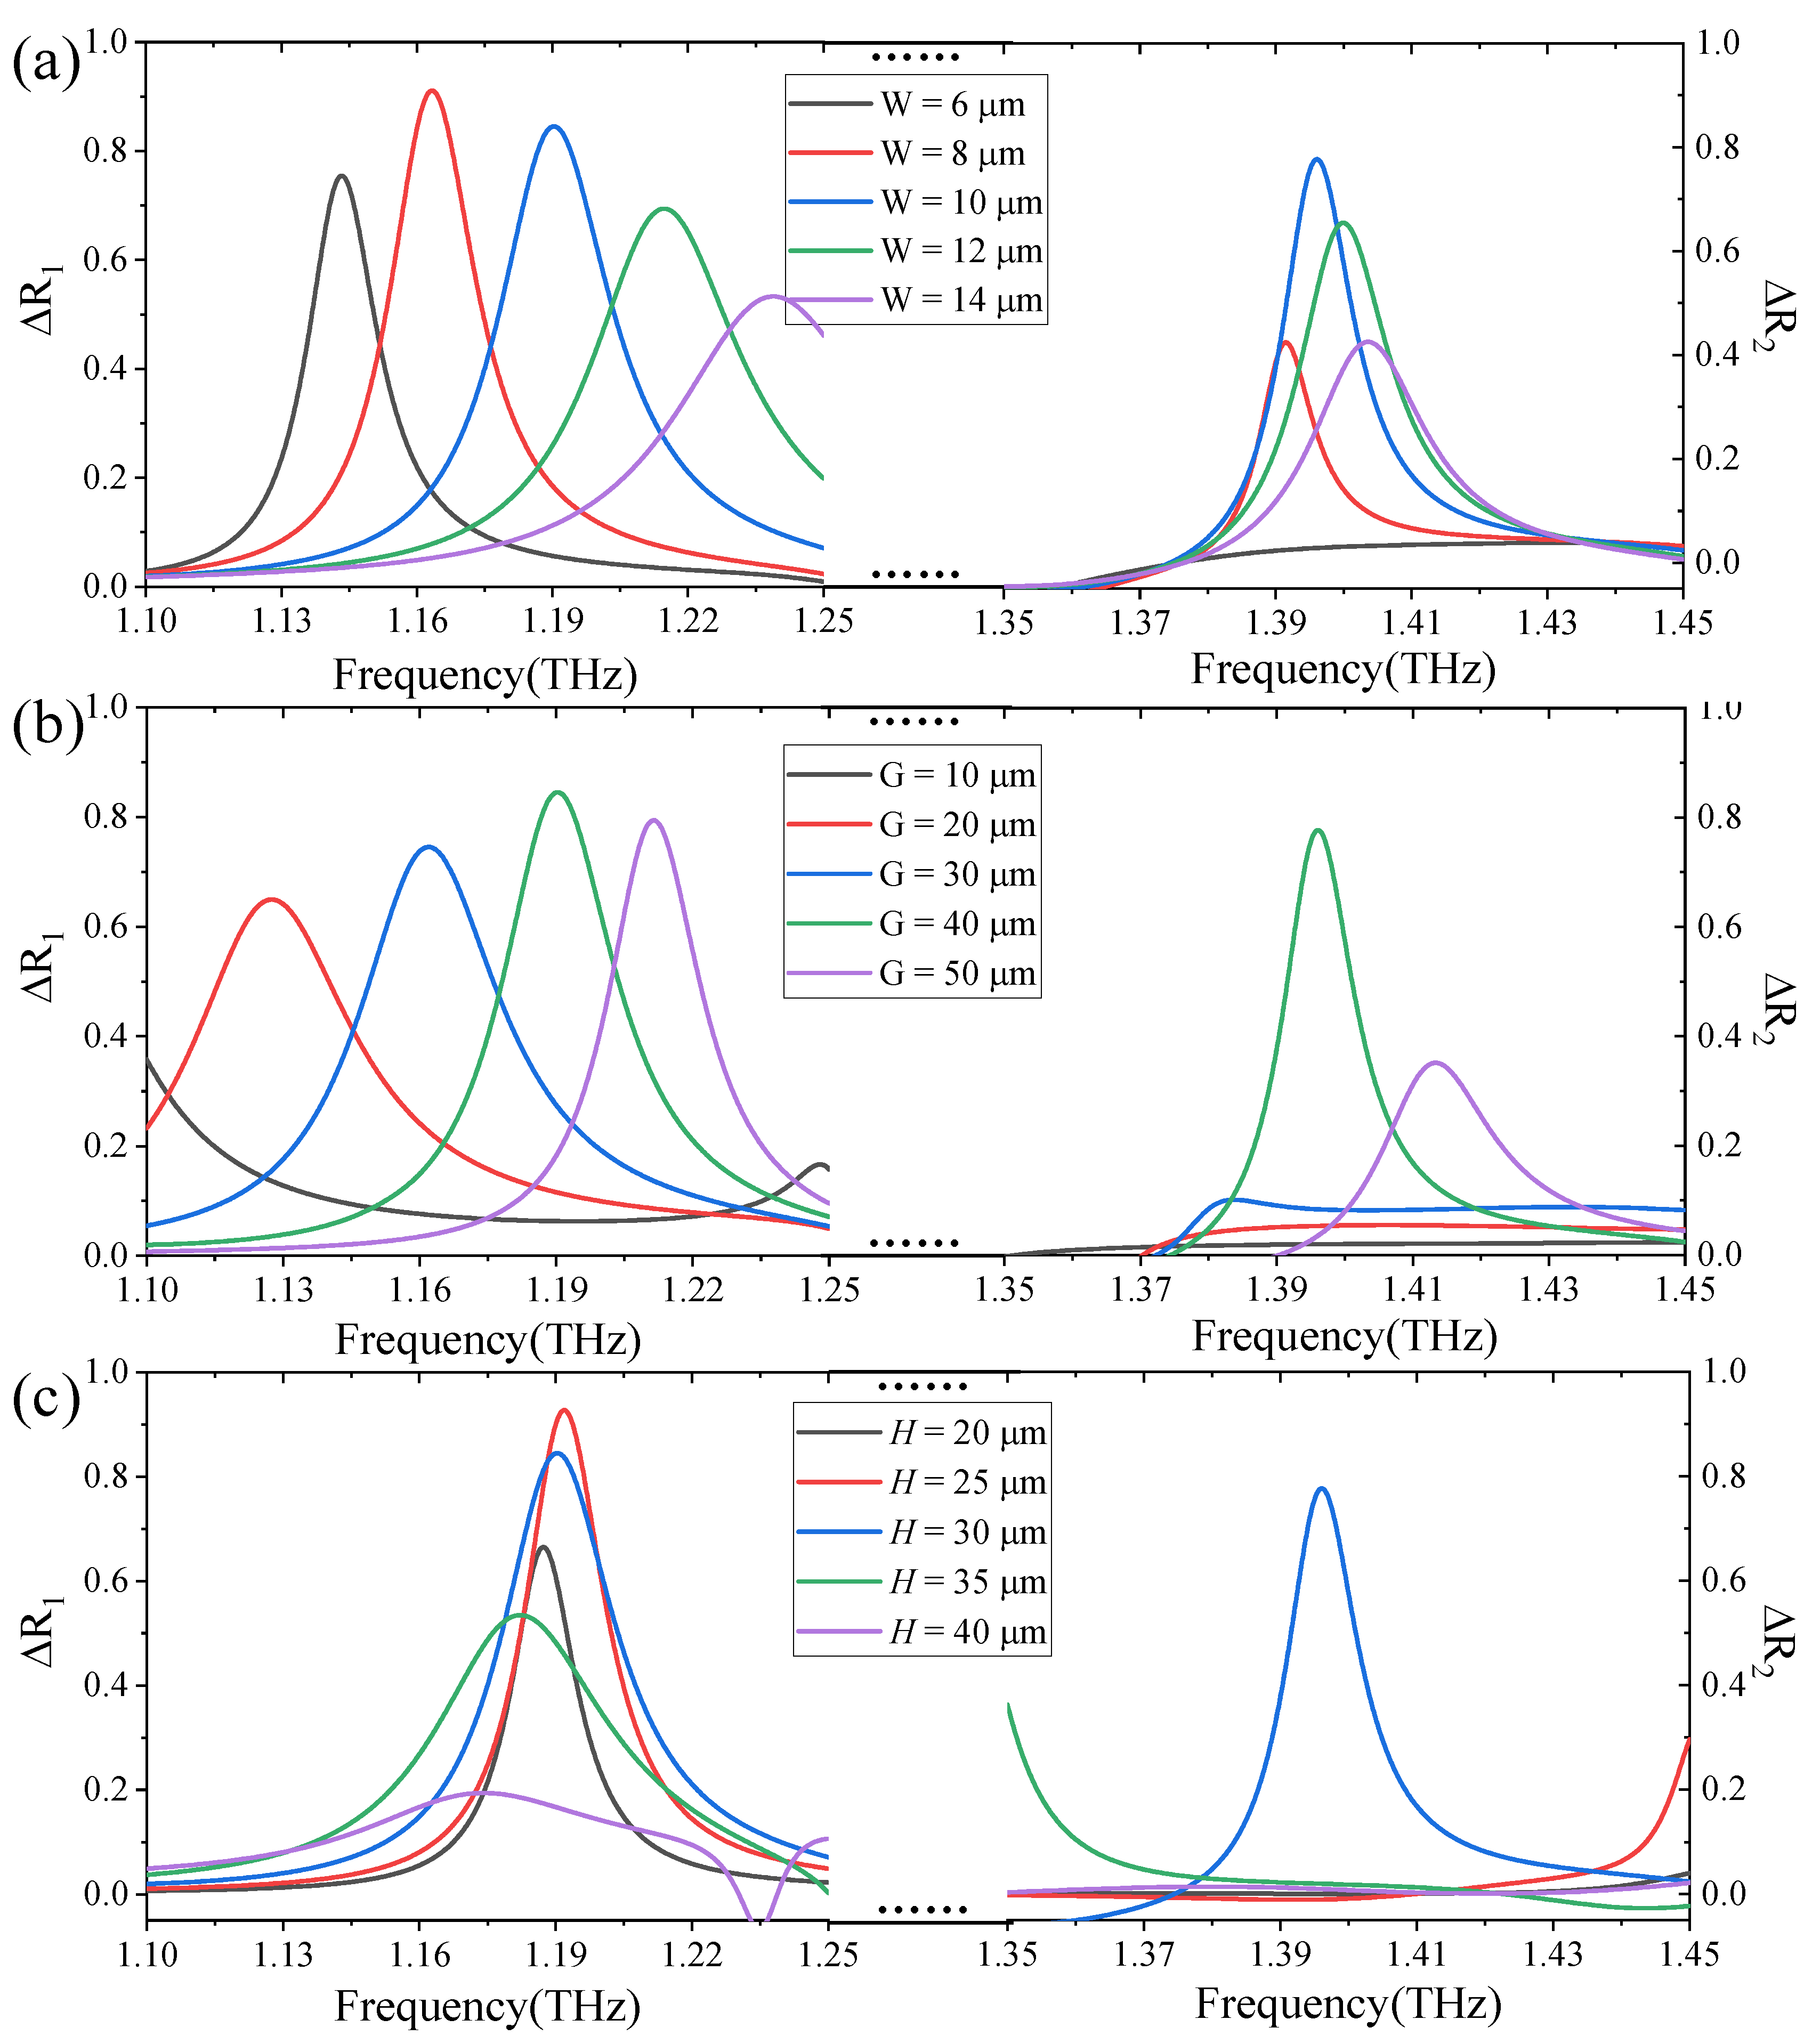
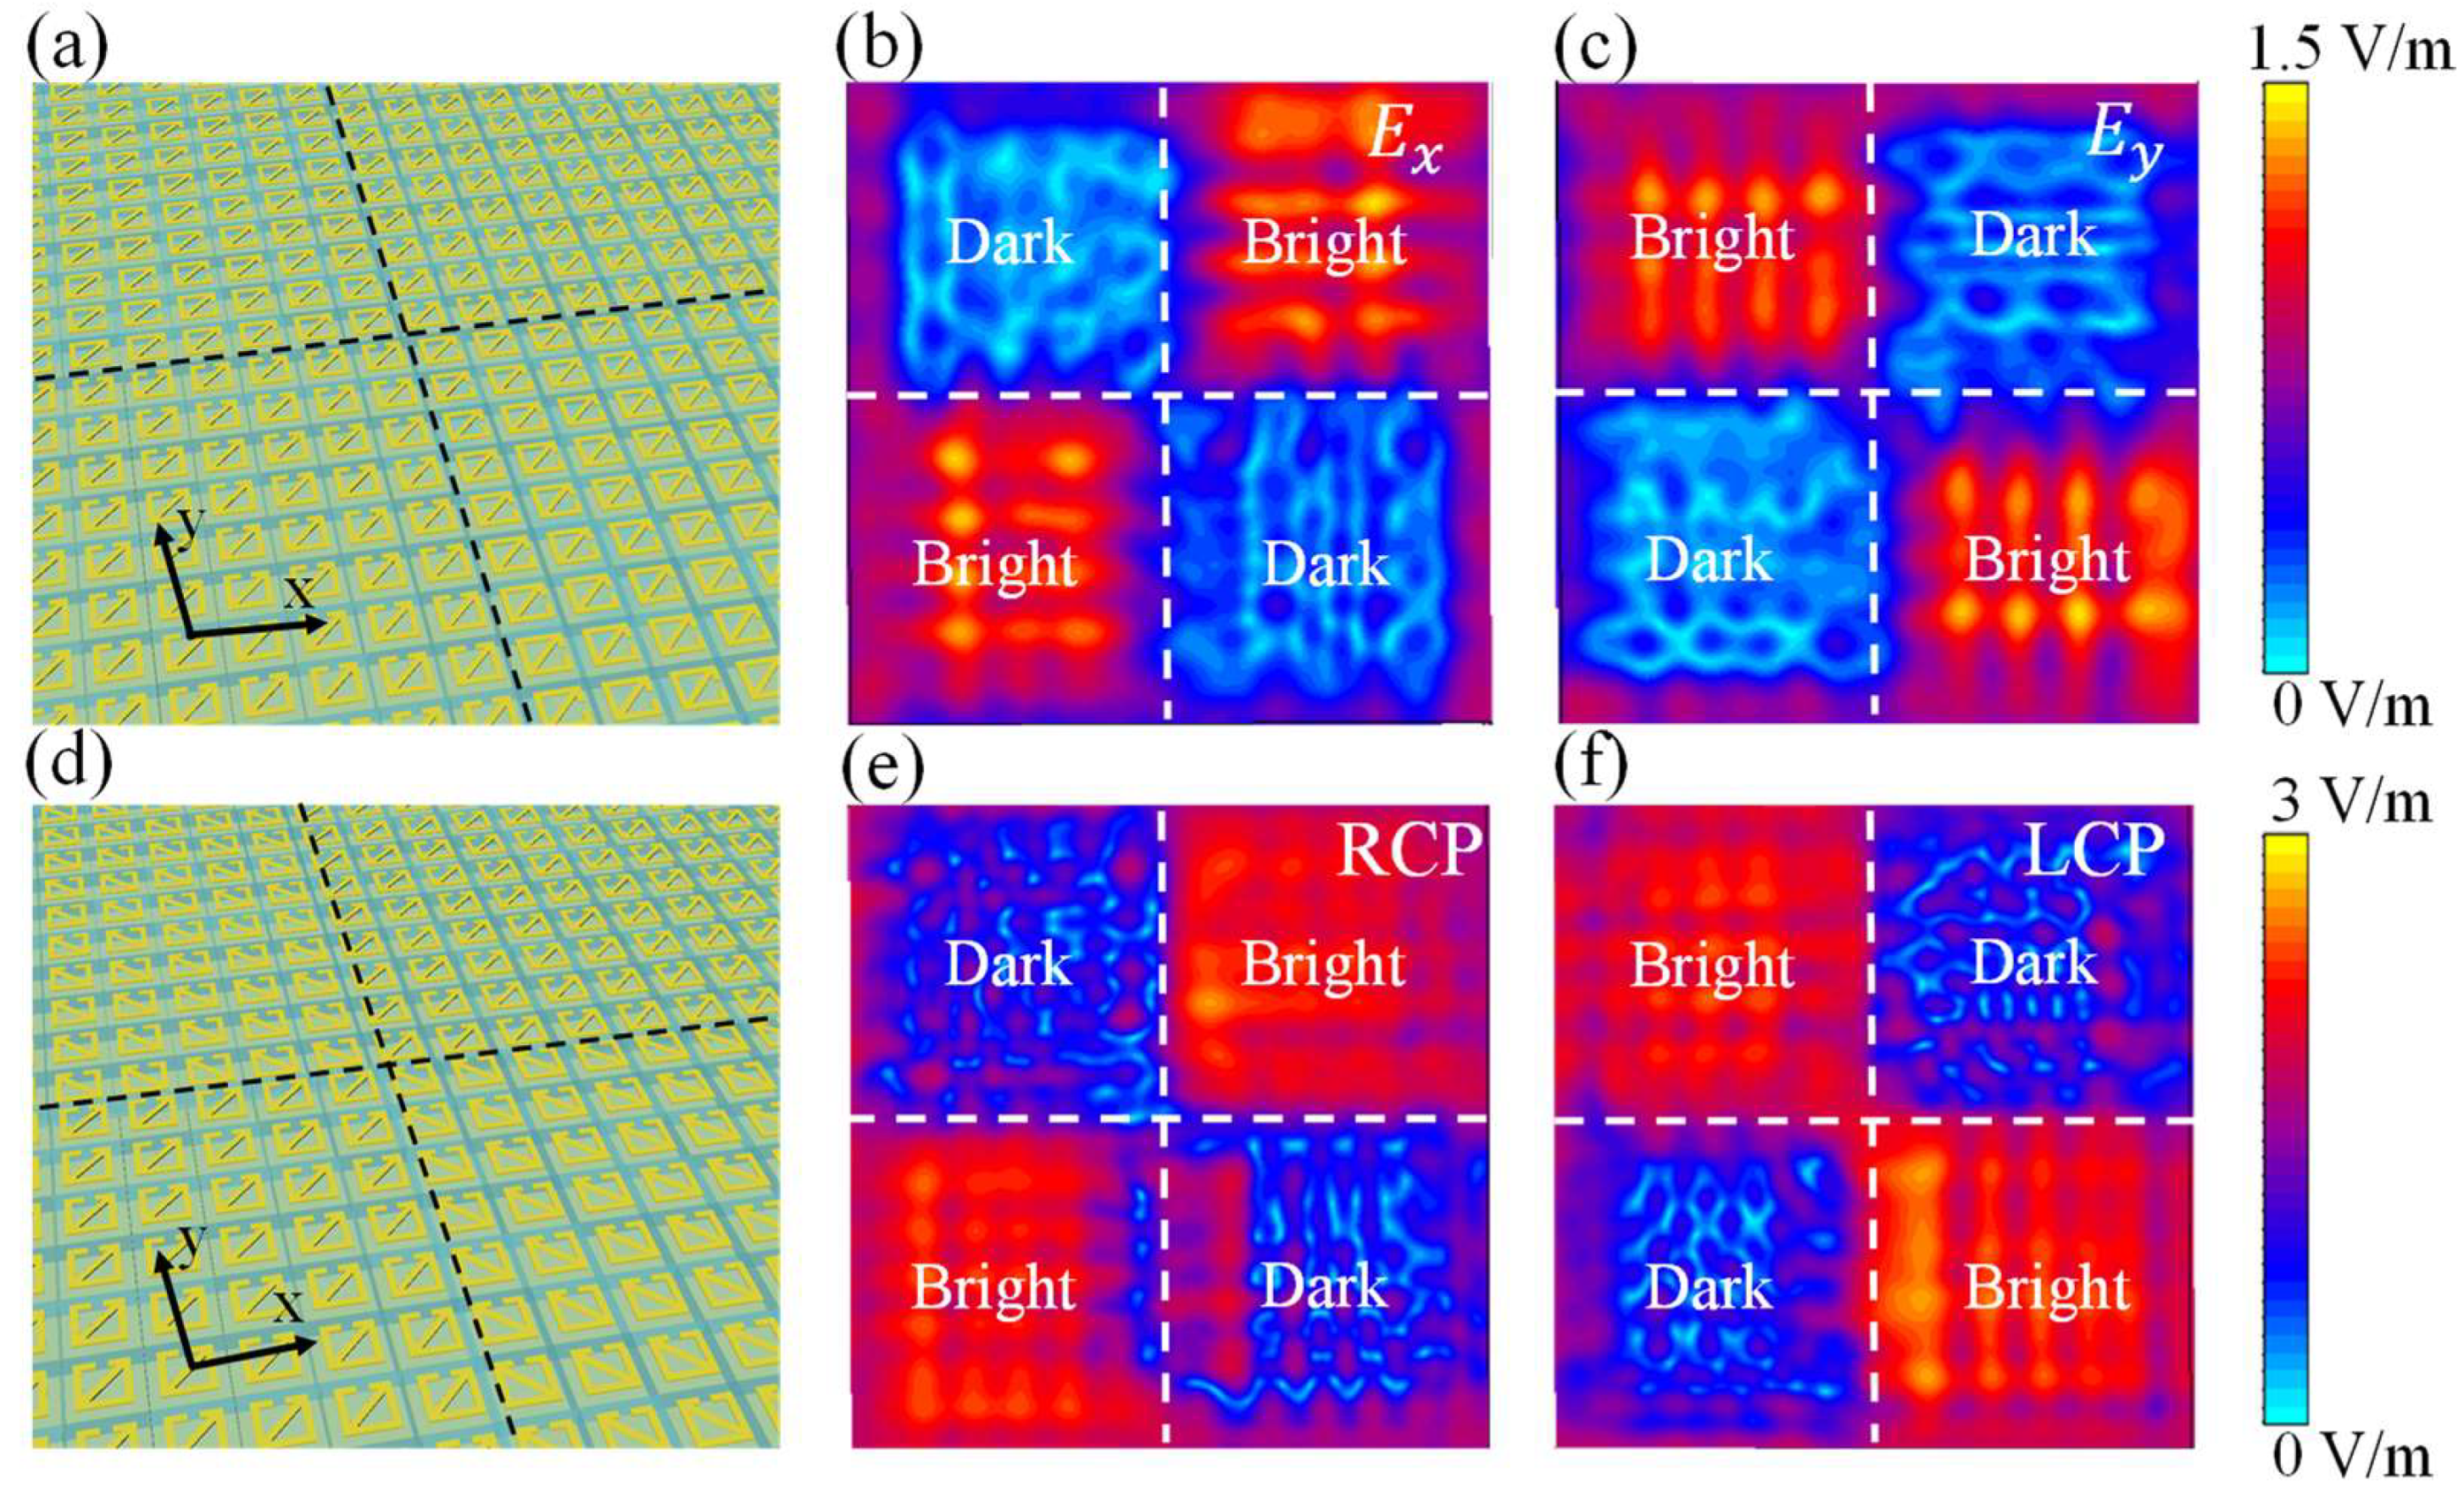
3. Results and Discussions
4. Conclusions
Author Contributions
Funding
Conflicts of Interest
References
- Shelby, R.A.; Smith, D.R.; Schultz, S. Experimental verification of a negative index of refraction. Science 2001, 292, 77–79. [Google Scholar] [CrossRef] [PubMed] [Green Version]
- Ramakrishna, S.A. Physics of negative refractive index materials. Rep. Prog. Phys. 2005, 68, 449–521. [Google Scholar] [CrossRef]
- Smith, D.R.; Pendry, J.B.; Wiltshire, M.C.K. Metamaterials and negative refractive index. Science 2004, 305, 788–792. [Google Scholar] [CrossRef] [PubMed] [Green Version]
- Cong, L.; Tan, S.; Yahiaoui, R.; Yan, F.; Zhang, W.; Singh, R. Experimental demonstration of ultrasensitive sensing with terahertz metamaterial absorbers: A comparison with the metasurfaces. Appl. Phys. Lett. 2015, 106, 031107. [Google Scholar] [CrossRef]
- Zhang, M.; Song, Z. Terahertz bifunctional absorber based on a graphene-spacer-vanadium dioxide-spacer-metal configuration. Opt. Express 2020, 28, 11780. [Google Scholar] [CrossRef] [PubMed]
- Arik, K.; AbdollahRamezani, S.; Khavasi, A. Polarization insensitive and broadband terahertz absorber using graphene disks. Plasmonics 2017, 12, 393–398. [Google Scholar] [CrossRef]
- Schade, U.; Holldack, K.; Kuske, P.; Wüstefeld, G.; Hübers, H.-W. THz near-field imaging employing synchrotron radiation. Appl. Phys. Lett. 2004, 84, 1422–1424. [Google Scholar] [CrossRef]
- Seo, M.A.; Adam, A.J.L.; Kang, J.H.; Lee, J.W.; Jeoung, S.C.; Park, Q.H.; Planken, P.C.M.; Kim, D.S. Fourier-transform terahertz near-field imaging of one-dimensional slit arrays: Mapping of electric-field-, magnetic-field-, and Poynting vectors. Opt. Express 2007, 15, 11781–11789. [Google Scholar] [CrossRef] [PubMed] [Green Version]
- Bitzer, A.; Merbold, H.; Thoman, A.; Feurer, T.; Helm, H.; Walther, M. Terahertz near-field imaging of electric and magnetic resonances of a planar metamateria. Opt. Express 2009, 17, 3826–3834. [Google Scholar] [CrossRef]
- Jansen, C.; Wietzke, S.; Peters, O.; Scheller, M.; Vieweg, N.; Salhi, M.; Krumbholz, N.; Jördens, C.; Hochrein, T.; Koch, M. Terahertz imaging: Applications and perspectives. Appl. Opt. 2010, 49, 48–57. [Google Scholar] [CrossRef] [PubMed]
- Oh, S.J.; Kang, J.; Maeng, I.; Suh, J.-S.; Huh, Y.-M.; Haam, S.; Son, J.-H. Nanoparticle-enabled terahertz imaging for cancer diagnosis. Opt. Express 2009, 17, 3469–3475. [Google Scholar] [CrossRef]
- He, M.X.; Chen, T.; Yang, J.L. The application of terahertz imaging in tumor diagnosis. Tumor 2012, 32, 1039–1042. [Google Scholar]
- Oh, S.J.; Huh, Y.-M.; Suh, J.-S.; Choi, J.; Haam, S.; Son, J.-H. Cancer Diagnosis by Terahertz Molecular Imaging Technique. J. Infrared Millim. Terahertz Waves 2012, 33, 74–81. [Google Scholar] [CrossRef]
- Niijima, S.; Shoyama, M.; Kawase, K. Nondestructive inspection of sinterability of ceramic tiles by terahertz spectroscopy. Electron. Commun. Jpn. 2019, 102, 19–24. [Google Scholar] [CrossRef]
- Lhk, A.; Dhh, B. Robotic-based terahertz imaging for nondestructive testing of a PVC pipe cap. NDT E Int. 2020, 10, 10250. [Google Scholar]
- Gu, S.; Li, C.; Gao, X.; Sun, Z.; Fang, G. Terahertz Aperture Synthesized Imaging with Fan-Beam Scanning for Personnel Screening. IEEE Trans. Microw. Theory Tech. 2012, 60, 3877–3885. [Google Scholar] [CrossRef]
- Sinyukov, A.; Zorych, I.; Michalopoulou, Z.-H.; Gary, D.; Barat, R.; Federici, J.F. Detection of explosives by Terahertz synthetic aperture imaging—Focusing and spectral classification. C. R. Phys. 2008, 9, 248–261. [Google Scholar] [CrossRef]
- Shen, Z.; He, Q. Mutual circular polarization conversions in asymmetric transmission and reflection modes by three-layer metasurface with gold split-rings. Opt. Express 2021, 29, 34850–34862. [Google Scholar] [CrossRef] [PubMed]
- Hadzievski, L.R. Circular Polarization Selective Metamaterial Absorber in Terahertz Frequency Range. IEEE J. Sel. Top. Quantum Electron. 2020, 27, 4700506. [Google Scholar]
- Li, F.; Tang, T.; Mao, Y.; Luo, L.; Li, J.; Xiao, J.; Liu, K.; Shen, J.; Li, C.; Yao, Y. “Metal–Graphene Hybrid Chiral Metamaterials for Tunable Circular Dichroism. Ann. Phys. 2020, 532, 2000065. [Google Scholar] [CrossRef]
- Li, F.; Tang, T.; Mao, Y.; Luo, L.; Li, J.; Xiao, J.; Liu, K.; Shen, J.; Li, C.; Yao, J. Chiral coding metasurfaces with integrated vanadium dioxide for thermo-optic modulation of terahertz waves. J. Alloys Compd. 2020, 826, 154174. [Google Scholar] [CrossRef]
- Grady, N.K.; Heyes, J.E.; Chowdhury, D.R.; Zeng, Y.; Reiten, M.T.; Azad, A.K.; Taylor, A.J.; Dalvit, D.A.R.; Chen, H.-T. “Terahertz metamaterials for linear polarization conversion and anomalous refraction. Science 2013, 340, 1304. [Google Scholar] [CrossRef] [PubMed] [Green Version]
- Li, Z.; Yang, R.; Wang, J.; Zhao, Y.; Tian, J.; Zhang, W. Multifunctional metasurface for broadband absorption, linear and circular polarization conversions. Opt. Mater. Express 2021, 11, 3507. [Google Scholar] [CrossRef]
- Ding, F.; Zhong, S.; Bozhevolnyi, S.I. Vanadium Dioxide Integrated Metasurfaces with Switchable Functionalities at Terahertz Frequencies. Adv. Opt. Mater. 2018, 10, 1701204. [Google Scholar] [CrossRef]
- Galarreta, C.R.D.; Alexeev, A.M.; Au, Y.Y. Nonvolatile reconfigurable phasechange metadevices for beam steering in the near infrared. Adv. Funct. Mater. 2018, 28, 1704993. [Google Scholar] [CrossRef] [Green Version]
- Lv, T.T.; Li, Y.X.; Ma, H.F. Hybrid metamaterial switching for manipulating chirality based on VO2 phase transition. Sci. Rep. 2016, 6, 23186. [Google Scholar] [CrossRef]

| Linear Polarization/Circularly Polarization | ΔR1max = (Ex − Ey)max × 100% | ΔR2max = (LCP − RCP)max × 100% | Frequency (THz) | Tunable | Ref. |
|---|---|---|---|---|---|
| Circularly polarization | Nearly 94% | 5.6 | NO | [19] | |
| Circularly polarization | Nearly 65% | 1.02 | YES | [20] | |
| Circularly polarization | Nearly 80% | 0.486 | YES | [21] | |
| Linear polarization | Nearly 10% | 1.1 | NO | [22] | |
| Linear polarization & Circularly polarization | Nearly 45% | Nearly 50% | 2.0 | NO | [23] |
| Linear polarization & Circularly polarization | Nearly 80% | Nearly 55% | 1.19 & 1.395 | YES | Our work |
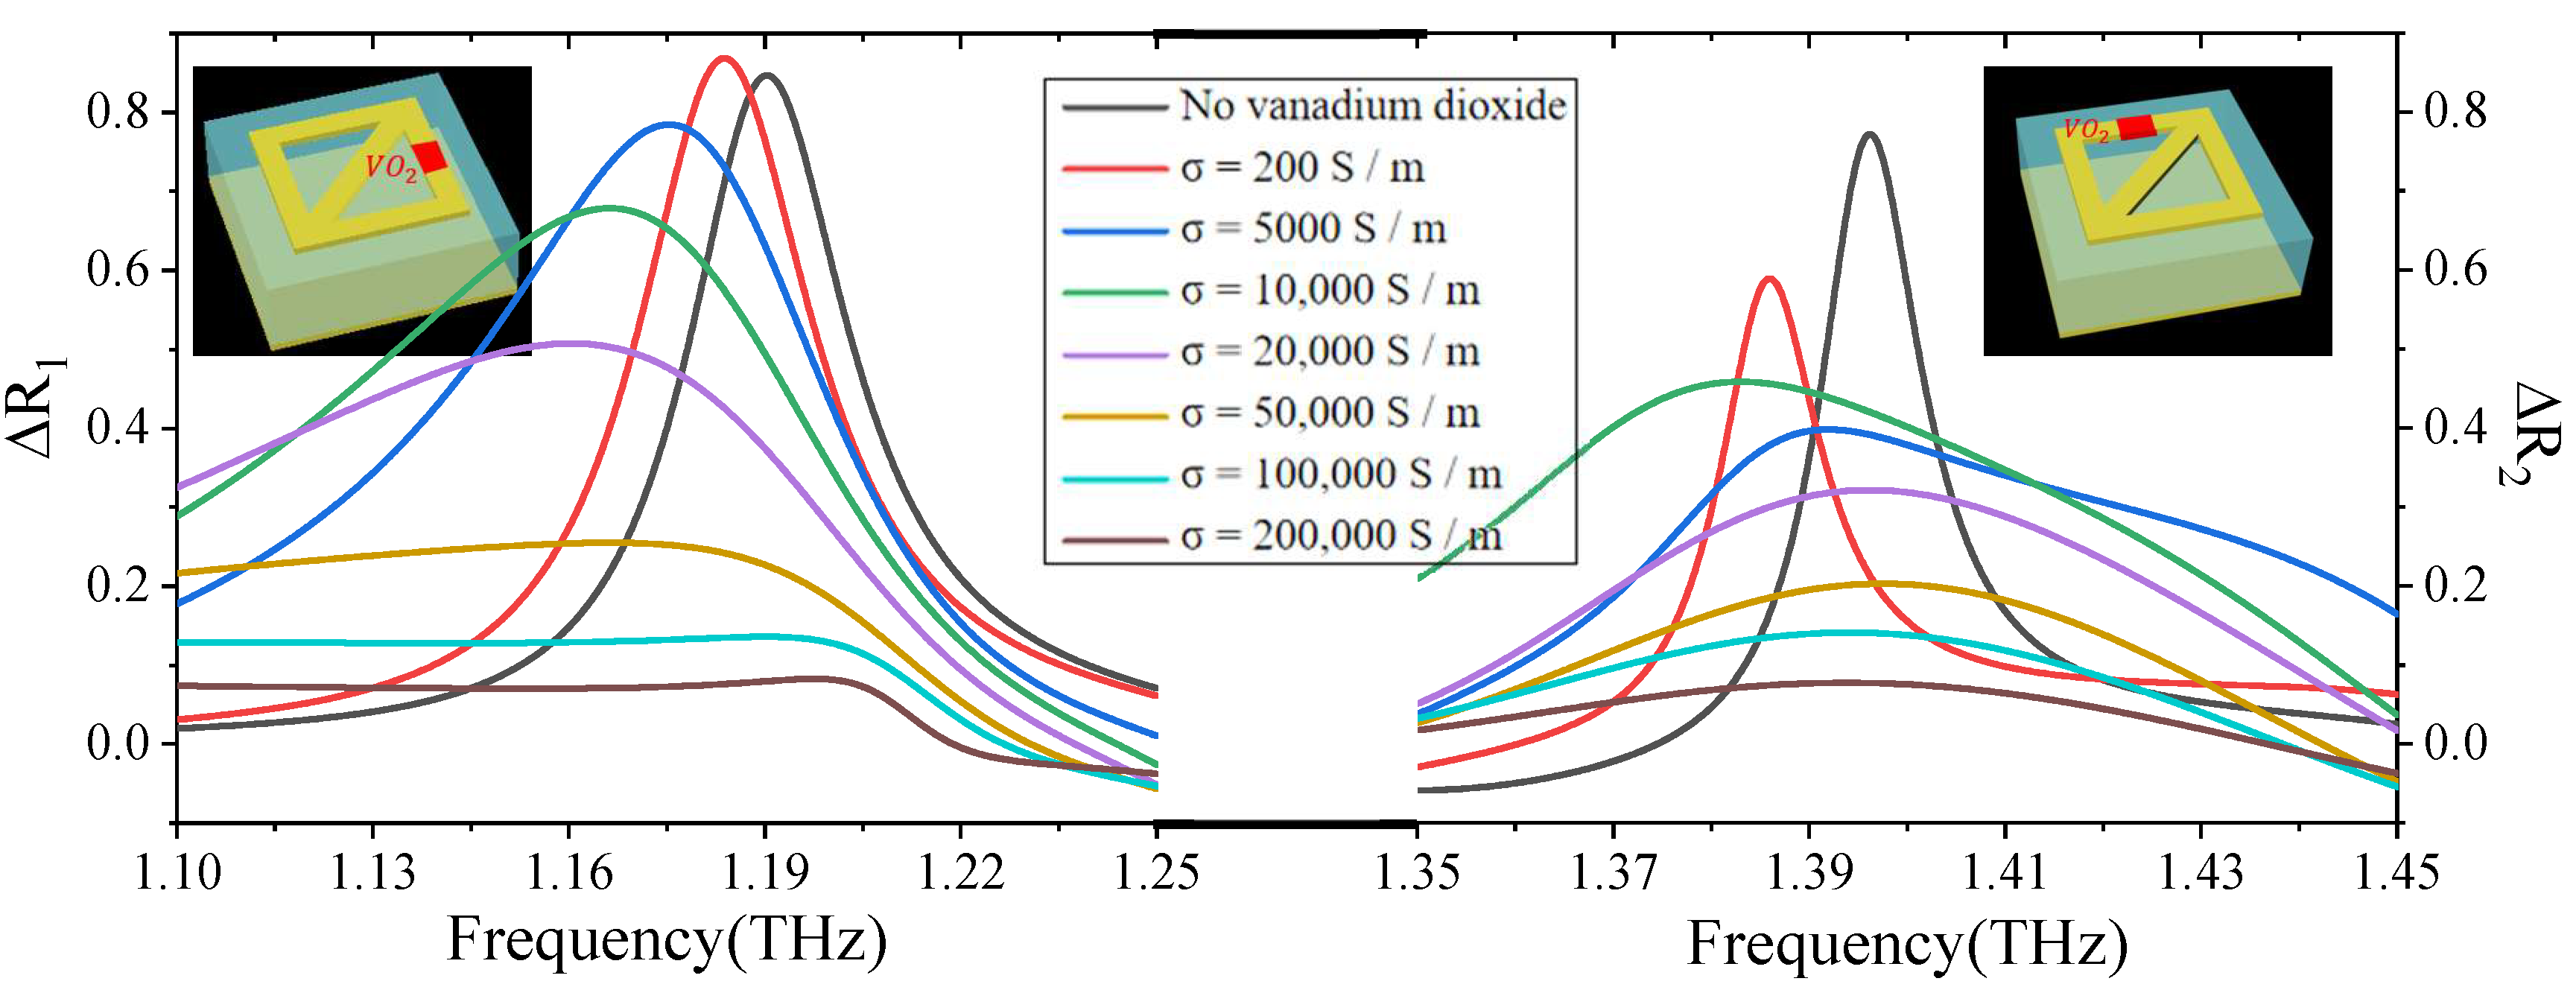
| Conductivity (S/m) | Frequency (THz) | ΔR1 | Frequency (THz) | ΔR2 |
|---|---|---|---|---|
| 0 | 1.19 | 0.85 | 1.40 | 0.77 |
| 200 | 1.18 | 0.87 | 1.39 | 0.59 |
| 5000 | 1.18 | 0.79 | 1.39 | 0.40 |
| 10,000 | 1.17 | 0.68 | 1.38 | 0.46 |
| 20,000 | 1.16 | 0.51 | 1.40 | 0.33 |
| 50,000 | 1.17 | 0.26 | 1.40 | 0.21 |
| 100,000 | 1.19 | 0.14 | 1.40 | 0.14 |
| 200,000 | 1.20 | 0.09 | 1.40 | 0.08 |
Publisher’s Note: MDPI stays neutral with regard to jurisdictional claims in published maps and institutional affiliations. |
© 2022 by the authors. Licensee MDPI, Basel, Switzerland. This article is an open access article distributed under the terms and conditions of the Creative Commons Attribution (CC BY) license (https://creativecommons.org/licenses/by/4.0/).
Share and Cite
Zhang, J.; Yan, H.; Yang, X.; Lyu, H. Dual-Function Metasurface for Tunable Selective Absorption. Micromachines 2022, 13, 2087. https://doi.org/10.3390/mi13122087
Zhang J, Yan H, Yang X, Lyu H. Dual-Function Metasurface for Tunable Selective Absorption. Micromachines. 2022; 13(12):2087. https://doi.org/10.3390/mi13122087
Chicago/Turabian StyleZhang, Jingyu, Hanbing Yan, Xiaoqing Yang, and Haohui Lyu. 2022. "Dual-Function Metasurface for Tunable Selective Absorption" Micromachines 13, no. 12: 2087. https://doi.org/10.3390/mi13122087