
A Novel Mechanical Frequency Tuning Method Based on Mass-Stiffness Decoupling for MEMS Gyroscopes

 ,
,
Abstract
:1. Introduction
2. Model Design for the New Ring Resonator
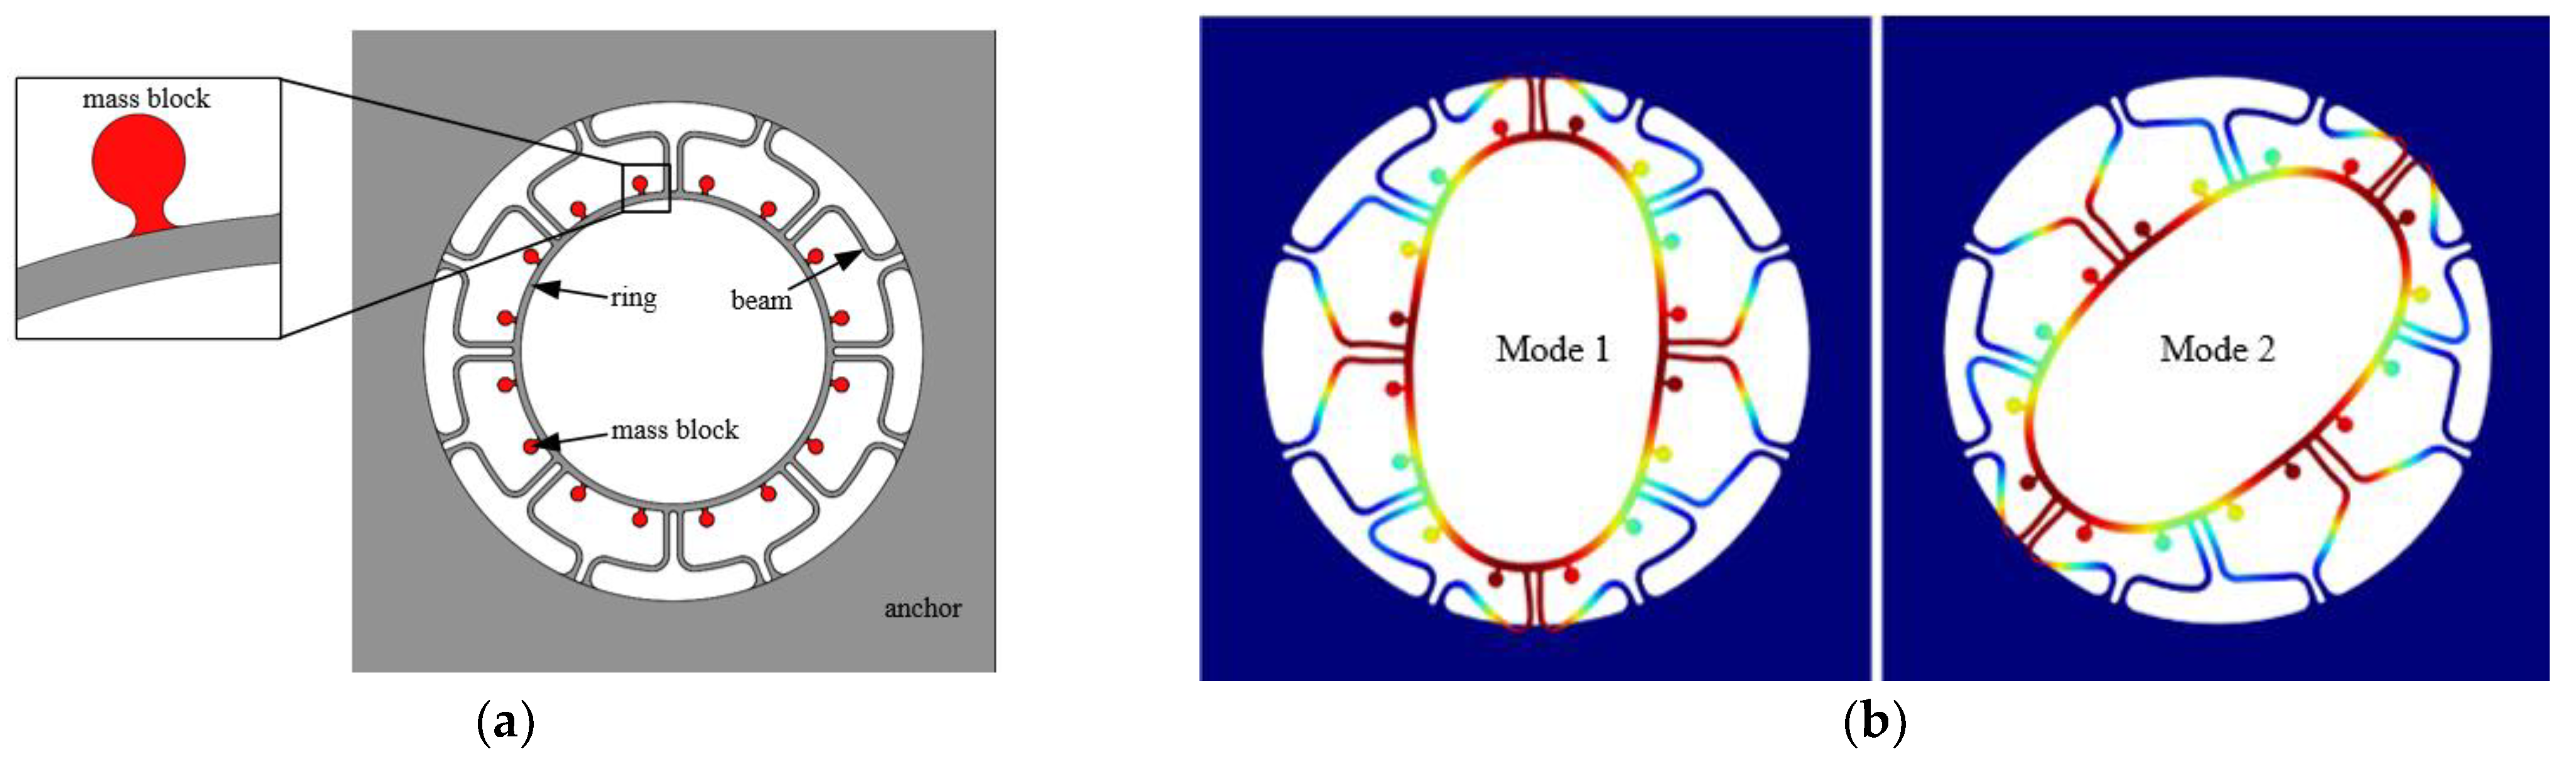
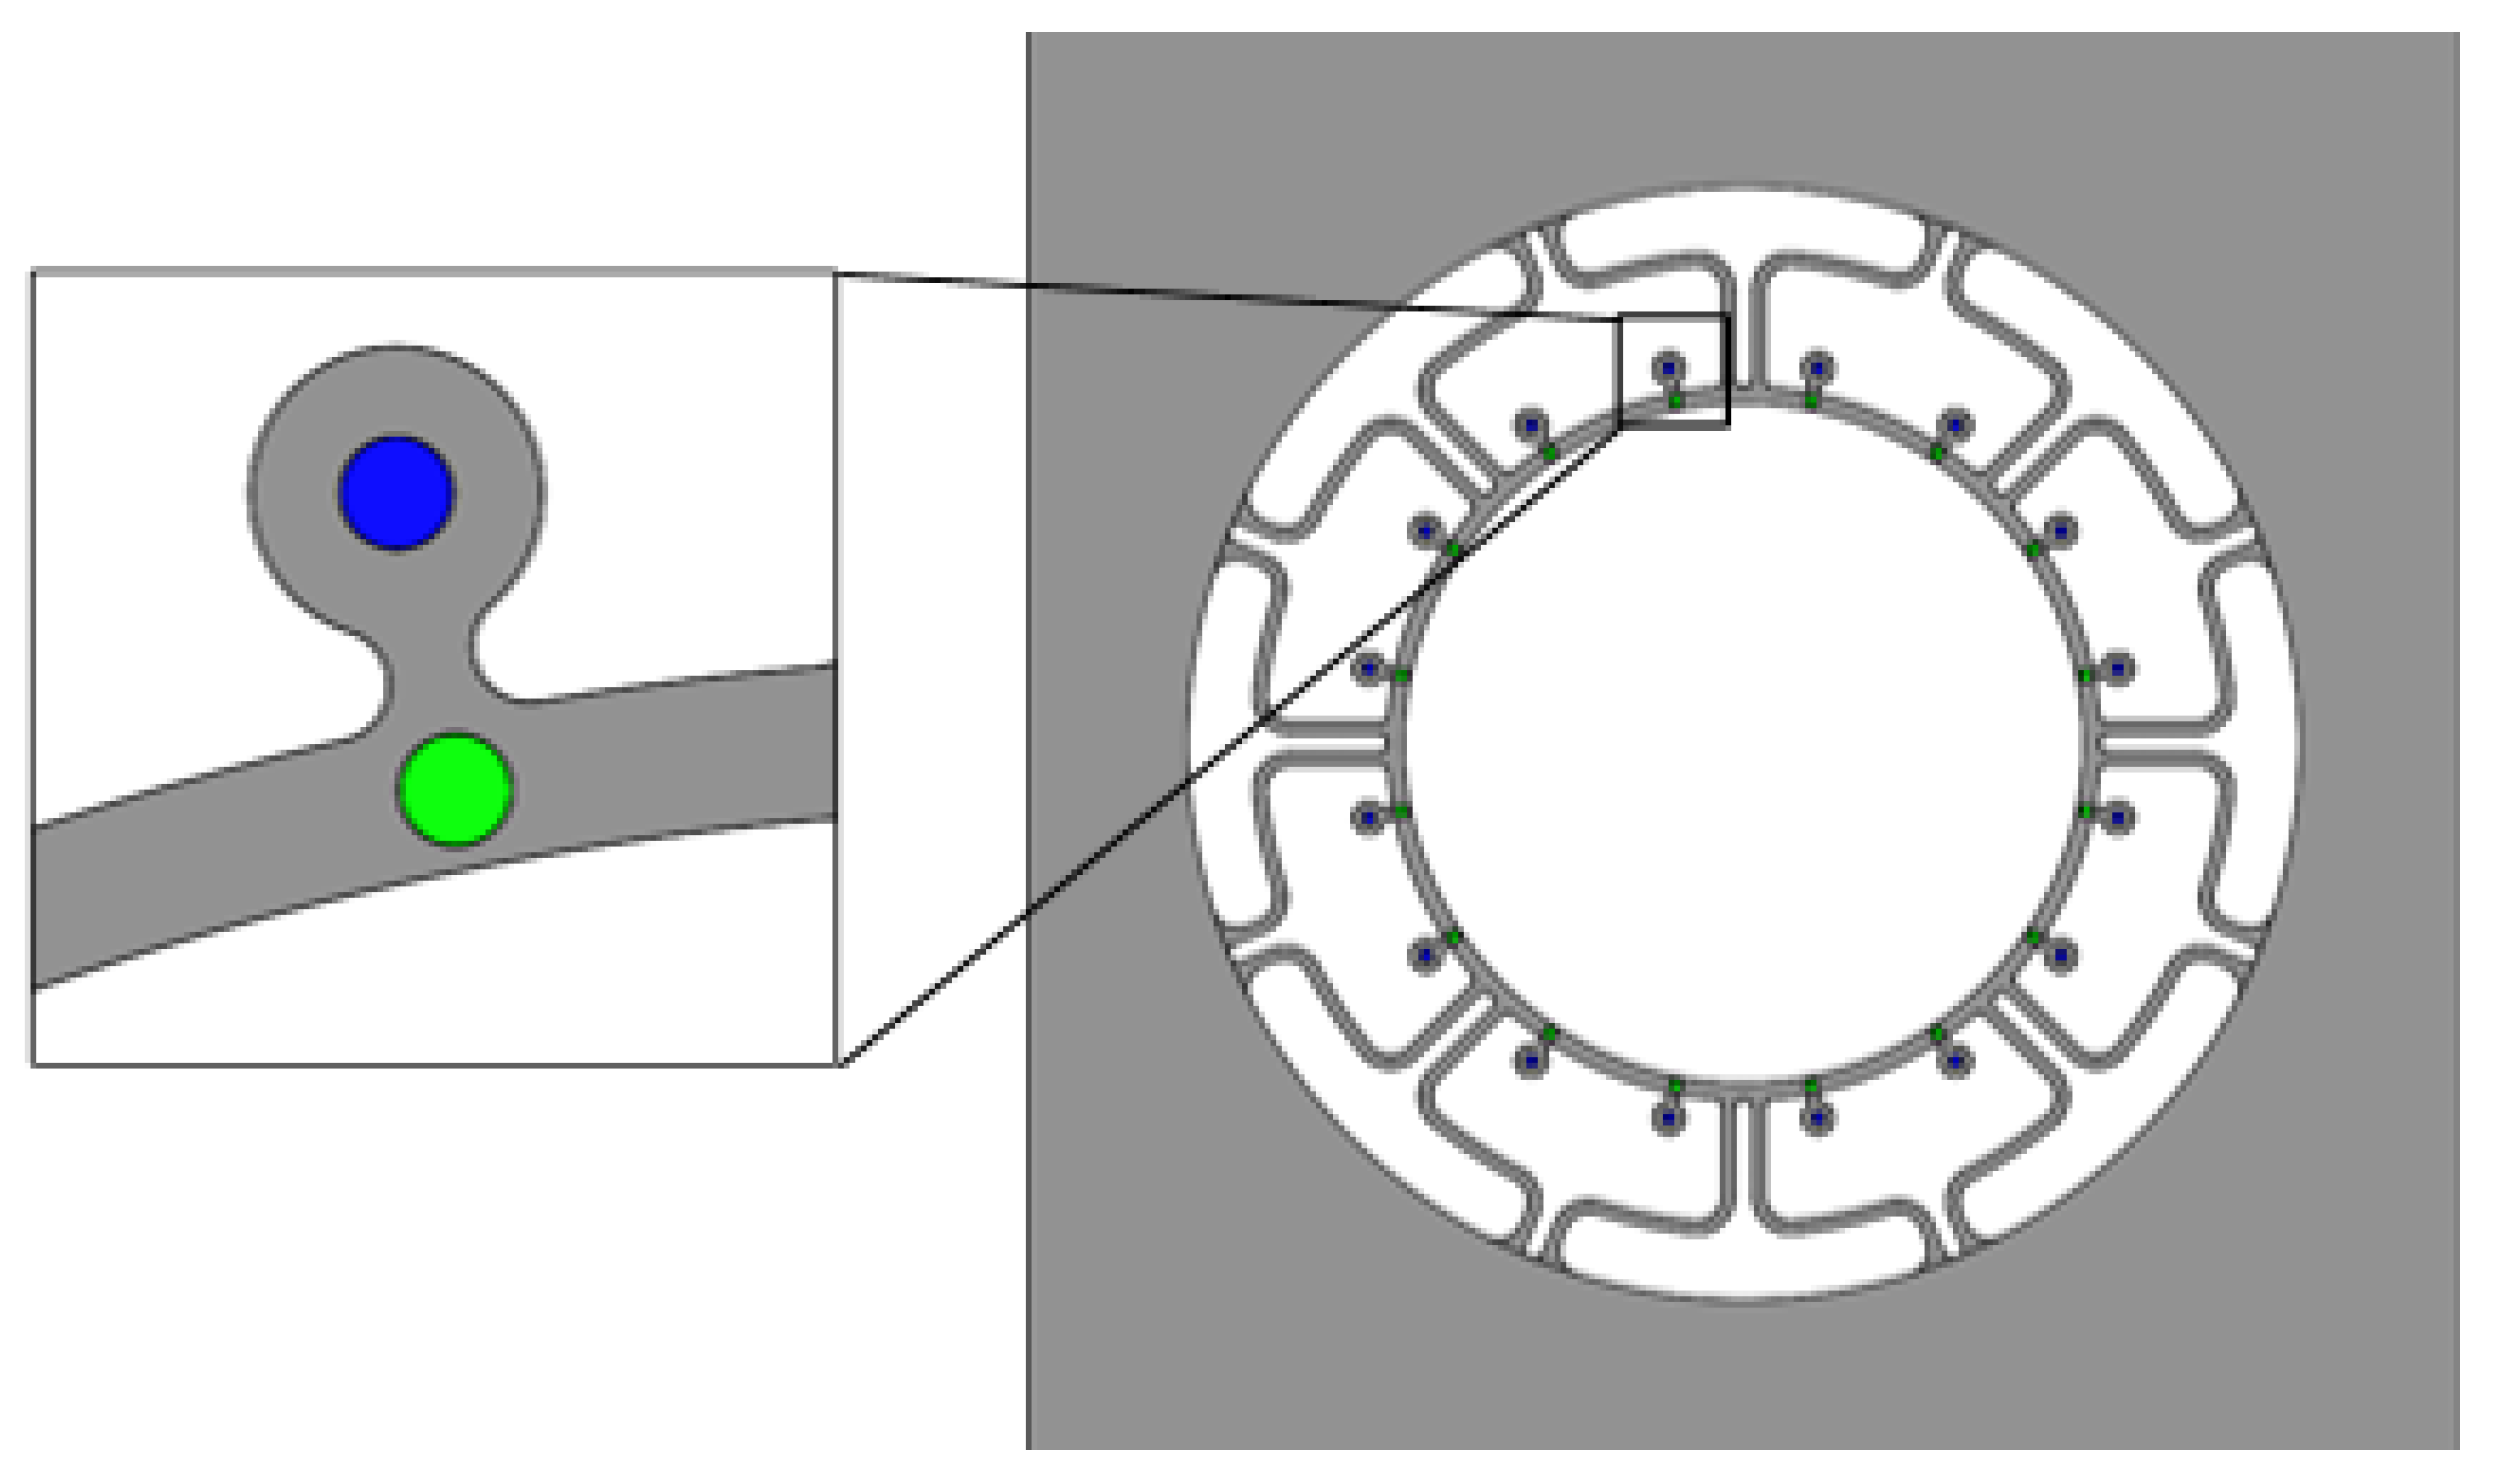
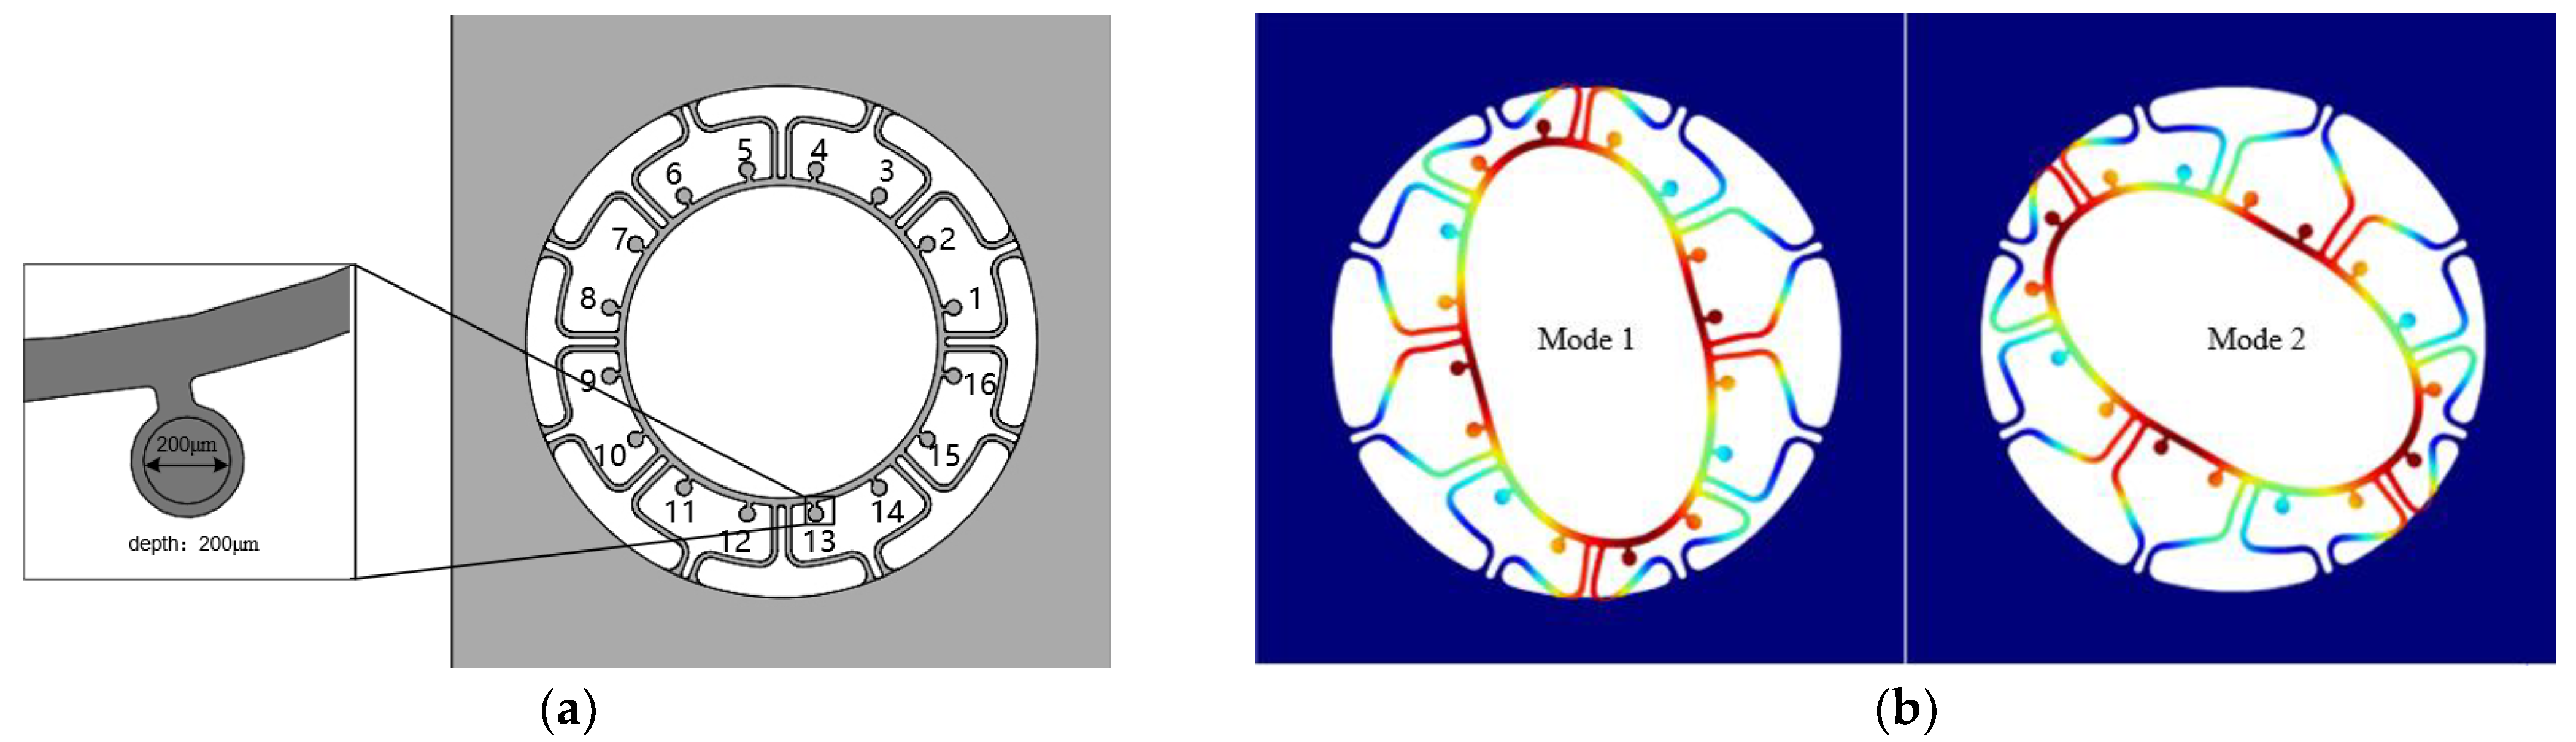
2.1. Model Design
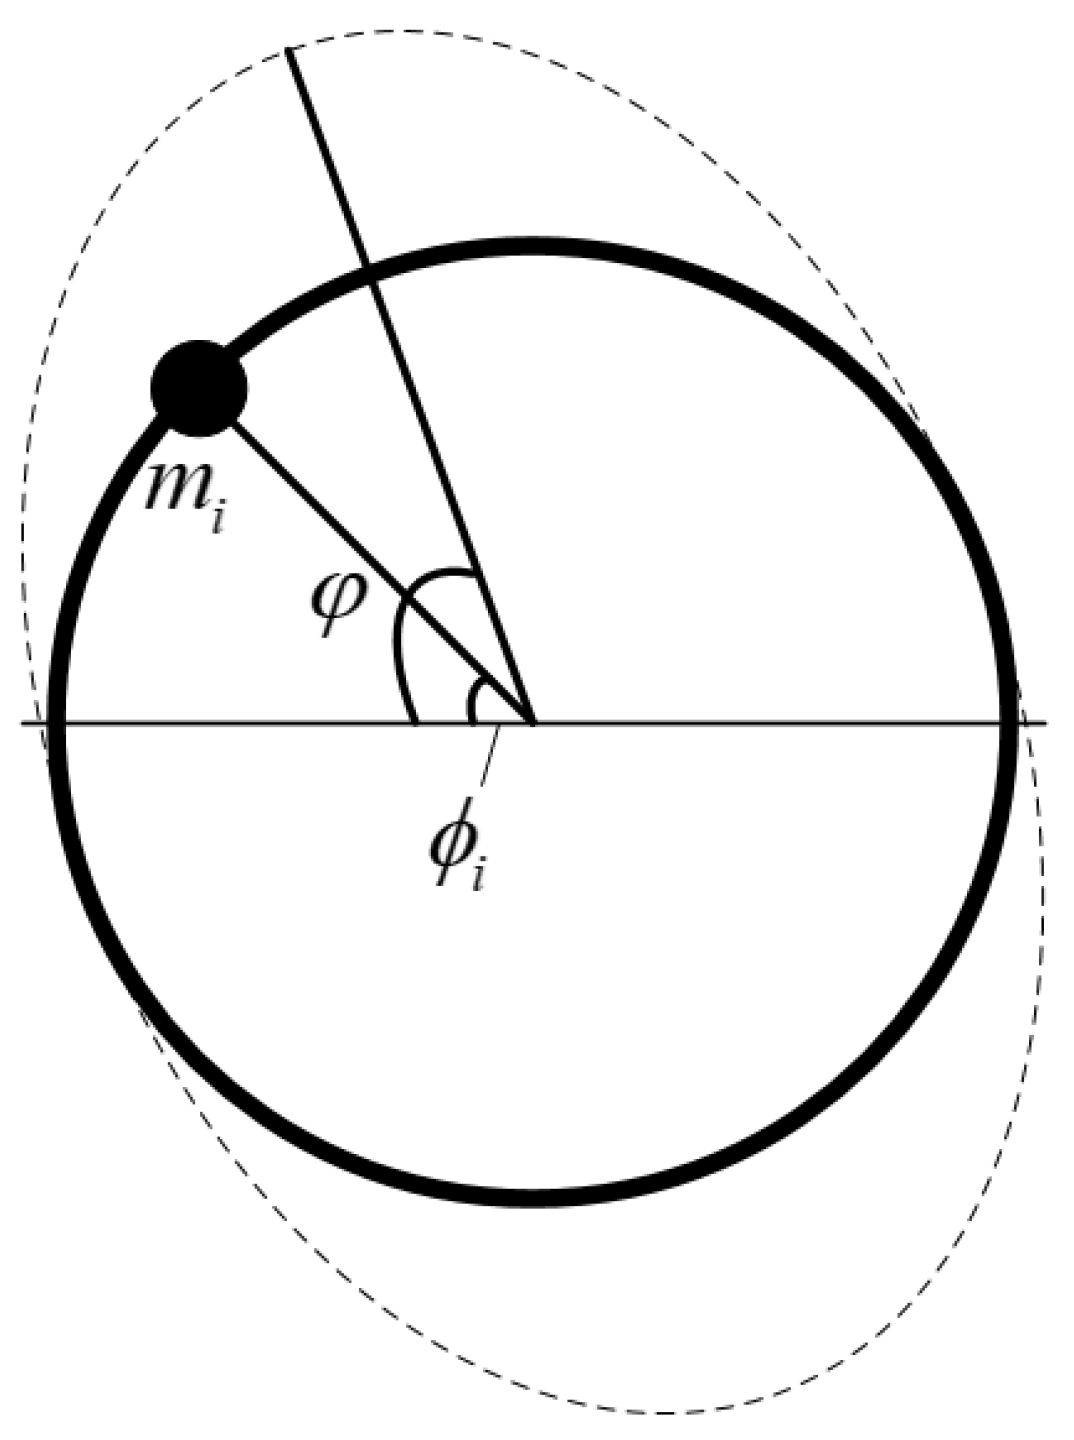
2.2. Theory of Frequency Tuning
3. Simulation Analysis
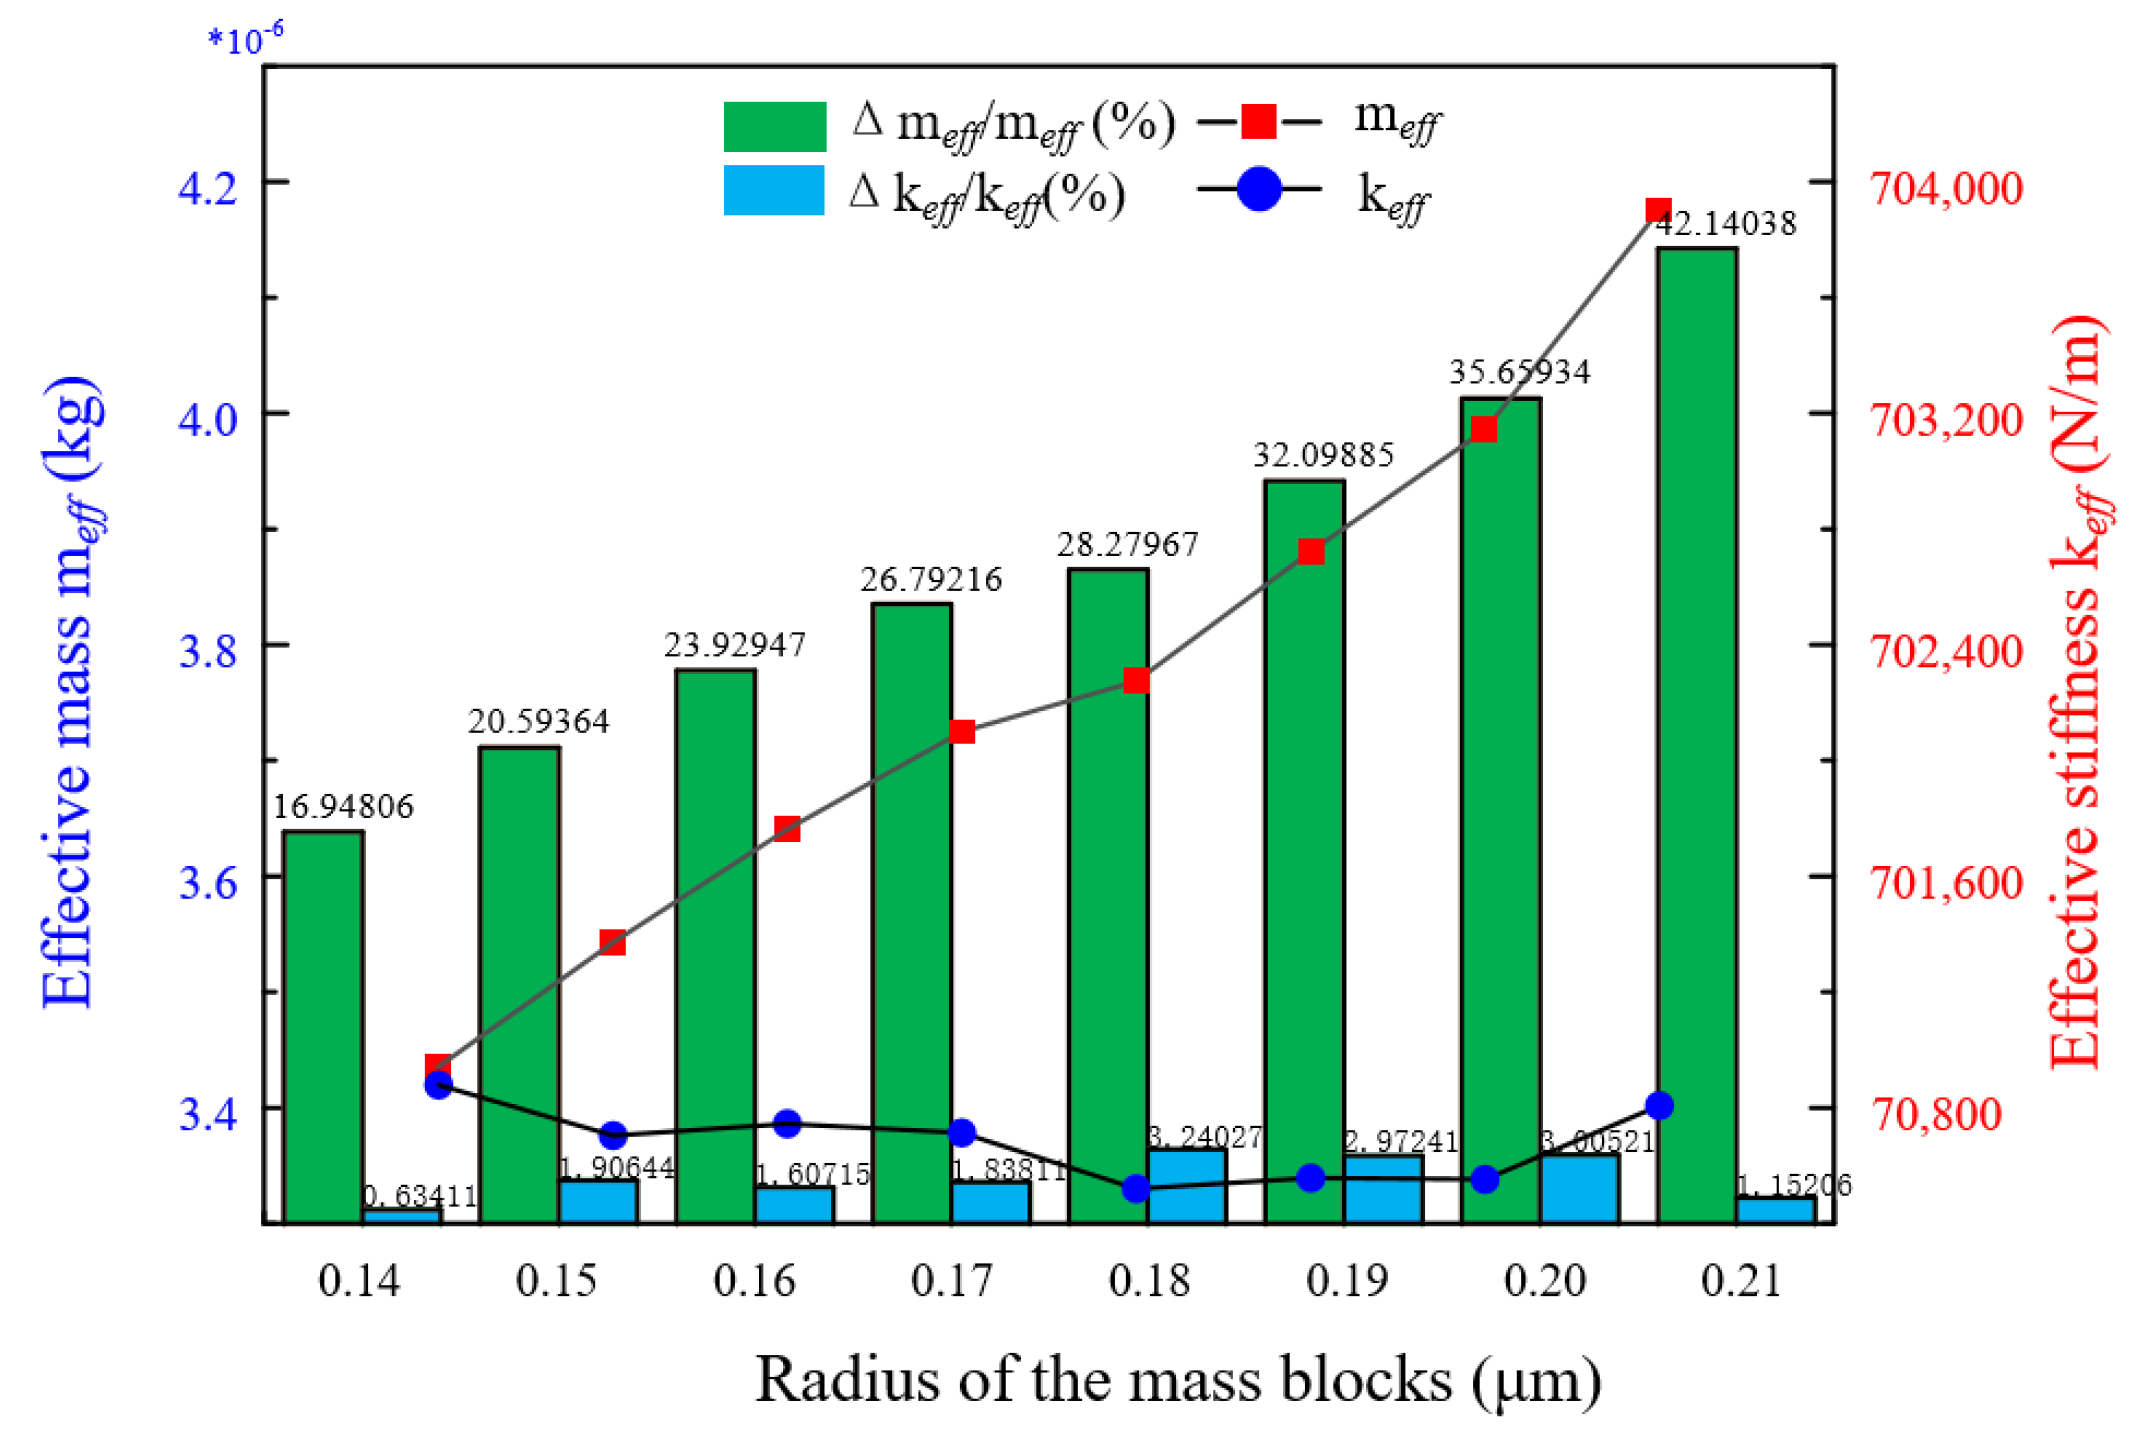
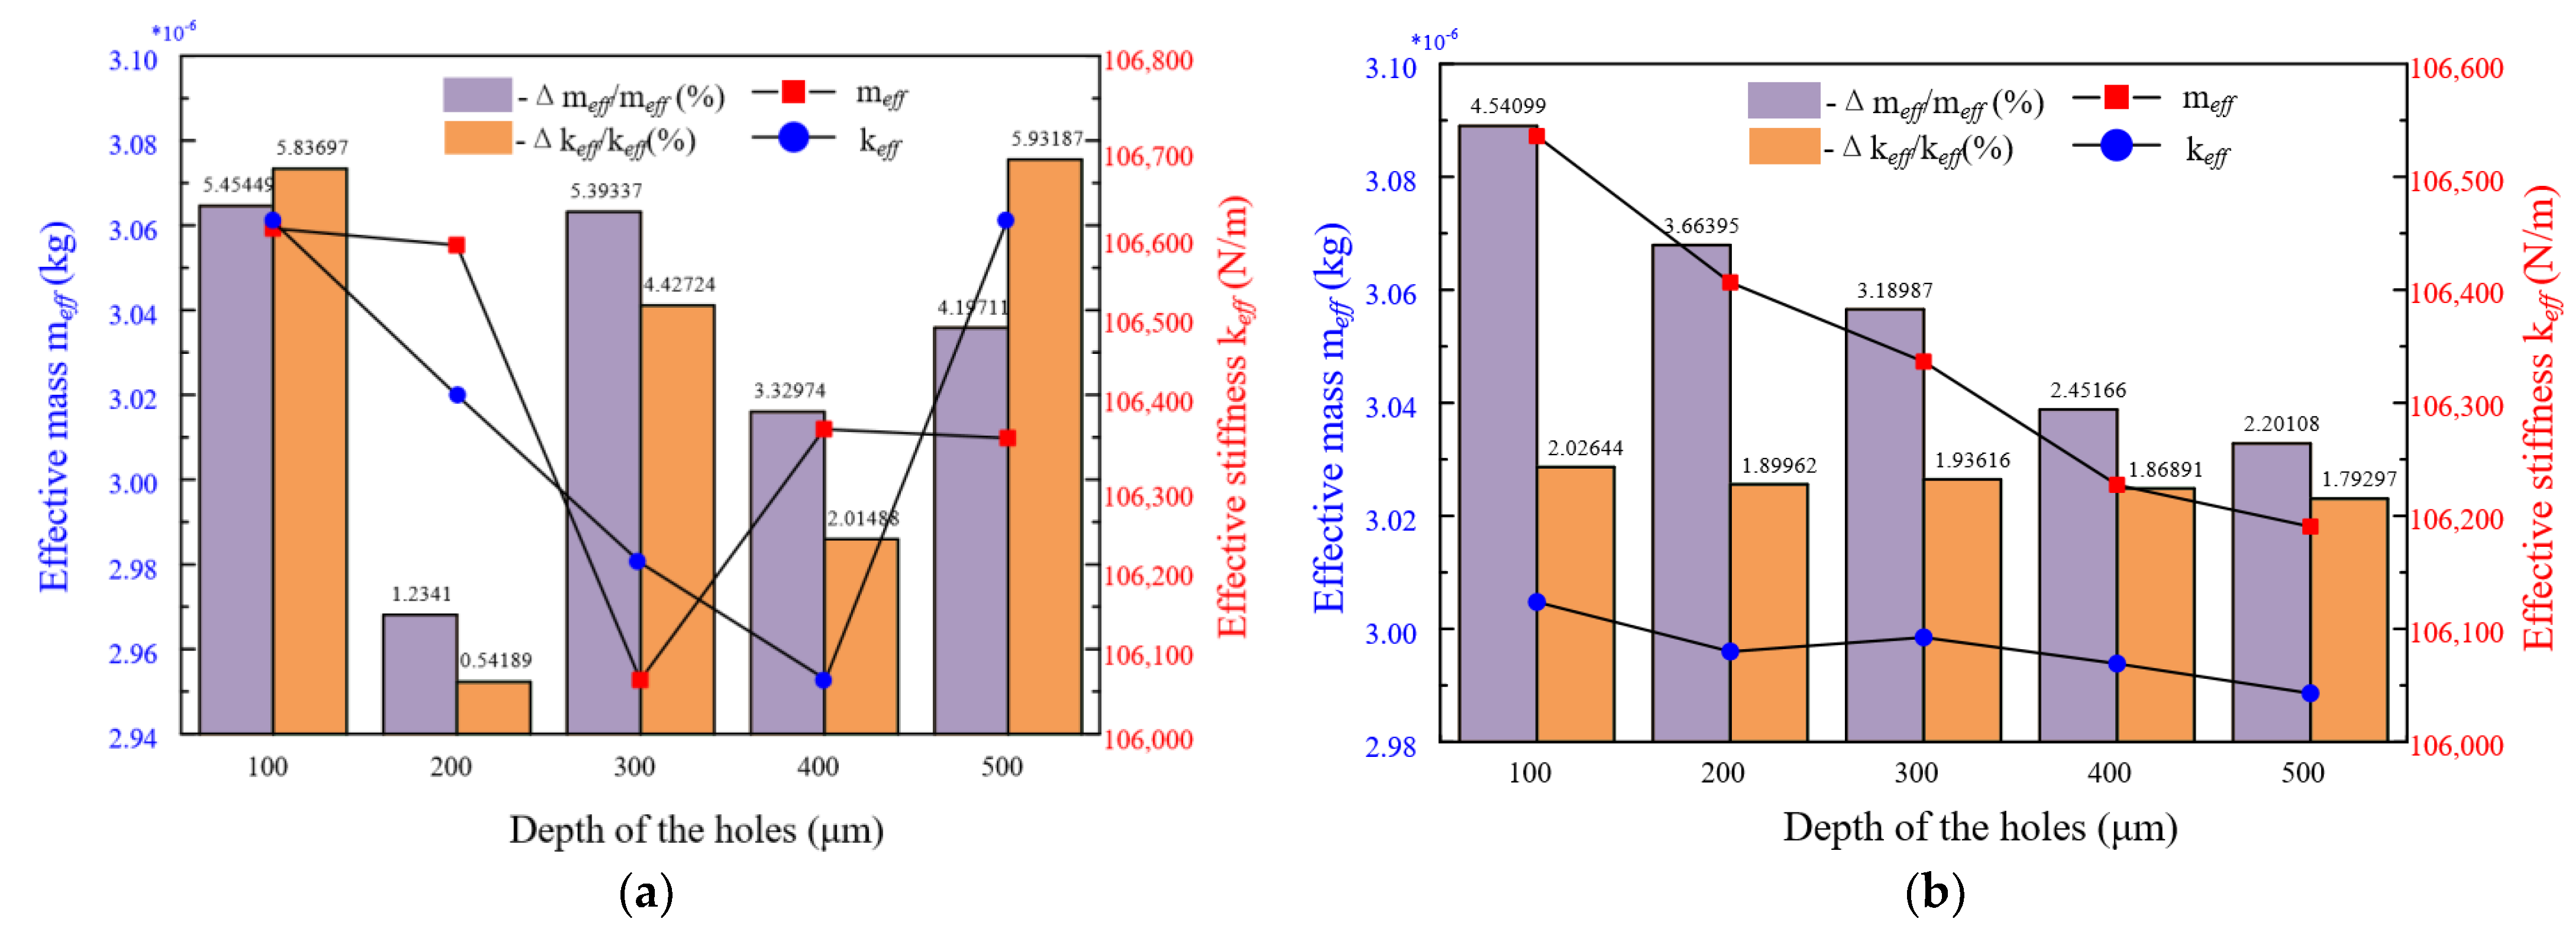
3.1. Simulation of Mass-Stiffness Decoupling
3.2. Modal Analysis for the New Ring Resonator with Initial Errors
3.3. The Effect of Trimming at 45° and 90° Intervals, Respectively
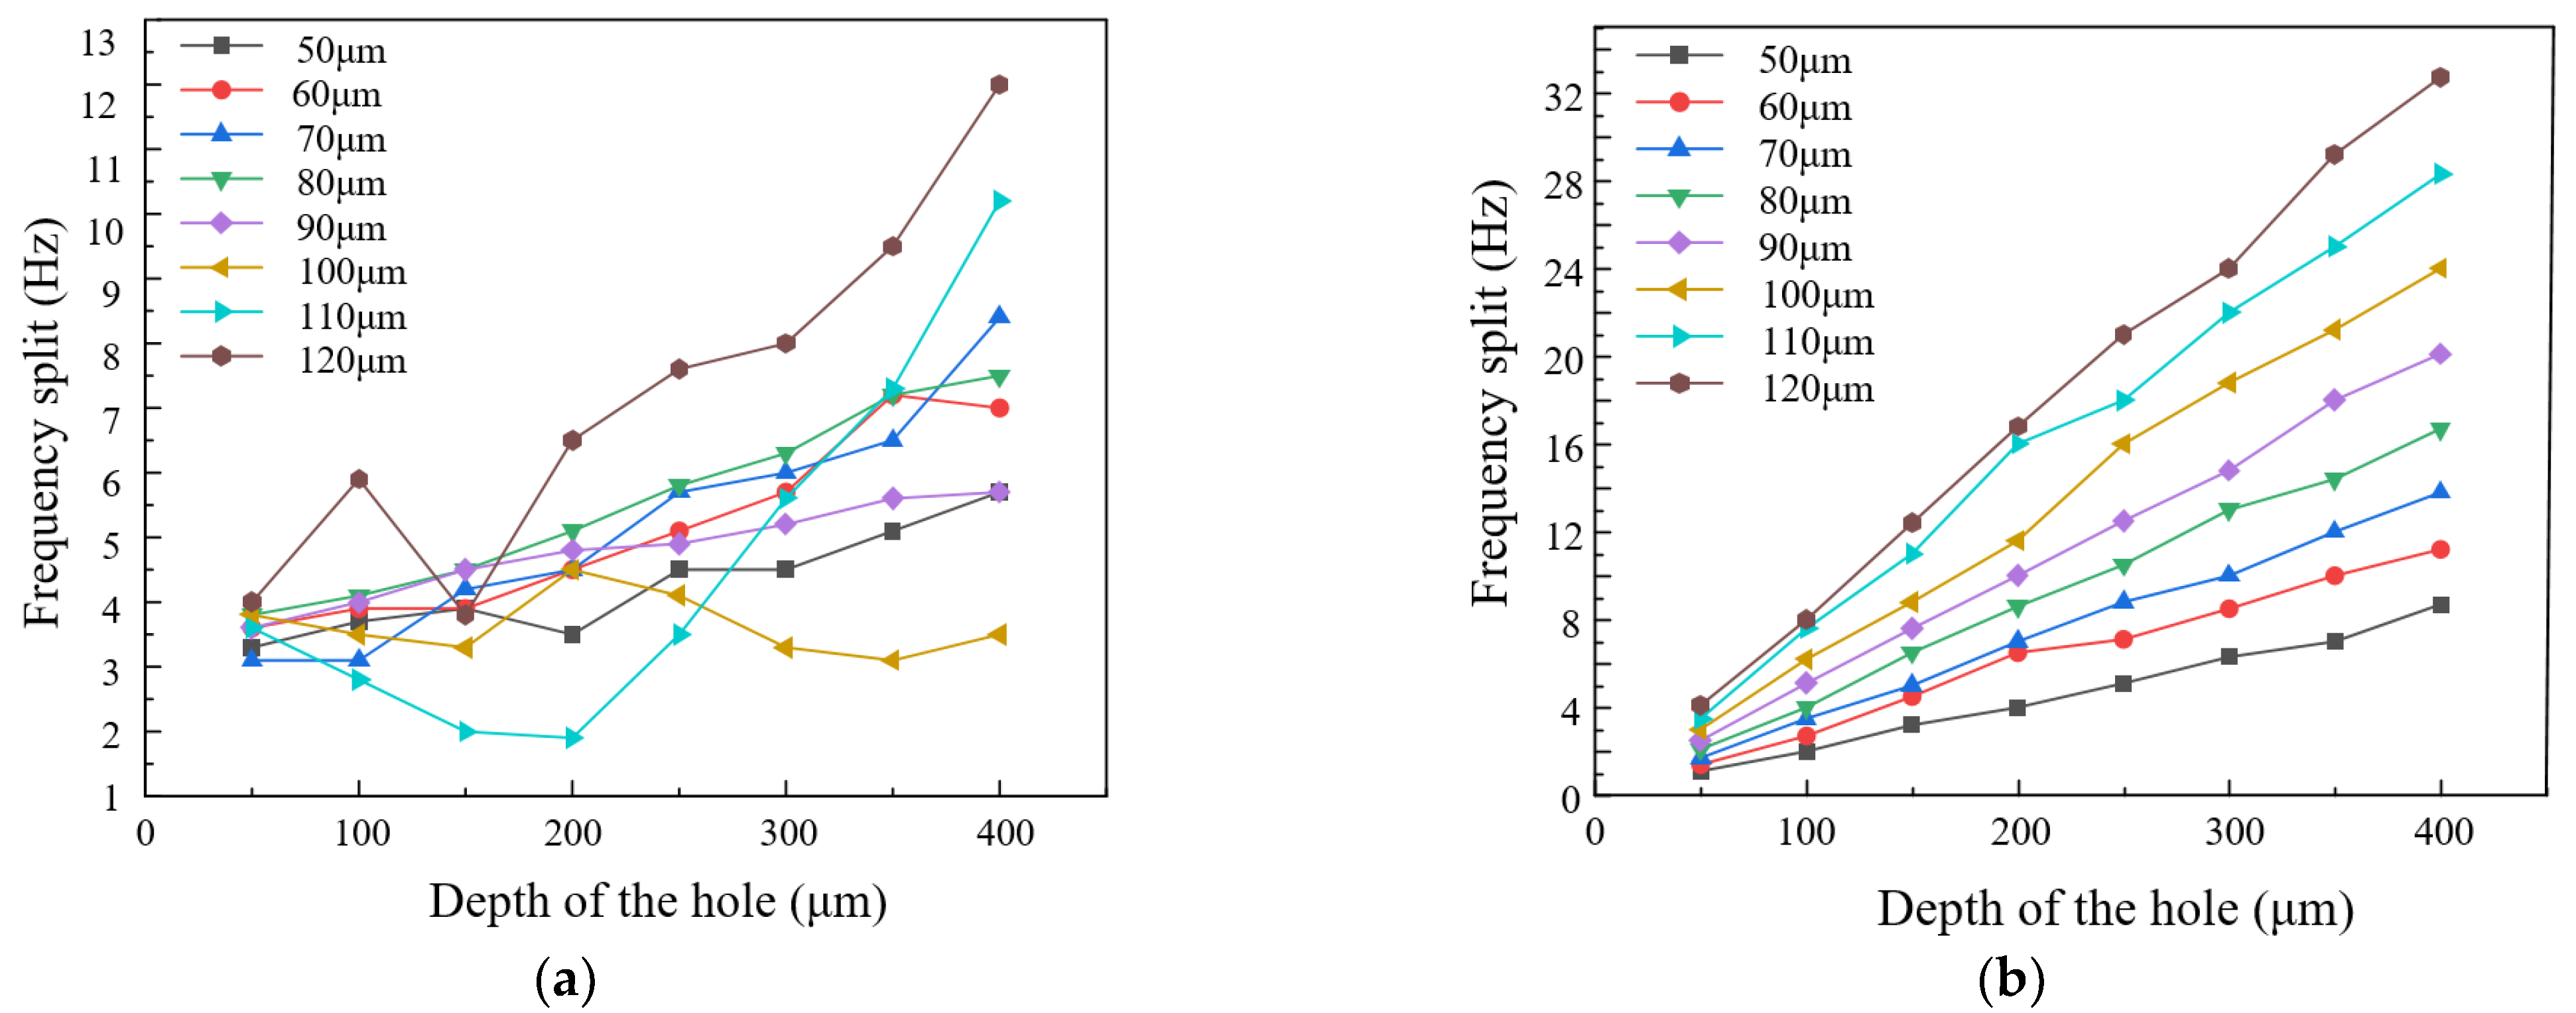
3.4. The Relationship between Hole’s Sizes and Frequency Split
4. Experimental Verification and Analysis of Results
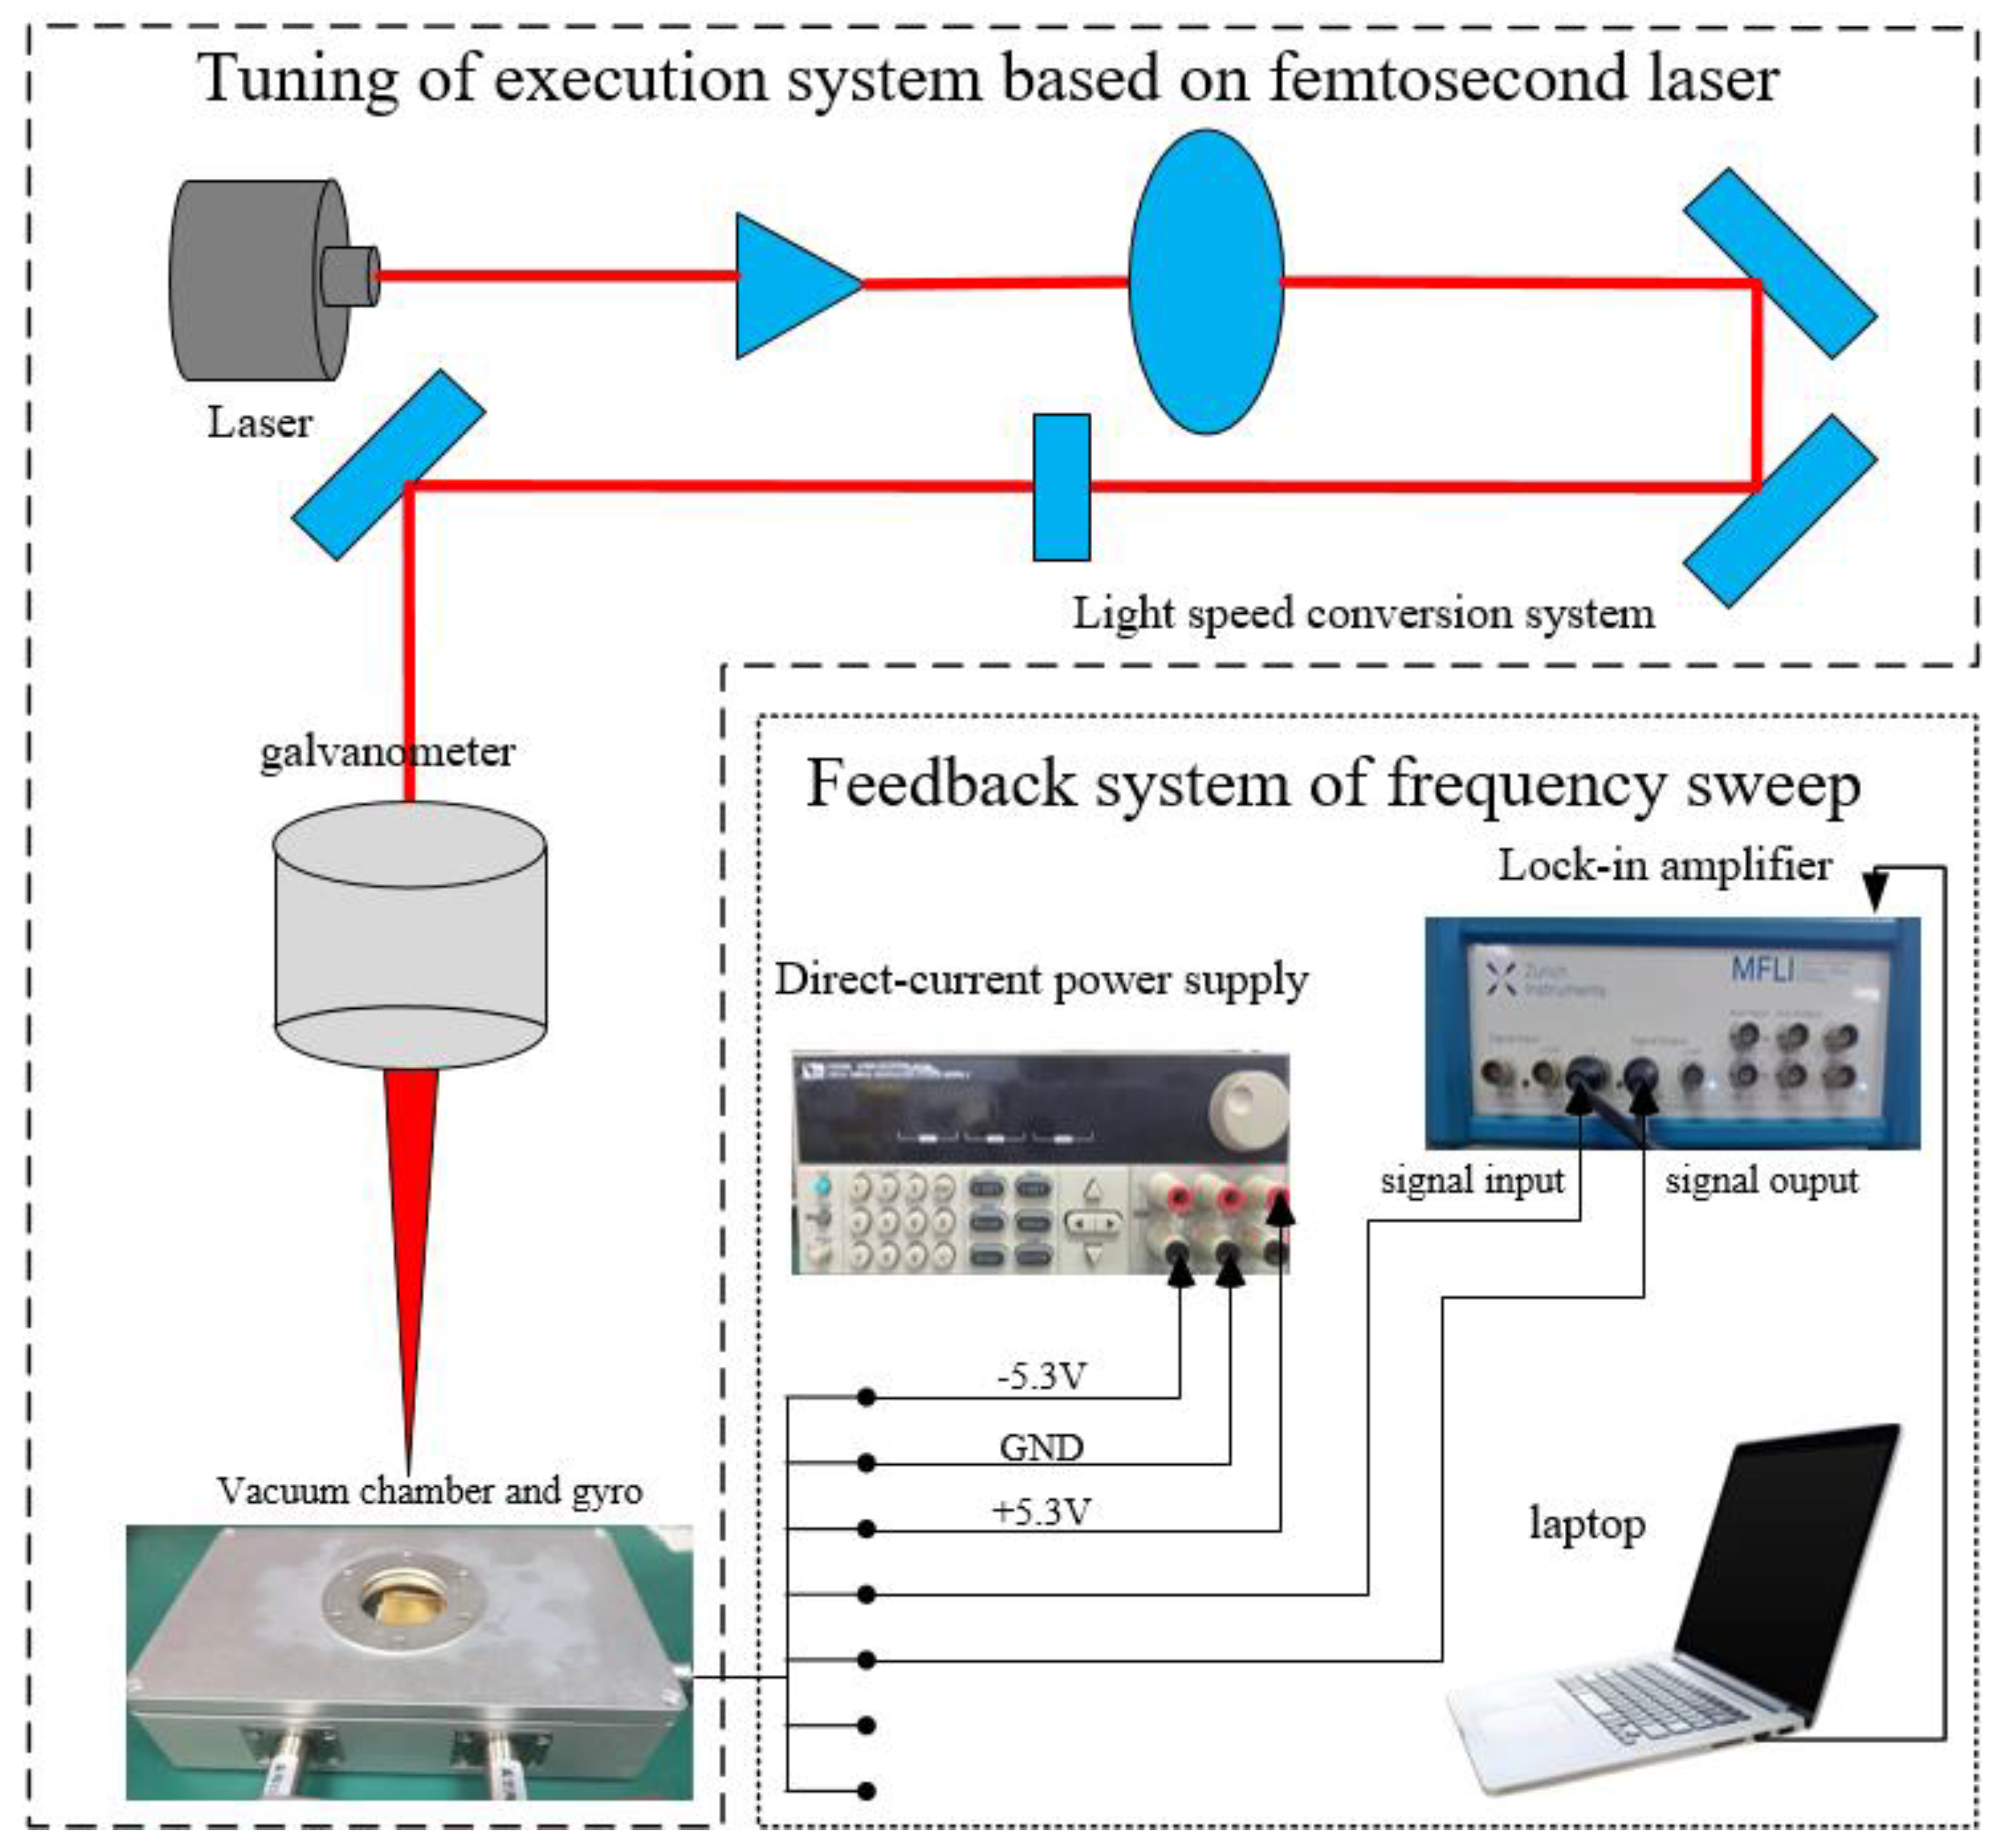
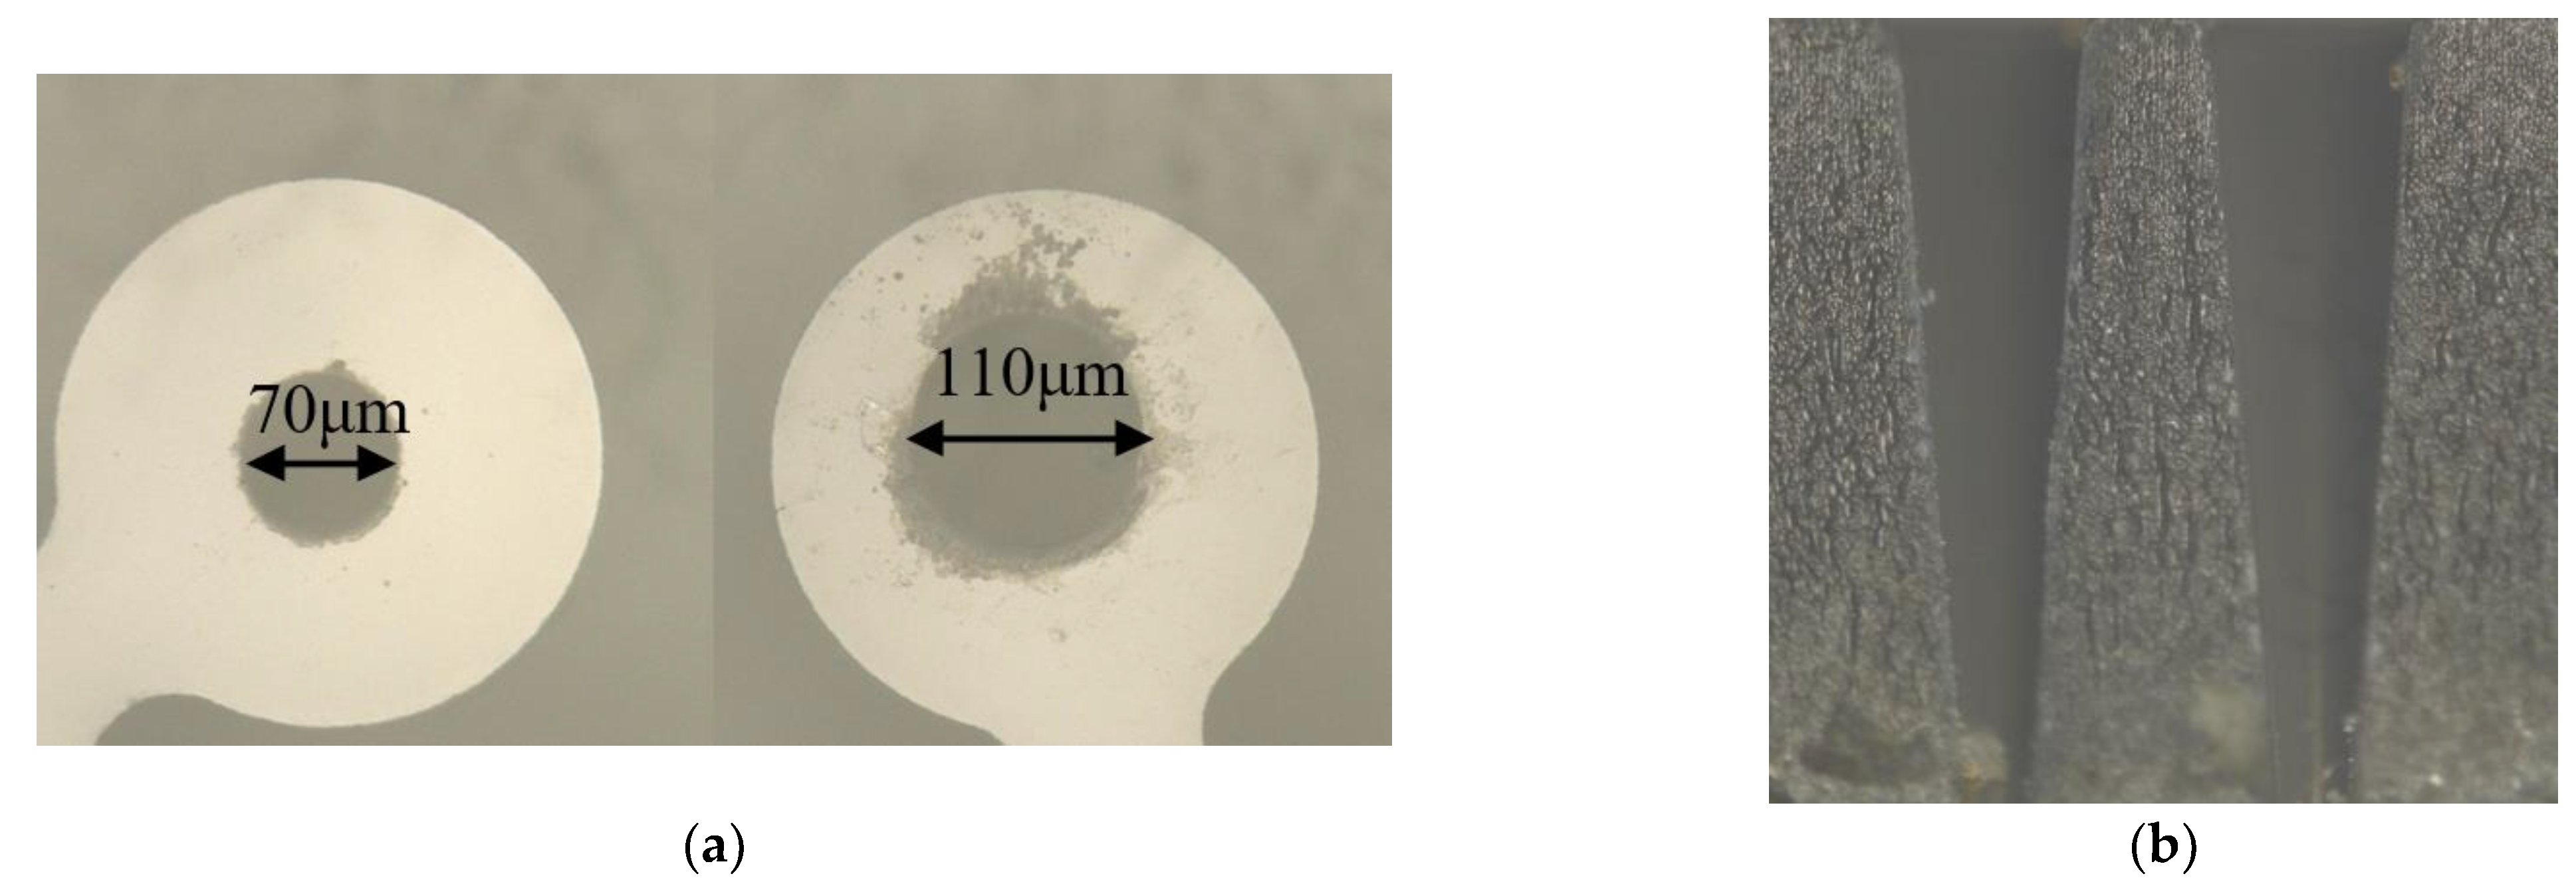
4.1. Tuning Platform and Actual Punching Effect
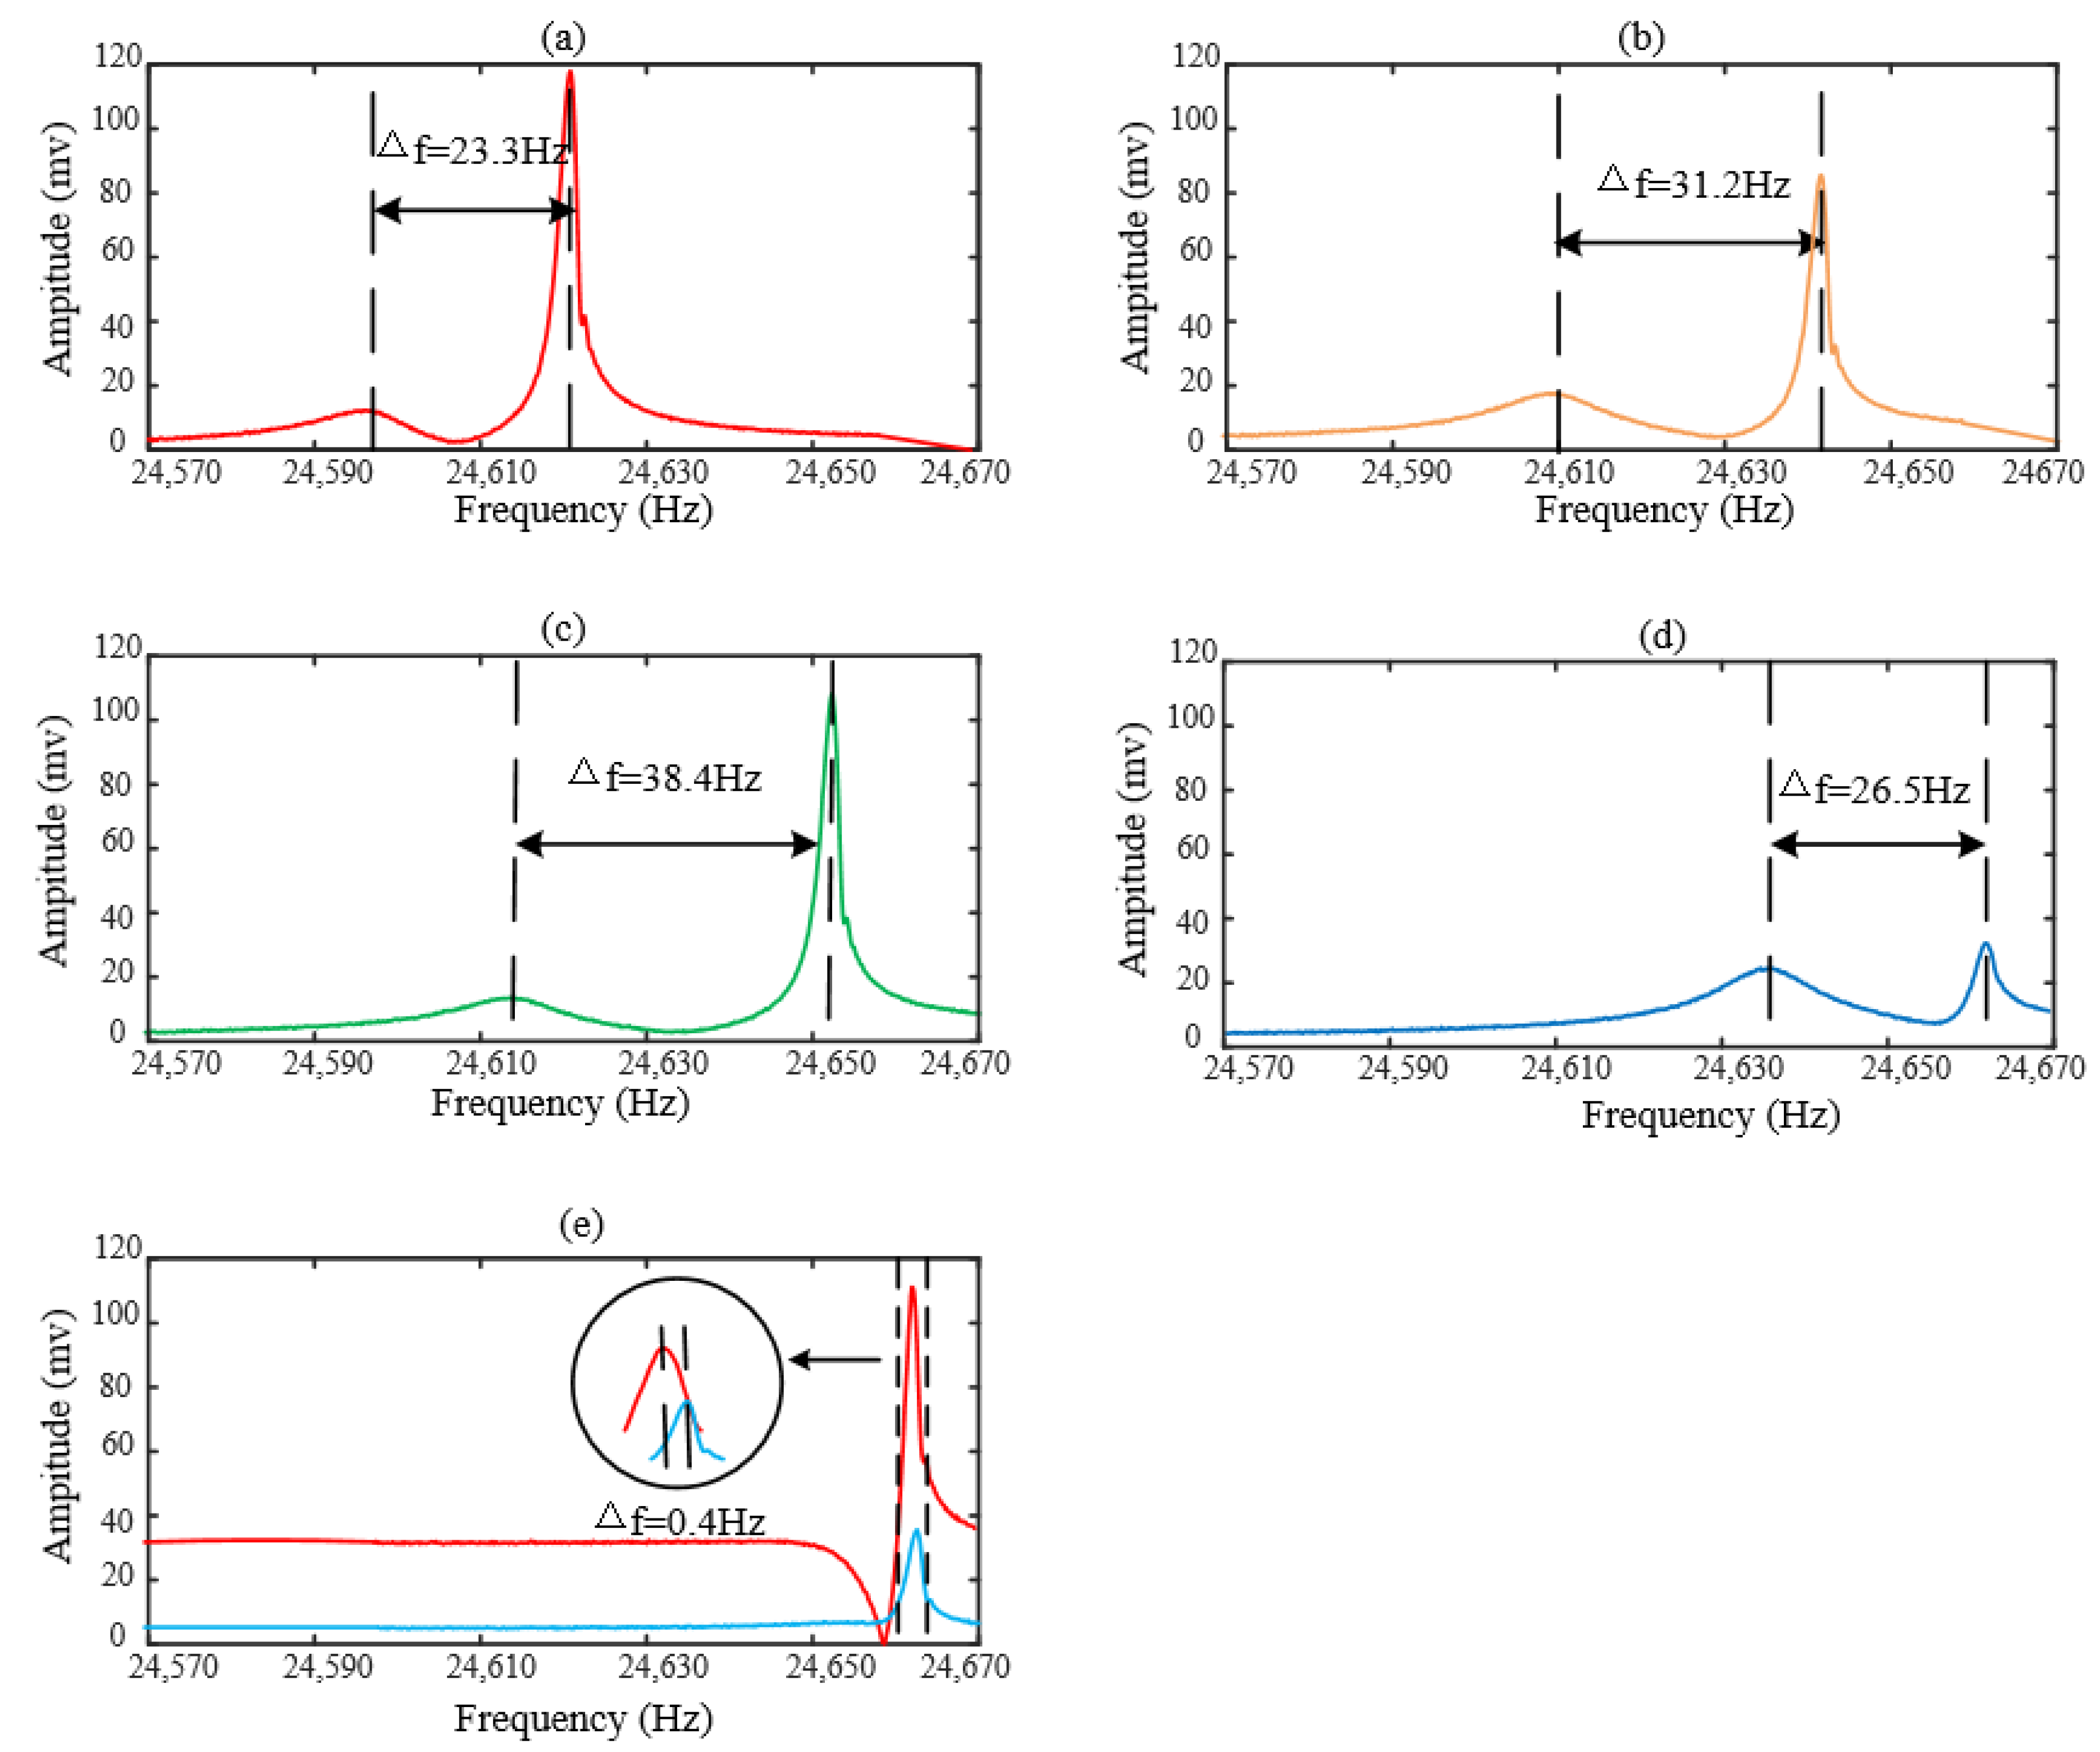
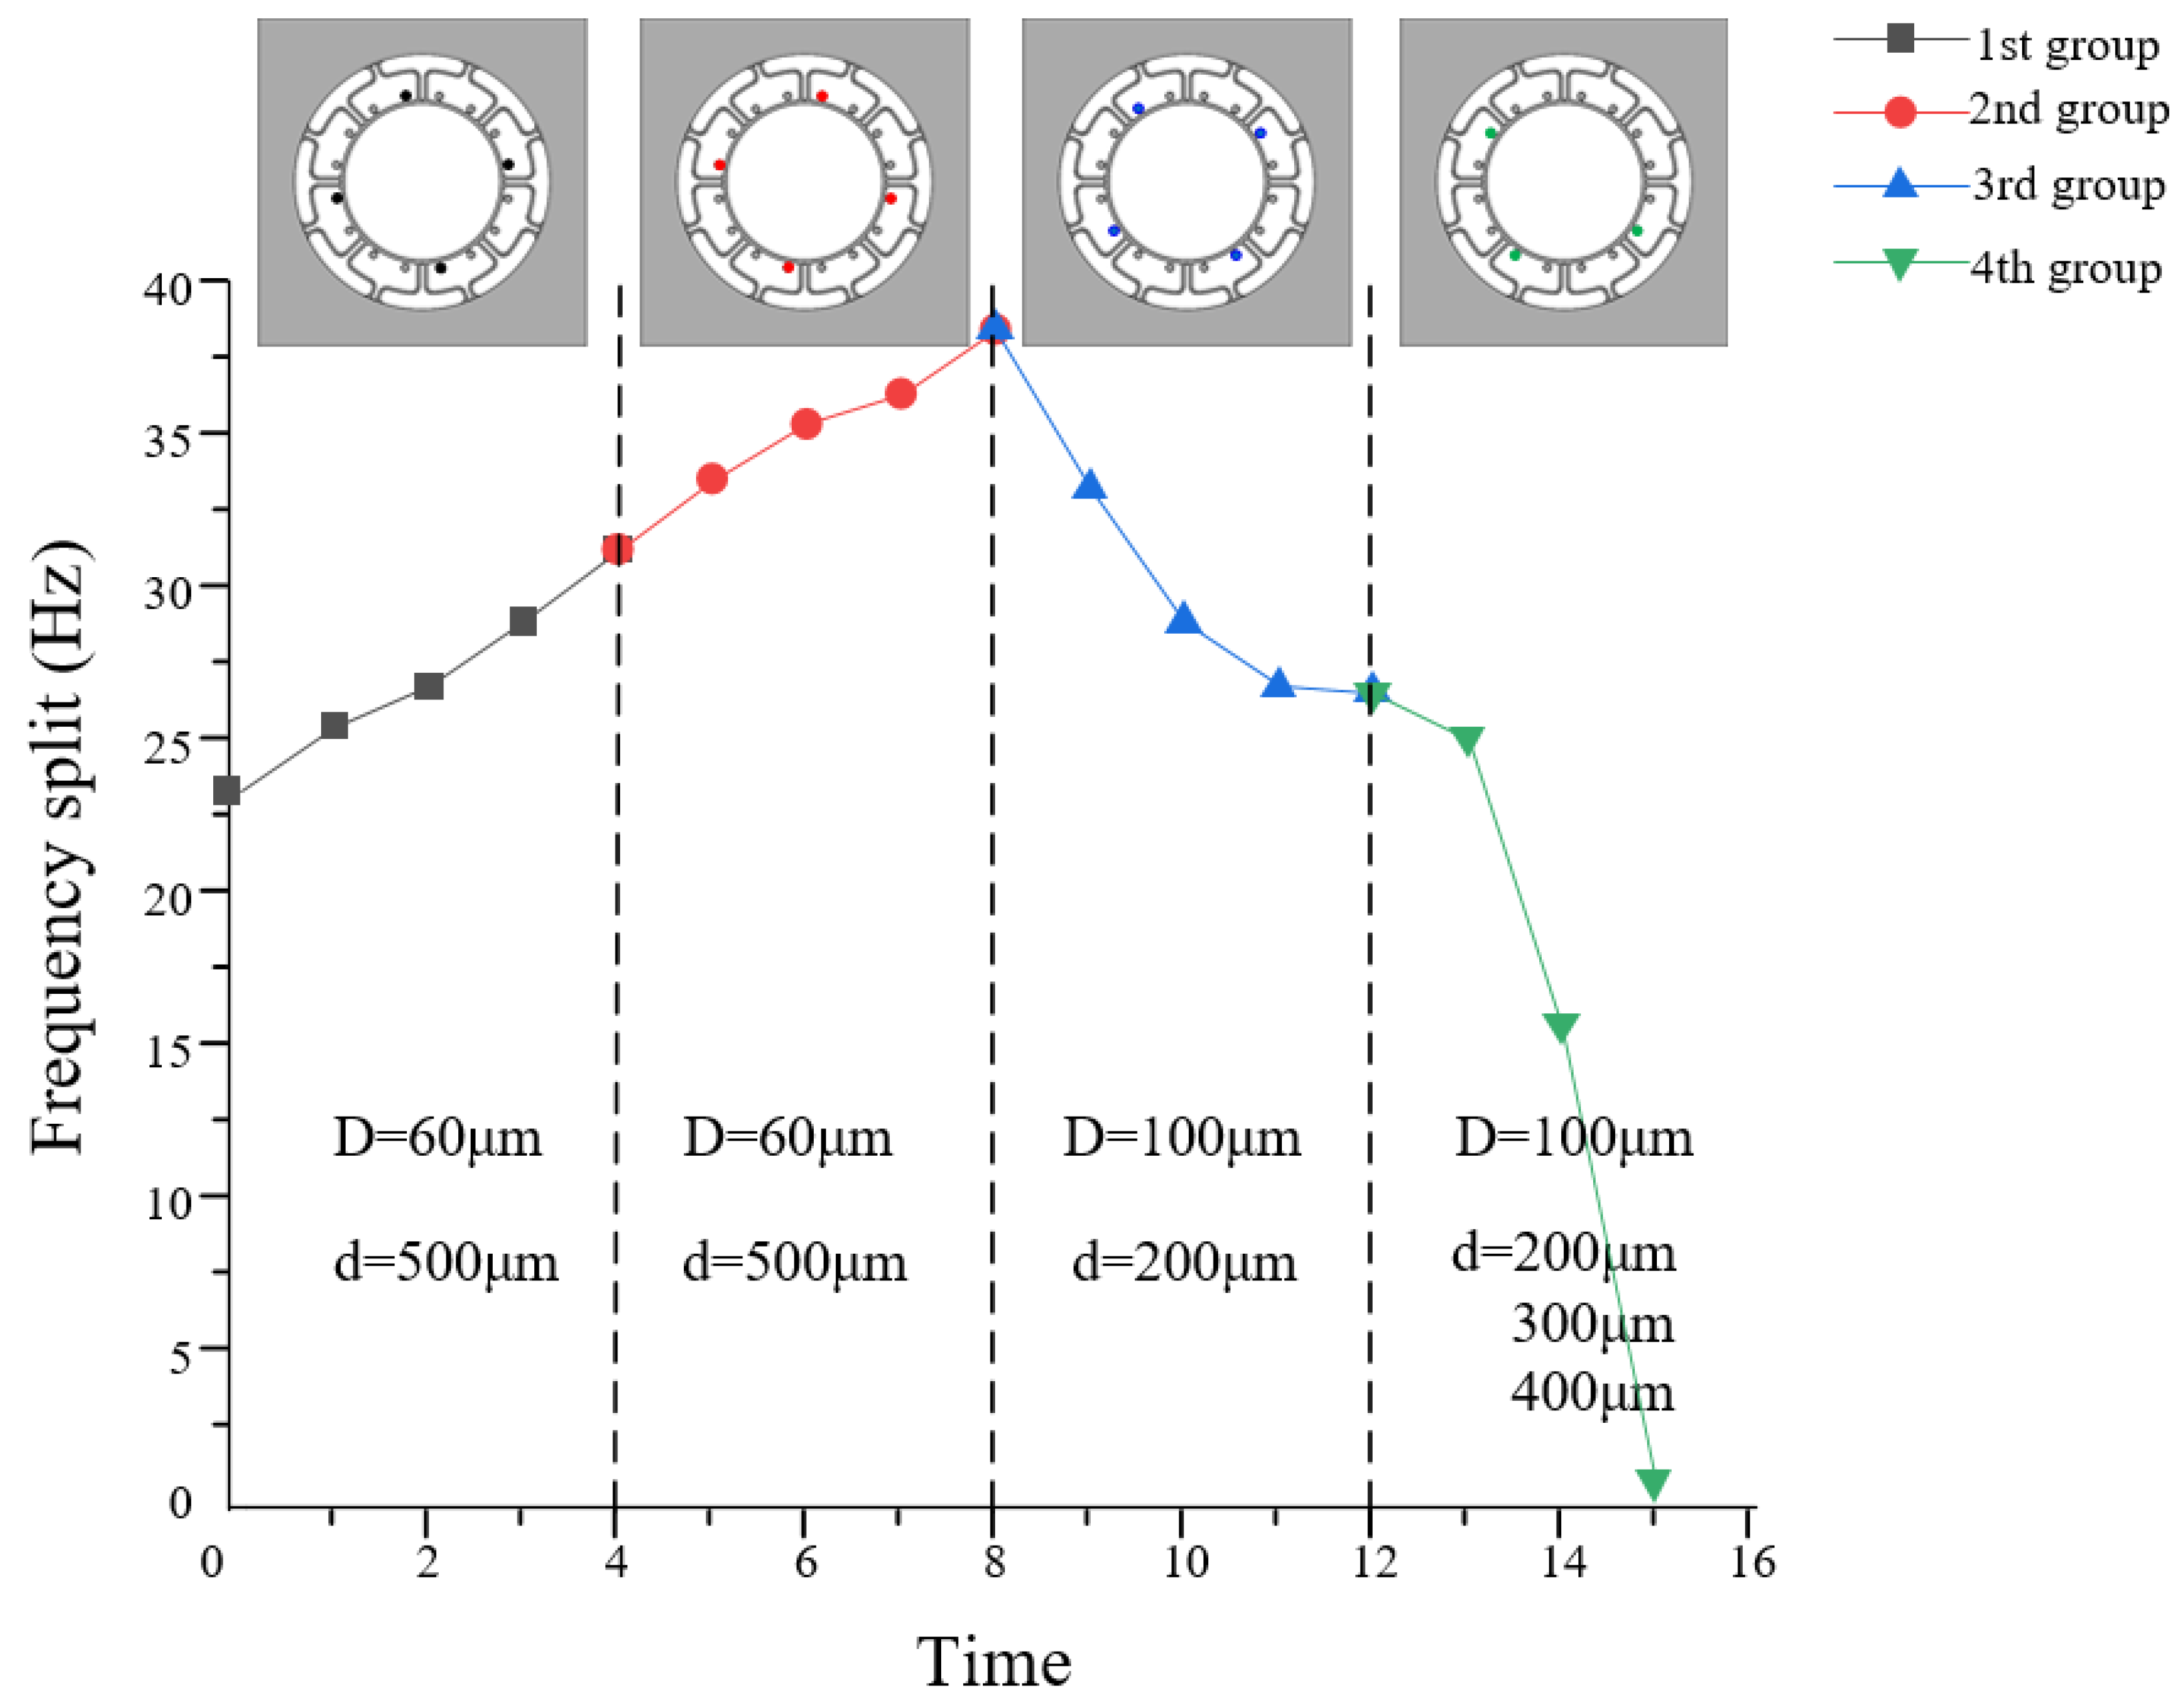
4.2. Tuning Experiment
5. Conclusions
Author Contributions
Funding
Acknowledgments
Conflicts of Interest
References
- Yang, S.; Wu, Z.; Jia, W.; Wu, G. Ultra-Low Relative Frequency Split Piezoelectric Ring Resonator Designed for High-Performance Mode-Matching Gyroscope. J. Microelectromech. Syst. 2022, 31, 6–8. [Google Scholar] [CrossRef]
- Chen, W.; Chen, H.; Guo, Y.; Xu, P.; Liu, X. Doubly-Decoupling Mechanism of a Fully-Symmetrical Micromachined Gyroscope. Nanotechnol. Precis. Eng. 2009, 7, 239–244. [Google Scholar]
- Hu, Y.; Zhong, H.; Lu, Y.; Duan, J.; Sun, X. Laser Trimming Method for Reducing Frequency Split of Cylindrical Vibrating Gyroscope. IOP Conf. Ser. Mater. Sci. Eng. 2020, 793, 012027. [Google Scholar] [CrossRef]
- Gallacher, B.J.; Hedley, J.; Burdess, J.S.; Harris, A.J.; McNie, M.E. Multimodal tuning of a vibrating ring using laser ablation. Proc. Inst. Mech. Eng. Part C J. Mech. Eng. Sci. 2003, 217, 557–576. [Google Scholar] [CrossRef]
- Schwartz, D.M.; Kim, D.; Stupar, P.; DeNatale, J.; M’Closkey, R.T. Modal Parameter Tuning of an Axisymmetric Resonator via Mass Perturbation. J. Microelectromech. Syst. 2015, 24, 545–555. [Google Scholar] [CrossRef] [Green Version]
- Wang, Y.; Asadian, M.H.; Shkel, A.M. Compensation of frequency split by directional lapping in fused quartz micro wineglass resonators. J. Micromech. Microeng. 2018, 28, 095001. [Google Scholar] [CrossRef] [Green Version]
- Efimovskaya, A.; Wang, D.; Shkel, A.M. Mechanical trimming with focused ion beam for permanent tuning of MEMS dual-mass gyroscope. Sens. Actuators A Phys. 2020, 313, 112189. [Google Scholar] [CrossRef]
- Schwartz, D.; Kim, N.J.; M’Closkey, R.T. Frequency Tuning of a Disk Resonator Gyro Via Mass Matrix Perturbation. J. Dyn. Syst. Meas. Control 2009, 131, 061004. [Google Scholar] [CrossRef] [Green Version]
- Viswanath, A.; Li, T.; Gianchandani, Y. High resolution micro ultrasonic machining for trimming 3D microstructures. J. Micromech. Microeng. 2014, 24, 065017. [Google Scholar] [CrossRef] [Green Version]
- Gao, K.; Li, Q.; Zhang, Y.; Lu, K.; Wang, P.; Xu, Y.; Li, B.; Xiao, D. Structural Optimization Design of Third-Antinode Nesting Ring MEMS Gyro Based on Mass-Stiffness Decoupling. Chin. J. Sens. Technol. 2019, 32, 1451–1456. [Google Scholar]


| Number | Frequency 1 (Hz) | Frequency 2 (Hz) | Split (Hz) |
|---|---|---|---|
| Initial | 23,159.9 | 23,200.3 | 40.4 |
| 11 | 23,170.6 | 23,201.2 | 30.6 |
| 15 | 23,170.8 | 23,201.9 | 31.1 |
| 3 | 23,170.7 | 23,201.9 | 31.2 |
| 7 | 23,170.8 | 23,201.8 | 31.0 |
| Order | Frequency 1 (Hz) | Frequency 2 (Hz) | Split (Hz) |
|---|---|---|---|
| 11 | 23,170.6 | 23,201.2 | 30.6 |
| 15 | 23,185.6 | 23,205.7 | 20.2 |
| 3 | 23,215.7 | 23,226.1 | 10.4 |
| 7 | 23,255.2 | 23,255.3 | 0.1 |
| Order | Frequency 1 (Hz) | Frequency 2 (Hz) | Split (Hz) |
|---|---|---|---|
| 1 | 23,165.1 | 23,239.4 | 74.3 |
| 3 | 23,203.4 | 23,243.9 | 40.5 |
| 2 | 23,217.7 | 23,273.2 | 54.5 |
| 4 | 23,246.8 | 23,287.2 | 40.1 |
| Order | Frequency 1 (Hz) | Frequency 2 (Hz) | Split (Hz) |
|---|---|---|---|
| Initial | 24,572.5 | 24,588.2 | 15.7 |
| 13 | 24,585.6 | 24,605.3 | 19.7 |
| 15 | 24,594.2 | 24,610.1 | 15.9 |
| 11 | 24,601.0 | 24,612.4 | 11.4 |
| 9 | 24,606.5 | 24,622.5 | 16.0 |
| Order | Frequency 1 (Hz) | Frequency 2 (Hz) | Split (Hz) |
|---|---|---|---|
| Initial | 24,606.5 | 24,622.5 | 16.0 |
| 2 | 24,609.1 | 24,624.3 | 15.2 |
| 6 | 24,612.5 | 24,626.5 | 14.0 |
| 8 | 24,616.0 | 24,628.9 | 12.9 |
| 12 | 24,620.8 | 24,634.4 | 11.6 |
| Experiment | Mass Block | Diameter (μm) | Depth (μm) |
|---|---|---|---|
| 1st | 5 | 60 | 500 |
| 1 | |||
| 9 | |||
| 13 | |||
| 2nd | 12 | 60 | 500 |
| 8 | |||
| 16 | |||
| 14 | |||
| 3rd | 2 | 100 | 200 |
| 6 | |||
| 10 | |||
| 14 | |||
| 4th | 15 | 100 | 200 |
| 11 | 300 | ||
| 7 | 400 |
Publisher’s Note: MDPI stays neutral with regard to jurisdictional claims in published maps and institutional affiliations. |
© 2022 by the authors. Licensee MDPI, Basel, Switzerland. This article is an open access article distributed under the terms and conditions of the Creative Commons Attribution (CC BY) license (https://creativecommons.org/licenses/by/4.0/).
Share and Cite
Chen, C.; Wu, K.; Lu, K.; Li, Q.; Wang, C.; Wu, X.; Wang, B.; Xiao, D. A Novel Mechanical Frequency Tuning Method Based on Mass-Stiffness Decoupling for MEMS Gyroscopes. Micromachines 2022, 13, 1052. https://doi.org/10.3390/mi13071052
Chen C, Wu K, Lu K, Li Q, Wang C, Wu X, Wang B, Xiao D. A Novel Mechanical Frequency Tuning Method Based on Mass-Stiffness Decoupling for MEMS Gyroscopes. Micromachines. 2022; 13(7):1052. https://doi.org/10.3390/mi13071052
Chicago/Turabian StyleChen, Chuanfu, Kai Wu, Kuo Lu, Qingsong Li, Chengxiang Wang, Xuezhong Wu, Beizhen Wang, and Dingbang Xiao. 2022. "A Novel Mechanical Frequency Tuning Method Based on Mass-Stiffness Decoupling for MEMS Gyroscopes" Micromachines 13, no. 7: 1052. https://doi.org/10.3390/mi13071052
APA StyleChen, C., Wu, K., Lu, K., Li, Q., Wang, C., Wu, X., Wang, B., & Xiao, D. (2022). A Novel Mechanical Frequency Tuning Method Based on Mass-Stiffness Decoupling for MEMS Gyroscopes. Micromachines, 13(7), 1052. https://doi.org/10.3390/mi13071052