Abstract
In this paper, a SAW winding tension sensor is designed and data fusion technology is used to improve its measurement accuracy. To design a high-measurement precision SAW winding tension sensor, the unbalanced split-electrode interdigital transducers (IDTs) were used to design the input IDTs and output IDTs, and the electrode-overlap envelope was adopted to design the input IDT. To improve the measurement accuracy of the sensor, the particle swarm optimization-least squares support vector machine (PSO-LSSVM) algorithm was used to compensate for the temperature error. After temperature compensation, the sensitivity temperature coefficient αs of the SAW winding tension sensor was decreased by an order of magnitude, thus significantly improving its measurement accuracy. Finally, the error with actually applied tension was calculated, the same in the LSSVM and PSO-LSSVM. By multiple comparisons of the same sample data set overall, as well as the local accuracy of the forecasted results, which is , it is easy to confirm that the output error predicted by the PSO-LSSVM model is , much smaller relative to the LSSVM’s . As a result, a new way for performing data analysis of the SAW winding tension sensor is provided.
1. Introduction
Industrial winding equipment is an essential process of intelligent manufacturing; modern winding equipment with high speed, high precision development, and tension control technology is critical [1]. Tension is a vital evaluation index when monitoring the running state of the winding system. The tension sensor is one of the essential devices for obtaining the tension change of winding equipment, which plays a vital role in improving the performance and parameters of winding capacity equipment [2]. A tension sensor is widely used to monitor the tension of strip, cloth, strip, and linear materials in the production process [3]. In the winding process, it is necessary to keep the winding tension stable to avoid the phenomenon of winding breakage and flaring.
The precision of winding tension control will directly affect the adaptability of the coil and the quality of the product [4]. Improper tension will affect the transmission effect and production quality of the coil. If the winding tension is too large, the coil is easy to deform or even fracture, affecting the quality of the coil and the appearance of the structure. If the winding tension is too small, it will lead to slippage, lack of form, loose structure, and wrinkles, resulting in rough and uneven rolls, reducing the utilization rate of rolls, etc., thus affecting production quality and efficiency [5].
Tension control is one of the most widely used technologies. In textile yarn winding, M. Ali et al. studied the Arduino Mega 2560 controller to achieve tension control when the yarn is rewound and dyed on a plastic cone [6]. In fiber winding, L. Wen et al. studied a 16-tow prepreg slitting and winding machine, which can automate the place of fiber [7]. In lithium battery aluminum-plastic film winding, Y. Xiao et al. studied the fuzzy PID tension control method of the lithium battery electrode mill based on the Genetic Algorithm (GA) [8]. In slitting machine winding, C. Jiang et al. studied the nonlinear system characteristics of the unwinding system, the unstable diaphragm tension caused by the uncertain interference, and the inaccurate model in the unwinding process [9]. In copper foil winding, I. Jo et al. studied a roll-to-roll (R2R) graphene synthesis system where tension control is crucial to copper foils [10]. In printing and dyeing winding, Ç. Burak et al. studied a method of unwinding and winding textile printing and dyeing machines, which applied to a system of verification of the quality of the textile yarn through image processing [11]. In coil winding, H. Hwang et al. investigated the disturbance observer (DOB) to enhance the robustness of external disturbances to coil mass [12].
The surface acoustic wave (SAW) device has been widely used in mechanical engineering, aeronautics and astronautics, signal processing [13], nondestructive testing, sensor technology, and so on [14], and as important sensing technologies, SAW sensors have exhibited promising characteristics because of their high sensitivity, fast response, excellent specificity, reversibility, battery-powered operation, small size, and low cost, thus offering extensive potential use in the future [15]. The SAW sensors can be used to measure temperature [16], humidity [17], gas [18], force [19], and so on.
In this paper, we focus on the research of the SAW winding tension sensor. As is known to us, many kinds of sensors can be used to measure tension, such as capacitive tension sensors, resistance tension sensors, hall tension sensors, and so on. However, the output signals of these traditional tension sensors are analog signals, which are susceptible to environmental factors. In contrast, the output signal of the SAW force sensor is a frequency signal, which is less susceptible to interference. In addition, compared to the traditional force sensor, the cost of the SAW winding tension sensor is relatively low.
However, it cannot ignore the effect of temperature on its measuring accuracy, so to further improve its measurement accuracy, temperature compensation has to be done. This paper used data fusion technology to overcome the shortcomings of the hardware compensation methods. That is, the PSO-LSSVM algorithm was used to compensate for the temperature error of the SAW winding sensor in this paper. We also used the least-squares method to obtain the fitting equation between the output frequency shift and the force of the sensor under different temperature conditions after temperature compensation.
This paper is organized as follows. After this introductory Section 1, the principle of temperature compensation for winding tension sensors by using PSO-LSSVM is shown in Section 2. The SAW winding tension sensor is designed in Section 3. In Section 4, the SAW winding tension sensor is measured by the winding measurement system. Temperature compensation results and analysis are shown in Section 5. This paper’s conclusions are offered in Section 6.
2. Principle of Temperature Compensation for SAW Winding Tension Sensor by Using PSO-LSSVM
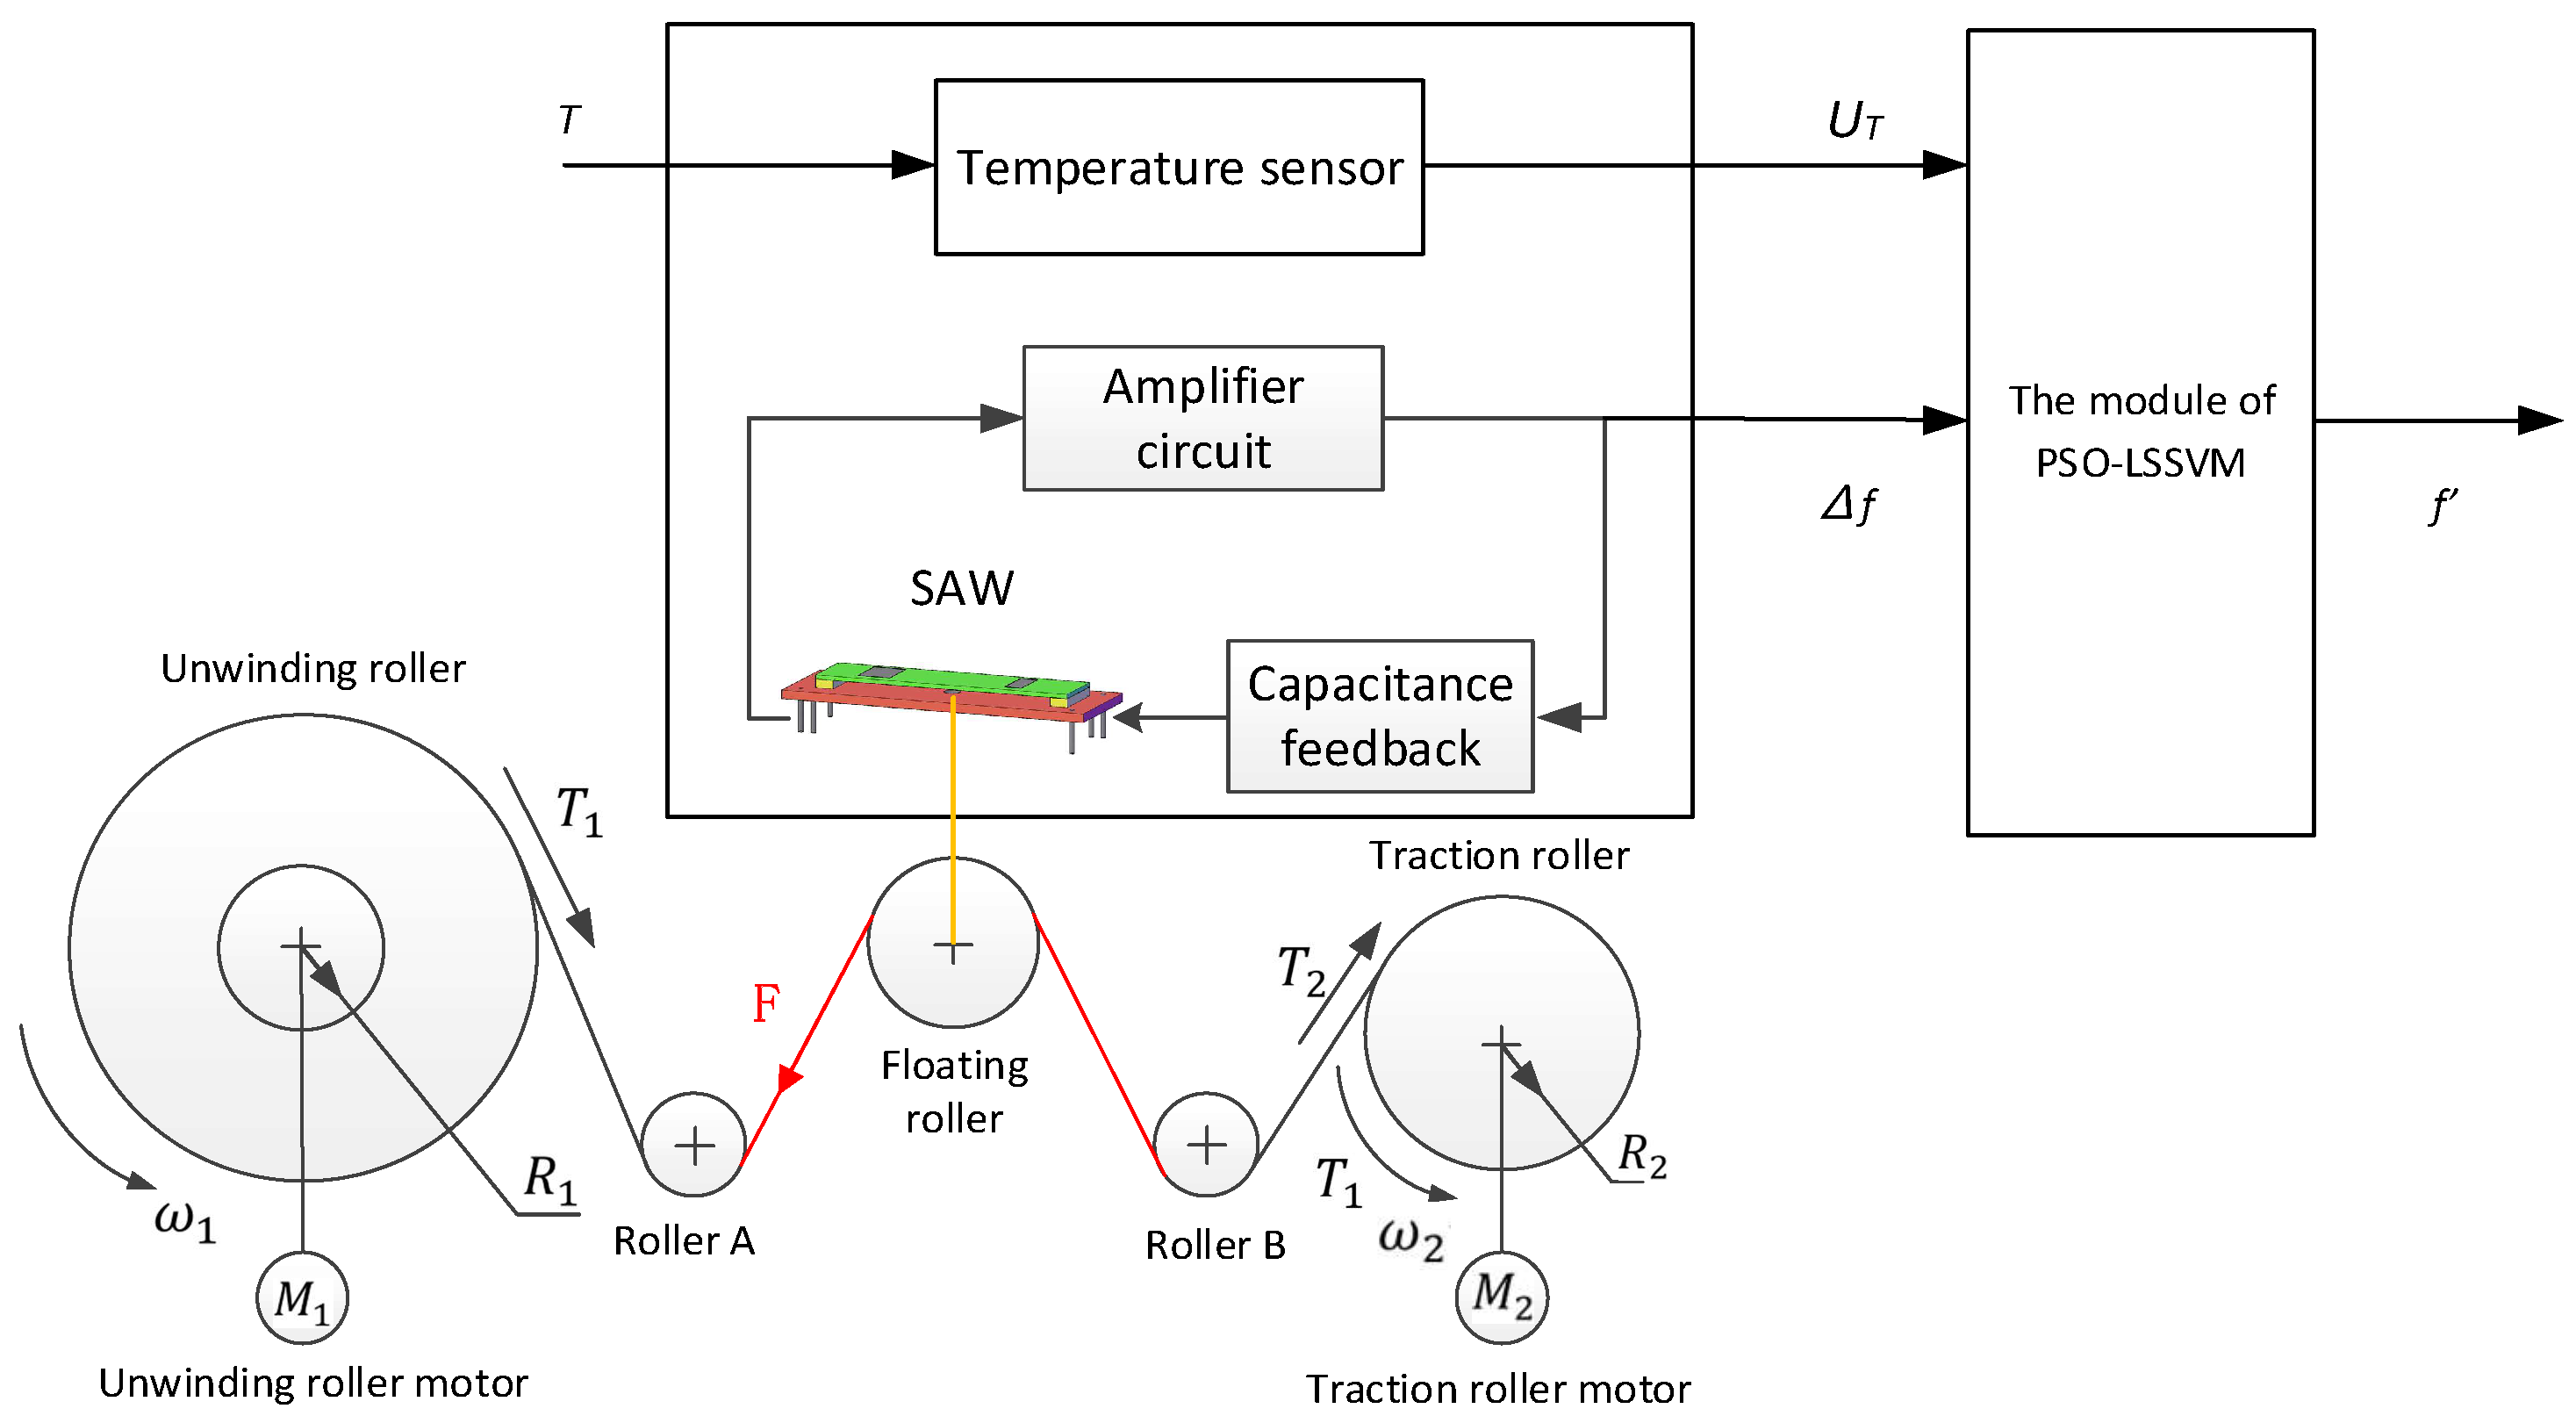
Figure 1 is the schematic diagram of temperature compensation for the SAW winding tension sensor using PSO-LSSVM. Figure 1 shows the temperature compensator of the SAW winding tension sensor, which is based on data fusion technology to establish a model that can eliminate temperature interference. It mainly consists of the following three parts.
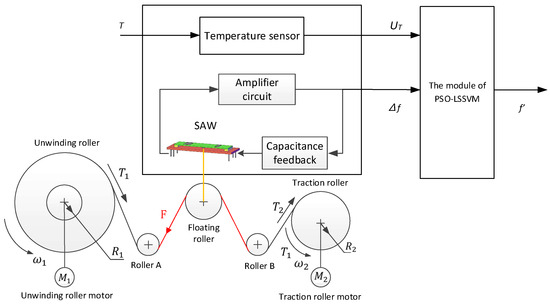
Figure 1.
The schematic of the SAW winding tension sensor with differential dual circuit system.
- (1)
- The unwinding roller motor drives the unwinding roller, and the traction roller motor drives the traction roller to work, causing the tension change of the coil. Finally, the surface acoustic wave device changes through the floating roller;
- (2)
- The surface acoustic wave winding tension sensor is a delay device composed of an amplifier and feedback circuit. The working environment temperature should be detected by a temperature sensor, which is installed beside the SAW winding tension sensor;
- (3)
- The model of eliminating temperature interference of the surface acoustic wave winding tension sensor is based on the data fusion of the PSO-LSSVM model, which finally achieves the purpose of temperature compensation of the sensor.
The output frequency variation of the SAW winding tension sensor and the output of the temperature sensor is the input of the temperature compensator, and the compensated result is the output.
3. Design of SAW Winding Tension Sensor
3.1. Design of the Input and Output IDT Using Unbalanced Split-Electrode Interdigital Transducers
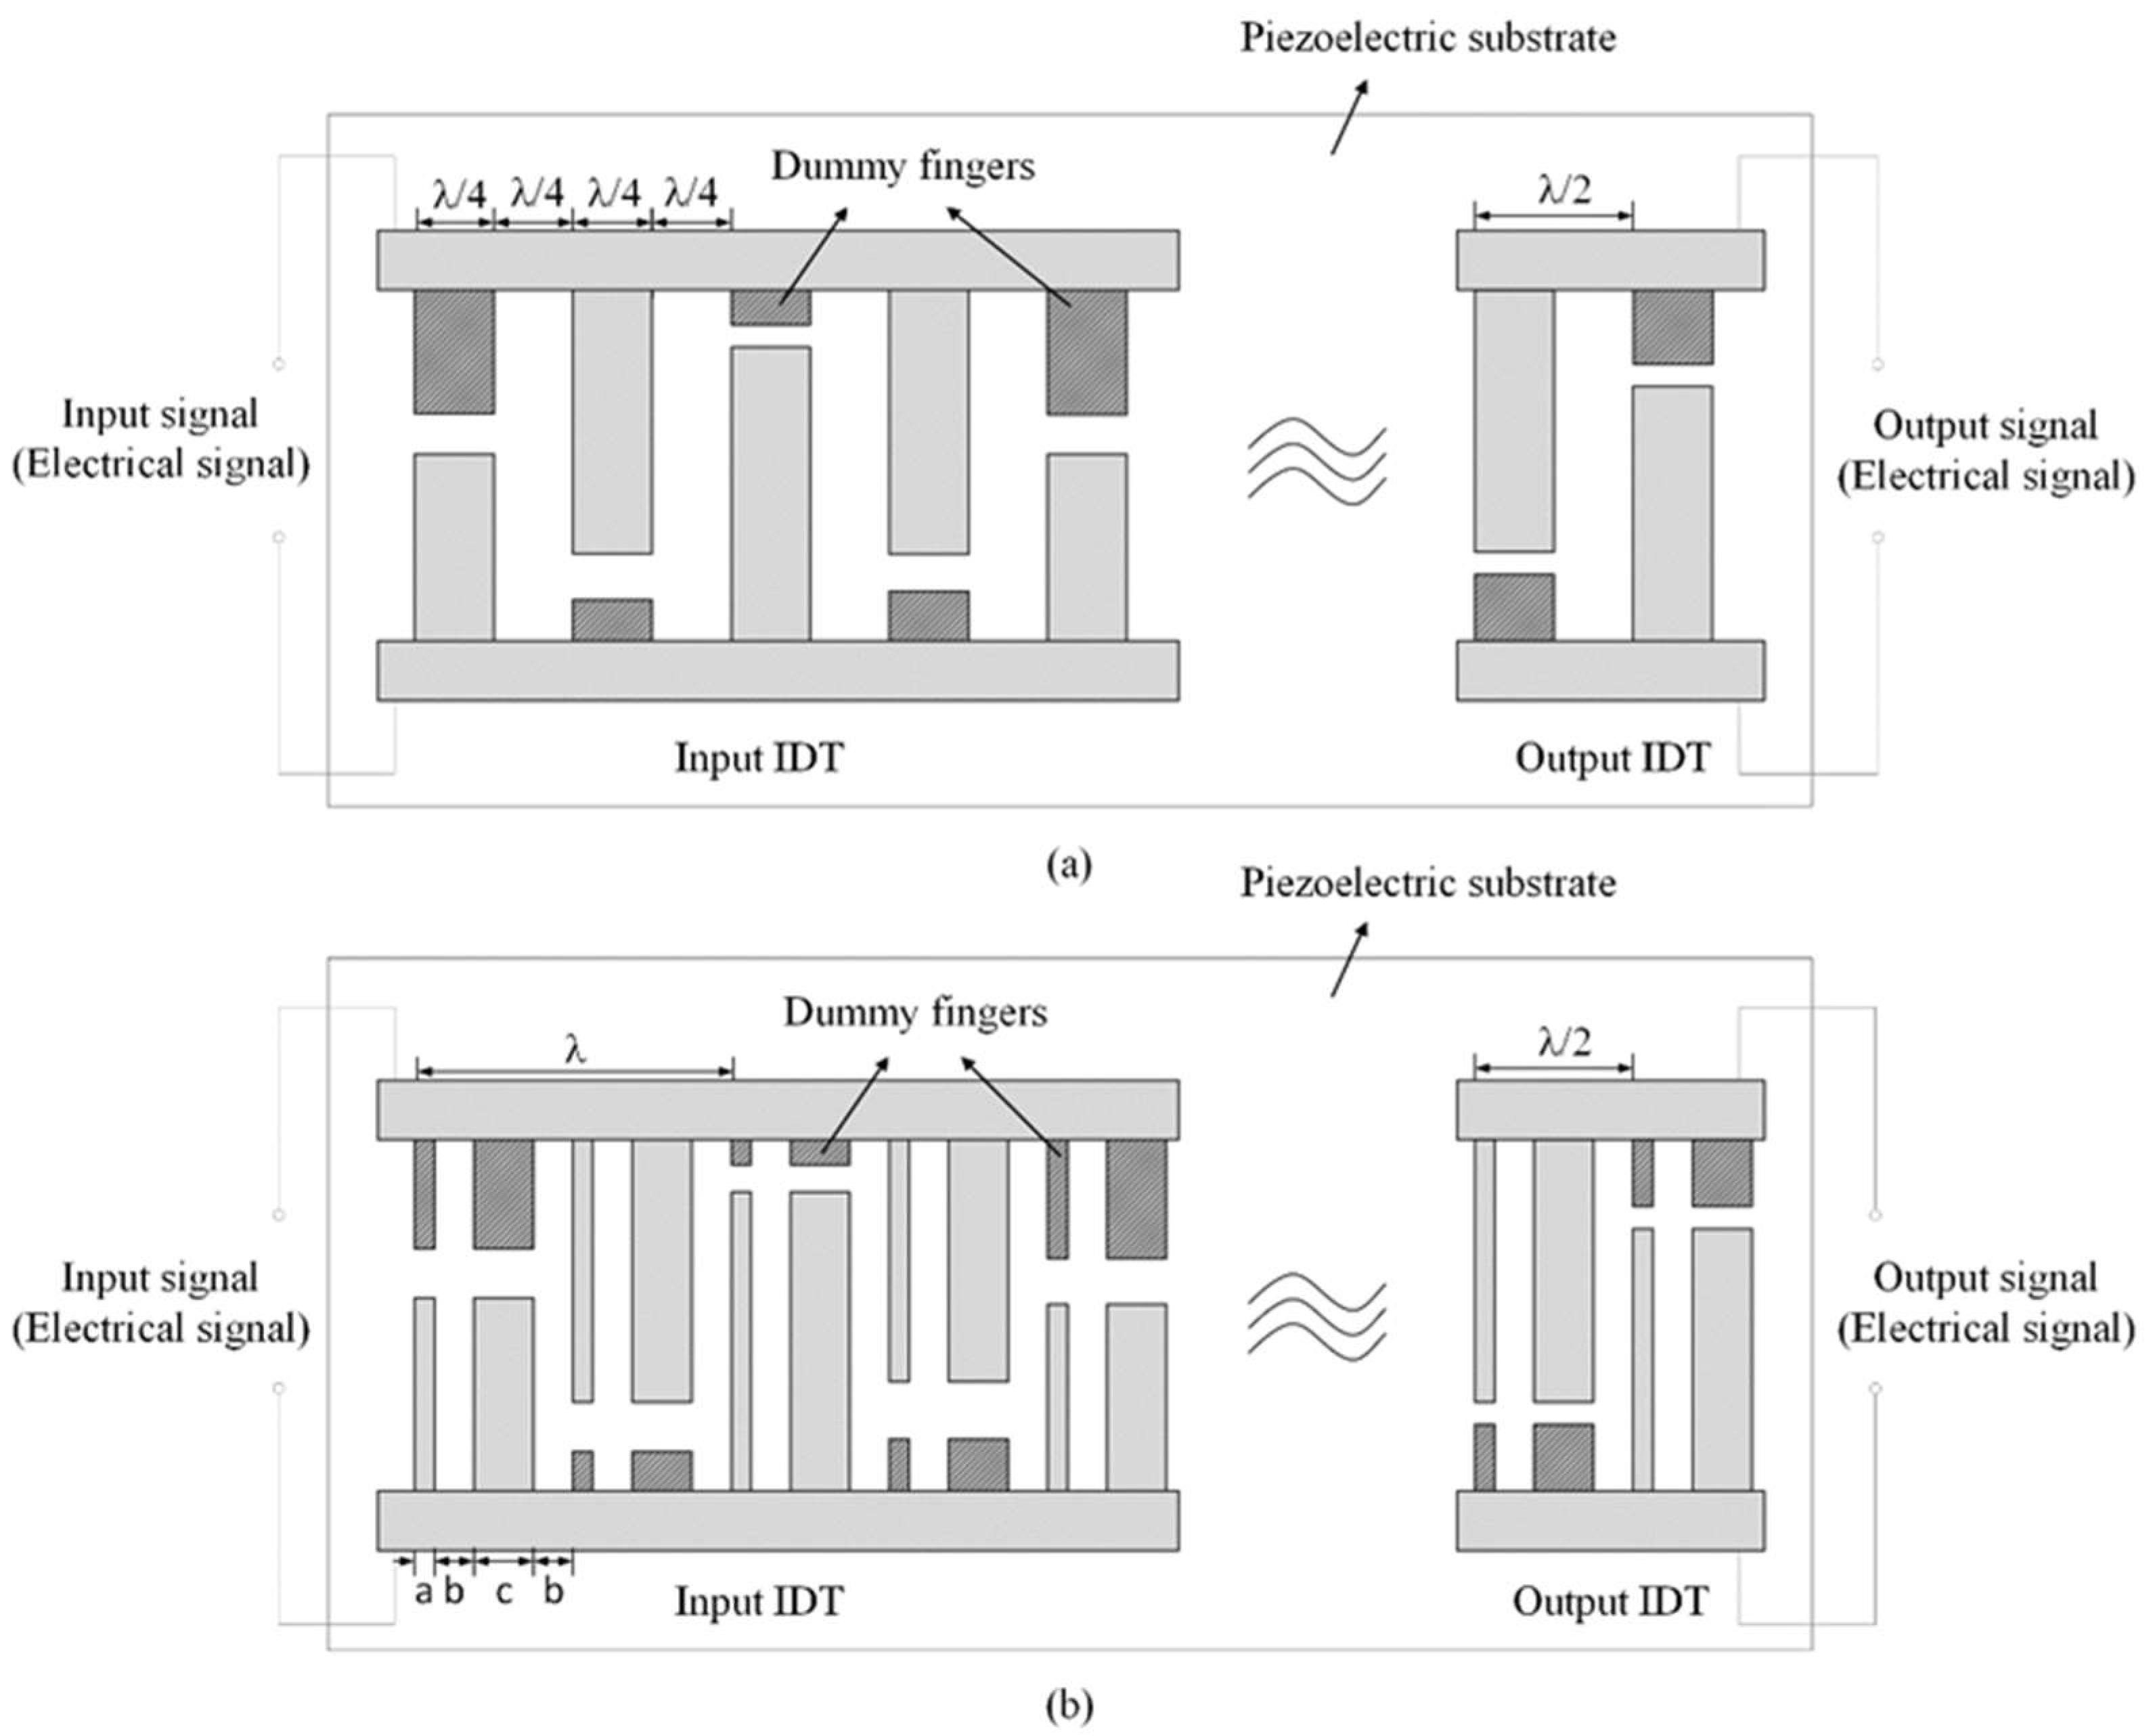
The input and output frequency characteristics of the SAW sensor are susceptible to sidelobe interference, which will affect the measurement accuracy of the SAW sensor. The traditional IDT adopts uniform single-electrode interdigital transducers, which means the width of the electrode is equal to the spacing of the electrode, as shown in Figure 2a. However, this design method will cause the IDT to produce a second-order effect [17]. That is, it will make the marginal reflection of the IDT accumulate, thus increasing the sidelobes of the SAW sensor. To suppress the sidelobes, we adopted the unbalanced split-electrode interdigital transducers, namely, in Figure 2b, within each length period, each electrode of the input and output IDT is split into two electrodes by 1:3 according to its width a, and then the split-electrodes are arranged at equal intervals. By adopting this structure, the phase of the marginal reflection is close to 180 degrees so that most of the marginal reflection can be offset near the center frequency [19].

Figure 2.
Improved SAW delay-line sensor based on the unbalanced split-electrode interdigital transducers. (a) the uniform single-electrode interdigital transducers; (b) the unbalanced split-electrode interdigital transducers.
As shown in Figure 2b, a and c respectively, the widths of the split-electrode, b and d is the electrode spacing, which satisfies . The center frequency of the sensor design in this paper is 60 MHz, and the selected piezoelectric substrate material is ST-X quartz (SiO2). The sound wave in this paper is the Rayleigh wave, and its propagation velocity in ST-X quartz is . We have
Thus, we can obtain .
3.2. Design of the Electrode-Overlap Envelope of the Input IDT
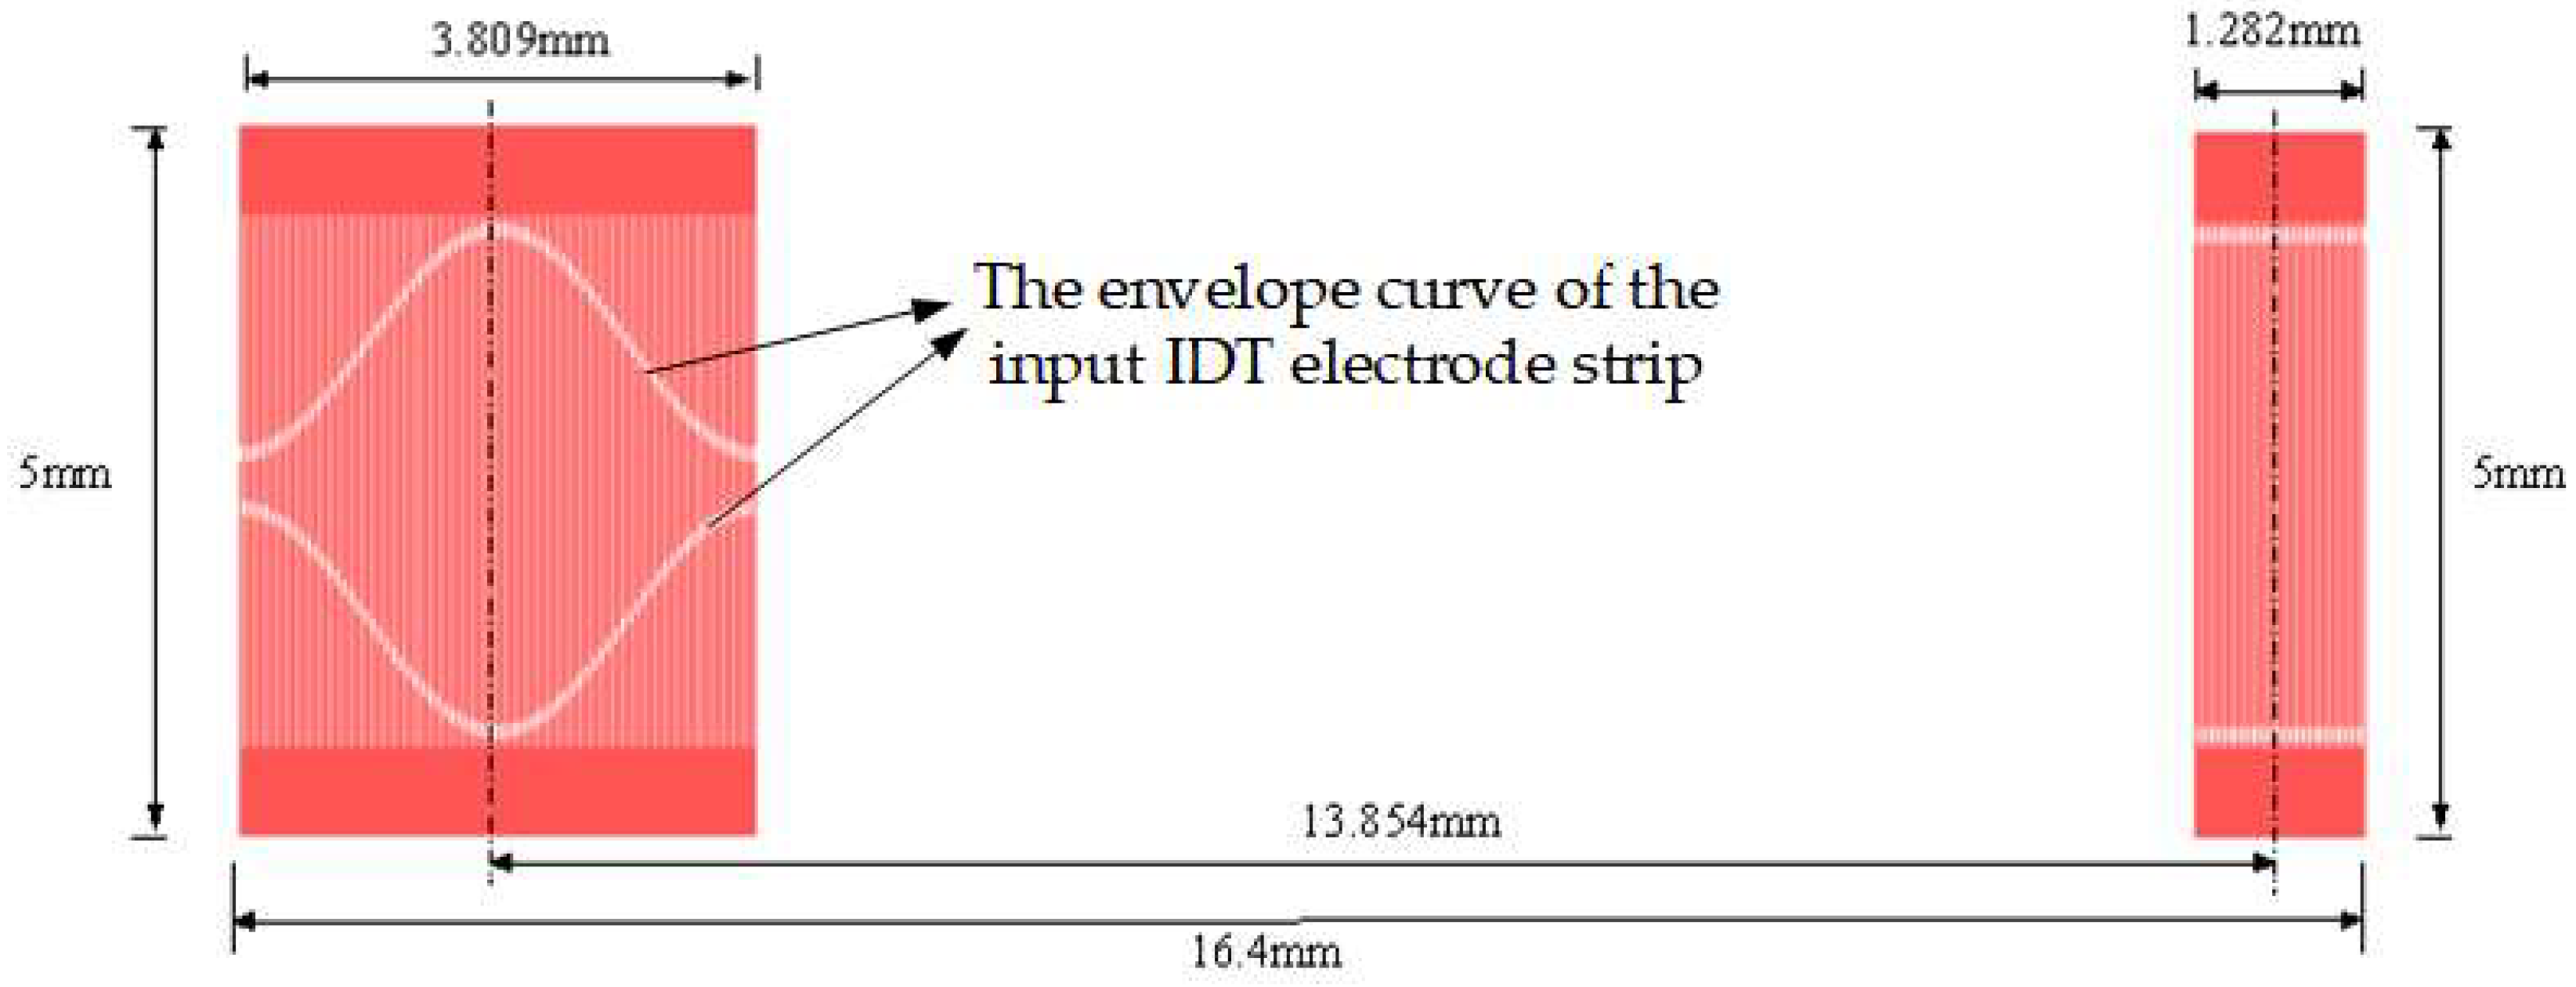
To further suppress the sidelobes of the SAW sensor, the electrode-overlap envelope of the input IDT is weighted according to the Hamming function [20,21], which is a kind of cosine square function, and it is shown as
where τ is the time length of the input IDT. The electrode-overlap envelope of the input IDT is shown in Figure 2. In addition, the frequency response of Equation (2) is
Equation (3) indicates that 99.96% of the energy is concentrated in the central lobes, and the sidelobes level is extremely low so that it can effectively suppress the sidelobes.
The output transducer is the uniform split transducer. In order to decrease the bulk acoustic wave, the pairs of the electrode number should be more than 20 [22], so we selected the output IDTs finger pairs No = 24.
The overall response H(f) can be split into two summations relating input and output IDTs responses [23], exactly as in Equation (4).
where is the output IDTs frequency response, and is the input IDTs frequency response.
The output IDTs frequency response is
where A is the maximum aperture of the IDTs, xm is the m finger pair of the output finger overlap.
The output IDTs frequency response is
where xn is the n finger pair of the output finger overlap.
The −3 dB bandwidth can be written as [24]
We selected , so we calculated the relationship between B and , that was
The bandwidth of the surface acoustic wave device in the winding tension sensor designed in this paper is , then the window length .
To increase the range of the sensor, it is necessary to ensure that the maximum energy of the frequency response is contained within the bandwidth of −3 dB [25]. In this paper, the device bandwidth is controlled by adjusting the window opening time. The window length is defined as N, which must be satisfied to ensure that the surface acoustic wave device has a linear phase
Equation (9) is substituted into Equation (2), i.e.,
Substitute into the Equation (10)
Equation (11) is the expression of the function of the envelope curve of the input IDT electrode strip, and is the propagation time of the surface acoustic wave on the substrate.
The piezoelectric substrate used in the tension sensor is ST-X tangential quartz, and its electromechanical coupling coefficient is only 0.14% [26]. The propagation velocity of the surface acoustic wave on the ST-X tangent quartz substrate , the center frequency of the designed surface acoustic wave device, , and the input IDT adopts the unbalanced split-electrode design, and the design parameters are shown in Table 1. Figure 3 shows the SAW transducer mask plate layout by L-edit V 8.30 software. Figure 4 shows the SAW winding tension sensor fabricated on ST-X Quartz substrates.

Table 1.
Design parameters of SAW winding tension sensor.

Figure 3.
SAW transducer mask plate layout by L-edit software.
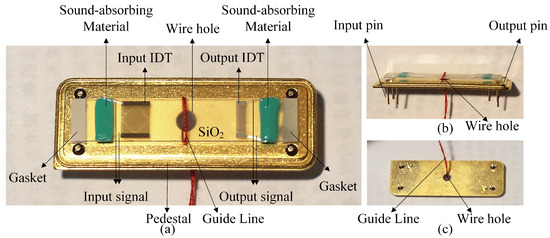
Figure 4.
SAW winding tension sensor fabricated on ST-X Quartz substrates. (a) the front view; (b) the side view; (c) the bottom view.
4. Measurement of the SAW Winding Tension Sensor
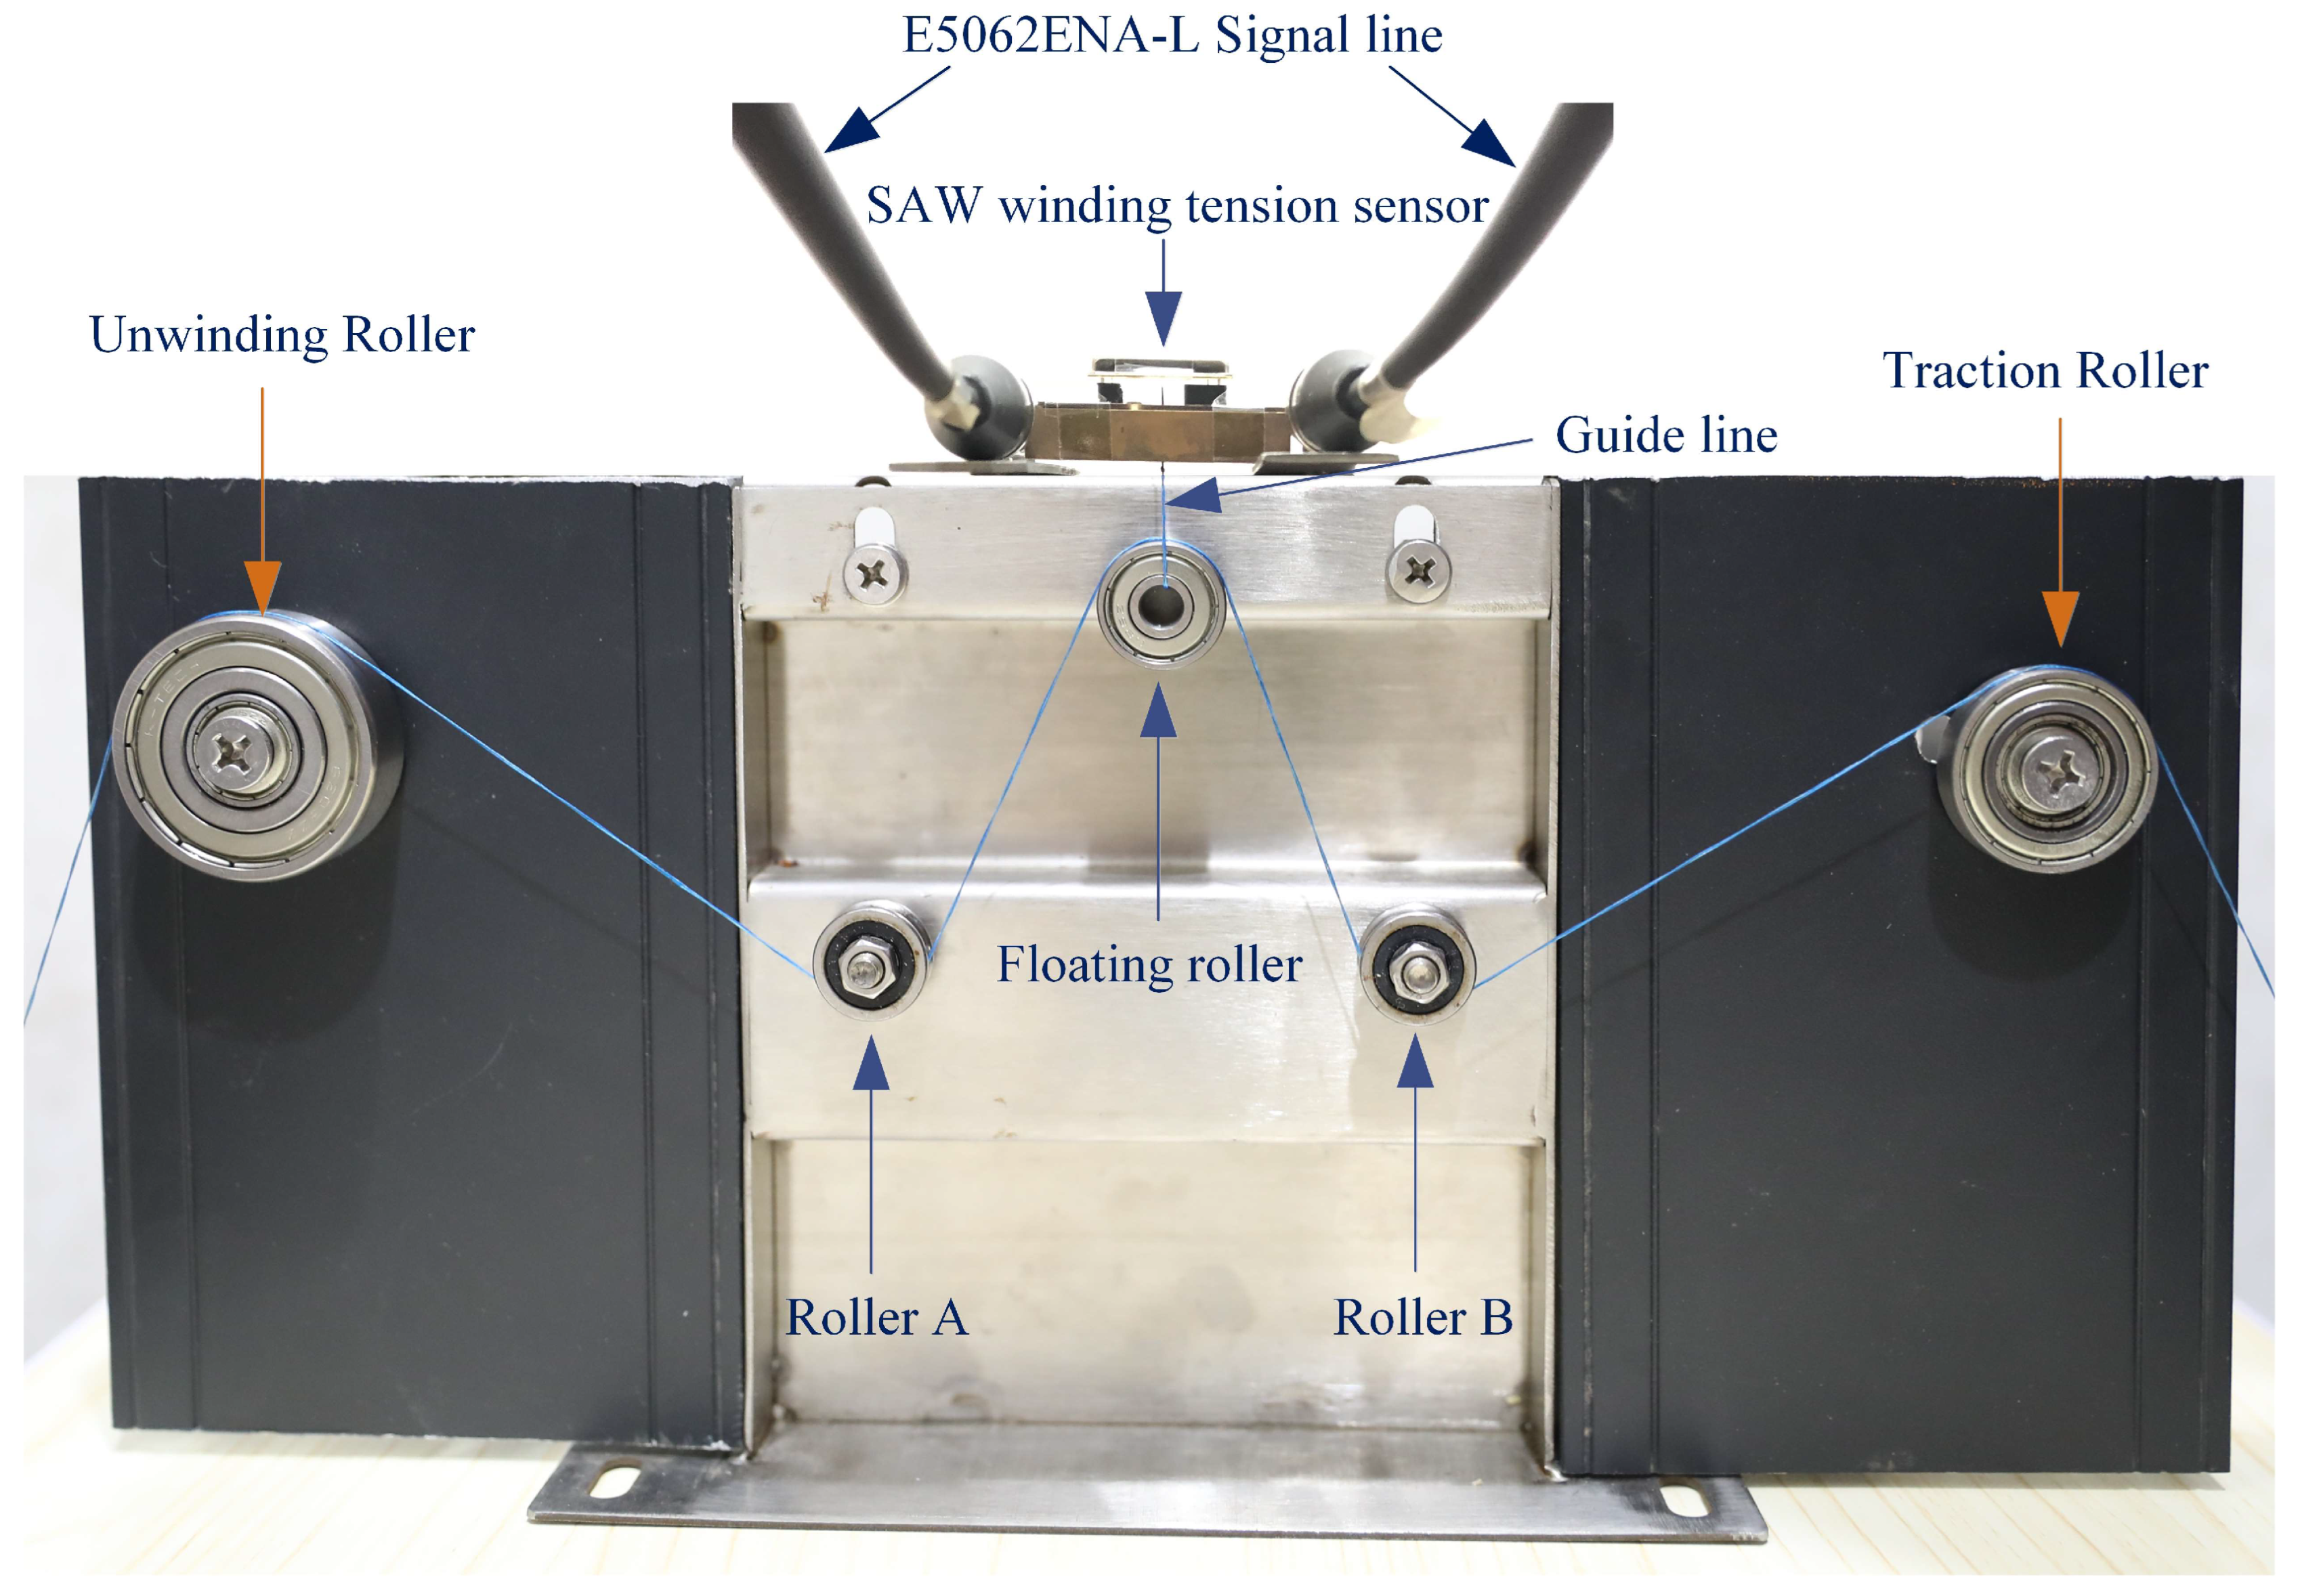
To the SAW winding tension sensor’s properties, a winding measurement system was developed to explore the association of the input variables with the output variables, as shown in Figure 5. In this measurement system, we applied the network analyzer (E5061 A) to test the SAW winding tension sensor. The network analyzer connected the input and output wires with the testing base. The base consisted of the circuit modules that the SAW winding tension sensor pins to create the path from the sensor to the network analyzer. The frequency characteristics of the SAW winding tension sensor are shown in Figure 6.
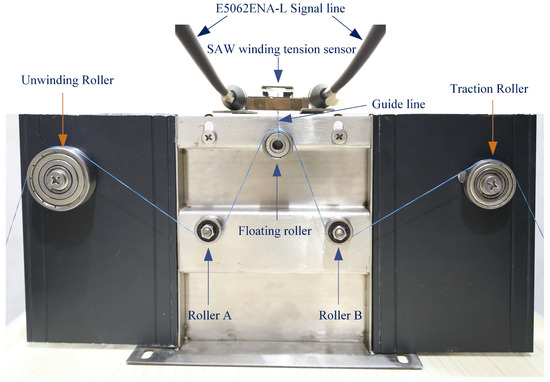
Figure 5.
SAW winding tension measurement system.
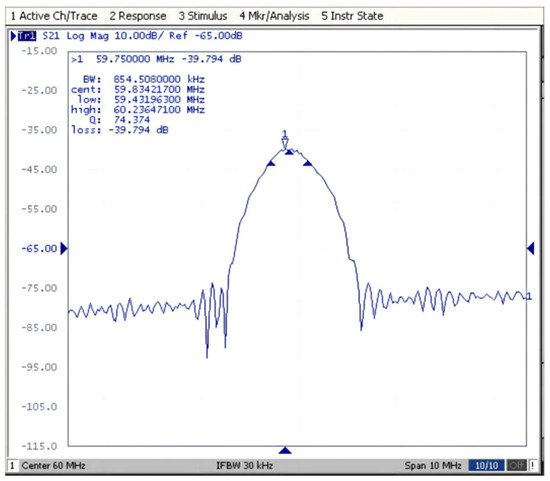
Figure 6.
Frequency characteristics of the SAW winding tension sensor.
The winding tension exerted on the sensor was between 0 N and 1 N, and the measurement temperature changed from 30 °C to 50 °C. The tension of the winding’s initial value is 0 N, with 0.1 N introduced each time, and the final value is 1 N. The tension value of the winding and the matching frequency difference of the SAW winding tension sensor is recorded. To enrich the sample ability and improve the accuracy of the derived conversion association of the output frequency difference with the winding tension of the SAW winding tension sensor, we increase the amount of testing with the same experimental conditions. Since the output frequency of the SAW winding tension sensor read by a network analyzer is dynamic, the output frequency under the same winding tension ought to select a comparatively stable value. We set the number of tests to 10 and obtained the testing data indicated in Table 2.
Table 2.
Measurement data of the SAW winding tension sensor under different temperatures.
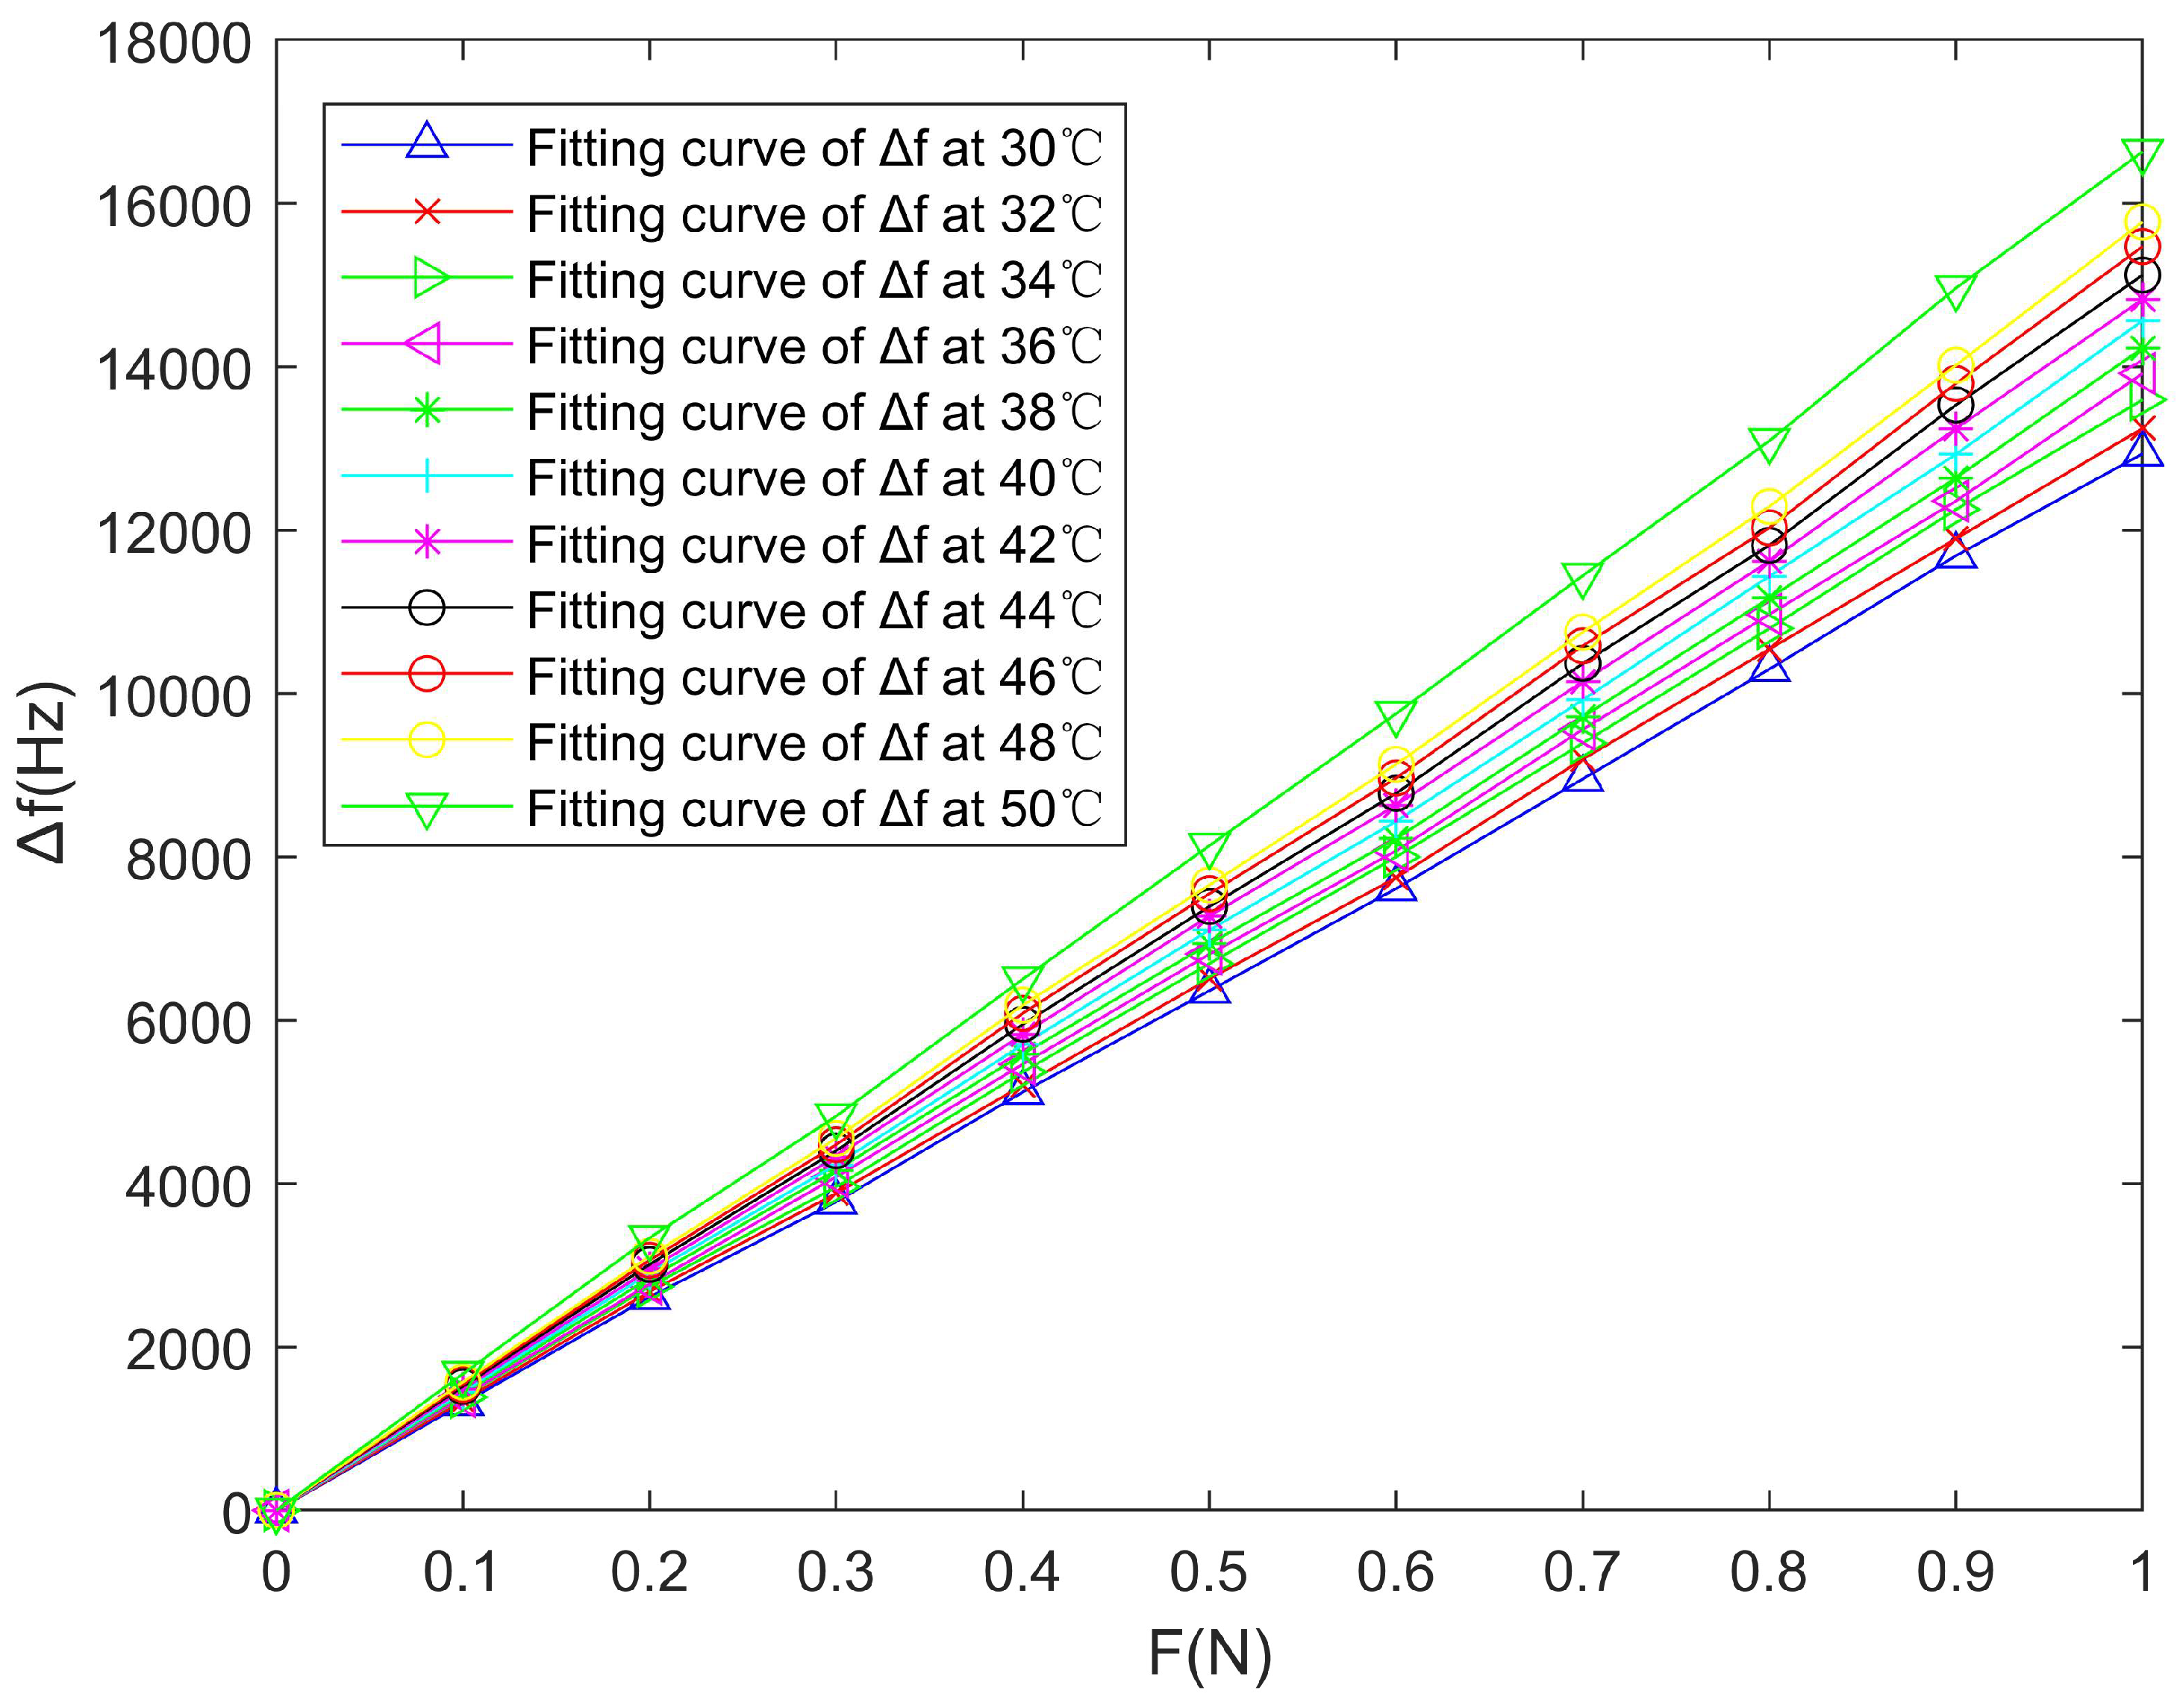
In Figure 6, the frequency characteristics of the SAW winding tension sensor perform very well. However, in Figure 7, the measurement results are quite different under different temperatures, which indicates that the temperature variation can seriously affect its measurement accuracy.
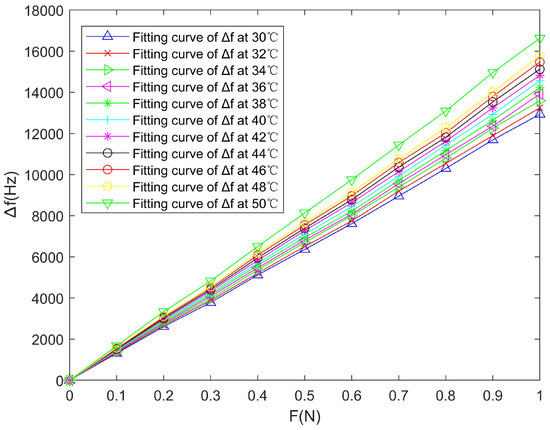
Figure 7.
Curve fitting between the tension and the output frequency shift of the SAW winding tension sensor under different temperatures.
In this paper, the temperature sensitivity coefficient measures the effect of temperature on the SAW winding tension sensor. The smaller the temperature sensitivity coefficient of the sensor, the stronger its resistance to temperature interference. The temperature sensitivity coefficient αs can be expressed as
where is the maximum temperature variation range, is the maximum deviation of the output frequency shift under all different temperature conditions in the full-range magnitude of the winding tension , and is the full-range magnitude of the output frequency shift . The larger the temperature sensitivity coefficient αs, the greater the influence of temperature on the measurement accuracy of the sensor. As shown in Table 2 and Figure 7, , (when ), and , so
The result of Equation (13) further verifies that the temperature variations can greatly affect the measurement accuracy of the winding tension sensor. Therefore, to improve the measurement accuracy of the sensor, temperature compensation must be done.
5. Temperature Compensation Results and Analysis
The LSSVM algorithm is a supervised learning technique that offers a model designed specifically for addressing regression and classification problems [27]. Compared to the SVM model, LSSVM transforms the quadratic programming problem of SVM into a linear equation-solving problem, thereby increasing computational complexity [28]. This model exhibits exceptional nonlinear modeling capabilities, enabling it to adapt to complex relationships by mapping data into high-dimensional spaces through kernel tricks. Consequently, it aids in predicting the impact of sensor temperature on output. With this advantage, LSSVM can effectively capture complex temperature sensor output relationships in sensor temperature compensation, improving the accuracy of temperature compensation while enhancing prediction accuracy [29]. However, the key parameter regularization parameter γ and kernel function parameters σ are crucial parameters for the model’s generalization ability and convergence efficiency. The values of these two parameters usually need to be manually adjusted based on specific issues [30].
To sum up, the selection of the above parameters γ and σ is performed blindly, which increases the likelihood of encountering local optimal solutions. As a global optimization algorithm, the Particle Swarm Optimization (PSO) algorithm possesses robustness, fast convergence rate, and strong global search capability [31]. By employing this algorithm for parameter selection purposes, errors resulting from experiential or random choices can be circumvented while enabling automatic and efficient adjustment of parameters γ and σ to achieve a globally optimal solution that aligns with the current problem [32]. The parallelism inherent in this algorithm proves highly advantageous for optimizing large-scale datasets and complex models. LSSVM integrates the PSO algorithm into its framework to automatically adapt parameters γ and σ, enhancing model flexibility across diverse datasets and problems [33,34,35]. This adaptive nature coupled with global optimization properties becomes crucial for sensor temperature compensation since temperature variations can exert intricate non-linear effects on sensor output. Compared to the LSSVM model, PSO-LSSVM can demonstrate better robustness and accuracy.
For validating the fitting analysis scheme for the SAW winding tension sensor based on the PSO-LSSVM model, this article introduces the PSO algorithm into LSSVM as the selection strategy to improve the effect of the LSSVM model. First, the LSSVM model is trained, and the temperature sensitivity coefficient is calculated. Second, the PSO-LSSVM model is trained, and calculated temperature sensitivity coefficient . Finally, the maximum mean error in measurement data, LSSVM curve fitting error, and PSO-LSSVM curve fitting error are calculated.
5.1. Training and Prediction of the LSSVM Model
The Support Vector Machine (SVM) is a machine learning model that converts low-dimensional features of data points into high-dimensional features and uses structural optimization principles to generate decision boundaries. As the most significant contribution, SVM transforms the training of the model into a quadratic programming problem, i.e.,
which has inequality constraints
In Equation (15), represents regression weight; represents the classification category; represents the penalty coefficient; represents the relaxation factor; is the dimension raising function; represents the linear regression weight. SVM obtains the decision boundary by solving the quadratic programming problem described in Equations (14) and (15). SVM can effectively solve the problem of linear indivisibility of samples, but its transformed quadratic programming problem has considerable computational complexity.
The Least Squares Support Vector Machine (LSSVM) is an improved method of SVM. LSSVM converts the inequality constraints in SVM into equality constraints, so that the solution of dual problems can be converted into the solution of linear equations, which greatly simplifies the calculation.
In LSSVM, inequality constraints in SVM are transformed into equality constraints, namely
The problem described in the Equations (14) and (15) also can be transformed into
where is a Lagrangian operator. Finally, combined with the kernel method, the original linear equation can be transformed into a nonlinear form
where represents a kernel function, usually replacing and . In this paper, the kernel function we used is a radial basis function (RBF) kernel, namely,
where is a fixed parameter of kernel function of .
The LSSVM model effectively reduces the computational complexity of the model by transforming inequality constraints into equality constraints. But in the LSSVM model, parameter ,, as a fixed parameter, greatly affects the accuracy of the whole model. Therefore, this paper will optimize it through the PSO algorithm to make the LSSVM effect more accurate [27,28,29].
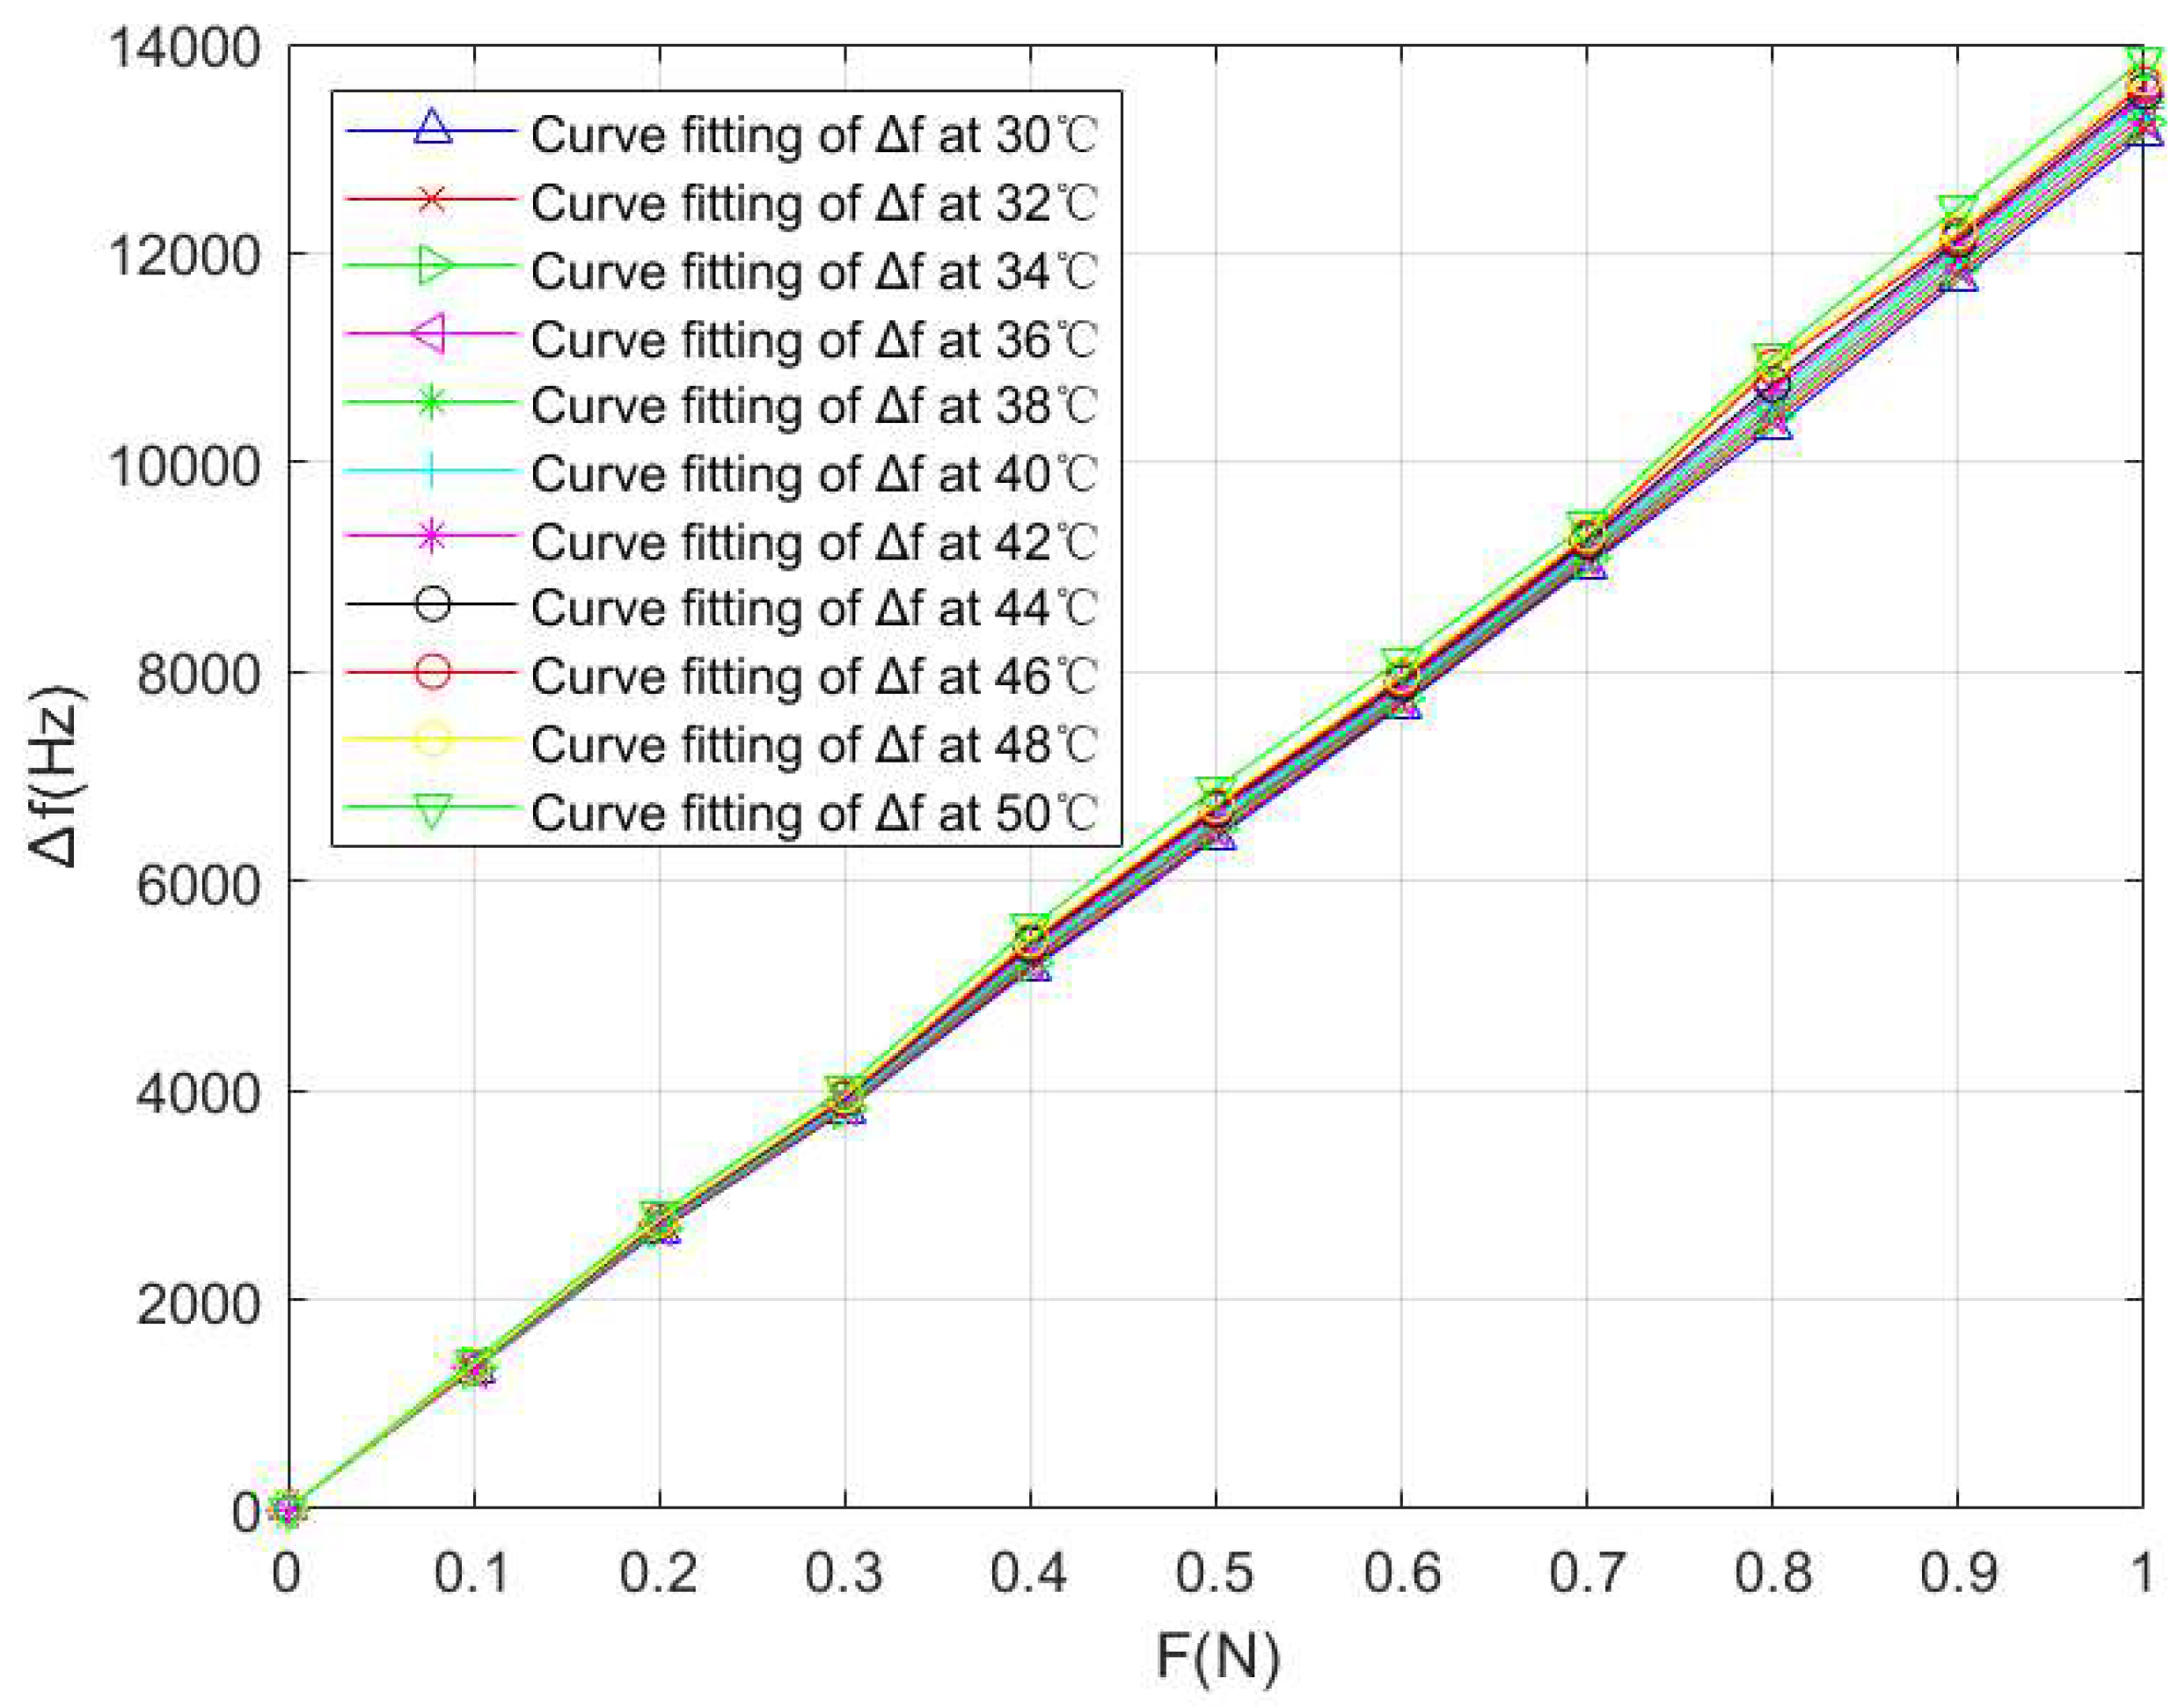
In this paper, the output frequency shift of the SAW winding tension sensor at 34 °C in Table 2 is taken as the expected output value of the LSSVM algorithm, and this algorithm is used to train the output frequency shift under other temperature conditions in Table 3. After temperature compensation, the values of the frequency shift of the SAW winding tension sensor under different temperature conditions were obtained, as shown in Table 3 and Figure 8; , (when ), and , so we have the temperature sensitivity coefficient
Table 3.
LSSVM compensation of the SAW winding tension sensor under different temperatures.
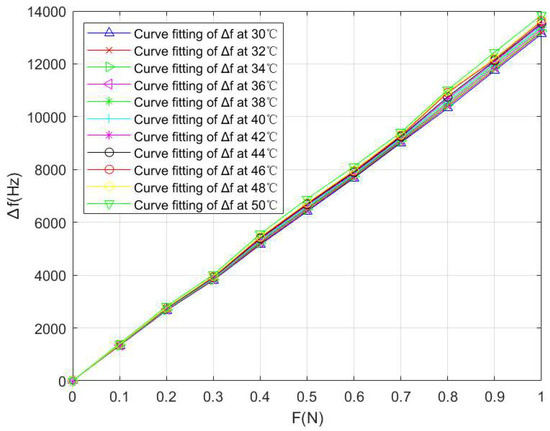
Figure 8.
LSSVM curve fitting between the tension F and the output frequency shift of the SAW winding tension sensor under different temperatures.
5.2. Principle and Training of the PSO-LSSVM Model
Particle Swarm Optimization (PSO) is a stochastic optimization algorithm inspired by population behavior. Its core idea is to update each random particle according to the status of other particles and its state in the interpretation space continuously iterates to find the optimal solution. In the idea of the PSO algorithm, the state of each random particle contains location and vector velocity, representing the potential solution and historical update trajectory of the particle. In the process of seeking a solution, each particle will be affected by the global optimal particle and optimal particles in the neighborhood to change its vector speed, and update the position. By continuously iterating the state of the particle, we finally obtain the optimization solutions satisfying given conditions.
Assuming that there are N particles in the D dimension solution space, the orientation of the -th particle can be set to a D dimension vector, i.e.,
In addition, the vector velocity of the -th particle can also be set to a D dimension vector, i.e.,
In the update process of the -th particle, there will be a local particle pole value in the local area, and its orientation can be set to
Each time the particle group is updated, there is a global particle pole value in the solution space, and its orientation can be set to
The position and vector velocity of the -th particle will be updated in the k-th round through the following two equations
Among them, is a pseudo-random number of 0 to 1, is the learning factor, and is an inertial coefficient.
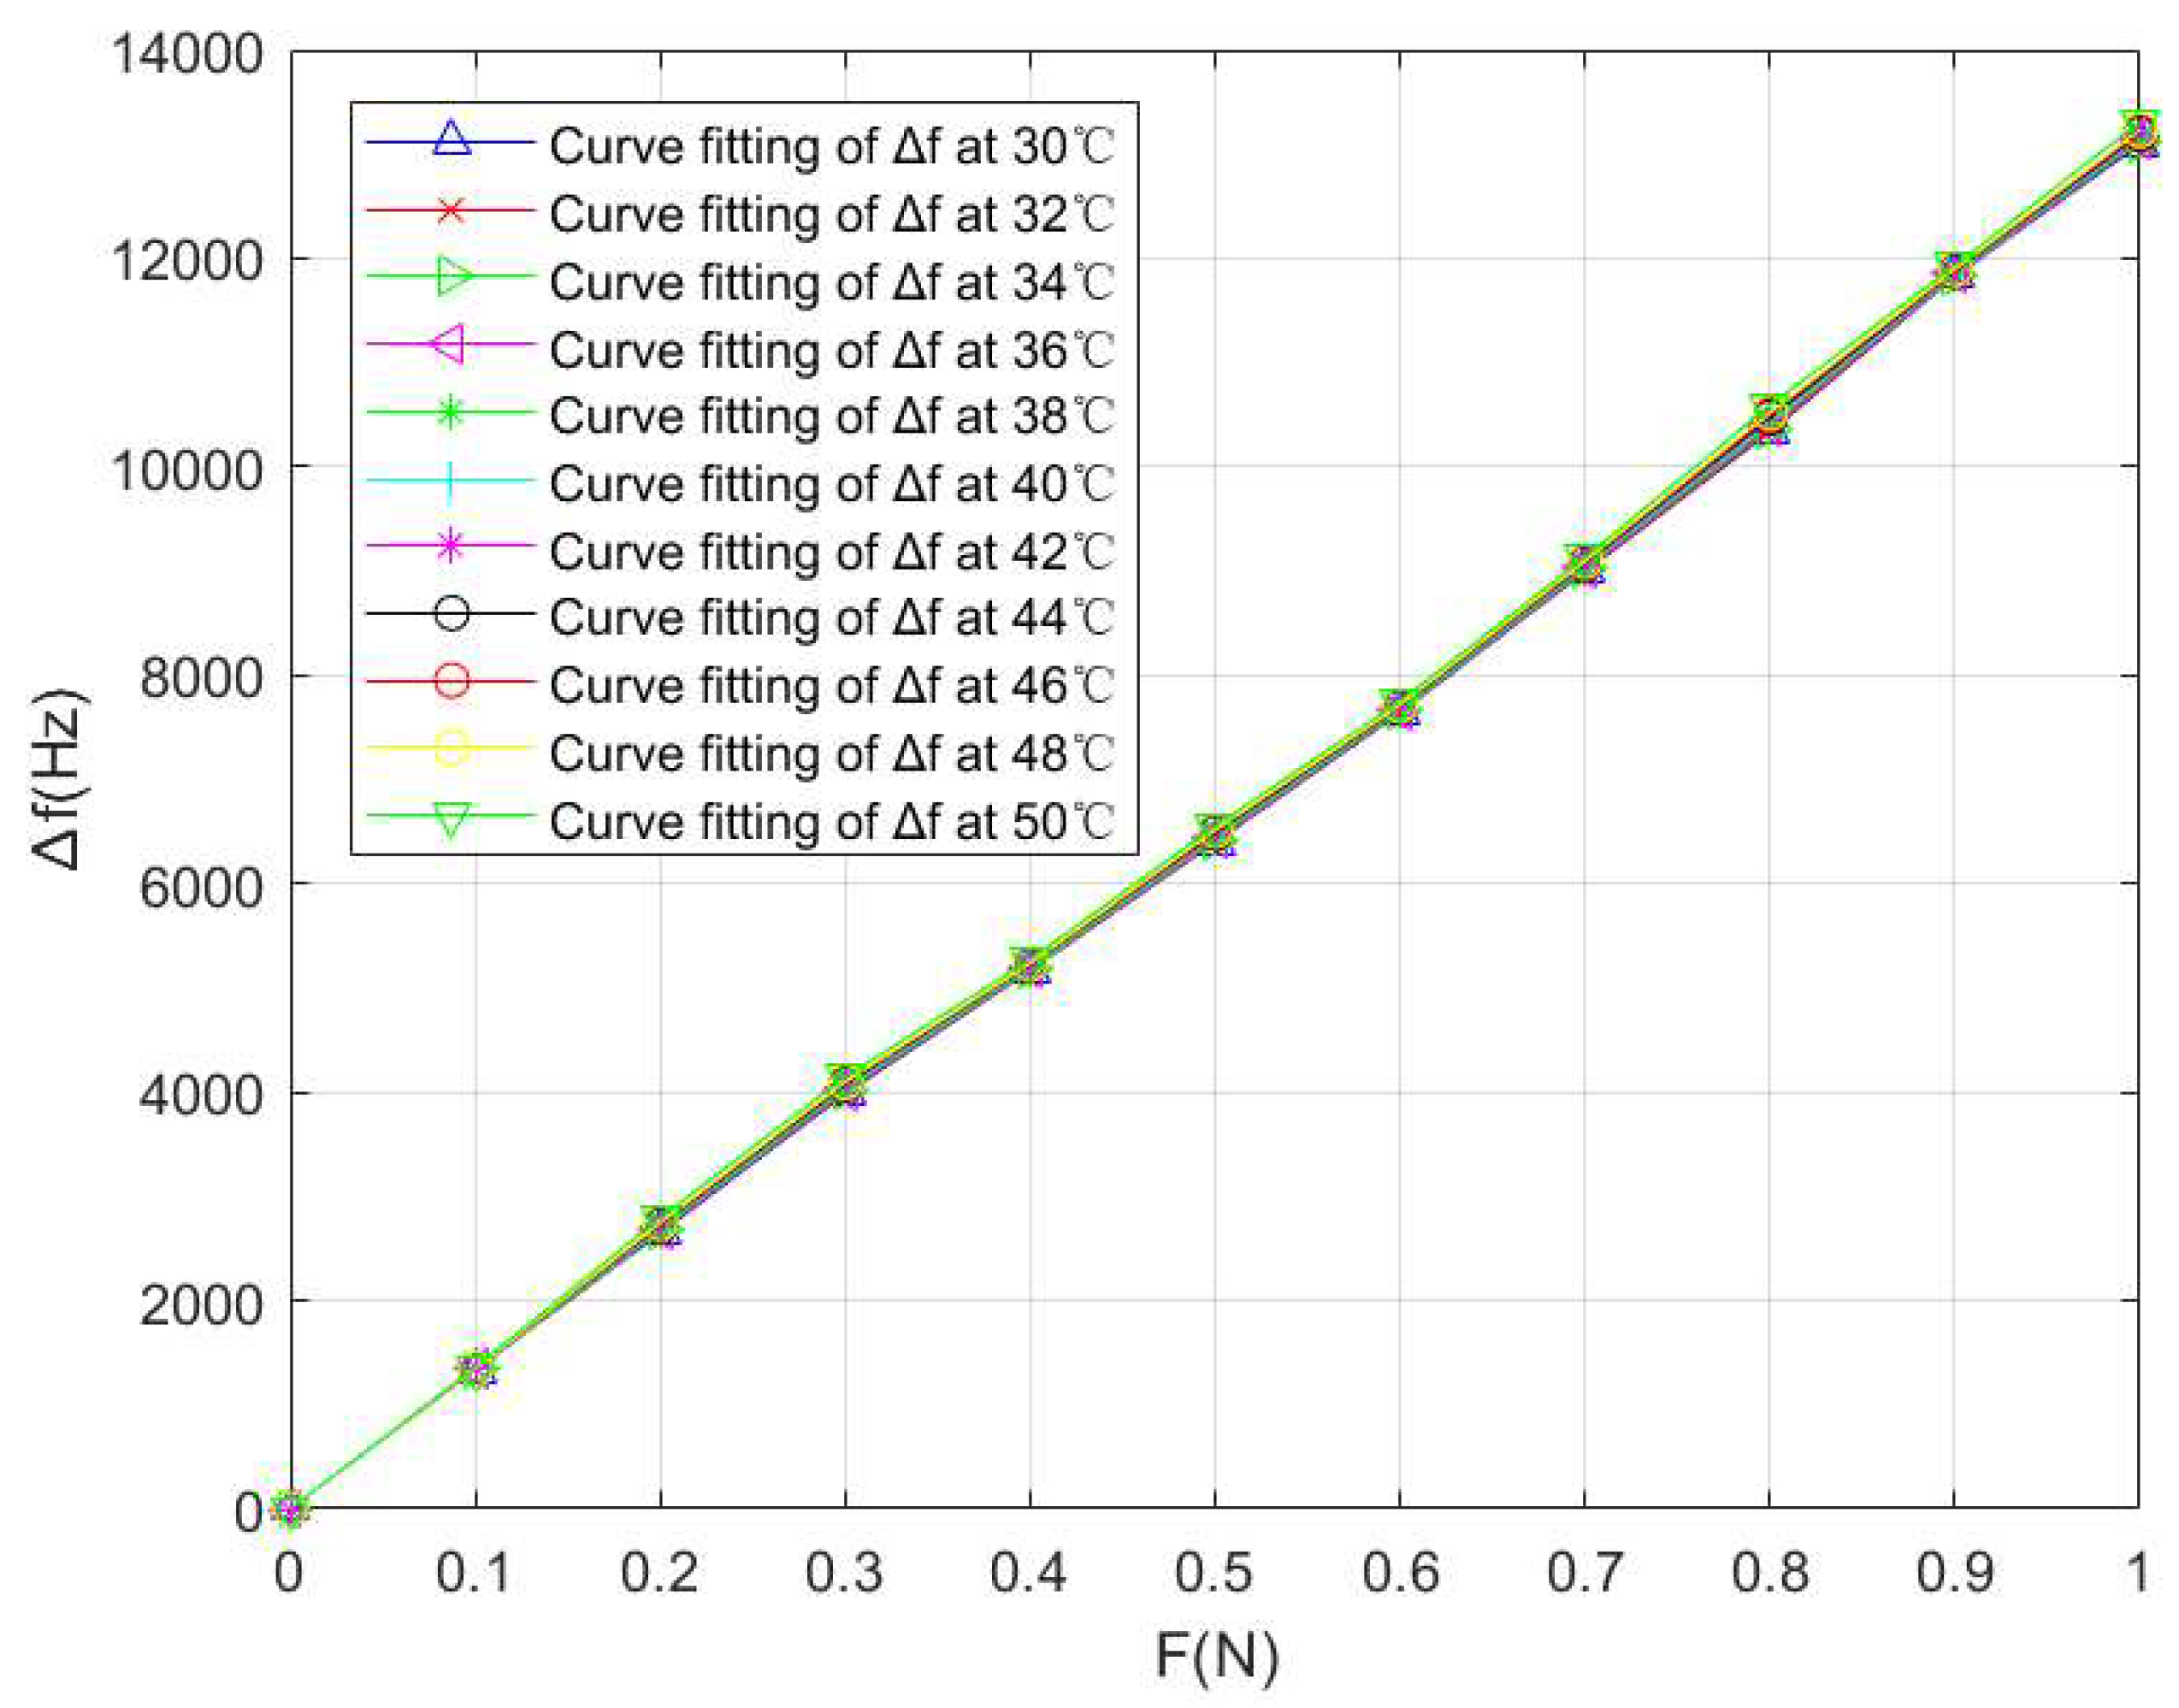
This article introduces the PSO algorithm into LSSVM as the selection strategy of parameters and to improve the effect of the LSSVM model. In the PSO-LSSVM algorithm, we set . After temperature compensation, the values of the frequency shift of the SAW winding tension sensor under different temperature conditions were obtained, as shown in Table 4 and Figure 9; , and , so we have the temperature sensitivity coefficient
Table 4.
PSO-LSSVM compensation of the SAW winding tension sensor under different temperature conditions.
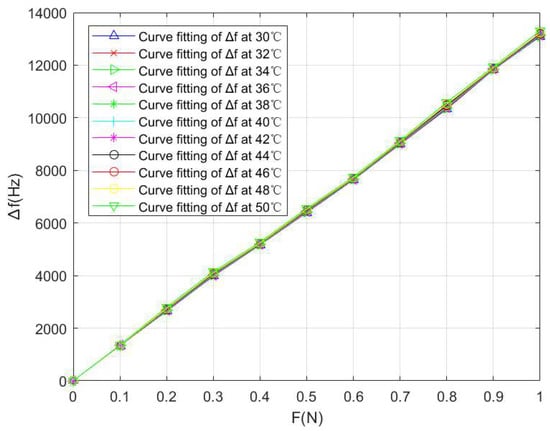
Figure 9.
PSO-LSSVM curve fitting between the tension F and the output frequency shift Δf of the SAW winding tension sensor under different temperature conditions.
By fitting the above experimental data with the least square method, the fitting curves between the winding tension and the output frequency shift under different temperature conditions can be obtained, which is shown in Figure 9.
5.3. Numerical Comparison
For facilitating data comparison, this paper makes a comparison and analysis of the same data sample set, respectively comparing the unoptimized test data, LSSVM model, and PSO-LSSVM model.
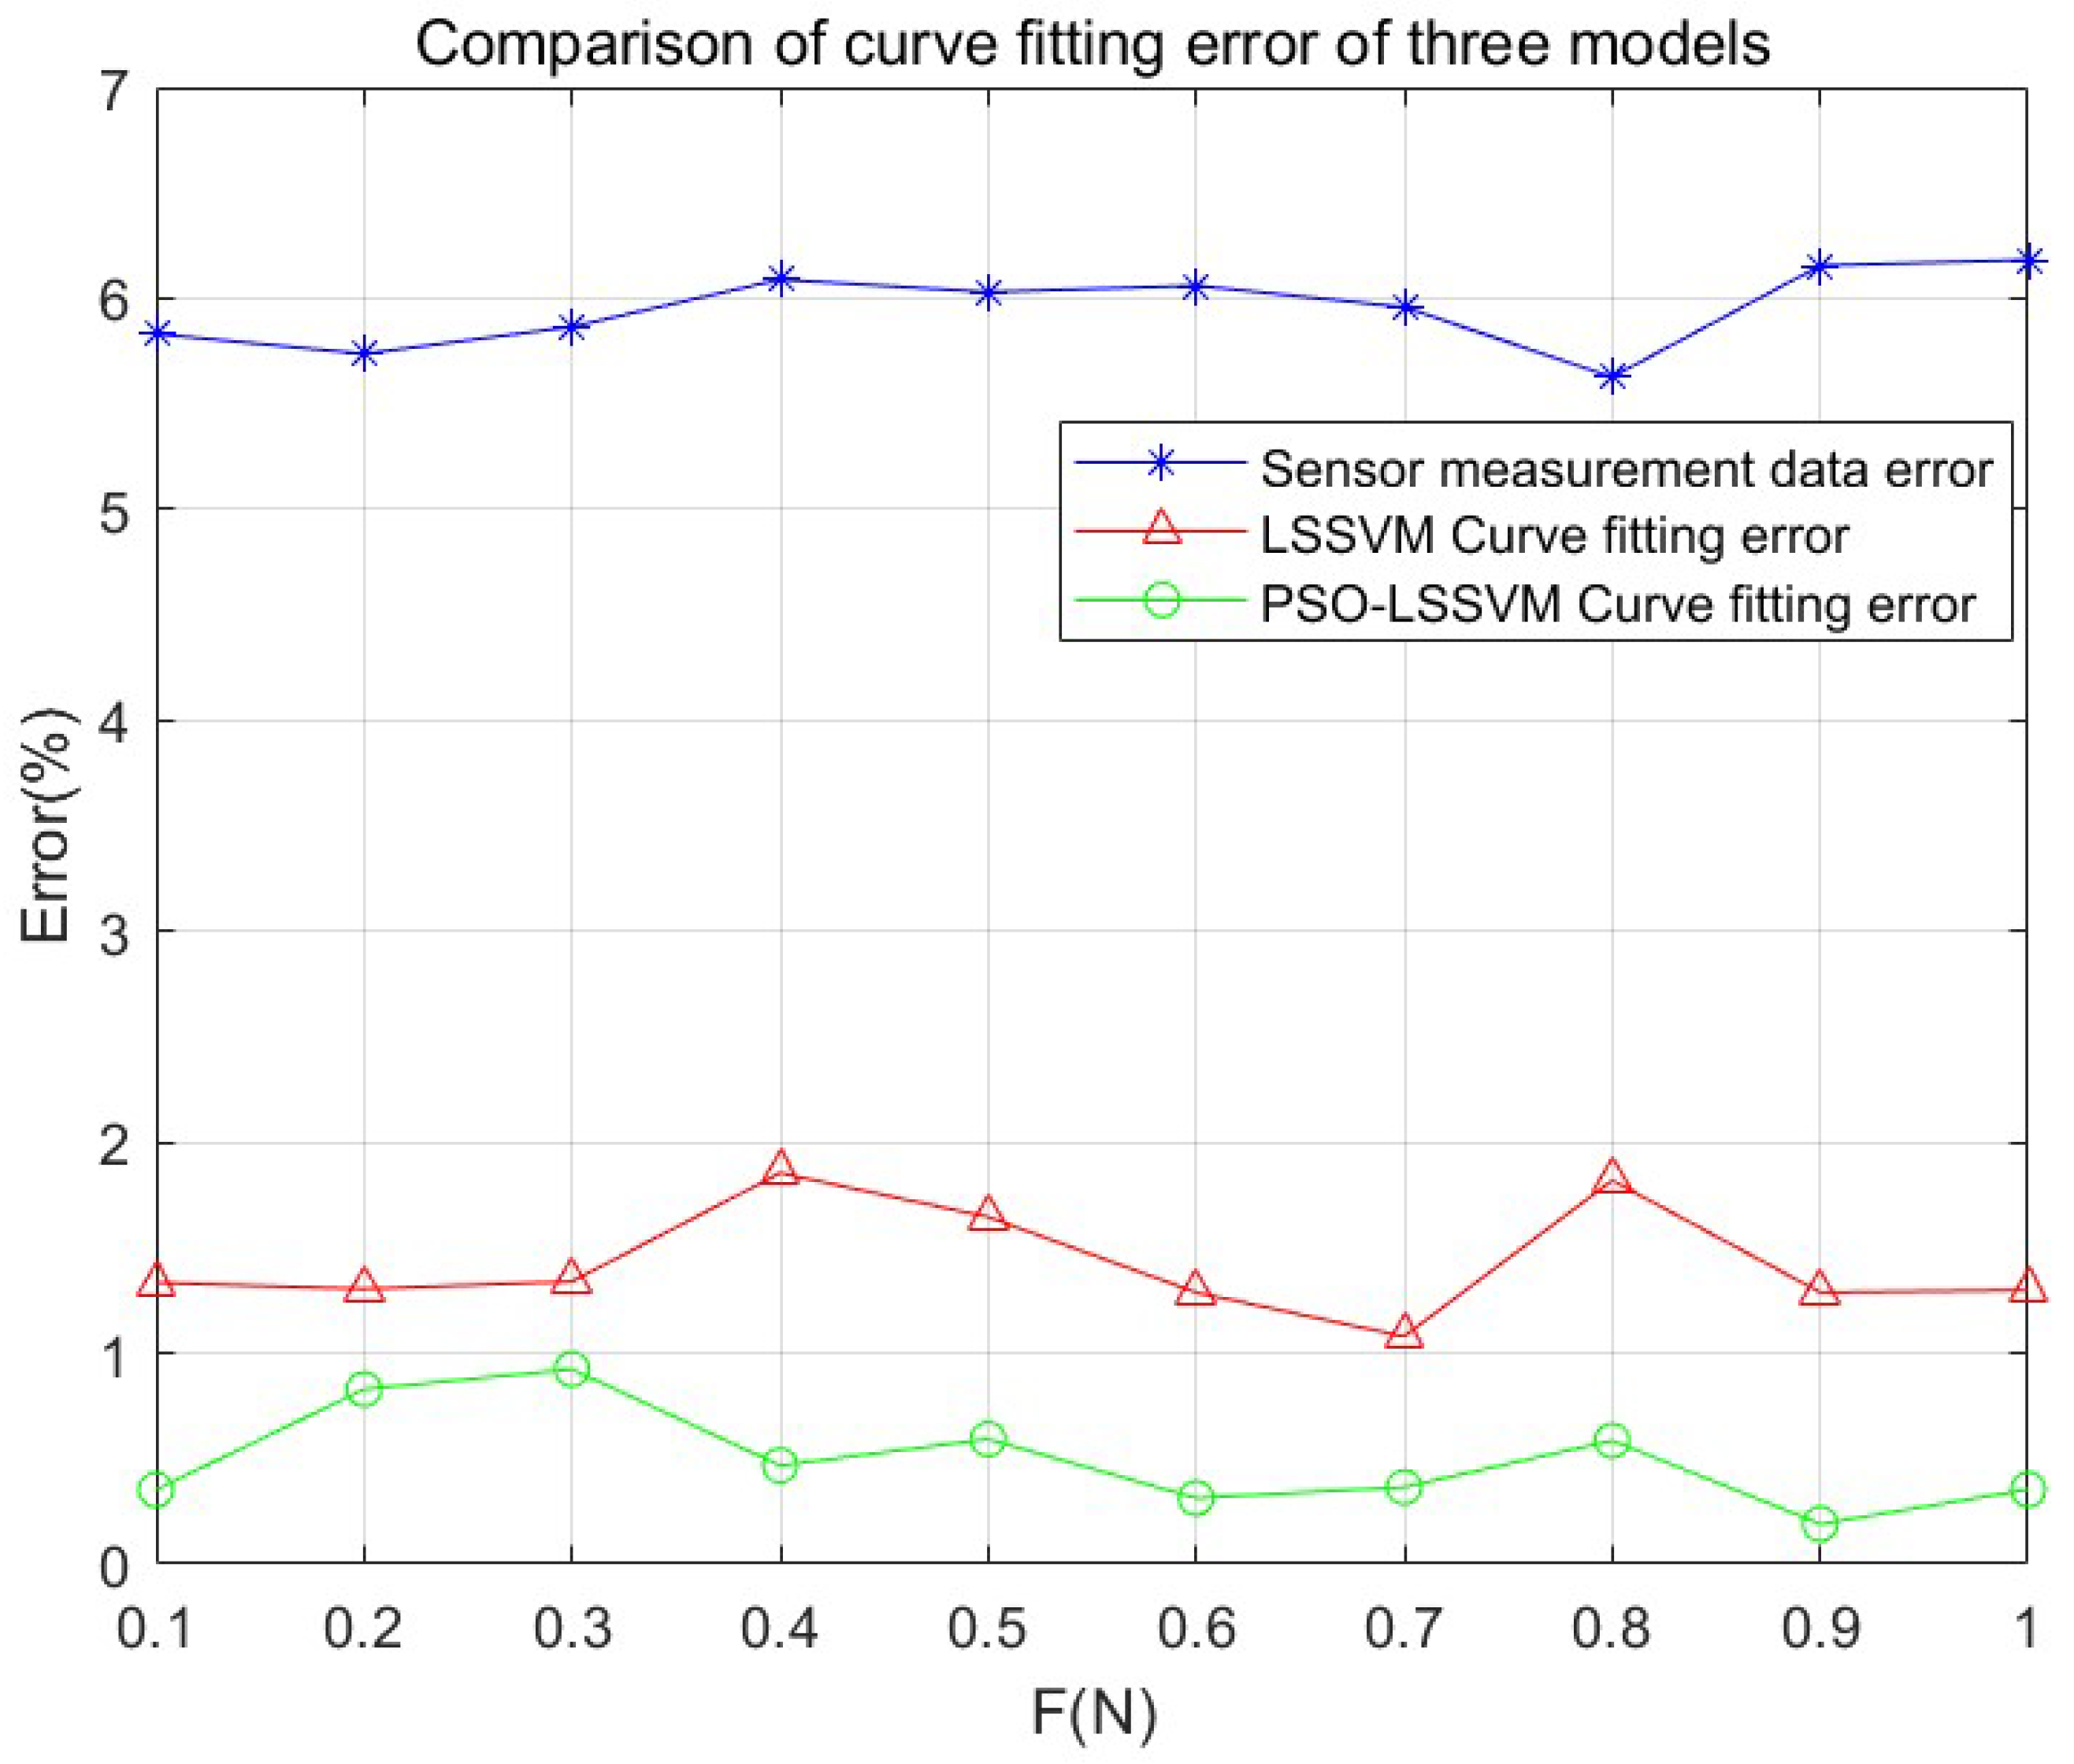
The measurement accuracy is a vital index for surface acoustic wave winding sensors. The output average error is a significant parameter for measuring the accuracy of surface acoustic wave winding sensors. In the range of 0–1 N test interval, the output average error of each tension test point is obtained, that is
The average output error is shown in Table 5 and Figure 10. The predicted output error represents the accuracy of the best SAW winding tension sensor. As shown in Figure 10, the average output error of the unoptimized test data is 5.95%. For the LSSVM network, the average fitting output error reaches more than 1.42%, while in the PSO-LSSVM model, the average fitting output error can reach 0.50% or even better. As a result, the PSO-LSSVM model for the temperature compensation of the SAW winding tension sensor is better.
Table 5.
The average output error of the SAW winding tension sensor in the 0–1 N measurement interval.
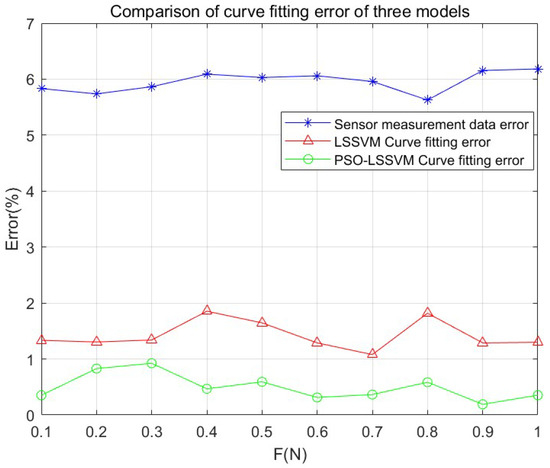
Figure 10.
Comparison of the mean error of the SAW winding tension sensor in the 0–1 N measurement interval.
6. Conclusions
This paper presented a designed SAW winding tension sensor, and data fusion technology was used to improve its measurement accuracy. To suppress the sidelobes, we choose the unbalanced split-electrode interdigital transducers to design the input and output IDTs. We created the electrode-overlap envelope to design the input IDT. Also, to verify the effect of temperature variations on the sensor, we experimented with the sensors under different temperature conditions by winding the measurement system. We found that the sensor’s frequency characteristics performed very well under the same temperature conditions. However, when the temperature changed, its measurement accuracy was seriously affected. To improve the measurement accuracy, we used the LSSVM and PSO-LSSVM algorithms to compensate for the temperature error. After temperature compensation, the conclusions are as follows.
- (1)
- By using the LSSVM and PSO-LSSVM model, the temperature sensitivity coefficient αs of the SAW winding tension sensor was decreased from to and , which was reduced by an order of magnitude. Thus, data fusion technology can significantly improve the anti-temperature interference performance of the SAW winding tension sensor, thereby further improving its measurement accuracy;
- (2)
- The average output error of the unoptimized test data is 5.95%. For the LSSVM network, the average fitting output error reaches more than 1.42%, while in the PSO-LSSVM model, the average fitting output error can reach 0.50% or even better. Thus, the PSO-LSSVM model for the temperature compensation of the SAW winding tension sensor is better.
Author Contributions
Conceptualization, Writing—original draft, Y.F.; Data curation, Formal analysis, W.L.; Software, H.Y.; Methodology, K.H.; Validation, S.S.; Funding acquisition, Project administration, B.W. All authors have read and agreed to the published version of the manuscript.
Funding
This research was funded in part by the Zhejiang Provincial Natural Science Foundation of China under Grant LQ23F010005, Scientific Research Fund of Zhejiang Provincial Education Department under Grant Y202250022, by the Scientific Research Fund of Hangzhou Normal University under Grant 4115C50220204101, by Joint Funds of the Zhejiang Provincial Natural Science Foundation of China under Grant LHY21E090004, by “The Professional Development Projects of Teachers” for Domestic Visiting Scholars of Colleges and Universities in 2022, China under Grant FX2022075.
Data Availability Statement
Data are contained within the article.
Conflicts of Interest
The authors declare no conflict of interest.
References
- Lee, J.; Lee, C. Model-Based Winding Tension Profile to Minimize Radial Stress in a Flexible Substrate in a Roll-to-Roll Web Transporting System. IEEE ASME Trans. Mechatron. 2018, 23, 2928–2939. [Google Scholar] [CrossRef]
- Zhang, H.; Xia, H.; Lu, Y.; Wu, J.; Zhang, X.; Wei, Y. Tension control of a yarn winding system based on the nonlinear active disturbance-rejection control algorithm. Text. Res. J. 2022, 92, 5049–5065. [Google Scholar] [CrossRef]
- Pereira, F.; Oliveira, E.L.; Ferreira, G.G.; Sousa, F.; Caldas, P. Textile yarn winding and unwinding system. In Lecture Notes in Mechanical Engineering; Springer: Berlin/Heidelberg, Germany, 2021; pp. 347–358. [Google Scholar]
- Chen, X.; Zhu, Z.; Shen, G.; Li, W. Tension coordination control of double-rope winding hoisting system using hybrid learning control scheme. Proc. Inst. Mech. Eng. 2019, 233, 1265–1281. [Google Scholar] [CrossRef]
- Lee, C.W.; Shin, K.H. A Study on Taper-Tension Control Considering Telescoping in the Winding System. IEEE Trans. Ind. Appl. 2010, 46, 687–693. [Google Scholar]
- Ali, M.; Ahmed, R.; Amer, M. Yarn tension control technique for improving polyester soft winding process. Sci. Rep. 2021, 11, 1060. [Google Scholar] [CrossRef]
- Wen, L.; Zhu, T.; Qin, L. Deviation-rectifying control of carbon fiber prepreg slitting and winding machine. Trans. Nanjing Univ. Aeronaut. Astronaut. 2018, 35, 547–555. [Google Scholar]
- Xiao, Y.; Yu, A.; Qi, H. Research on the tension control method of lithium battery electrode mill based on GA optimized Fuzzy PID. J. Intell. Fuzzy Syst. 2021, 40, 10211–10234. [Google Scholar] [CrossRef]
- Jiang, C.; Wang, H.S.; Hou, L.W. Sliding mode compensation control for diaphragm tension in unwinding process of lithium battery diaphragm slitting machine. IEEE Access 2019, 8, 21302–21313. [Google Scholar] [CrossRef]
- Jo, I.; Park, S.; Kim, D. Tension-controlled single-crystallization of copper foils for roll-to-roll synthesis of high-quality graphene films. 2D Mater. 2018, 5, 024002. [Google Scholar] [CrossRef]
- Burak, Ç.; Barış, M.; Güngör, D. Innovative Research and Applications in Yarn Winding/Dyeing. Ann. Univ. OradeaFascicle Text. Leatherwork 2022, 23, 9–12. [Google Scholar]
- Hwang, H.; Lee, J.; Eum, S. Kalman-Filter-Based Tension Control Design for Industrial Roll-to-Roll System. Algorithms 2019, 12, 86. [Google Scholar] [CrossRef]
- Bhattacharjee, P.; Mishra, H.; Iyer, P.; Nemade, H.B. Efficient Monolithic SAW Convolver Using Poly(3-Hexylthiophene). IEEE Trans. Instrum. Meas. 2023, 72, 7501807. [Google Scholar] [CrossRef]
- Mandal, D.; Banerjee, S. Surface Acoustic Wave (SAW) Sensors: Physics, Materials, and Applications. Sensors 2022, 22, 820. [Google Scholar] [CrossRef] [PubMed]
- Lei, B.; Lu, W.; Mian, Z.; Bao, W. Effect of IDT position parameters on SAW yarn tension sensor sensitivity. Meas. Control 2020, 53, 2055–2062. [Google Scholar] [CrossRef]
- Wei, M.; Liu, Y.; Qu, Y.; Gu, X.; Wang, Y.; Liu, W.; Cai, Y.; Guo, S.; Sun, C. Development of Temperature Sensor Based on AlN/ScAlN SAW Resonators. Electronics 2023, 12, 3863. [Google Scholar] [CrossRef]
- Kumar, J.; Nimal, A.T.; Mittal, U.; Kumar, V.; Singh, V.K. Effect of Carrier Gas on Sensitivity of Surface Acoustic Wave Detector. IEEE Sens. J. 2022, 22, 8394–8401. [Google Scholar] [CrossRef]
- Aleksandrova, M.; Kolev, G.; Brigadin, A.; Lukin, A. Gas-Sensing Properties of a Carbyne-Enriched Nanocoating Deposited onto Surface Acoustic Wave Composite Substrates with Various Electrode Topologies. Crystals 2022, 12, 501. [Google Scholar] [CrossRef]
- Feng, Y.; Li, J.; Bai, R.; Qian, Z. Methods of solving in-band ripples and out-of-band suppression for yarn tension sensor based on surface acoustic wave. IET Circuits Devices Syst. 2022, 16, 483–490. [Google Scholar] [CrossRef]
- Li, Y.; Lu, W.; Zhu, C.; Liu, Q.; Zhang, H.; Lei, B. Finite element analysis of surface acoustic wave based on a micro force sensor. Measurement 2015, 65, 112–119. [Google Scholar] [CrossRef]
- Ding, Y.; Lu, W.; Zhang, Y.; Feng, Y.; Zhou, Y. Study on the Practical Application of Surface Acoustic Wave Yarn Tension Sensor 2022. IEEE Trans. Ind. Electron. 2022, 69, 13781–13790. [Google Scholar] [CrossRef]
- Lu, W.; Zhu, C. Solving three key problems of wavelet transform processor using surface acoustic wave devices. IEEE Trans. Ind. Electron. 2010, 57, 3801–3806. [Google Scholar] [CrossRef]
- Campbell, C. Surface Acoustic Wave Devices and Their Signal Processing Applications; Elsevier: Amsterdam, The Netherlands, 1989; pp. 59–65. [Google Scholar]
- Feng, Y.; Lu, Z.; Lu, W.; Zhu, C.; Liu, Q.; Zhang, H. Study of the Doubly-clamped Beam Yarn Tension Sensor Based on the Surface Acoustic Wave. IEEE Trans. Ind. Electron. 2019, 66, 3256–3264. [Google Scholar] [CrossRef]
- Lu, W.; Lu, X.; Zhu, C.; Liu, Q.; Zhang, H. Solving Three Key Problems of the SAW Yarn Tension Sensor. IEEE Trans. Electron Devices 2012, 59, 2853–2855. [Google Scholar] [CrossRef]
- Feng, Y.; Liu, W.; Wang, B. Enhanced Frequency Stability of SAW Yarn Tension Sensor by Using the Dual Differential Channel Surface Acoustic Wave Oscillator. Sensors 2023, 23, 464. [Google Scholar] [CrossRef] [PubMed]
- Song, X.; Zhao, J.; Song, J.; Dong, F.; Xu, L.; Zhao, J. Local Demagnetization Fault Recognition of Permanent Magnet Synchronous Linear Motor Based on S-Transform and PSO–LSSVM. IEEE Trans. Power Electron. 2020, 35, 7816–7825. [Google Scholar] [CrossRef]
- Yang, D.; Peng, Y.; Zhou, T.; Wang, T.; Lu, G. Percussion and PSO-SVM-Based Damage Detection for Refractory Materials. Micromachines 2023, 14, 135. [Google Scholar] [CrossRef]
- Gorjaei, R.G.; Songolzadeh, R.; Torkaman, M.; Safari, M.; Zargar, G. A novel PSO-LSSVM model for predicting liquid rate of two phase flow through wellhead chokes. J. Nat. Gas Sci. Eng. 2015, 24, 228–237. [Google Scholar] [CrossRef]
- Chen, W.; Li, J.; Wang, Q.; Han, K. Fault Feature Extraction and Diagnosis of Rolling Bearings Based on Wavelet Thresholding Denoising with CEEMDAN Energy Entropy and PSO-LSSVM. Measurement 2020, 172, 108901. [Google Scholar] [CrossRef]
- Suykens, J.A.K.; Vandewalle, J. Least Squares Support Vector Machine Classifiers. Neural Process. Lett. 1999, 9, 293–300. [Google Scholar] [CrossRef]
- Yang, T.; Lu, W.; Zuo, F. Temperature Compensation for Diffused-silicon Pressure Sensor Based on PSO-LSSVM. Instrum. Tech. Sens. 2017, 12, 25–29. [Google Scholar]
- Ge, Q.; Guo, C.; Jiang, H.; Lu, Z.; Yao, G.; Zhang, J.; Hua, Q. Industrial power load forecasting method based on reinforcement learning and PSO-LSSVM. IEEE Trans. Cybern. 2020, 52, 1112–1124. [Google Scholar] [CrossRef] [PubMed]
- Bemani, A.; Xiong, Q.; Baghban, A.; Habibzadeh, S.; Mohammadi, A.H.; Doranehgard, M.H. Modeling of cetane number of biodiesel from fatty acid methyl ester (FAME) information using GA-, PSO-, and HGAPSO-LSSVM models. Renew. Energy 2020, 150, 924–934. [Google Scholar] [CrossRef]
- Zeng, B.; Guo, J.; Zhang, F.; Zhu, W.; Xiao, Z.; Huang, S.; Fan, P. Prediction model for dissolved gas concentration in transformer oil based on modified grey wolf optimizer and LSSVM with grey relational analysis and empirical mode decomposition. Energies 2020, 13, 422. [Google Scholar] [CrossRef]


Disclaimer/Publisher’s Note: The statements, opinions and data contained in all publications are solely those of the individual author(s) and contributor(s) and not of MDPI and/or the editor(s). MDPI and/or the editor(s) disclaim responsibility for any injury to people or property resulting from any ideas, methods, instructions or products referred to in the content. |
© 2023 by the authors. Licensee MDPI, Basel, Switzerland. This article is an open access article distributed under the terms and conditions of the Creative Commons Attribution (CC BY) license (https://creativecommons.org/licenses/by/4.0/).