
Silver Nanocoating of LiNi0.8Co0.1Mn0.1O2 Cathode Material for Lithium-Ion Batteries

 , ,
, , 
 and
and 
Abstract
:1. Introduction
2. Materials and Methods
2.1. Synthesis
2.2. Material Characterizations
2.3. Electrochemical Measurements
3. Results
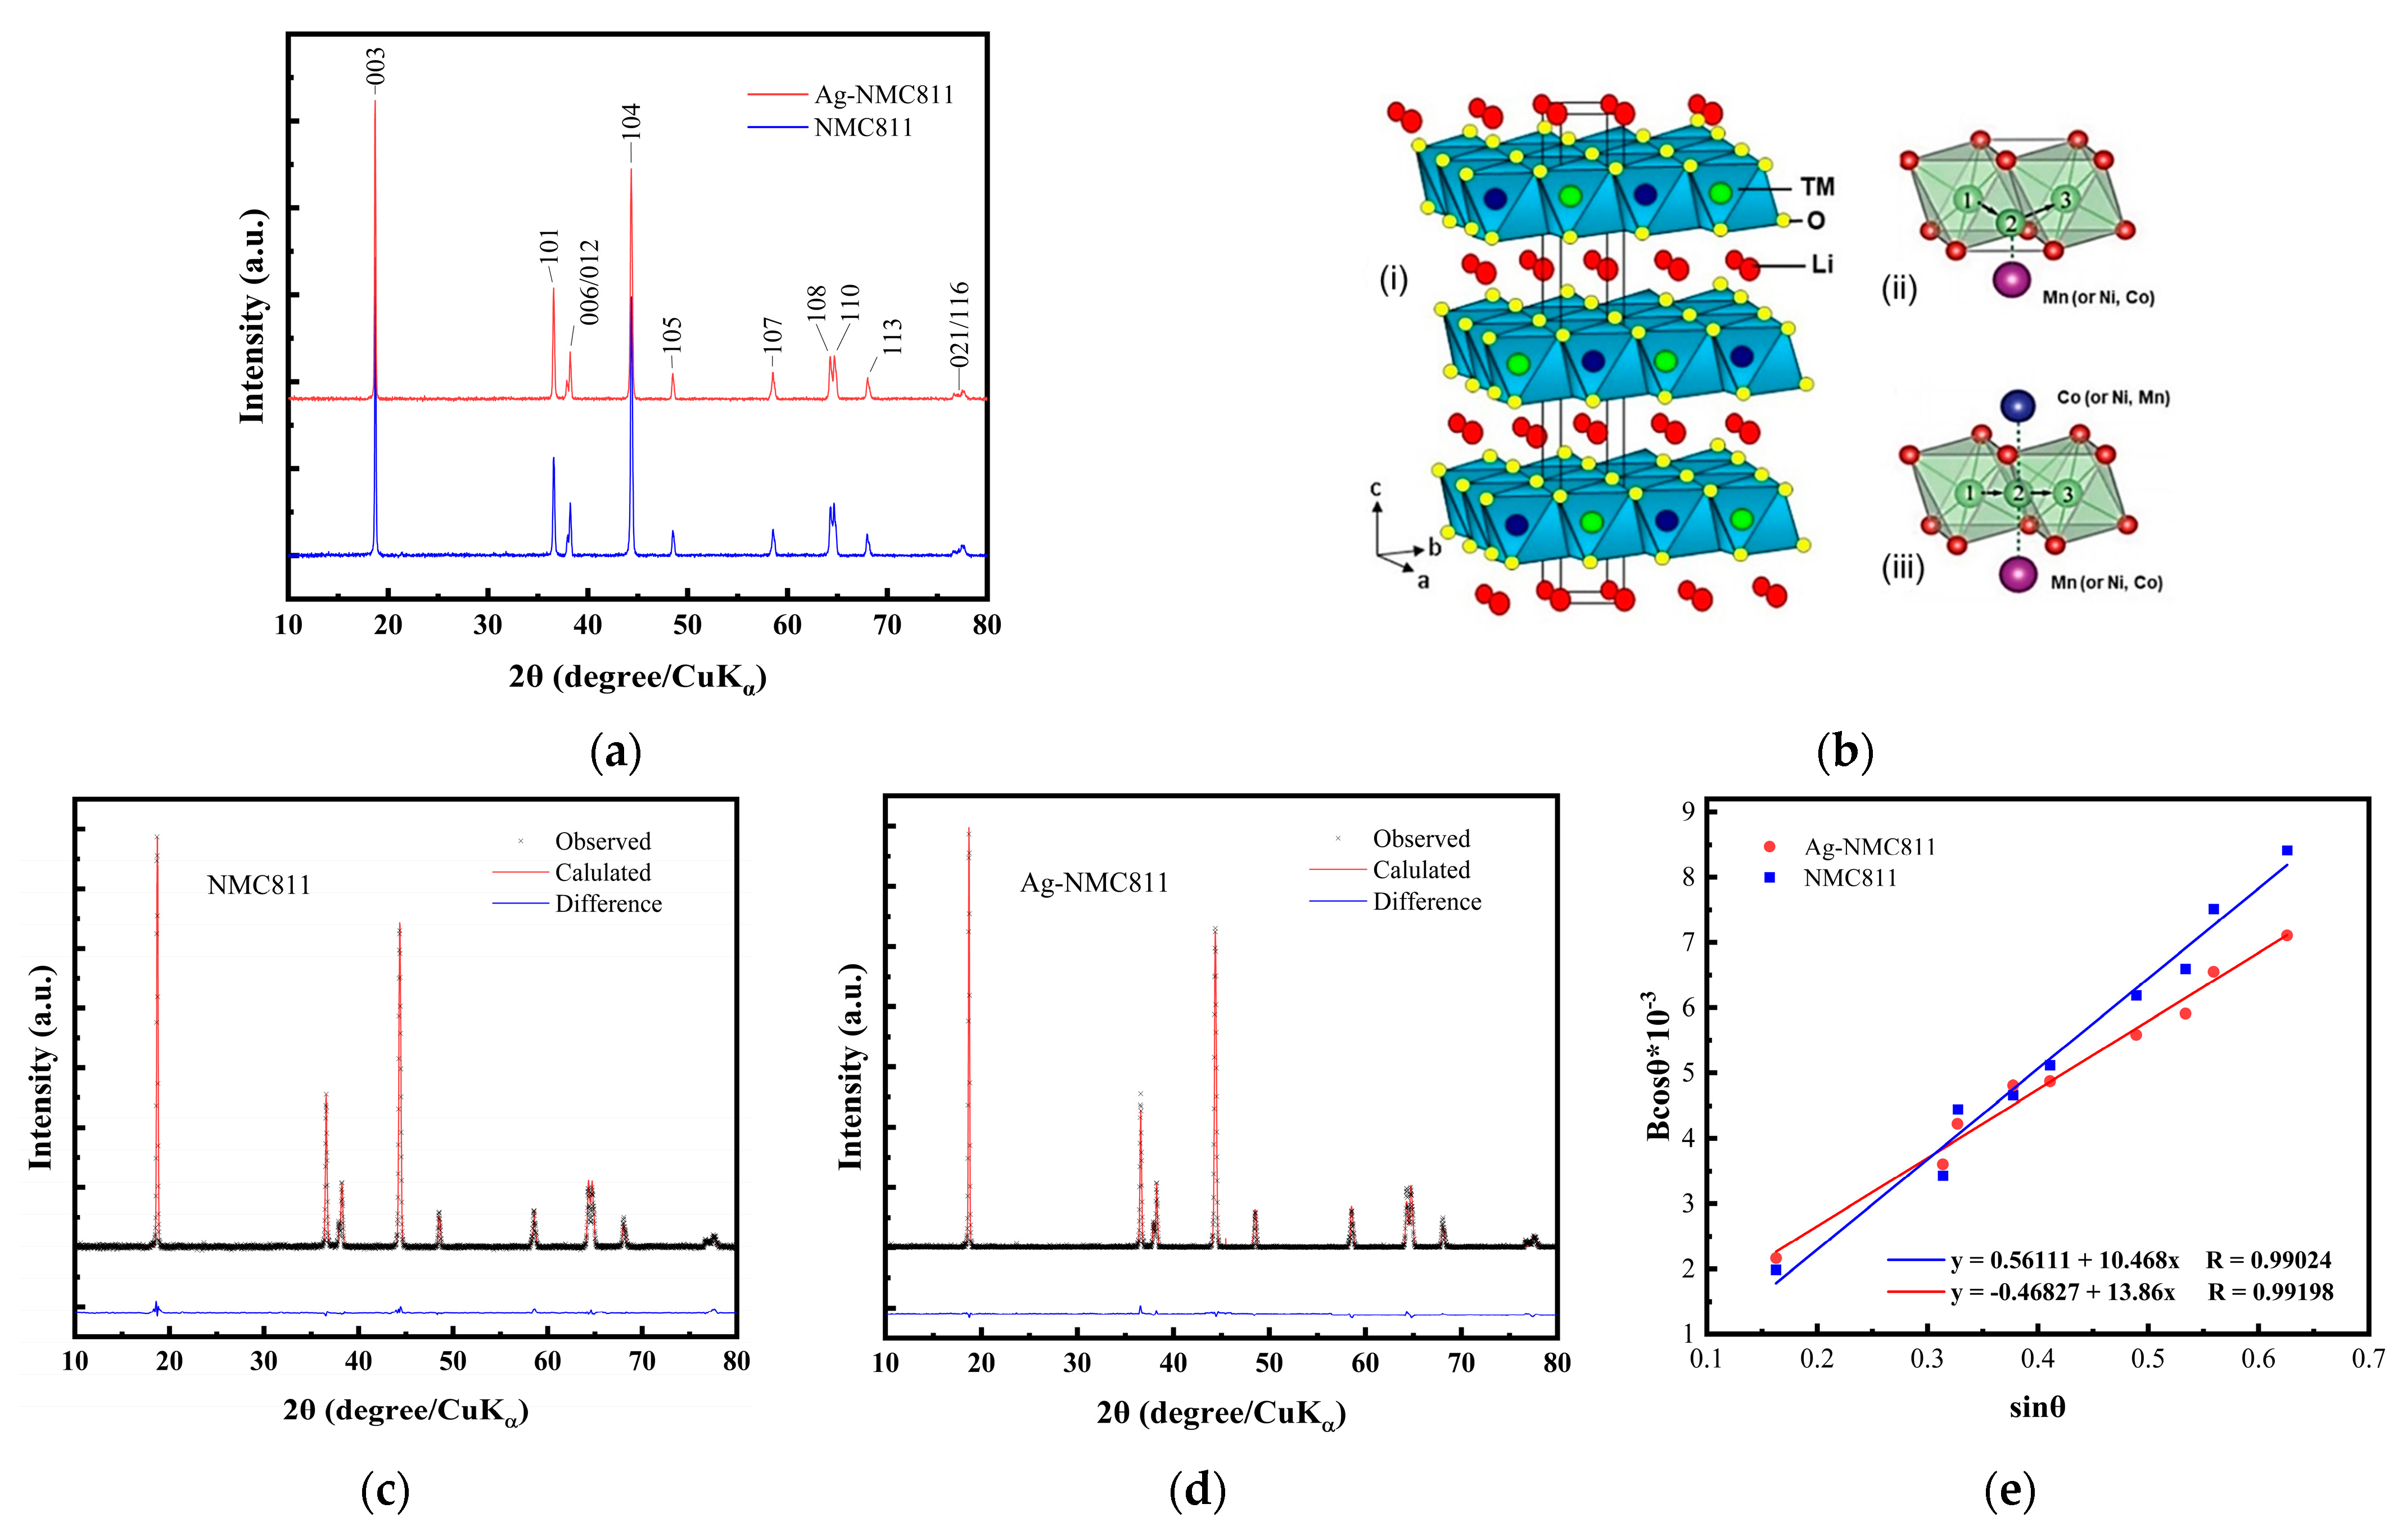
3.1. X-ray Diffraction Analysis
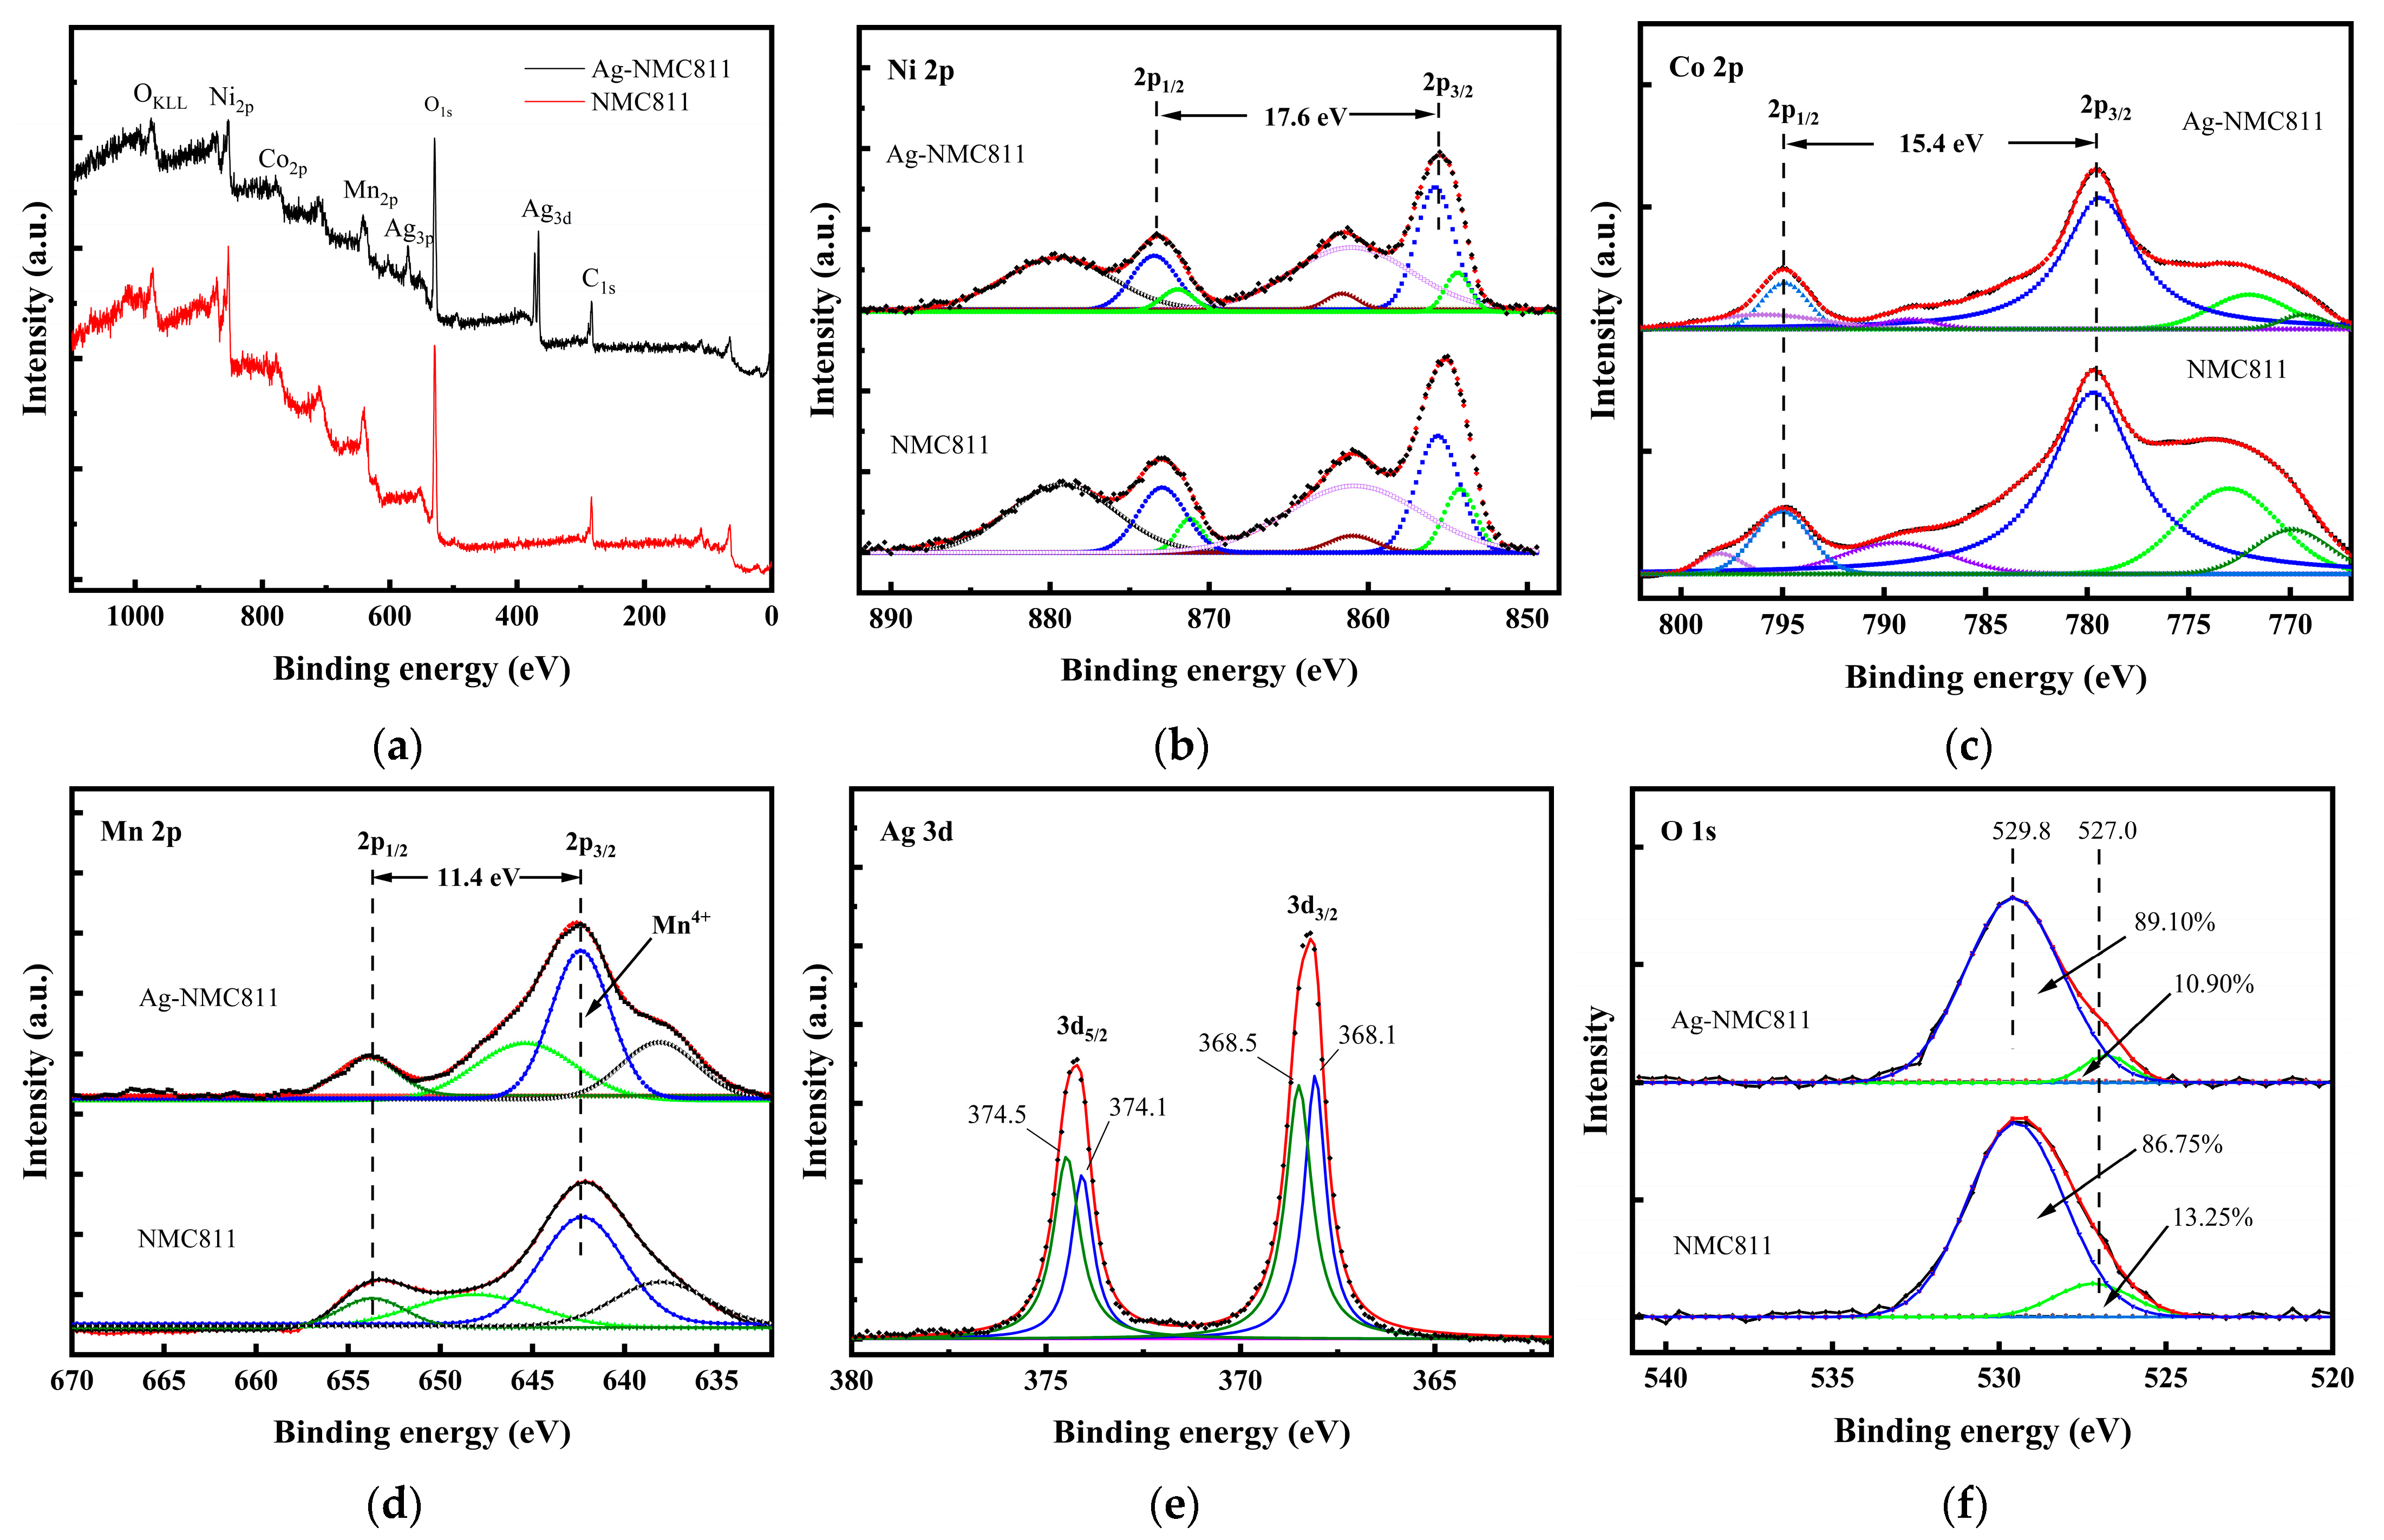
3.2. XPS Analysis
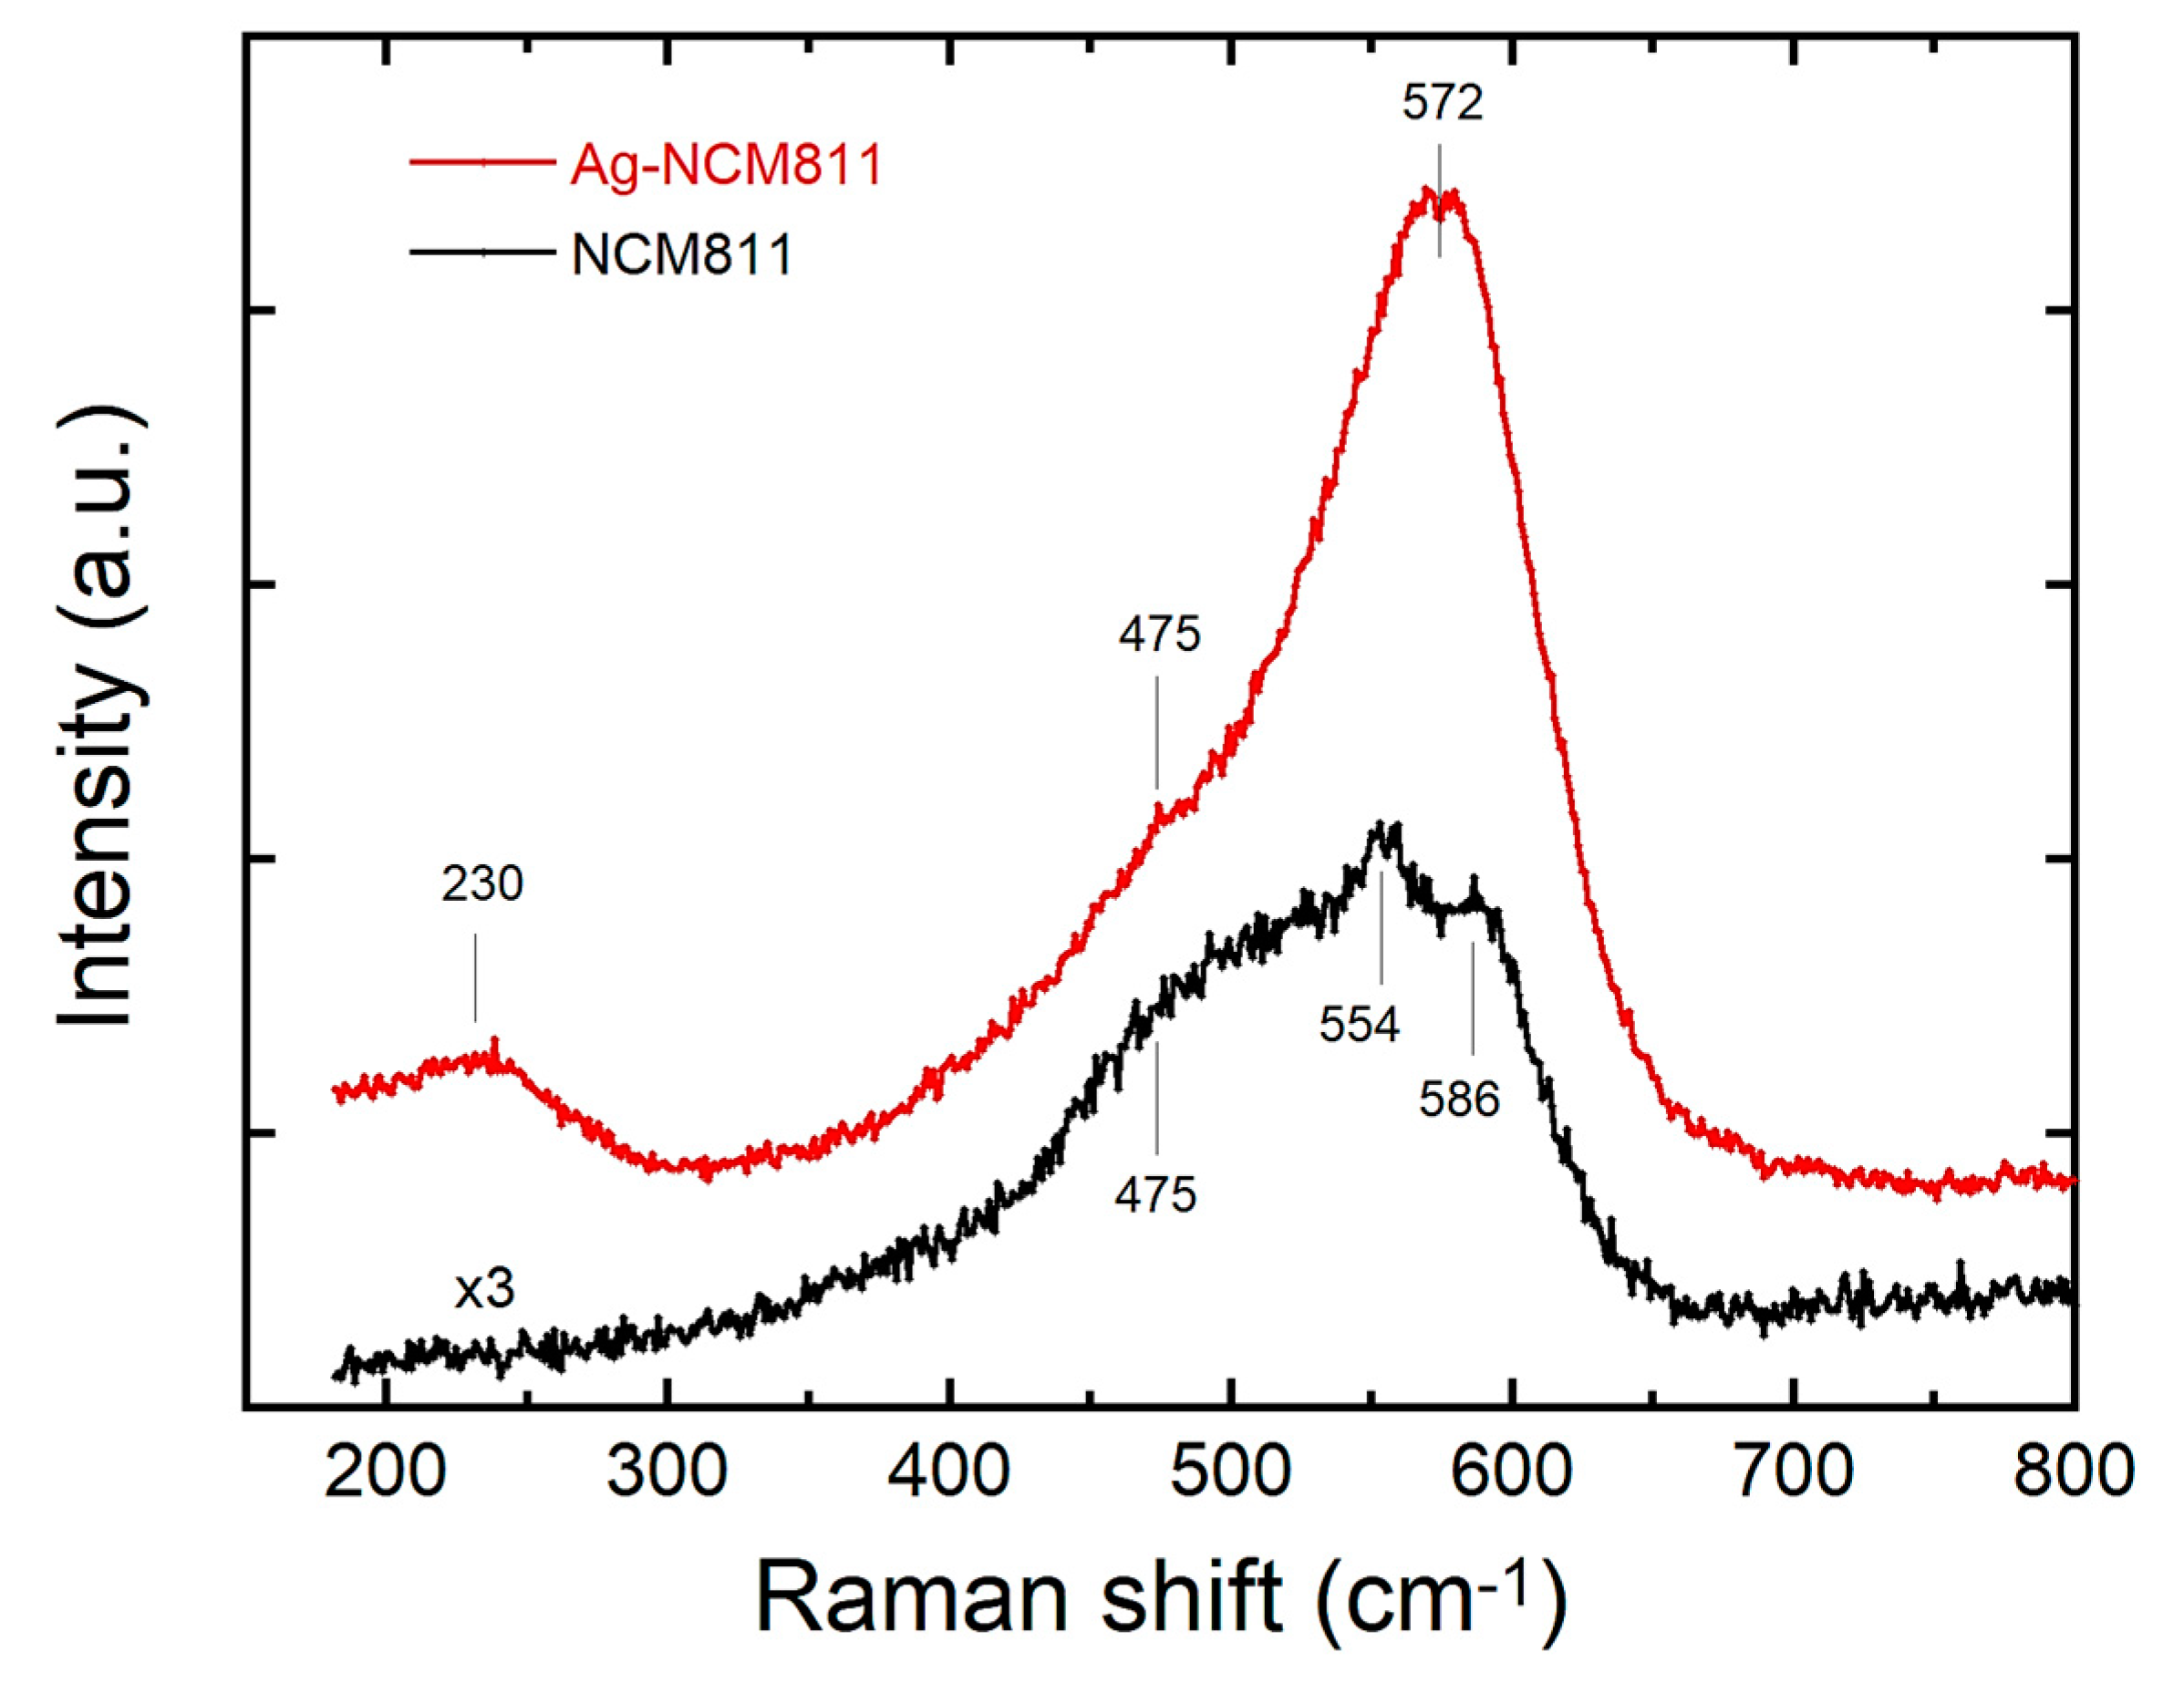
3.3. Raman Scattering Spectroscopy
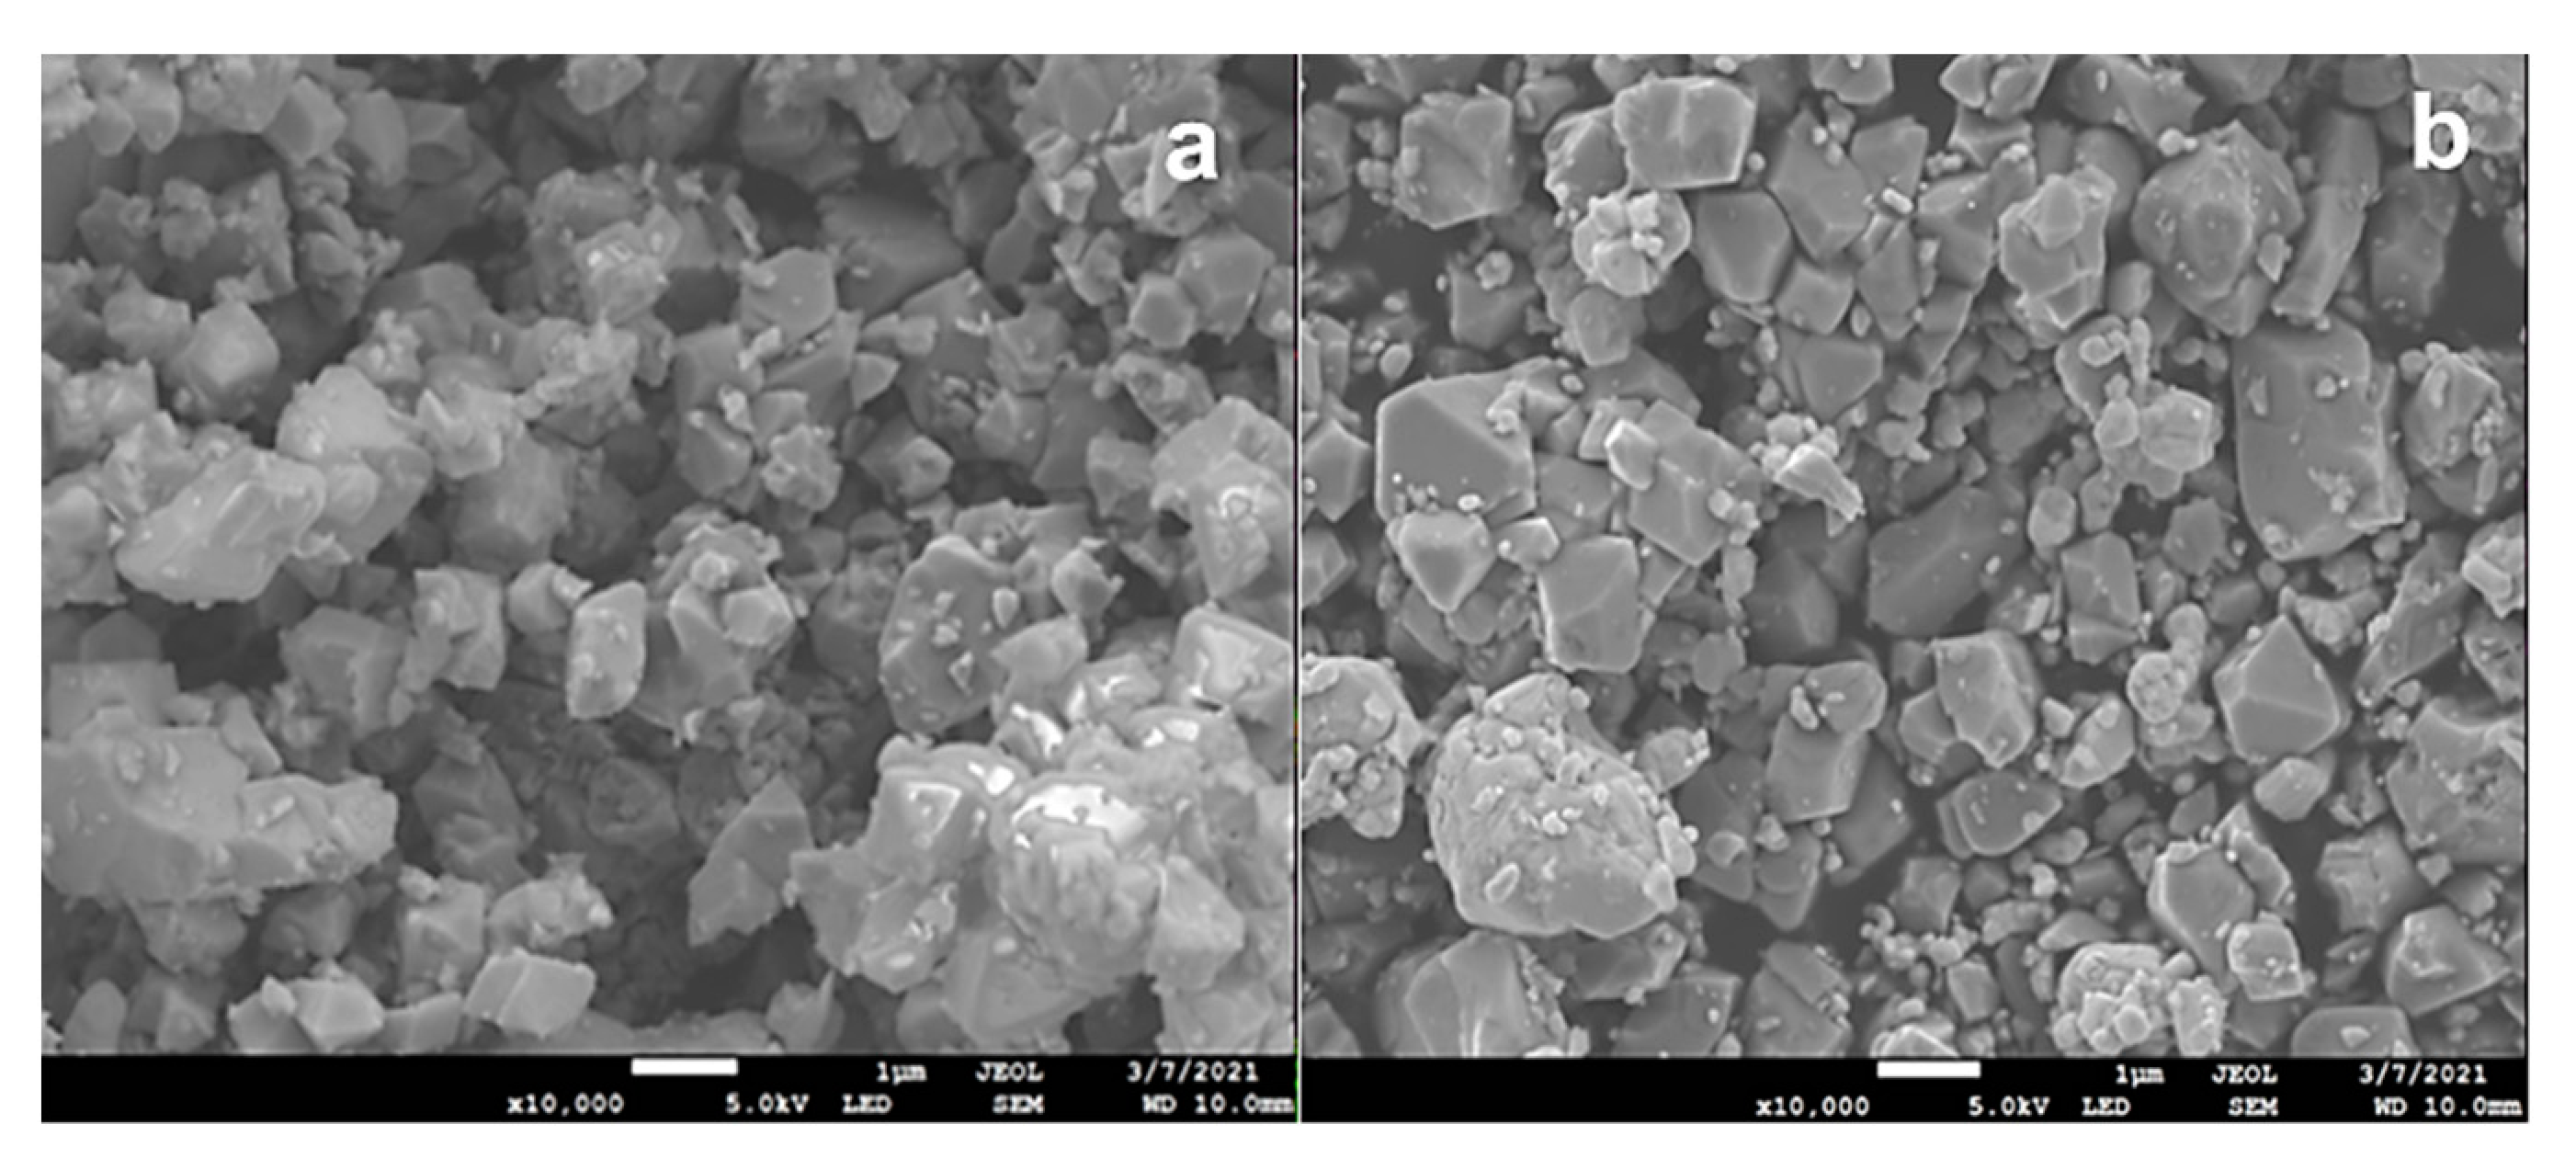
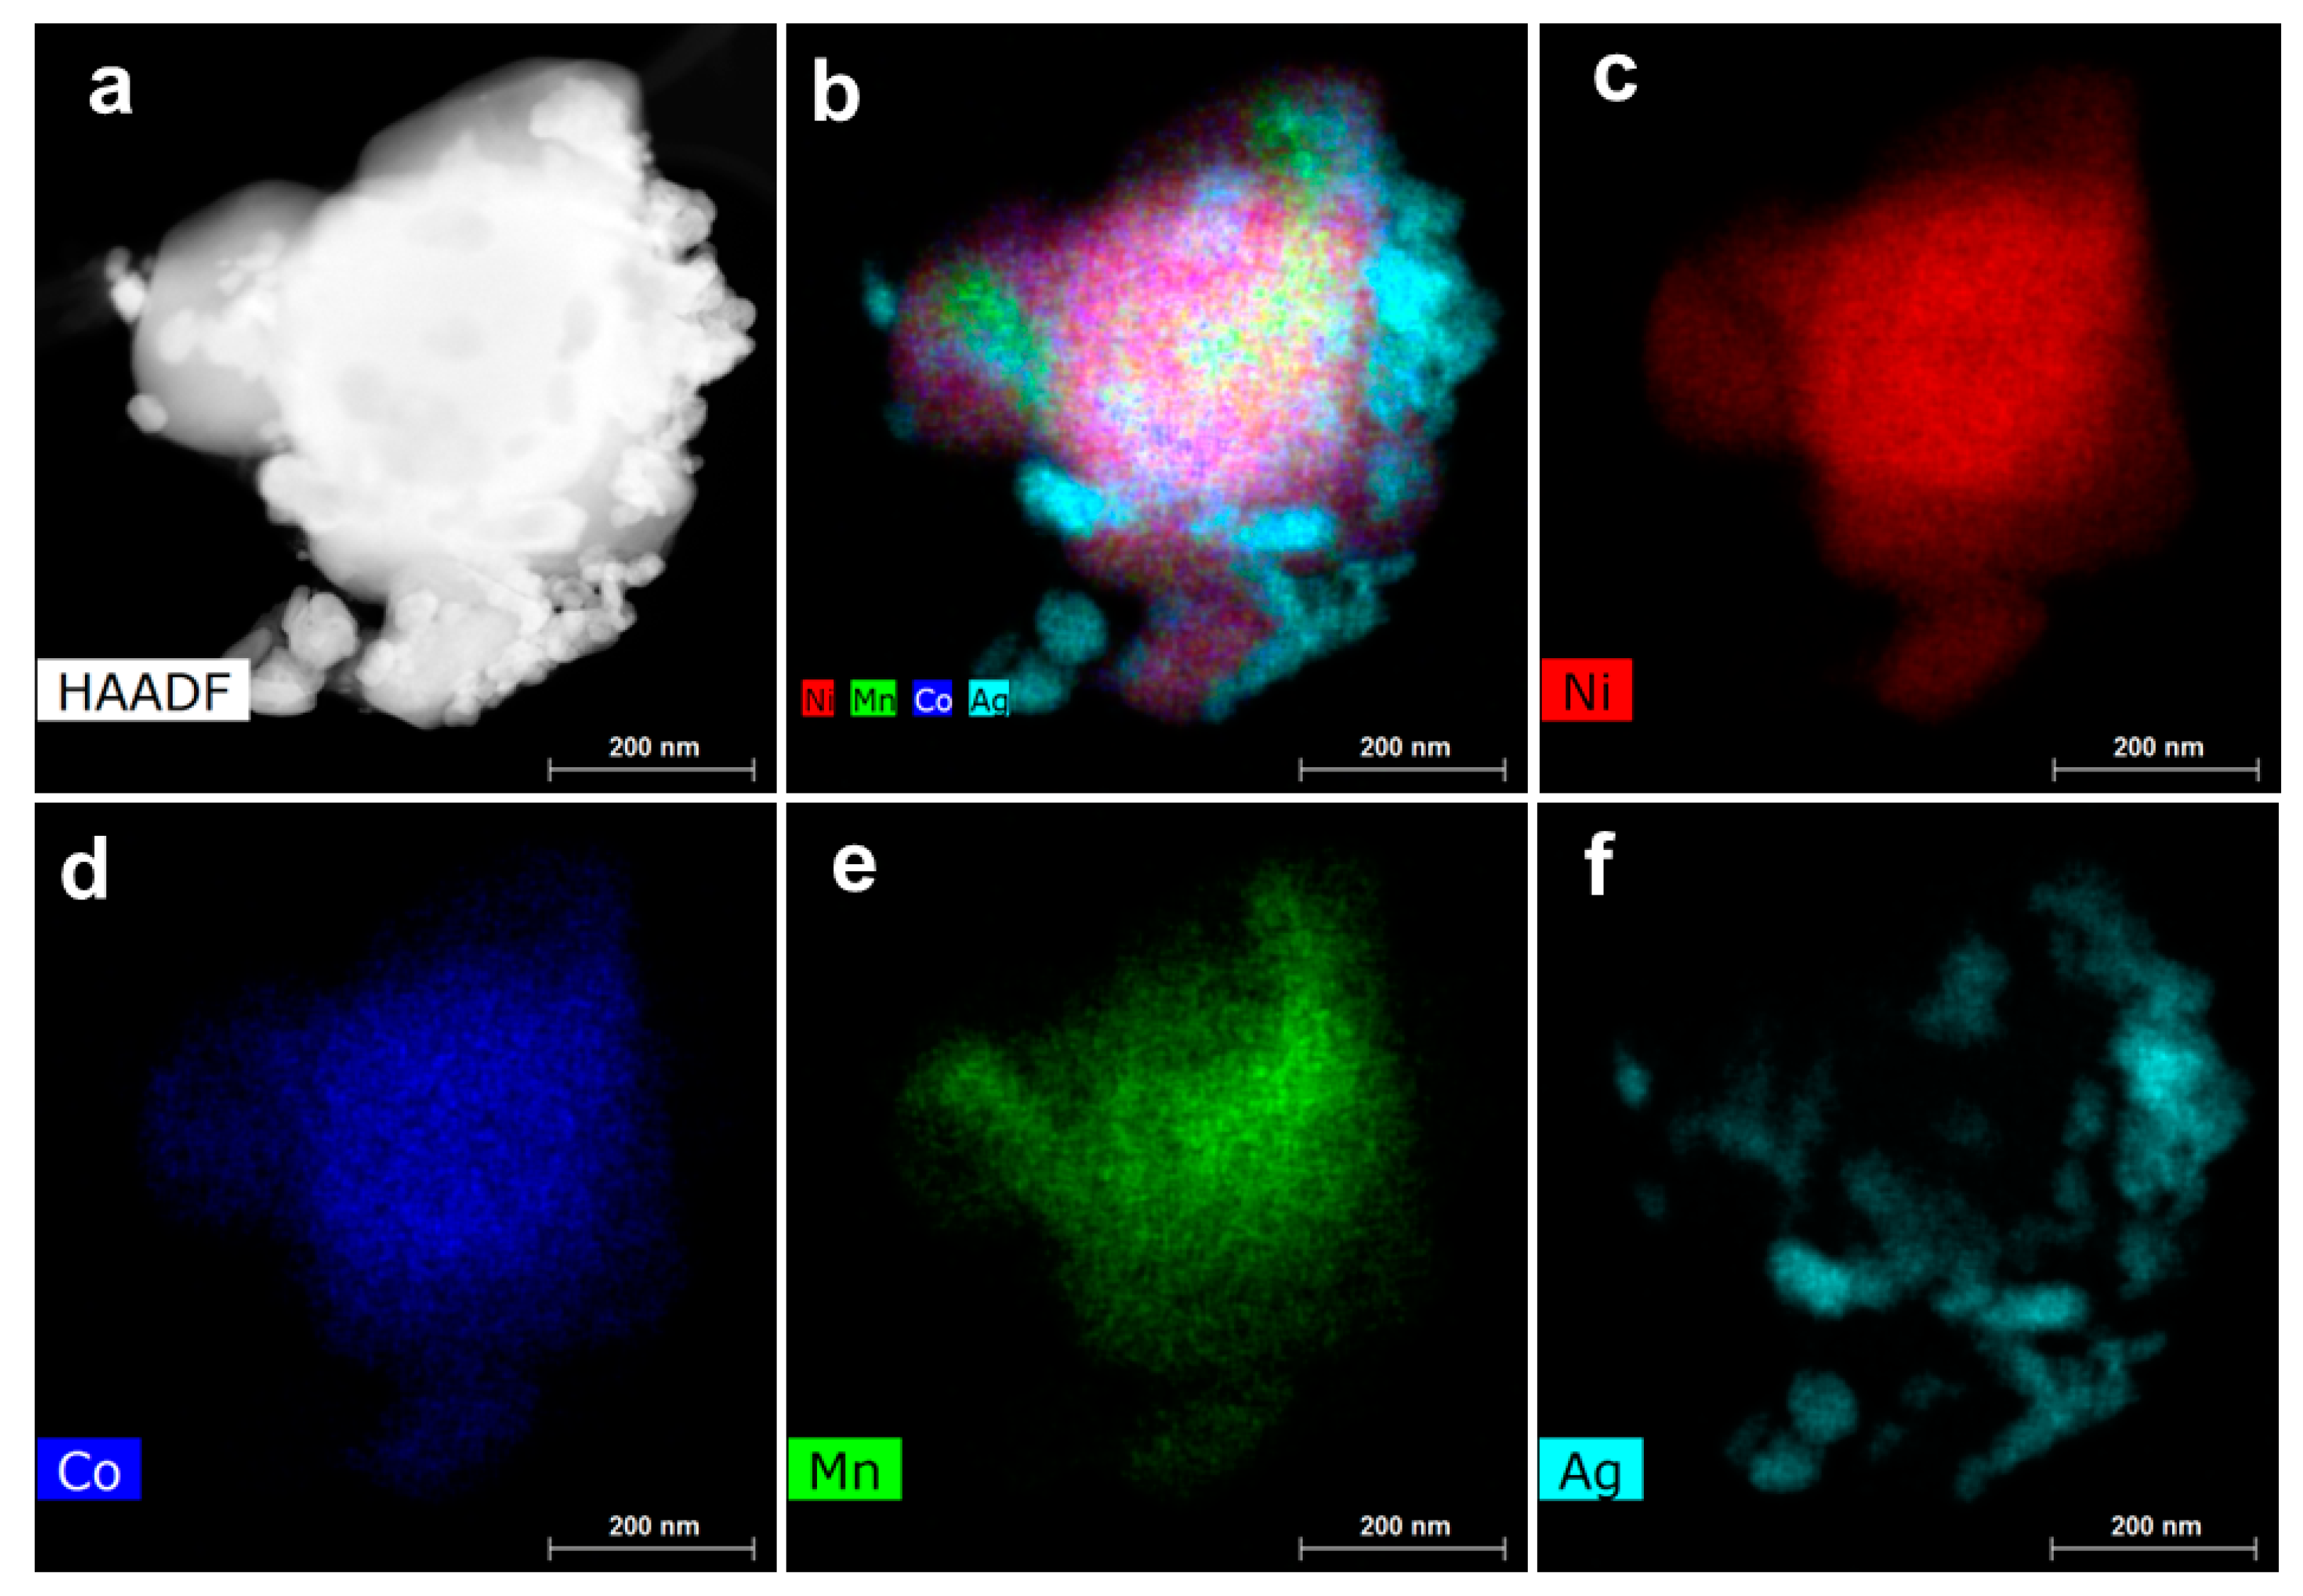
3.4. Morphology
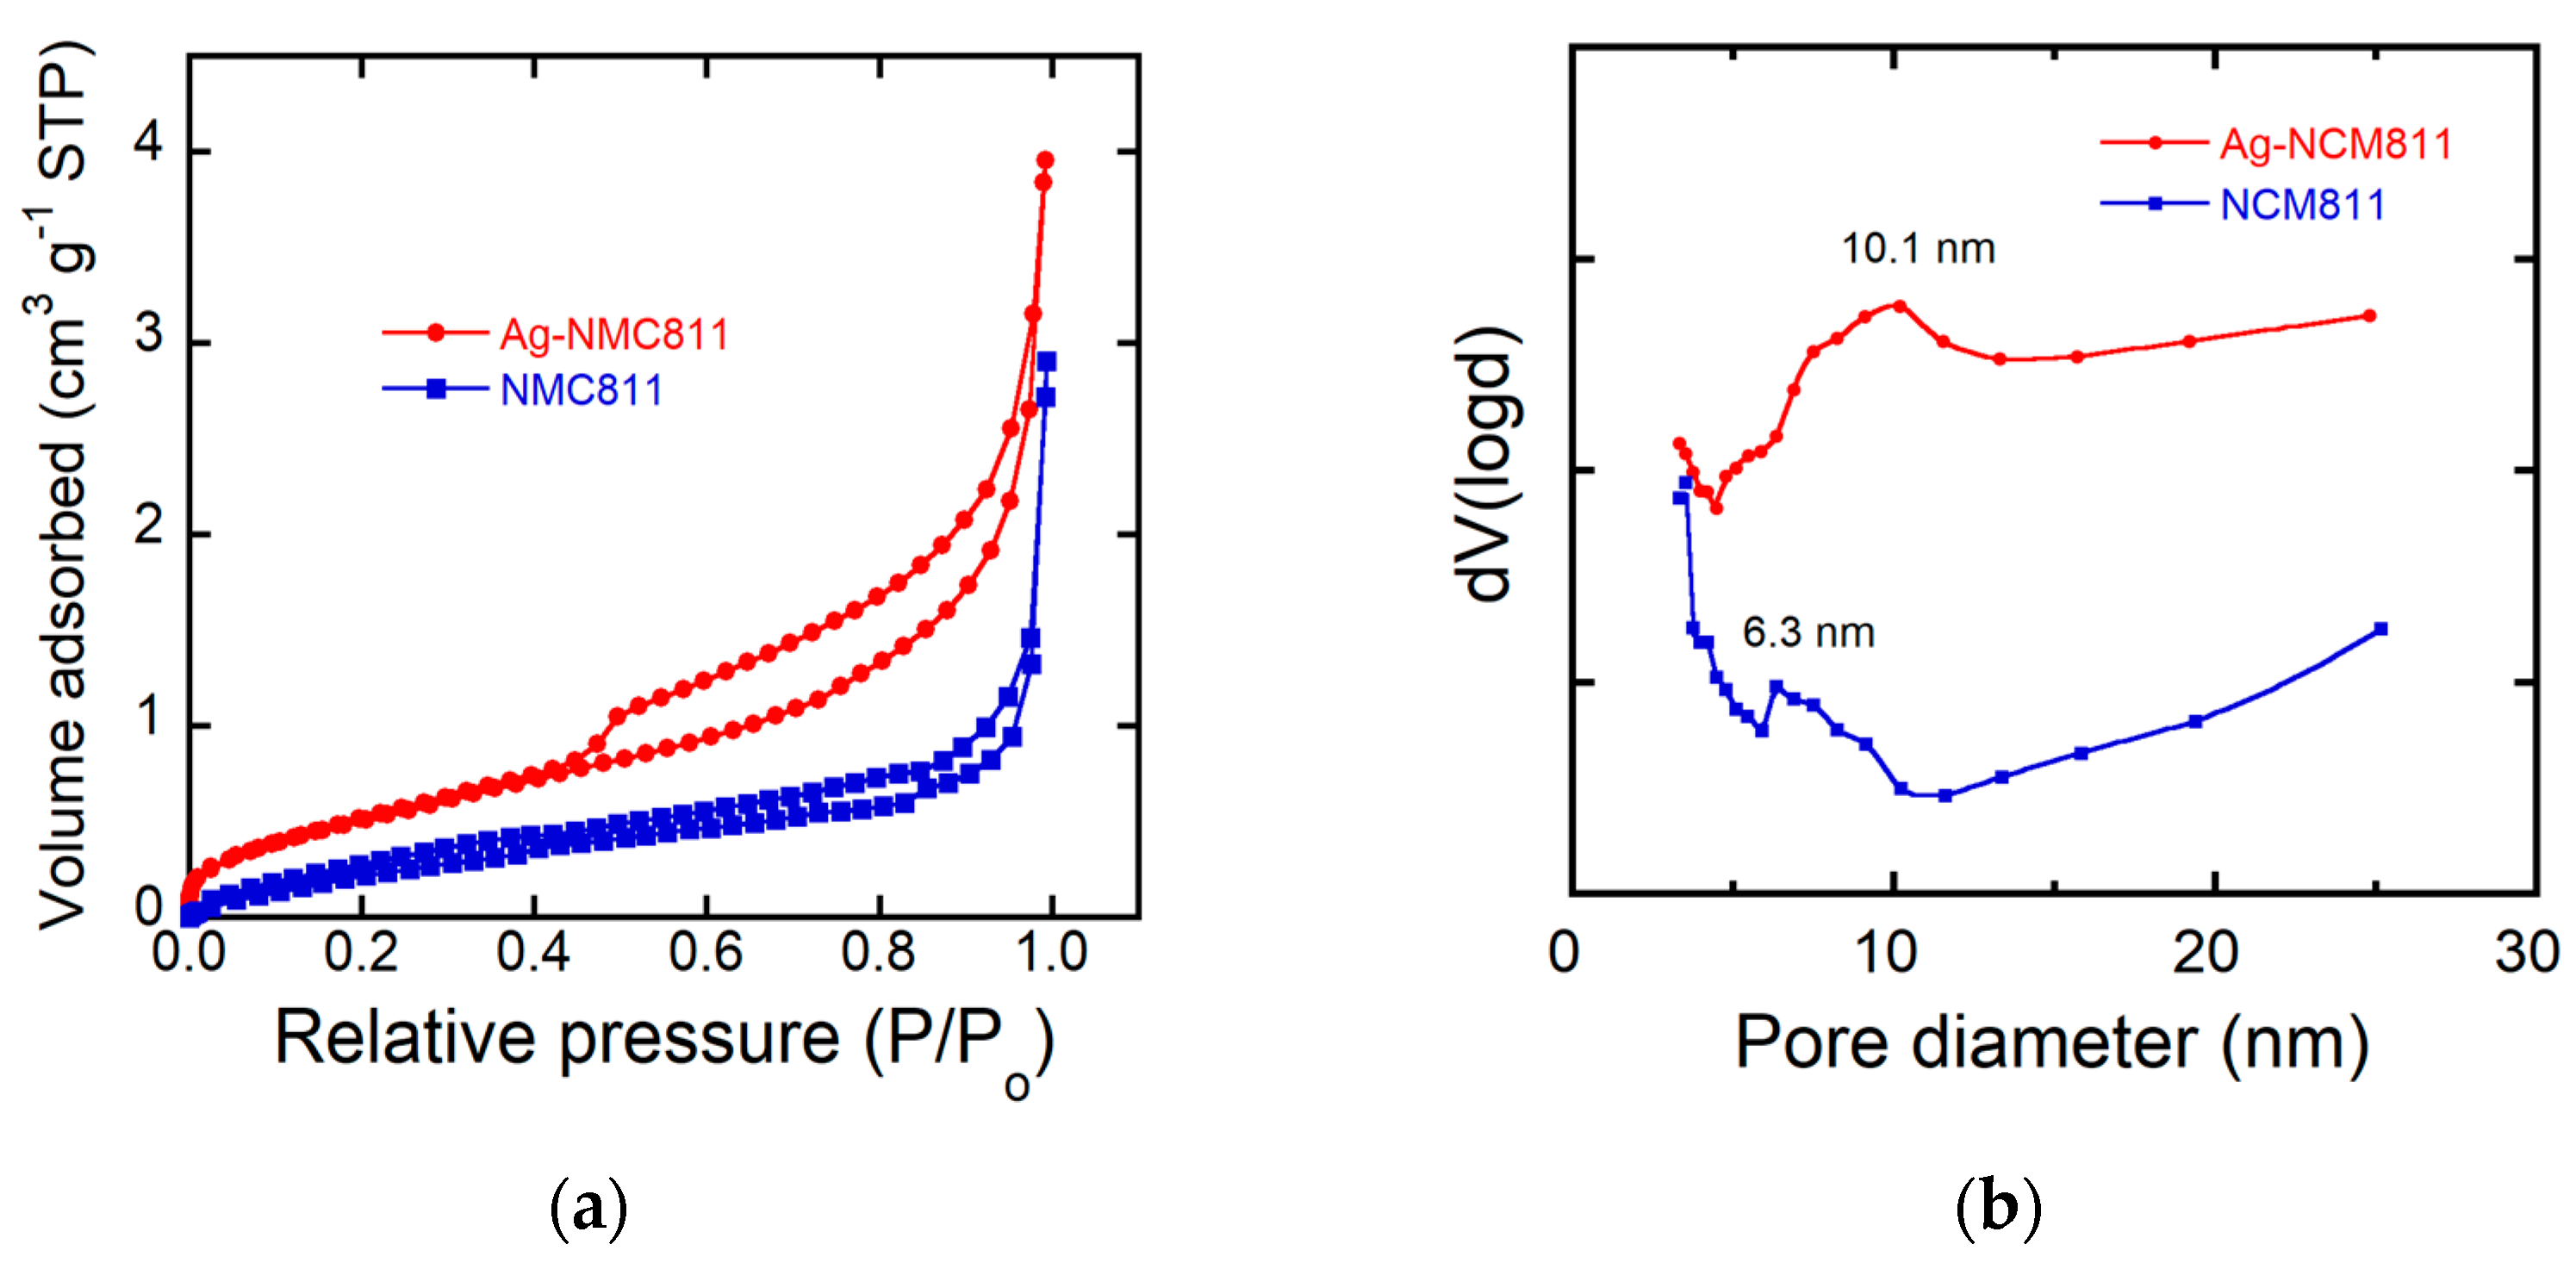
3.5. Microporosity
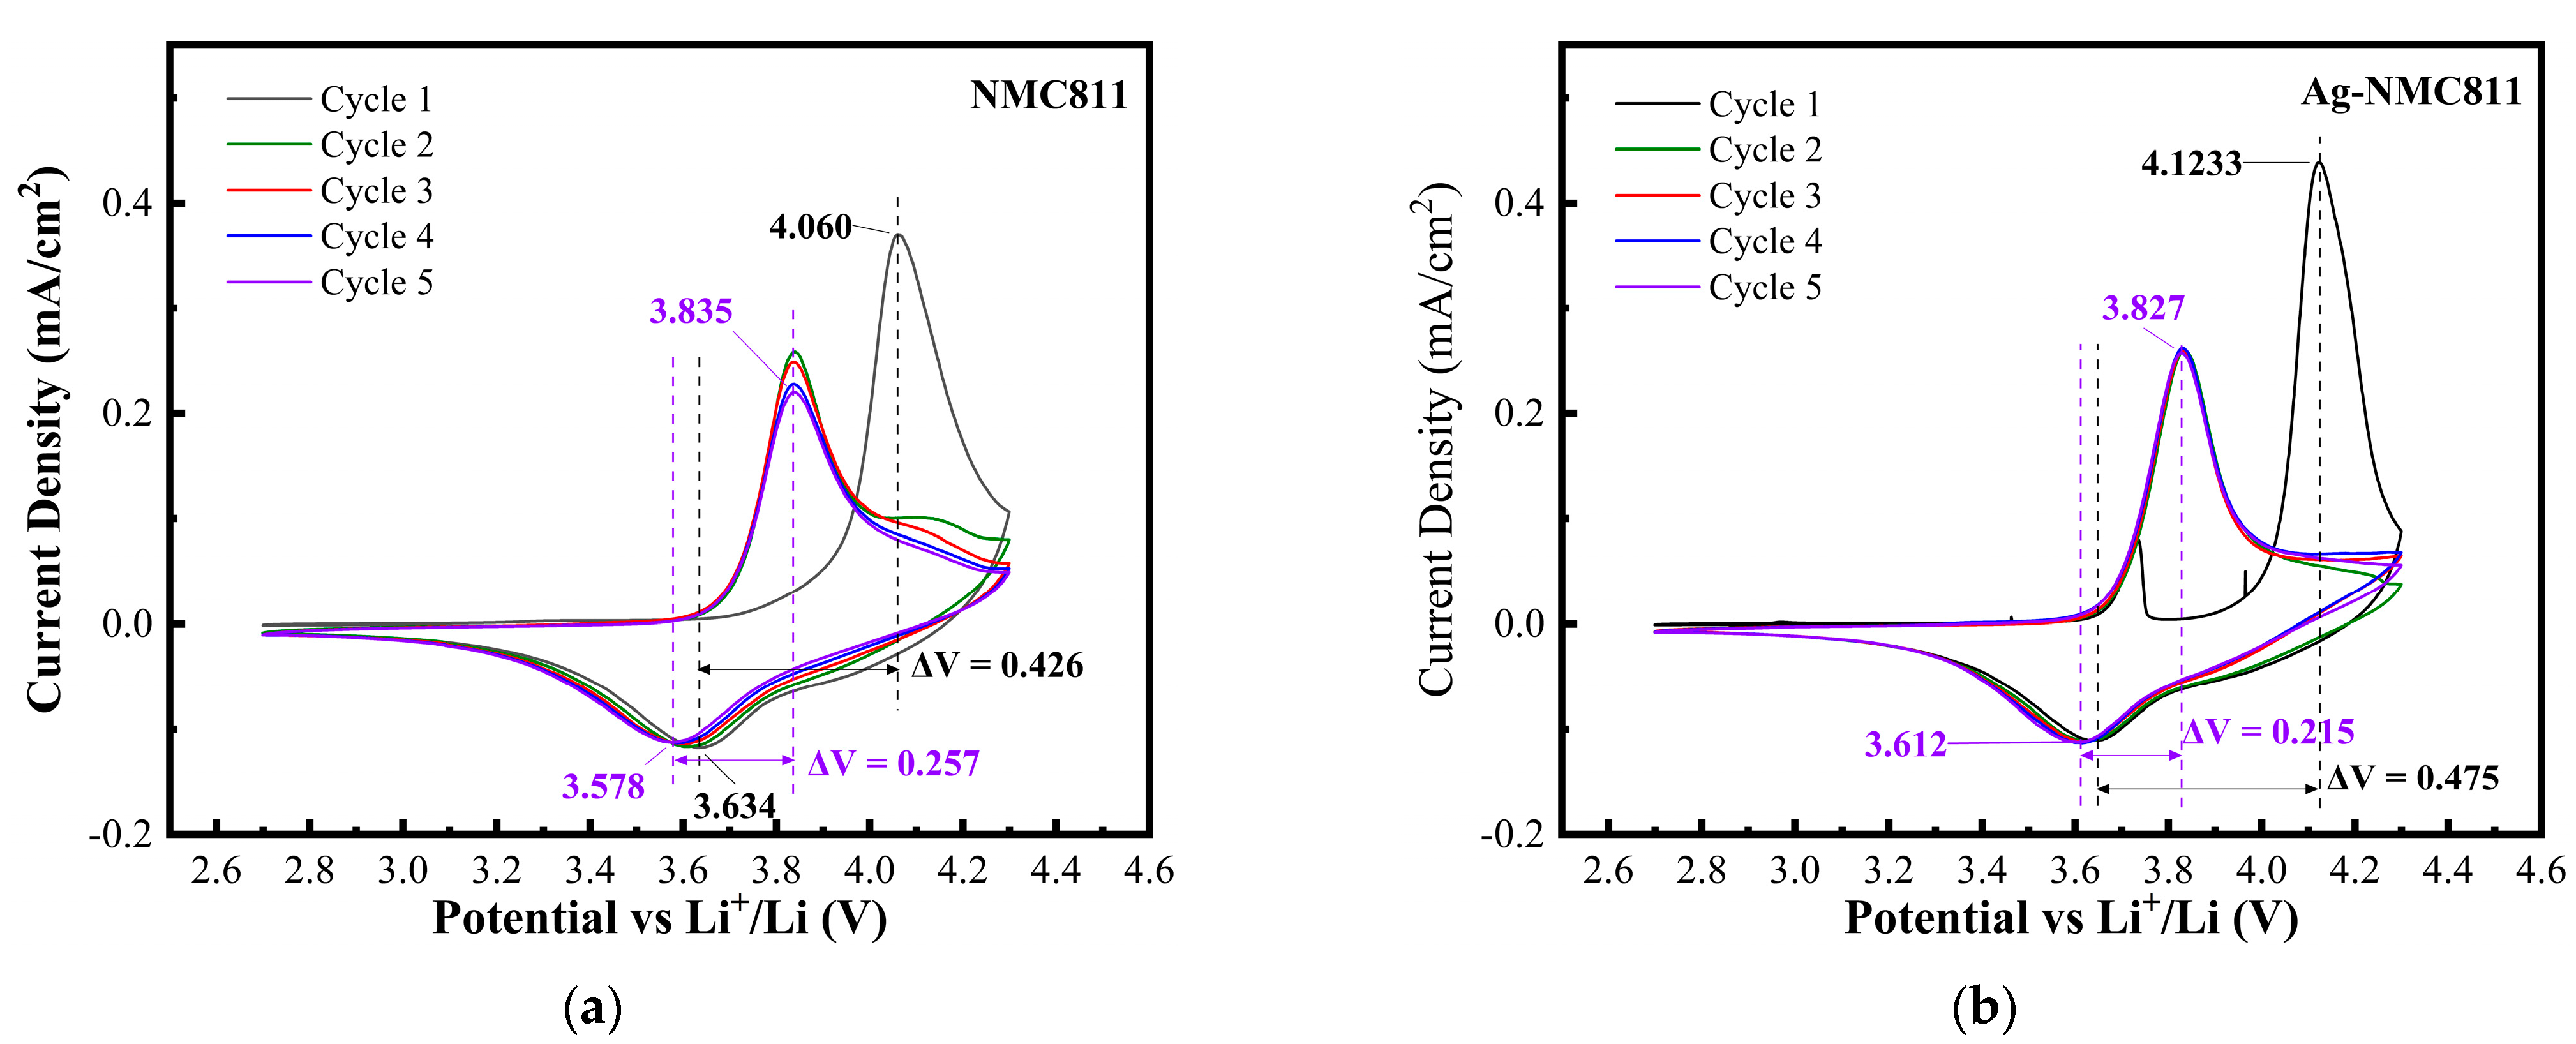
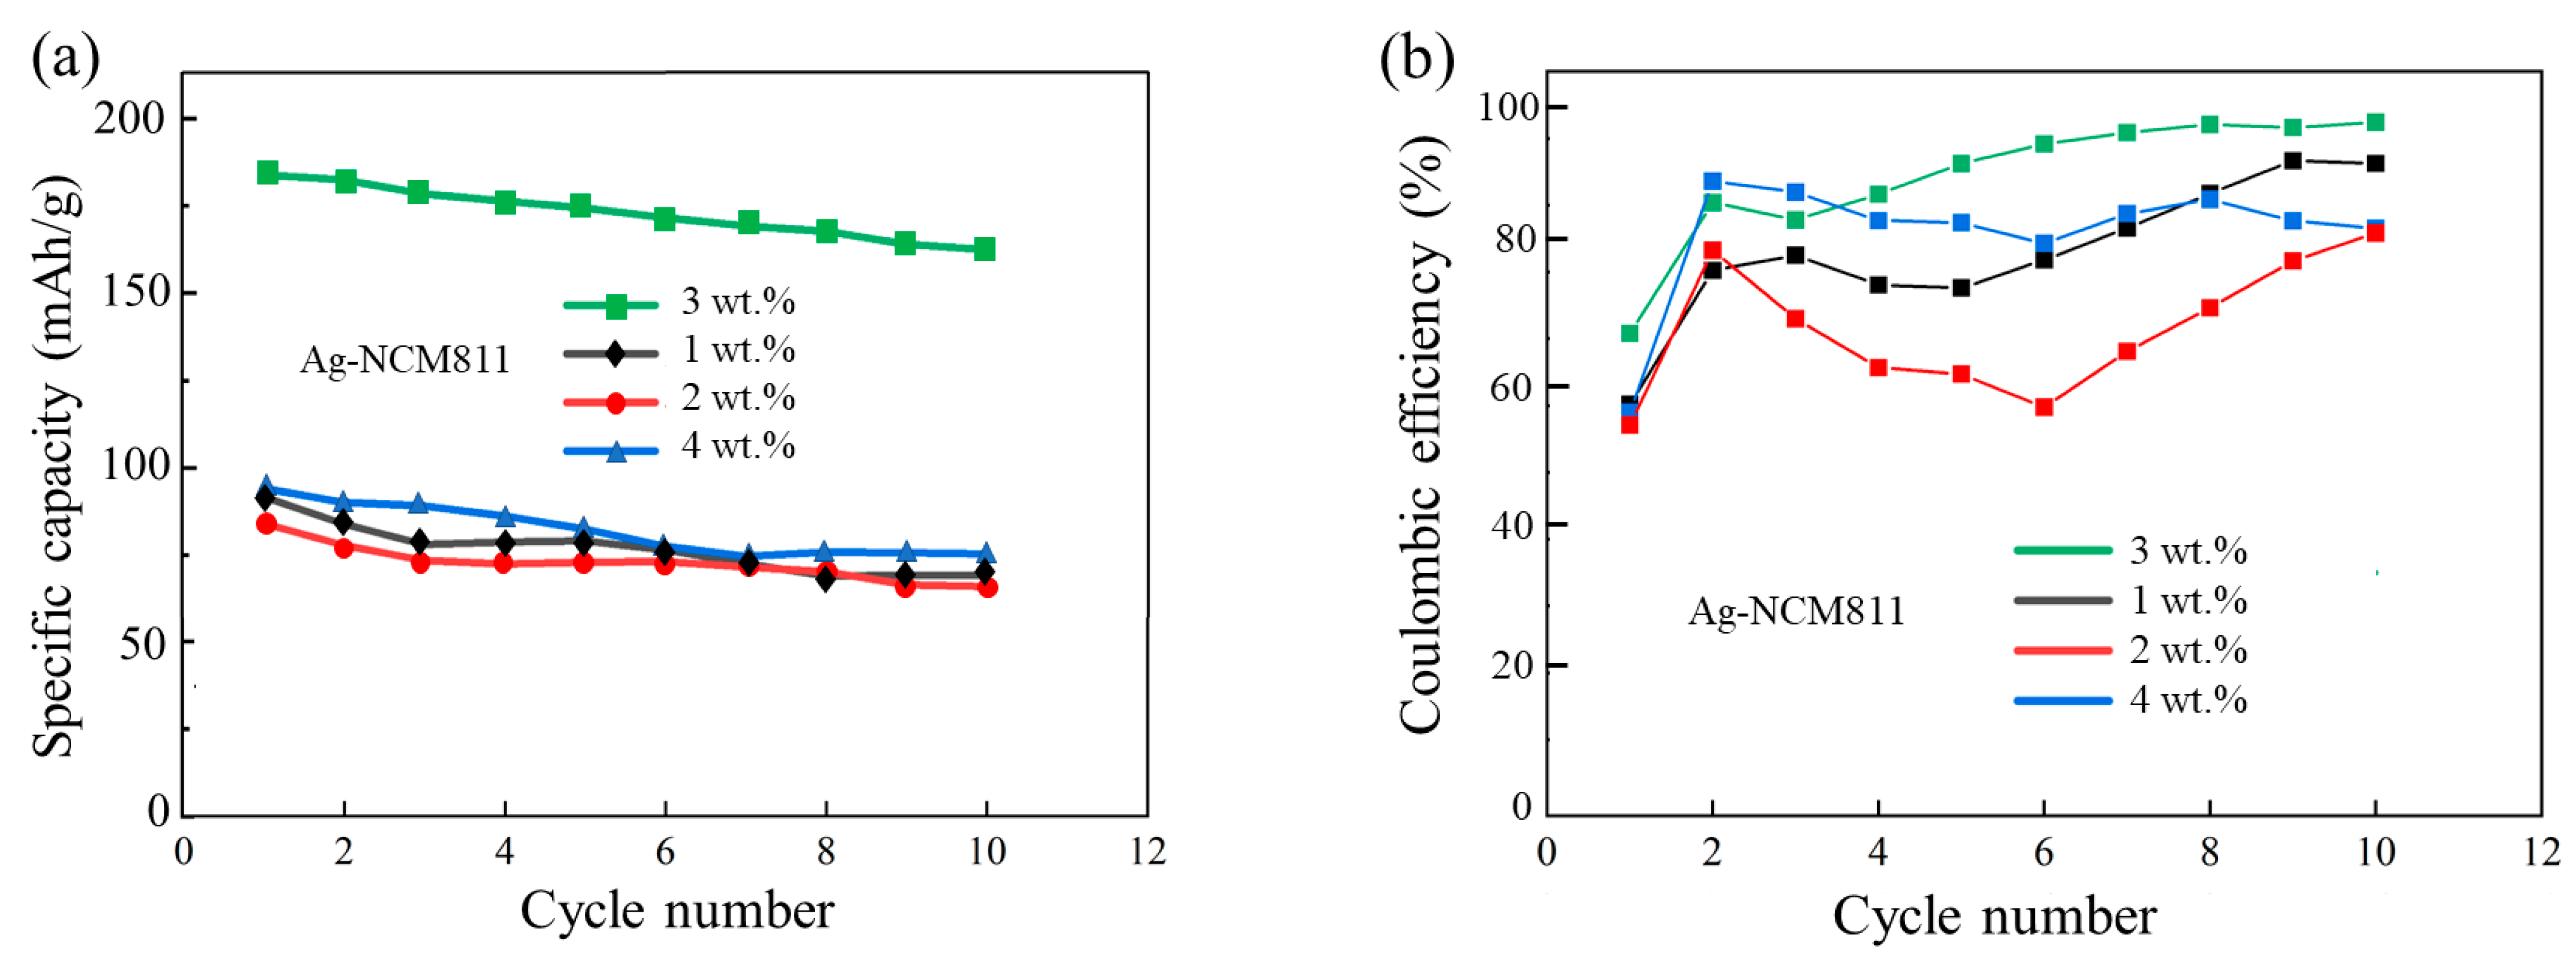
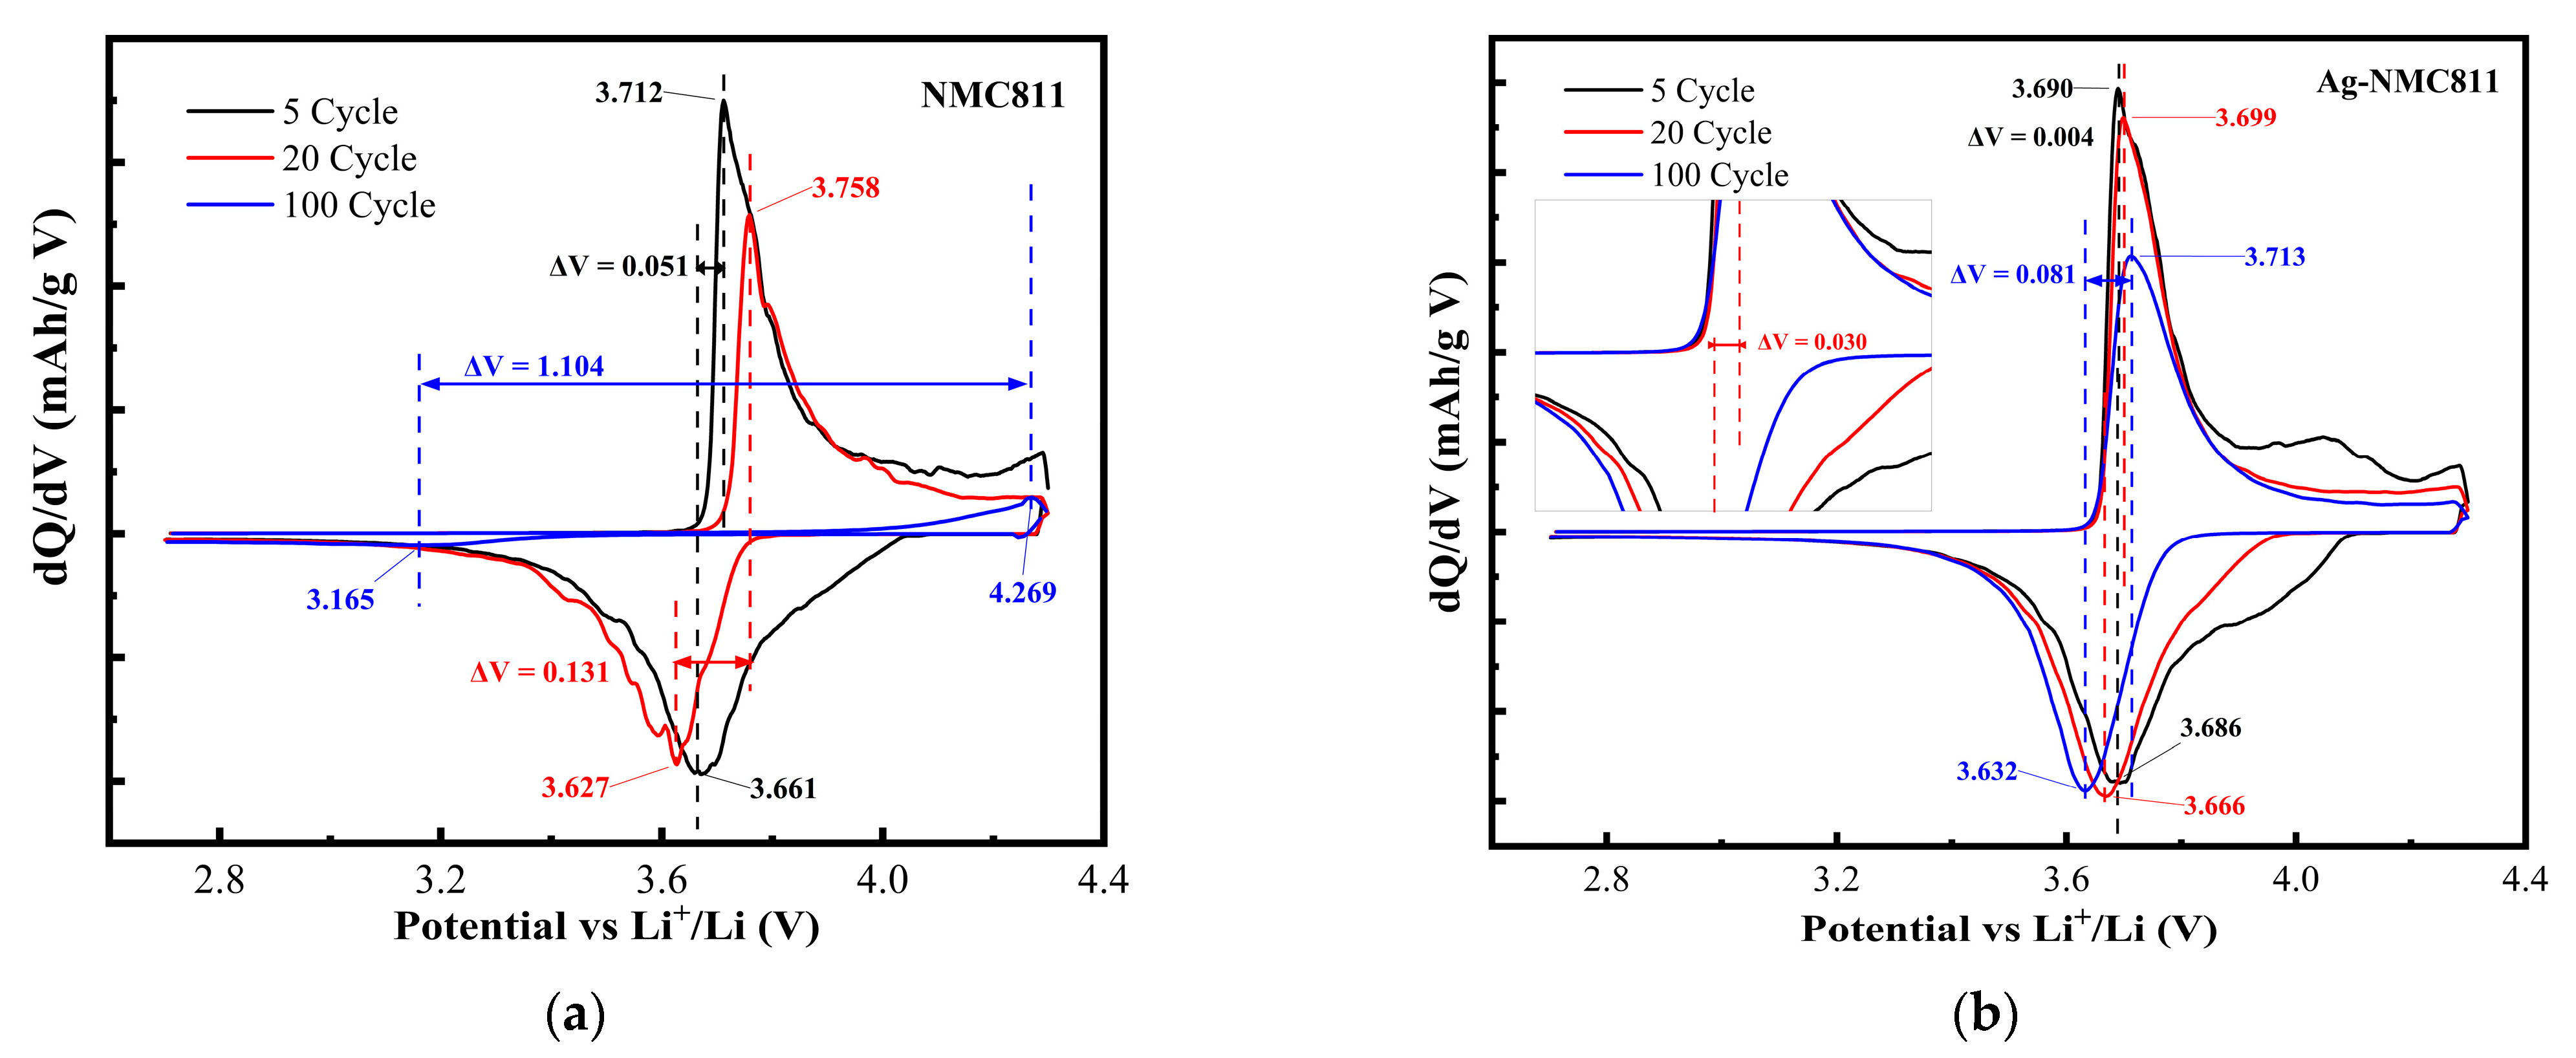
3.6. Electrochemical Properties
3.7. EIS Measurements
4. Discussion
5. Conclusions
Supplementary Materials
Author Contributions
Funding
Data Availability Statement
Acknowledgments
Conflicts of Interest
References
- Li, W.; Erickson, E.M.; Manthiram, A. High-nickel layered oxide cathodes for lithium-based automotive batteries. Nat. Energy 2020, 5, 26–34. [Google Scholar] [CrossRef]
- Weigel, T.; Schipper, F.; Erickson, E.M.; Susai, F.A.; Markovsky, B.; Aurbach, D. Structural and electrochemical aspects of LiNi0.8Co0.1Mn0.1O2 cathode materials doped with various cations. ACS Energy Lett. 2019, 4, 508–516. [Google Scholar] [CrossRef]
- Julien, C.M.; Mauger, A. NCA, NCM811, and the route to Ni-richer lithium-ion batteries. Energies 2020, 13, 6363. [Google Scholar] [CrossRef]
- Wu, F.; Li, Q.; Chen, L.; Zhang, Q.; Wang, Z.; Lu, Y.; Bao, L.; Chen, S.; Su, Y. Improving the structure stability of LiNi0.8Co0.1Mn0.1O2 by surface perovskite-like La2Ni0.5Li0.5O4 self-assembling and subsurface La3+ doping. ACS Appl. Mater. Interfaces 2019, 11, 36751–36762. [Google Scholar] [CrossRef] [PubMed]
- Park, K.; Park, J.-H.; Choi, B.; Kim, J.H.; Hong, S.-G.; Han, H.N. Metal phosphate coated Ni-rich layered oxide positive electrode materials for Li-ion batteries: Improved electrochemical performance and decreased Li residuals content. Electrochim. Acta 2017, 257, 217–223. [Google Scholar] [CrossRef]
- Jo, C.-H.; Cho, D.-H.; Noh, H.-J.; Yashiro, H.; Sun, Y.-K.; Myung, S.T. An effective method to reduce residual lithium compounds on Ni-rich Li[Ni0.6Co0.2Mn0.2]O2 active material using a phosphoric acid derived Li3PO4 nanolayer. Nano Res. 2014, 8, 1464–1479. [Google Scholar] [CrossRef]
- Meng, K.; Wang, Z.; Guo, H.; Li, X. Enhanced cycling stability of LiNi0.8Co0.1Mn0.1O2 by reducing surface oxygen defects. Electrochim. Acta 2017, 234, 99–107. [Google Scholar] [CrossRef]
- Ren, X.; Li, Y.; Xi, X.; Liu, S.; Xiong, Y.; Zhang, D.; Wang, S.; Zheng, J. Modification of LiNi0.8Co0.1Mn0.1O2 cathode materials from the perspective of chemical stabilization and kinetic hindrance. J. Power Sources 2021, 499, 229756. [Google Scholar] [CrossRef]
- Susai, F.A.; Kovacheva, D.; Chakraborty, A.; Kravchuk, T.; Ravikumar, R.; Talianker, M.; Grinblat, J.; Burstein, L.; Kauffmann, Y.; Major, D.T.; et al. Improving performance of LiNi0.8Co0.1Mn0.1O2 cathode materials for lithium-ion batteries by doping with molybdenum-ions: Theoretical and experimental studies. ACS Appl. Energy Mater. 2019, 2, 4521–4534. [Google Scholar] [CrossRef]
- Feng, Z.; Rajagopalan, R.; Zhang, S.; Sun, D.; Tang, Y.; Ren, Y.; Wang, H. A three in one strategy to achieve zirconium doping, boron doping, and interfacial coating for stable LiNi0.8Co0.1Mn0.1O2 cathode. Adv. Sci. 2021, 8, 2001809. [Google Scholar] [CrossRef] [PubMed]
- Song, L.; Jiang, P.; Cao, Z.; Zhou, C.; Du, J.; Liu, P. Core-shell structure LiNi0.8Co0.1Mn0.1O2 cathode material with improved electrochemical performance at high voltage. Ionics 2021, 27, 949–959. [Google Scholar] [CrossRef]
- Hou, P.; Zhang, H.; Zi, Z.; Zhang, L.; Xu, X. Core-shell and concentration-gradient cathodes prepared via co-precipitation reaction for advanced lithium-ion batteries. J. Mater. Chem. A 2017, 5, 4254–4279. [Google Scholar] [CrossRef]
- Zhang, H.; Cen, T.; Tian, Y.; Zhang, X. Synthesis of high-performance single-crystal LiNi0.8Co0.1Mn0.1O2 cathode materials by controlling solution super-saturation. J. Power Sources 2022, 532, 231037. [Google Scholar] [CrossRef]
- Li, Y.; Tan, C.; Wei, S.; Cui, L.; Fan, X.; Pan, Q.; Lai, F.; Zheng, F.; Wang, H.; Li, Q. Stable surface construction of the Ni-rich LiNi0.8Mn0.1Co0.1O2 cathode material for high performance lithium-ion batteries. J. Mater. Chem. A 2020, 8, 21649–21660. [Google Scholar] [CrossRef]
- Zhang, X.; Belharouak, I.; Li, L.; Lei, Y.; Elam, J.W.; Nie, A.; Chen, X.; Yassar, R.S.; Axelbaum, R.L. Structural and electrochemical study of Al2O3 and TiO2 coated Li1.2Ni0.13Mn0.54Co0.13O2 cathode material using ALD. Adv. Energy Mater. 2013, 3, 1299–1307. [Google Scholar] [CrossRef]
- Lee, S.-H.; Park, G.-J.; Sim, S.-J.; Jin, B.-S.; Kim, H.-S. Improved electrochemical performances of LiNi0.8Co0.1Mn0.1O2 cathode via SiO2 coating. J. Alloys Compd. 2019, 791, 193–199. [Google Scholar] [CrossRef]
- Abdel-Ghany, A.E.; El-Tawil, R.S.; Hashem, A.M.; Mauger, A.; Julien, C.M. Improved electrochemical performance of LiNi0.5Mn0.5O2 by Li-enrichment and AlF3 coating. Materialia 2019, 5, 100207. [Google Scholar] [CrossRef]
- Xiao, B.; Wang, B.; Liu, J.; Kaliyappan, K.; Sun, Q.; Liu, Y.; Dadheech, G.; Balogh, M.P.; Yang, L.; Sham, T.-K.; et al. Highly stable Li1.2Mn0.54Co0.13Ni0.13O2 enabled by novel atomic layer deposited AlPO4 coating. Nano Energy 2017, 34, 120–130. [Google Scholar] [CrossRef]
- Zhang, H.; Xu, J.; Zhang, J. Surface-coated LiNi0.8Co0.1Mn0.1O2 (NCM811) cathode materials by Al2O3, ZrO2, and Li2O-2B2O3 thin-layers for improving the performance of lithium ion batteries. Front. Mater. 2019, 6, 309. [Google Scholar] [CrossRef]
- Xiao, Z.; Hu, C.; Song, L.; Li, L.; Li, L.; Cao, Z.; Zhu, H.; Liu, J.; Li, X.; Tang, F. Modification research of LiAlO2-coated LiNi0.8Co0.1Mn0.1O2 as a cathode material for lithium-ion battery. Ionics 2018, 24, 91–98. [Google Scholar] [CrossRef]
- Xiong, X.; Ding, D.; Wang, Z.; Huang, B.; Guo, H.; Li, X. Surface modification of LiNi0.8Co0.1Mn0.1O2 with conducting polypyrrole. J. Solid State Electrochem. 2014, 18, 2619–2624. [Google Scholar] [CrossRef]
- Wang, H.; Lin, J.; Zhang, X.; Wang, L.; Yang, J.; Fan, E.; Wu, F.; Chen, R.; Li, L. Improved electrochemical performance of LiNi0.8Co0.1Mn0.1O2 cathode materials induced by a facile polymer coating for lithium-ion batteries. ACS Appl. Energy Mater. 2021, 4, 6205–6213. [Google Scholar] [CrossRef]
- Meng, E.; Zhang, M.; Hu, Y.; Gong, F.; Zhang, L.; Li, F. Solid-state attachments of Ag nanoparticles onto the surfaces of LiFePO4 cathode materials for Li storage with enhanced capabilities. Electrochim. Acta 2018, 265, 160–165. [Google Scholar] [CrossRef]
- Abbas, S.M.; Hashem, A.M.; Abdel-Ghany, A.E.; Ismail, E.H.; Kotlár, M.; Winter, M.; Li, J.; Julien, C.M. Ag-modified LiMn2O4 cathode for lithium-ion batteries: Coating functionalization. Energies 2020, 13, 5194. [Google Scholar] [CrossRef]
- Kim, J.-G.; Shi, D.; Park, M.-S.; Jeong, G.; Heo, Y.-U.; Seo, M.; Kim, Y.-J.; Kim, J.H.; Dou, S.X. Controlled Ag-driven superior rate-capability of Li4Ti5O12 anodes for lithium rechargeable batteries. Nano Res. 2013, 6, 365–372. [Google Scholar] [CrossRef]
- Abuzeid, H.M.; Hashem, A.M.; Narayanan, N.; Ehrenberg, H.; Julien, C.M. Nanosized silver-coated and doped manganese dioxide for rechargeable lithium batteries. Solid State Ion. 2011, 182, 108–115. [Google Scholar] [CrossRef]
- Sun, H.; Zhang, Y.; Li, W.; Zhang, D.; Wang, Q.; Wang, B. Effects of Ag coating on the structural and electrochemical properties of LiNi0.8Co0.1Mn0.1O2 as cathode material for lithium ion batteries. Electrochim. Acta 2019, 327, 135054. [Google Scholar] [CrossRef]
- Sun, H.; Wang, J.; Liu, Q.; Zhang, Y.; Zhang, S.D.; Wang, Q.; Li, Z. Ag-Sn dual-modified LiNi0.8Mn0.1Co0.1O2 as cathode for lithium storage. J. Alloys Compd. 2021, 850, 156763. [Google Scholar] [CrossRef]
- Kim, D.-W.; Kim, T.-H.; Park, D.-W. Preparation of silver coated nickel particles by thermal plasma with pre-treatment using ball milling. Adv. Powder Technol. 2018, 29, 2686–2692. [Google Scholar] [CrossRef]
- Hua, K.; Li, X.; Bao, R.; Fang, D.; Jiang, M.; Yi, J.; Luo, Z.; Shu, Y.; Sun, B. Electrochemical performance of silver vanadate/silver nanowire composite for lithium-ion batteries. Solid State Ion. 2018, 325, 133–140. [Google Scholar] [CrossRef]
- Ohzuku, T.; Ueda, A.; Nagayama, M. Electrochemistry and structural chemistry of LiNiO2 (Rm) for 4volt secondary lithium cells. J. Electrochem. Soc. 1993, 140, 1862–1870. [Google Scholar] [CrossRef]
- Allen, J.P.; Scanlon, D.O.; Watson, G.W. Electronic structure of mixed-valence silver oxide AgO from hybrid density-functional theory. Phys. Rev. B. 2010, 81, 161103. [Google Scholar] [CrossRef]
- Williamson, G.K.; Hall, W.H. X-ray line broadening from filed aluminium and wolfram. Acta Metall. 1953, 1, 22–31. [Google Scholar] [CrossRef]
- Zhu, W.; Huang, X.; Liu, T.; Xie, Z.; Wang, Y.; Tian, K.; Bu, L.; Wan, H.; Gao, L.; Zhao, J. Ultrathin Al2O3 coating on LiNi0.8Co0.1Mn0.1O2 cathode material for enhanced cycleability at extended voltage ranges. Coatings 2019, 9, 92. [Google Scholar] [CrossRef]
- Wang, H.; Hashem, A.M.; Abdel-Ghany, A.E.; Abbas, S.M.; El-Tawil, R.S.; Li, T.; Li, X.; El-Mounayri, H.; Tovar, A.; Zhu, L.; et al. Effect of cationic (Na+) and anionic (F−) co-doping on the structural and electrochemical properties of LiNi1/3Mn1/3Co1/3O2 cathode material for lithium-ion batteries. Int. J. Mol. Sci. 2022, 23, 6755. [Google Scholar] [CrossRef]
- Zhang, M.; Zhao, H.; Tan, M.; Liu, J.; Hu, Y.; Liu, S.; Shu, X.; Li, H.; Ran, Q.; Cai, J.; et al. Yttrium modified Ni-rich LiNi0.8Co0.1Mn0.1O2 with enhanced electrochemical performance as high energy density cathode material at 4.5 V high voltage. J. Alloys Compd. 2019, 774, 82–92. [Google Scholar] [CrossRef]
- Yang, X.; Tang, H.; Xu, J.; Antonietti, M.; Shalom, M. Silver phosphate/graphitic carbon nitride as an efficient photocatalytic tandem system for oxygen evolution. ChemSusChem 2015, 8, 1350–1358. [Google Scholar] [CrossRef] [PubMed]
- Tang, H.; Chang, S.; Tang, G.; Liang, W. AgBr and g-C3N4 co-modified Ag2CO3 photocatalyst: A novel multi-heterostructured photocatalyst with enhanced photocatalytic activity. Appl. Surf. Sci. 2017, 391, 440–448. [Google Scholar] [CrossRef]
- Jimenez, J.A.; Liu, H.; Fachini, E. X-ray photoelectron spectroscopy of silver nanoparticles in phosphate glass. Mater. Lett. 2010, 64, 2046–2048. [Google Scholar] [CrossRef]
- Zhuang, G.V.; Chen, G.; Shim, J.; Song, X.; Ross, P.N.; Richardson, T.J. Li2CO3 in LiNi0.8Co0.15Al0.05O2 cathodes and its effects on capacity and power. J. Power Sources 2004, 134, 293–297. [Google Scholar] [CrossRef]
- Aurbach, D.; Gamolsky, K.; Markovsky, B.; Salitra, G.; Gofer, Y.; Heider, U.; Oesten, R.; Schmidt, M. The study of surface phenomena related to electrochemical lithium intercalation into LixMOy host materials (M = Ni, Mn). J. Electrochem. Soc. 2000, 147, 1322–1331. [Google Scholar] [CrossRef]
- Ben-Kamel, K.; Amdouni, N.; Mauger, A.; Julien, C.M. Study of the local structure of LiNi0.33+δMn0.33+δCo0.33−2δO2 (0.025 ≤ δ ≤ 0.075) oxides. J. Alloys Compd. 2012, 528, 91–98. [Google Scholar] [CrossRef]
- Julien, C.M.; Massot, M. Raman scattering of LiNi1–yAlyO2. Solid State Ion. 2002, 148, 53–59. [Google Scholar] [CrossRef]
- Flores, E.; Novak, P.; Berg, E.J. In situ and operando Raman spectroscopy of layered transition metal oxides for Li-ion battery cathodes. Front. Energy Res. 2018, 6, 82. [Google Scholar] [CrossRef]
- Julien, C.M.; Mauger, A. In situ Raman analyses of electrode materials for Li-ion batteries. AIMS Mater. Sci. 2018, 5, 650–698. [Google Scholar] [CrossRef]
- Ayanwale, A.P.; Estrada-Capetillo, B.L.; Reyes-López, S.Y. Evaluation of antifungal activity by mixed oxide metallic nanocomposite against Candida spp. Processes 2021, 9, 773. [Google Scholar] [CrossRef]
- Lu, J.; Cai, Z.; Zou, Y.; Wu, D.; Wang, A.; Chang, J.; Wang, F.; Tian, Z.; Liu, G. Silver nanoparticle-based surface-enhanced Raman spectroscopy for the rapid and selective detection of trace tropane alkaloids in food. ACS Appl. Nano Mater. 2019, 2, 6592–6601. [Google Scholar] [CrossRef]
- Abdel-Ghany, A.E.; Hashem, A.M.; Mauger, A.; Julien, C.M. Lithium-rich cobalt-free manganese-based layered cathode materials for Li-ion batteries: Suppressing the voltage fading. Energies 2020, 13, 3487. [Google Scholar] [CrossRef]
- Grenier, A.; Liu, H.; Wiaderek, K.M.; Lebens-Higgins, Z.W.; Borkiewicz, O.J.; Piper, L.F.J.; Chupas, P.J.; Chapman, K.W. Reaction heterogeneity in LiNi0.8Co0.15Al0.05O2 induced by surface layer. Chem. Mater. 2017, 29, 7345–7352. [Google Scholar] [CrossRef]
- Gao, S.; Zhan, X.; Cheng, Y.-T. Structural, electrochemical and Li-ion transport properties of Zr-modified LiNi0.8Co0.1Mn0.1O2 positive electrode materials for Li-ion batteries. J. Power Sources 2019, 410–411, 45–52. [Google Scholar] [CrossRef]
- Jan, S.S.; Nurgul, S.; Shi, X.; Xia, H.; Pang, H. Improvement of electrochemical performance of LiNi0.8Co0.1Mn0.1O2 cathode material by graphene nanosheets modification. Electrochim. Acta 2014, 149, 86–93. [Google Scholar] [CrossRef]
- He, S.; Wei, A.; Li, W.; Bai, X.; Zhang, L.; Li, X.; He, R.; Yang, L.; Liu, Z. An in-depth analysis detailing the structural and electrochemical properties within Br−modified LiNi0.815Co0.15A0.035O2 (NCA) cathode material. Electrochim. Acta 2019, 318, 362–373. [Google Scholar] [CrossRef]
- Yang, H.; Wu, H.H.; Ge, M.; Li, L.; Yuan, Y.; Yao, Q.; Chen, J.; Xia, L.; Zheng, J.; Chen, Z.; et al. Simultaneously dual modification of Ni-rich layered oxide cathode for high-energy lithium-ion batteries. Adv. Funct. Mater. 2019, 29, 1808825. [Google Scholar] [CrossRef]
- Zheng, J.; Yang, Z.; He, Z.; Tong, H.; Yu, W.; Zhang, J. In situ formed LiNi0.8Co0.15Al0.05O2@Li4SiO4 composite cathode material with high-rate capability and long cycling stability for lithium-ion batteries. Nano Energy 2018, 53, 613–621. [Google Scholar] [CrossRef]
- Hwang, S.; Chang, W.; Kim, S.M.; Su, D.; Kim, D.H.; Lee, J.Y.; Chung, K.Y.; Stach, E.A. Investigation of changes in the surface structure of LixNi0.8Co0.15Al0.05O2 cathode materials induced by the initial charge. Chem. Mater. 2014, 26, 1084–1092. [Google Scholar] [CrossRef]
- Liang, C.; Jiang, L.; Wei, Z.; Zhang, W.; Wang, Q.; Sun, J. Insight into the structural evolution and thermal behavior of LiNi0.8Co0.1Mn0.1O2 cathode under deep charge. J. Energy Chem. 2022, 65, 424–432. [Google Scholar] [CrossRef]
- Zhang, H.; Zhang, J. An overview of modification strategies to improve LiNi0.8Co0.1Mn0.1O2 (NCM811) cathode performance for automotive lithium-ion batteries. eTransport. 2021, 7, 100105. [Google Scholar] [CrossRef]
- Liu, J.; Zou, Z.; Zhang, S.; Zhang, H. Structure, modification, and commercialization of high nickel ternary material (LiNi0.8Co0.1Mn0.1O2 and LiNi0.8Co0.15Al0.05O2) for lithium ion batteries. J. Solid State Electrochem. 2021, 25, 387–410. [Google Scholar] [CrossRef]
- Feng, Z.; Rajagopalan, R.; Sun, D.; Tang, Y.; Wang, H. In-situ formation of hybrid Li3PO4-AlPO4-Al(PO3)3 coating layer on LiNi0.8Co0.1Mn0.1O2 cathode with enhanced electrochemical properties for lithium-ion battery. Chem. Eng. J. 2020, 382, 122959. [Google Scholar] [CrossRef]
- Chen, S.; He, T.; Su, Y.; Lu, Y.; Bao, L.; Chen, L.; Zhang, Q.; Wang, J.; Chen, R.; Wu, F. Ni-rich Ni0.8Co0.1Mn0.1O2 oxide coated by dual-conductive layers as high performance cathode material for lithium ion batteries. ACS Appl. Mater. Interfaces 2017, 35, 29732–29743. [Google Scholar] [CrossRef]
- Dai, S.; Yan, G.; Wang, L.; Luo, L.; Li, Y.; Yang, Y.; Liu, H.; Liu, Y.; Yuan, M. Enhanced electrochemical performance and thermal properties of Ni-rich LiNi0.8Co0.1Mn0.1O2 cathode material via CaF2 coating. J. Electroanal. Chem. 2019, 847, 113197. [Google Scholar] [CrossRef]
- Ho, C.; Raistrick, I.D.; Huggins, R.A. Application of a-c techniques to the study of lithium diffusion in tungsten trioxide thin films. J. Electrochem. Soc. 1980, 127, 343–350. [Google Scholar] [CrossRef]
- Jorcin, J.-B.; Orazem, M.E.; Pébère, N.; Tribollet, B. CPE analysis by local electrochemical impedance spectroscopy. Electrochim. Acta 2006, 51, 1473–1479. [Google Scholar] [CrossRef]
- Kim, Y.O.; Park, S.M. Intercalation mechanism of lithium ions into graphite layers studied by nuclear magnetic resonance and impedance experiments. J. Electrochem. Soc. 2001, 148, A194–A199. [Google Scholar] [CrossRef]
- Nguyen, T.Q.; Breitkopf, C. Determination of diffusion coefficients using impedance spectroscopy data. J. Electrochem. Soc. 2018, 165, E826–E831. [Google Scholar] [CrossRef]
- Bard, A.J.; Faulkner, L.R. Electrochemical Methods: Fundamentals and Applications; Wiley & Sons, Inc.: New York, NY, USA, 2001; pp. 226–260. [Google Scholar]
- She, S.; Zhou, Y.; Hong, Z.; Huang, Y.; Wu, Y. Surface coating of NCM-811 cathode materials with g-C3N4 for enhanced electrochemical performance. ACS Omega 2022, 7, 24851–24857. [Google Scholar] [CrossRef]
- Liu, W.; Gao, F.; Zang, Y.; Qu, J.; Xu, J.; Ji, S.; Huo, Y.; Qiu, J. Boosting cycle stability of NCM811 cathode material via 2D Mg-Al-LDO nanosheet coating for lithium-ion battery. J. Alloys Compd. 2021, 867, 159079. [Google Scholar] [CrossRef]
- Zhao, S.; Zhu, Y.; Qian, Y.; Wang, N.; Zhao, M.; Yao, J.; Xu, Y. Annealing effects of TiO2 coating on cycling performance of Ni-rich cathode material LiNi0.8Co0.1Mn0.1O2 for lithium-ion battery. Mater. Lett. 2020, 265, 127418. [Google Scholar] [CrossRef]
- Huang, J.; Fang, X.; Wu, Y.; Zhou, L.; Wang, Y.; Jin, Y.; Dang, W.; Wu, L.; Rong, Z.; Chen, X.; et al. Enhanced electrochemical performance of LiNi0.8Co0.1Mn0.1O2 by surface modification with lithium-active MoO3. J. Electroanal. Chem. 2018, 823, 359–367. [Google Scholar] [CrossRef]
- Liang, L.; Hu, G.; Jiang, F.; Cao, Y. Electrochemical behaviours of SiO2-coated LiNi0.8Co0.1Mn0.1O2 cathode materials by a novel modification method. J. Alloys Compd. 2016, 657, 570–581. [Google Scholar] [CrossRef]
- Zhang, B.; Dong, P.; Tong, H.; Yao, Y.; Zheng, J.; Yu, W.; Zhang, J.; Chu, D. Enhanced electrochemical performance of LiNi0.8Co0.1Mn0.1O2 with lithium-reactive Li3VO4 coating. J. Alloys Compd. 2017, 706, 198–204. [Google Scholar] [CrossRef]
- Wang, J.; Yuan, Q.; Wang, R.; Tan, G.; Su, Y.; Li, D.; Wu, F. Providing a long-term protection for NCM811 cathode material by Al2O3 coating layer. IOP Conf. Ser. Mater. Sci. Eng. 2020, 735, 012007. [Google Scholar] [CrossRef]
- Kim, H.K.; Kang, H.S.; Santhoshkumar, P.; Park, J.W.; Ho, C.W.; Sim, G.S.; Lee, C.W. Surface modification of Ni-rich LiNi0.8Co0.1Mn0.1O2 with perovskite LaFeO3 for high voltage cathode materials. RSC Adv. 2021, 11, 21685–21694. [Google Scholar] [CrossRef]
- Gan, Q.; Qin, N.; Zhu, Y.; Huang, Z.; Zhang, F.; Gu, S.; Xie, J.; Zhang, K.; Lu, L.; Lu, Z. Polyvinylpyrrolidone-induced uniform surface-conductive polymer coating endows Ni- rich LiNi0.8Co0.1Mn0.1O2 with enhanced cyclability for lithium-ion batteries. ACS Appl. Mater. Interfaces 2019, 11, 12594–12604. [Google Scholar] [CrossRef] [PubMed]
- Du, M.; Yang, P.; He, W.; Bie, S.; Zhao, H.; Yin, J.; Zou, Z.; Liu, J. Enhanced high-voltage cycling stability of Ni-rich LiNi0.8Co0.1Mn0.1O2 cathode coated with Li2O-2B2O3. J. Alloys Compd. 2019, 805, 991–998. [Google Scholar] [CrossRef]
- Zhao, W.; Zhang, J.; Zou, L.; Jia, H.; Liu, B.; Wang, H.; Engelhard, M.H.; Wang, C.; Xu, W.; Yang, Y.; et al. High voltage operation of Ni-rich NCM cathodes enabled by stable electrode/electrolyte interphases. Adv. Energy Mater. 2018, 8, 18002970. [Google Scholar] [CrossRef]
- Li, Q.; Zuang, W.; Li, Z.; Wu, S.; Li, N.; Gao, M.; Li, W.; Wang, J.; Lu, S. Realizing superior cycle stability of a Ni-rich layered LiNi0.83Co0.12Mn0.05O2 cathode with a B2O3 surface modification. ChemElectroChem 2020, 7, 998–1006. [Google Scholar] [CrossRef]
- Li, J.; Zhang, M.; Zhang, D.; Yan, Y.; Li, Z. An effective doping strategy to improve the cyclic stability and rate capability of Ni-rich LiNi0.8Co0.1Mn0.1O2 cathode. Chem. Eng. J. 2020, 402, 126195. [Google Scholar] [CrossRef]


| Sample | NCM811 | Ag-NCM811 |
|---|---|---|
| Lattice parameters | ||
| a (Å) | 2.875 (3) | 2.878 (1) |
| C (Å) | 14.221 (7) | 14.230 (2) |
| c/a | 4.94 (5) | 4.943 (2) |
| V (Å3) | 102.13 | 102.09 |
| I(003)/I(104) * | 1.27 ± 0.03 | 1.31 ± 0.03 |
| Lc (nm) | 55 ± 2 | 50 ± 2 |
| ε × 10−3 (rd) | 0.86 | 0.65 |
| Reliability factors | ||
| Rp (%) | 9.18 | 10.12 |
| Rwp (%) | 11.86 | 13.69 |
| χ2 | 1.24 | 1.45 |
| Ni2+ % in Li layer | 5.78 | 3.61 |
| Material fraction (mol%) | ||
| NCM811 | 100 | 96.7 |
| Ag | 0 | 1.7 |
| AgO | 0 | 1.6 |
| Parameters | NCM811 | Ag-NCM811 | ||
|---|---|---|---|---|
| Fresh Cell | After Cycling | Fresh Cell | After Cycling | |
| Rs (Ω) | 19.31 | 10.9 | 28.1 | 47.7 |
| RSEI (Ω) | - | 23.5 | - | 47.0 |
| CPESEI-T | - | 1.04 × 10⁻⁵ | - | 1.809 × 10⁻² |
| CPESEI-P | - | 0.85 | - | 0.005 |
| Rct (Ω) | 13.5 | 25.2 | 17.4 | 19.8 |
| CPEdl-T | 2.9 × 10⁻⁵ | 1.1 × 10⁻⁴ | 2.77 × 10⁻⁵ | 7.5 × 10⁻⁵ |
| CPEdl-P | 0.85 | 0.98 | 0.78 | 0.41 |
| Zw-R | 7.6 | 50.8 | 6.1 | 25.7 |
| Zw-T | 0.016 | 9.5 | 0.0124 | 6.197 |
| Zw-P | 0.49 | 0.50 | 0.45 | 0.31 |
| DLi+ (cm2 s−1) | 4.0 × 10⁻¹² | 1.1 × 10⁻¹³ | 6.2 × 10⁻¹² | 5.4 × 10⁻¹³ |
| Coating Material | C-Rate | Specific Capacity (mAh g−1) | Ref. |
|---|---|---|---|
| g-C4N3 (~20 nm thick) | 1 C (200) | 130 | [67] |
| Mg-Al-LDO (5 nm thick) | 0.5 C (100) | 125 | [68] |
| SiO2 (0.25 wt.%; 1–3 nm thick) | 0.5 (100) | 160 | [16] |
| TiO2 (6 nm thick) | 0.1 (100) | 180 | [69] |
| MoO3 (3 wt.%; 5 nm thick) | 1 C (100) | 175 | [70] |
| SiO2 (20–40 nm thick) | 1 C (300) | 160 | [71] |
| Li3VO4 (3 wt.%; ~5 nm thick) | 1 C (100) | 140 | [72] |
| Li2O·2B2O3 (50–200 nm thick) | 0.5 C/1 C (100) | 199 | [19] |
| Al2O3 (2 wt.%; 2 nm thick) | 1 C (100) | 168 | [73] |
| LaFeO3 (0.5 wt.%; ~60 nm) | 0.2 C (80) | 130 | [74] |
| Li3PO4 (2 wt.%) + PPy (3 wt.%) | 1 C (200) | 157 | [60] |
| PANI-PVP (5–7 nm thick) | 1 C (100) | 178 | [75] |
| Amorphous Ag (1 wt.%) | 1 C (90) | 170 | [27] |
| Li2O·2B2O3 (0.3 wt.%) | 1 C (100) | 145 | [76] |
| Ag/AgO (3 mol.%, 1–2 nm thick) | 0.1 (100) | 120 | this work |
Disclaimer/Publisher’s Note: The statements, opinions and data contained in all publications are solely those of the individual author(s) and contributor(s) and not of MDPI and/or the editor(s). MDPI and/or the editor(s) disclaim responsibility for any injury to people or property resulting from any ideas, methods, instructions or products referred to in the content. |
© 2023 by the authors. Licensee MDPI, Basel, Switzerland. This article is an open access article distributed under the terms and conditions of the Creative Commons Attribution (CC BY) license (https://creativecommons.org/licenses/by/4.0/).
Share and Cite
Li, X.; Chang, K.; Abbas, S.M.; El-Tawil, R.S.; Abdel-Ghany, A.E.; Hashem, A.M.; Wang, H.; Coughlin, A.L.; Zhang, S.; Mauger, A.; et al. Silver Nanocoating of LiNi0.8Co0.1Mn0.1O2 Cathode Material for Lithium-Ion Batteries. Micromachines 2023, 14, 907. https://doi.org/10.3390/mi14050907
Li X, Chang K, Abbas SM, El-Tawil RS, Abdel-Ghany AE, Hashem AM, Wang H, Coughlin AL, Zhang S, Mauger A, et al. Silver Nanocoating of LiNi0.8Co0.1Mn0.1O2 Cathode Material for Lithium-Ion Batteries. Micromachines. 2023; 14(5):907. https://doi.org/10.3390/mi14050907
Chicago/Turabian StyleLi, Xintong, Kai Chang, Somia M. Abbas, Rasha S. El-Tawil, Ashraf E. Abdel-Ghany, Ahmed M. Hashem, Hua Wang, Amanda L. Coughlin, Shixiong Zhang, Alain Mauger, and et al. 2023. "Silver Nanocoating of LiNi0.8Co0.1Mn0.1O2 Cathode Material for Lithium-Ion Batteries" Micromachines 14, no. 5: 907. https://doi.org/10.3390/mi14050907
APA StyleLi, X., Chang, K., Abbas, S. M., El-Tawil, R. S., Abdel-Ghany, A. E., Hashem, A. M., Wang, H., Coughlin, A. L., Zhang, S., Mauger, A., Zhu, L., & Julien, C. M. (2023). Silver Nanocoating of LiNi0.8Co0.1Mn0.1O2 Cathode Material for Lithium-Ion Batteries. Micromachines, 14(5), 907. https://doi.org/10.3390/mi14050907