

Electrokinetic Manipulation of Biological Cells towards Biotechnology Applications
 ,
, 
Abstract
1. Introduction
2. Materials and Methods
2.1. Glassy Carbon IDEAs
2.2. Gold IDEAs
2.3. Creating Windows in the Resist Layer on IDEAs
2.4. Cells Processing
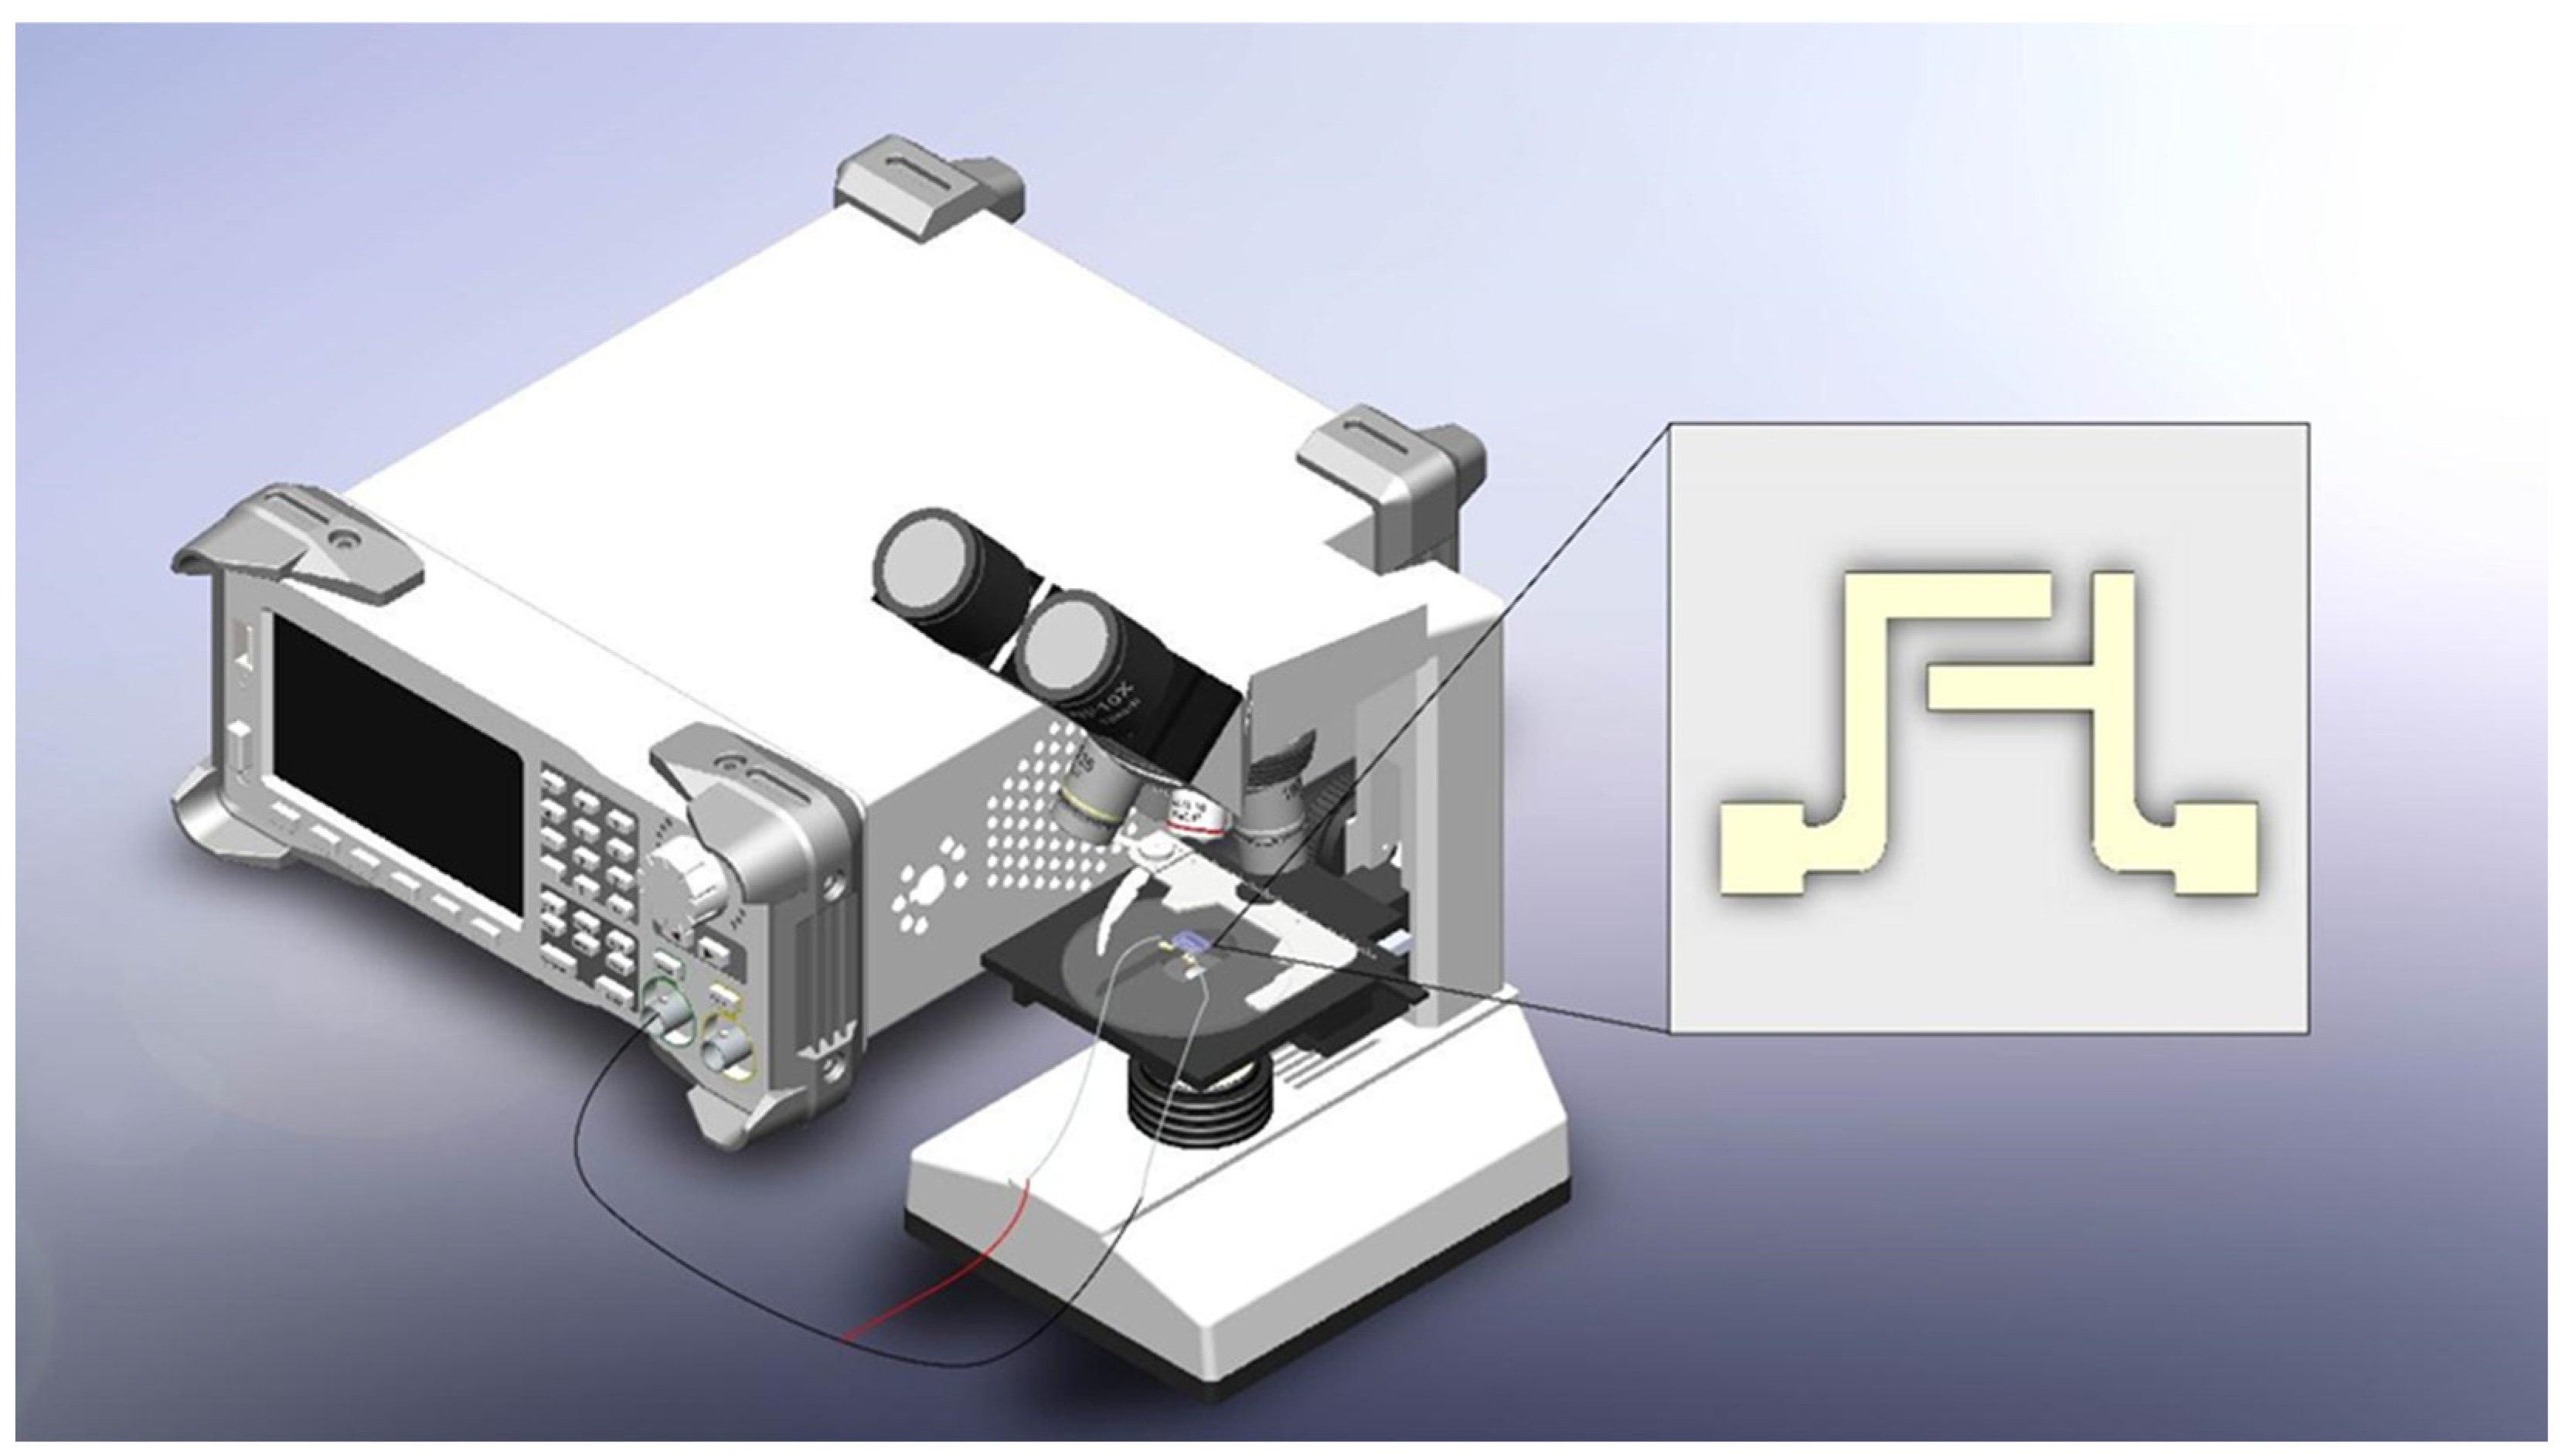
2.5. Experimental Setup
2.6. Viability Test
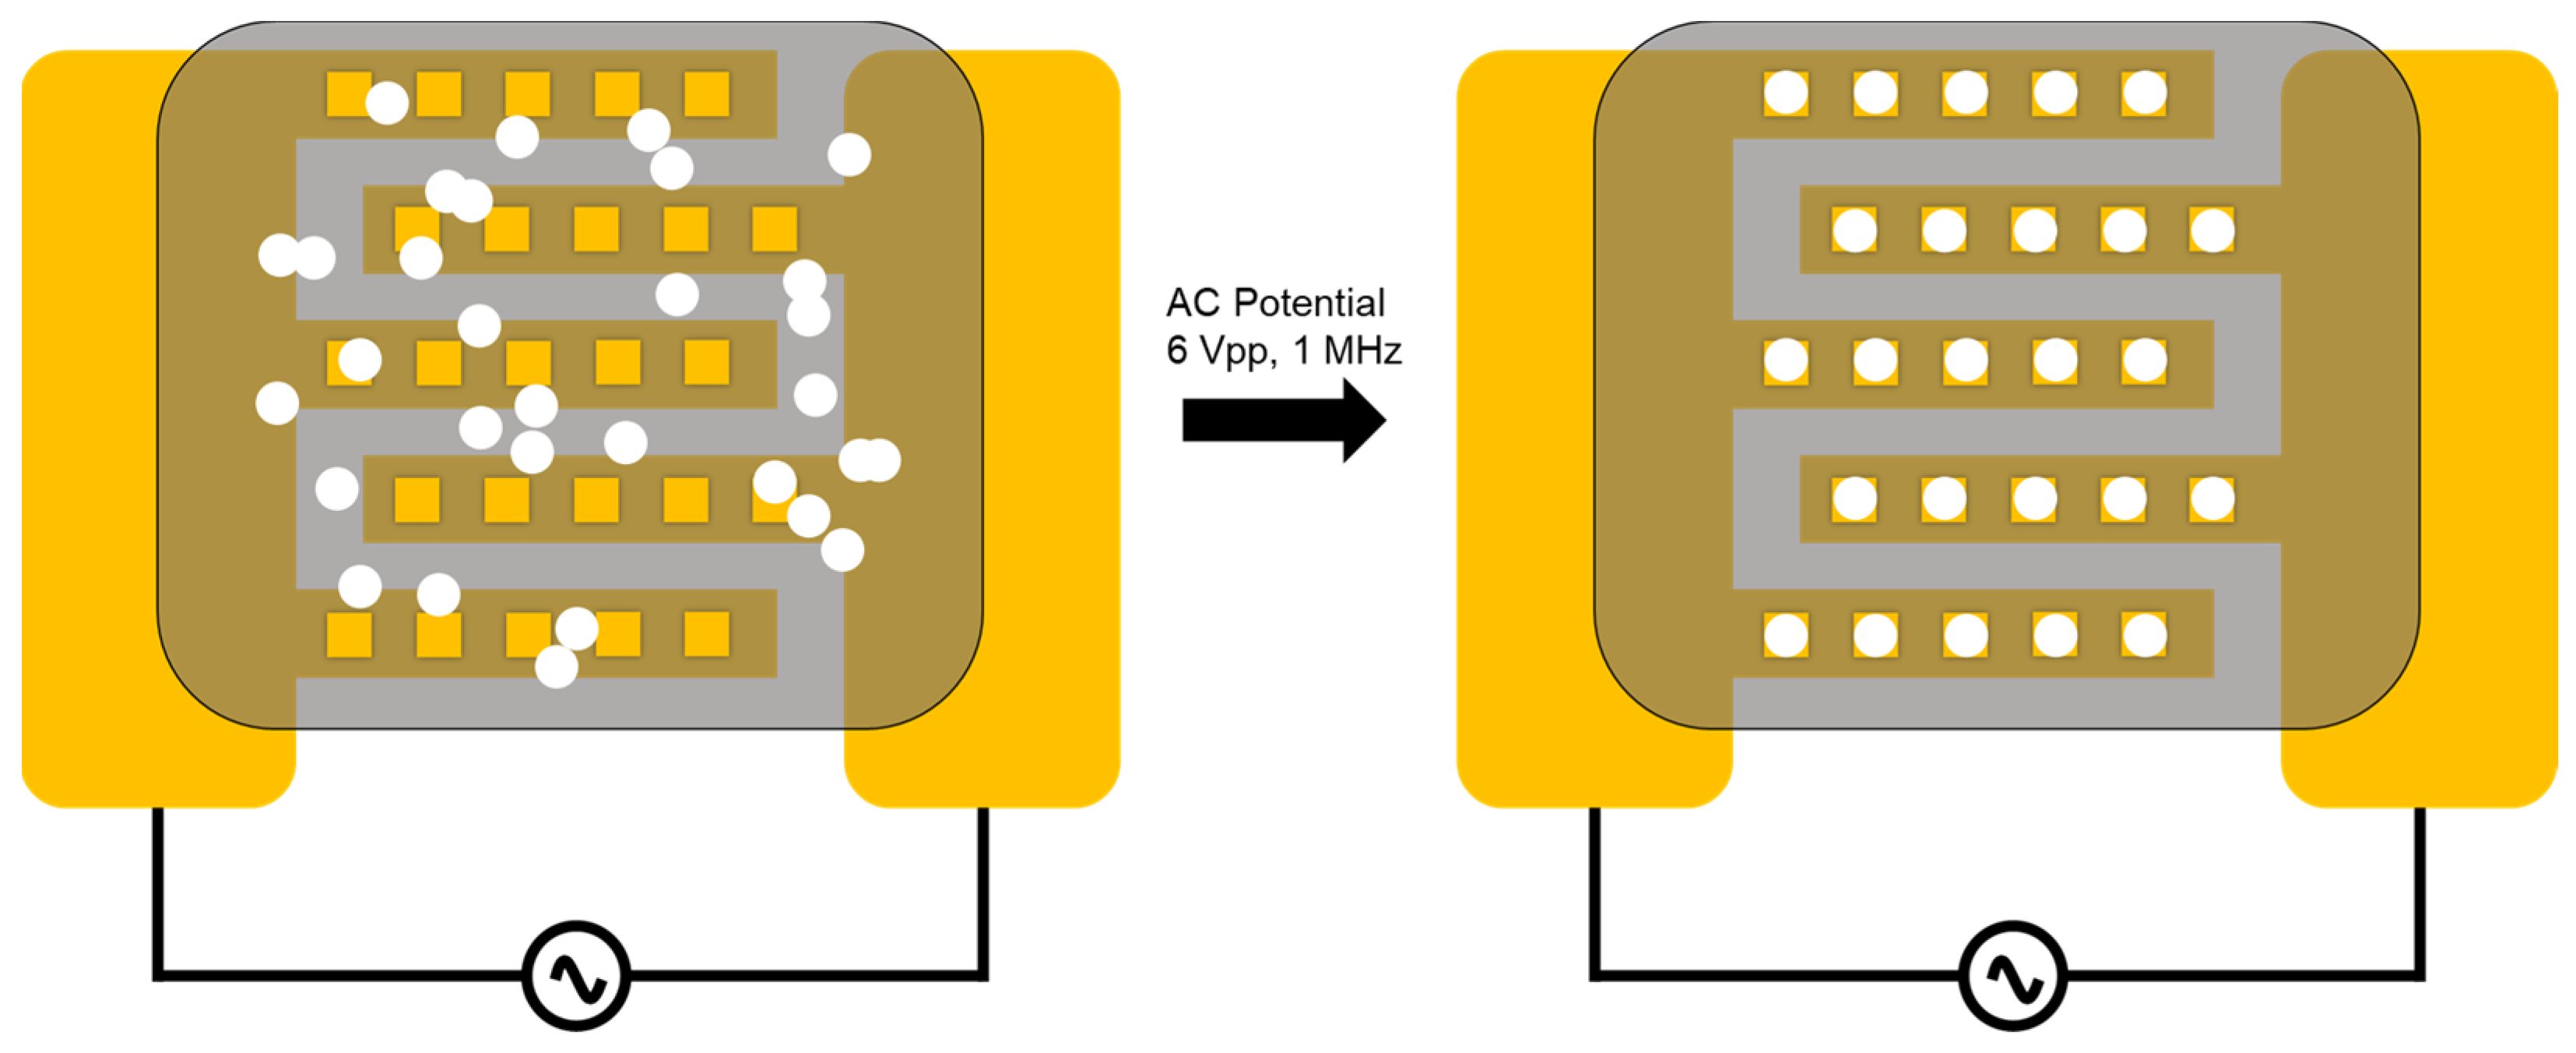
2.7. Dielectrophoresis
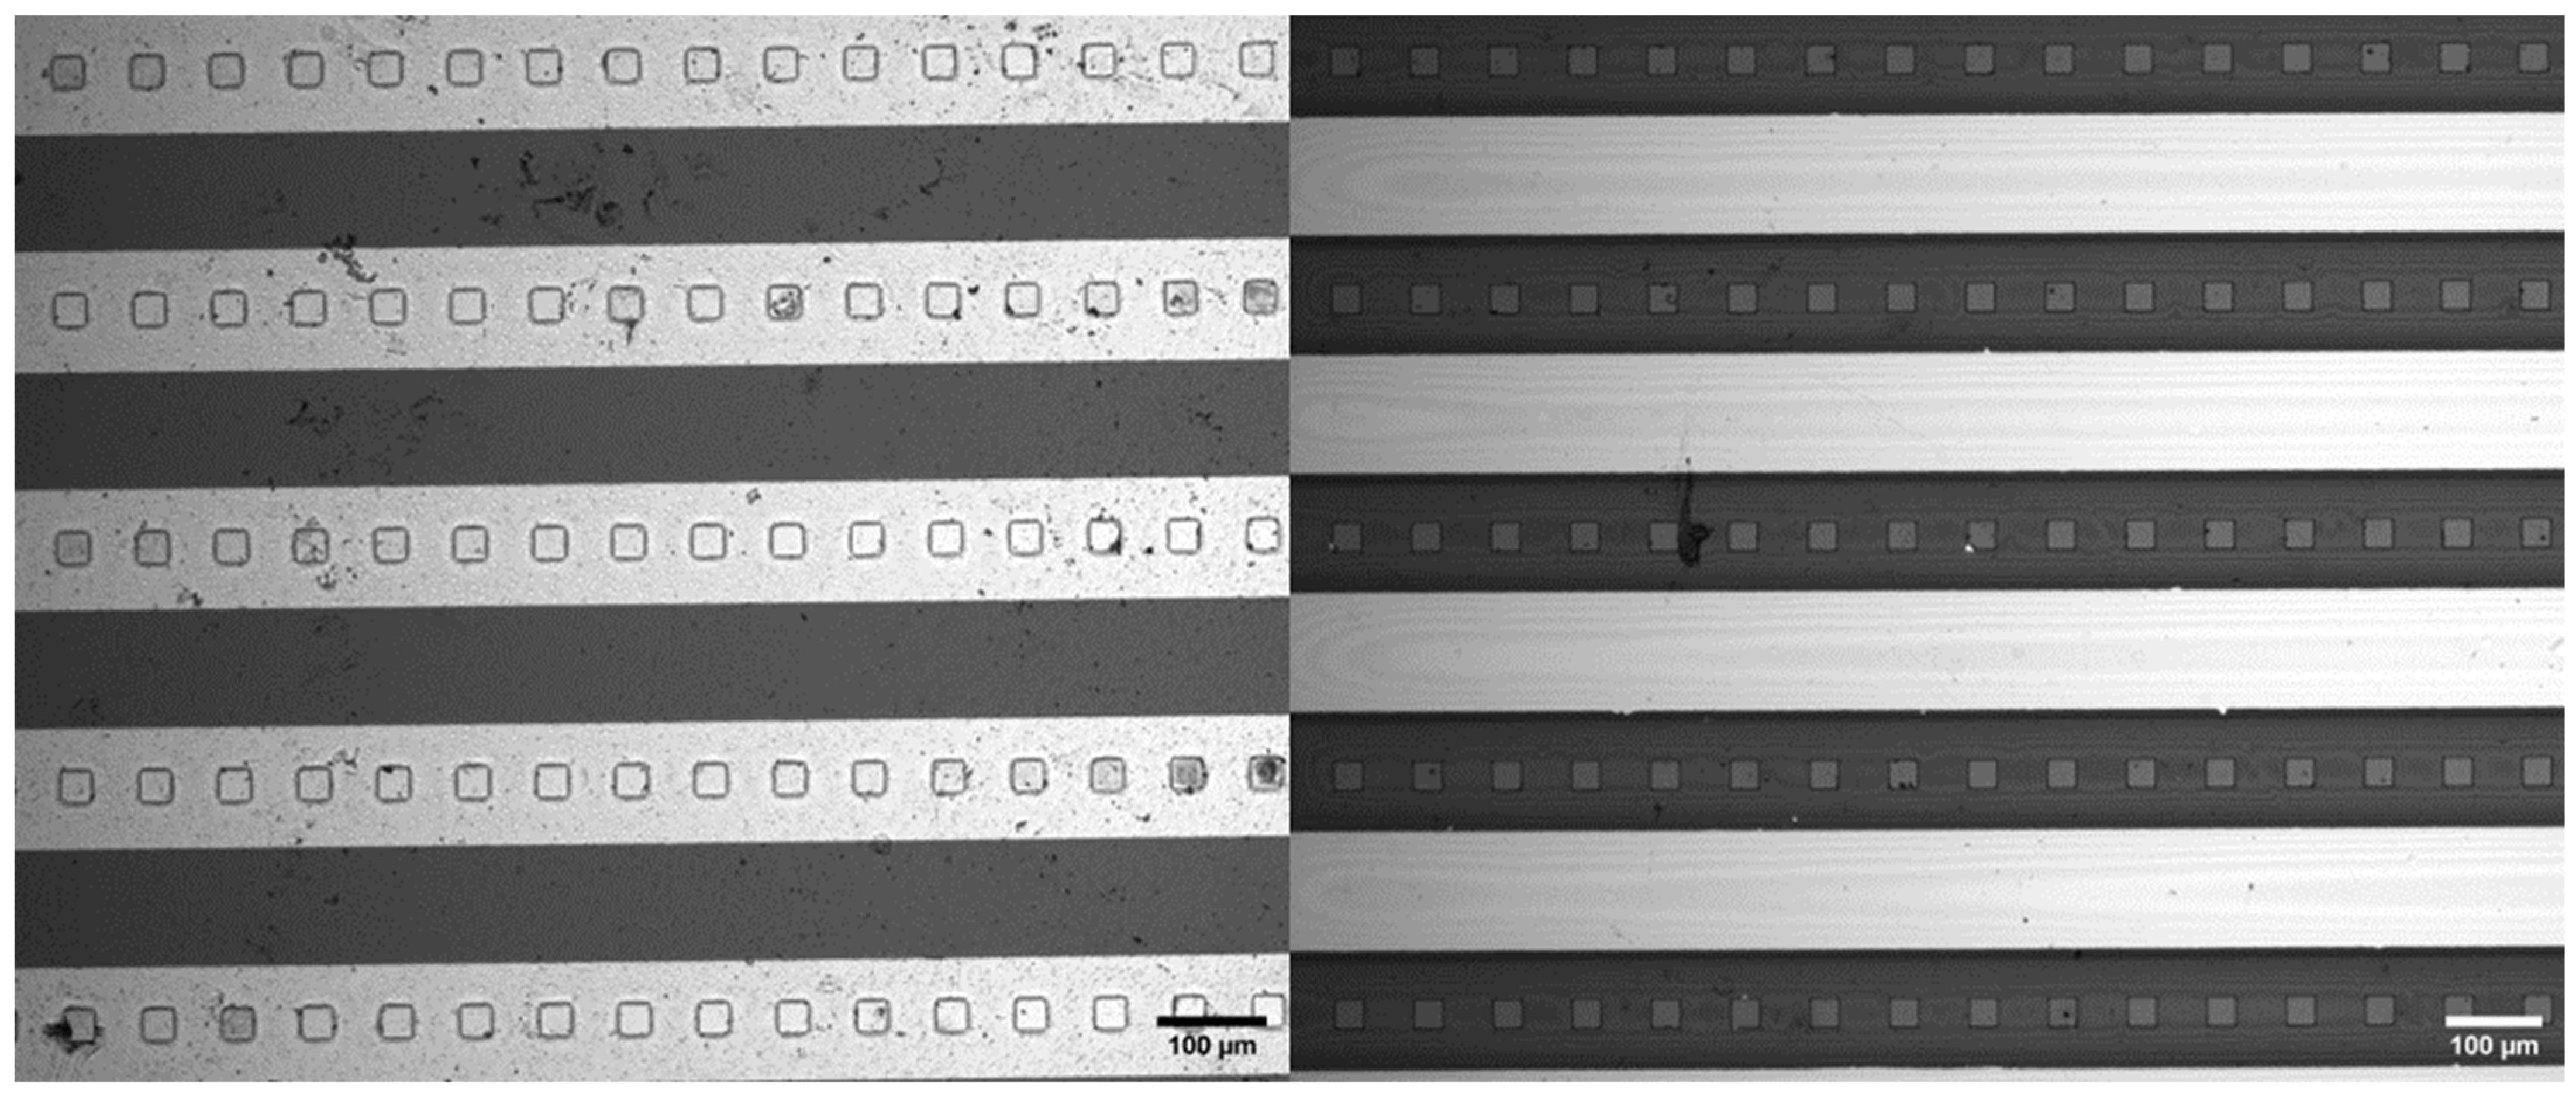
3. Results
4. Discussion
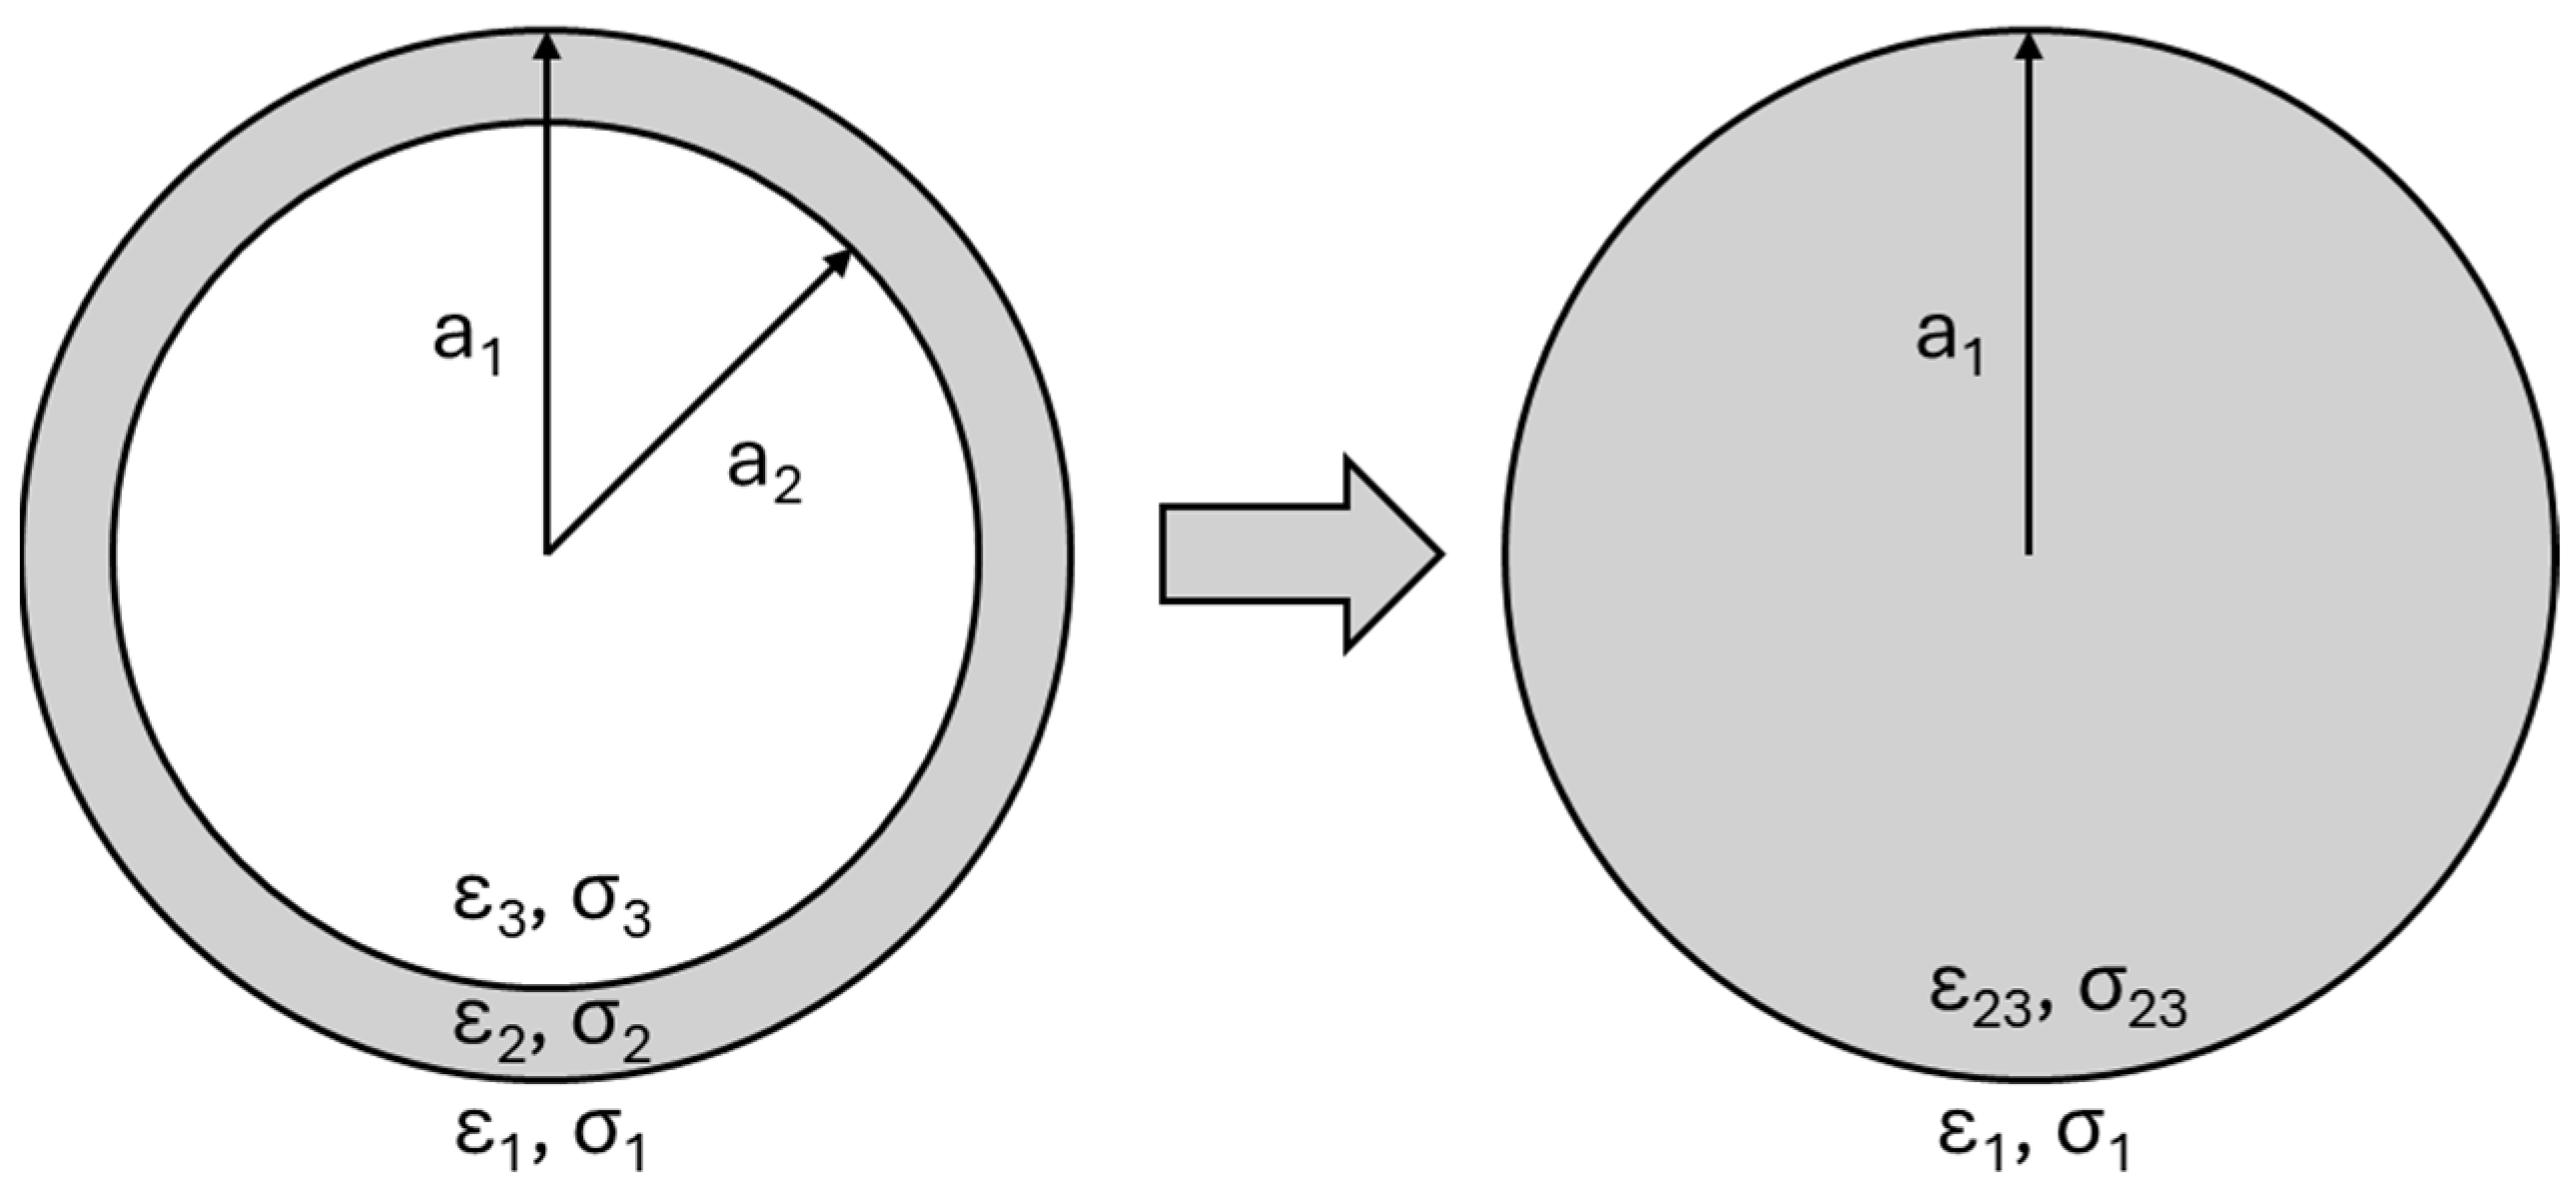
4.1. Simulation
4.2. Experimental Findings
5. Conclusions
Supplementary Materials
Author Contributions
Funding
Data Availability Statement
Acknowledgments
Conflicts of Interest
References
- Adekanmbi, E.O.; Srivastava, S.K. Dielectric characterization of bioparticles via electrokinetics: The past, present, and the future. Appl. Phys. Rev. 2019, 6, 041313. [Google Scholar] [CrossRef]
- Martinez-Rivas, A.; González-Quijano, G.K.; Proa-Coronado, S.; Séverac, C.; Dague, E. Methods of Micropatterning and Manipulation of Cells for Biomedical Applications. Micromachines 2017, 8, 347. [Google Scholar] [CrossRef]
- Zhu, Q.; Hamilton, M.; Vasquez, B.; He, M. 3D-printing enabled micro-assembly of a microfluidic electroporation system for 3D tissue engineering. Lab Chip 2019, 19, 2362–2372. [Google Scholar] [CrossRef]
- Tavakoli, H.; Zhou, W.; Ma, L.; Perez, S.; Ibarra, A.; Xu, F.; Zhan, S.; Li, X. Recent advances in microfluidic platforms for single-cell analysis in cancer biology, diagnosis and therapy. TrAC Trends Anal. Chem. 2019, 117, 13–26. [Google Scholar] [CrossRef]
- Zhou, T.; Chen, J.; Kropp, E.; Kulinsky, L. Guided Electrokinetic Assembly of Polystyrene Microbeads onto Photopatterned Carbon Electrode Arrays. ACS Appl. Mater. Interfaces 2020, 12, 35647–35656. [Google Scholar] [CrossRef]
- Li, Y.; Wang, Y.; Wan, K.; Wu, M.; Guo, L.; Liu, X.; Wei, G. On the design, functions, and biomedical applications of high-throughput dielectrophoretic micro-/nanoplatforms: A review. Nanoscale 2021, 13, 4330–4358. [Google Scholar] [CrossRef]
- Zhang, H.; Chang, H.; Neuzil, P. DEP-on-a-Chip: Dielectrophoresis Applied to Microfluidic Platforms. Micromachines 2019, 10, 423. [Google Scholar] [CrossRef]
- Çağlayan, Z.; Demircan Yalçın, Y.; Külah, H. A Prominent Cell Manipulation Technique in BioMEMS: Dielectrophoresis. Micromachines 2020, 11, 990. [Google Scholar] [CrossRef] [PubMed]
- Manshadi, M.K.D.; Mohammadi, M.; Zarei, M.; Saadat, M.; Sanati-Nezhad, A. Induced-charge electrokinetics in microfluidics: A review on recent advancements. J. Micromech. Microeng. 2020, 30, 113001. [Google Scholar] [CrossRef]
- Bae, Y.B.; Jang, H.K.; Shin, T.H.; Phukan, G.; Tran, T.T.; Lee, G.; Hwang, W.R.; Kim, J.M. Microfluidic assessment of mechanical cell damage by extensional stress. Lab Chip 2016, 16, 96–103. [Google Scholar] [CrossRef] [PubMed]
- Luan, Q.; Macaraniag, C.; Zhou, J.; Papautsky, I. Microfluidic systems for hydrodynamic trapping of cells and clusters. Biomicrofluidics 2020, 14, 031502. [Google Scholar] [CrossRef] [PubMed]
- Sinha, N.; Yang, H.; Janse, D.; Hendriks, L.; Rand, U.; Hauser, H.; Köster, M.; van de Vosse, F.N.; de Greef, T.F.A.; Tel, J. Microfluidic chip for precise trapping of single cells and temporal analysis of signaling dynamics. Commun. Eng. 2022, 1, 18. [Google Scholar] [CrossRef]
- Wu, Y.; Ren, Y.; Tao, Y.; Hou, L.; Jiang, H. High-Throughput Separation, Trapping, and Manipulation of Single Cells and Particles by Combined Dielectrophoresis at a Bipolar Electrode Array. Anal. Chem. 2018, 90, 11461–11469. [Google Scholar] [CrossRef]
- Lewpiriyawong, N.; Kandaswamy, K.; Yang, C.; Ivanov, V.; Stocker, R. Microfluidic Characterization and Continuous Separation of Cells and Particles Using Conducting Poly(dimethyl siloxane) Electrode Induced Alternating Current-Dielectrophoresis. Anal. Chem. 2011, 83, 9579–9585. [Google Scholar] [CrossRef]
- Bayareh, M. Active cell capturing for organ-on-a-chip systems: A review. Biomed. Eng. Biomed. Tech. 2022, 67, 443–459. [Google Scholar] [CrossRef]
- Hoettges, K.F.; Henslee, E.A.; Torcal Serrano, R.M.; Jabr, R.I.; Abdallat, R.G.; Beale, A.D.; Waheed, A.; Camelliti, P.; Fry, C.H.; van der Veen, D.R.; et al. Ten–Second Electrophysiology: Evaluation of the 3DEP Platform for high-speed, high-accuracy cell analysis. Sci. Rep. 2019, 9, 19153. [Google Scholar] [CrossRef]
- Ramos, A. Electrokinetics and Electrohydrodynamics in Microsystems; Springer: Berlin/Heidelberg, Germany, 2011; pp. 43, 53, 67. [Google Scholar]
- Mussauer, H.; Sukhorukov, V.; Haase, A.; Zimmermann, U. Resistivity of Red Blood Cells Against High-Intensity, Short-Duration Electric Field Pulses Induced by Chelating Agents. J. Membr. Biol. 1999, 170, 121–133. [Google Scholar] [CrossRef] [PubMed]
- Henslee, E.A. Review: Dielectrophoresis in cell characterization. Electrophoresis 2020, 41, 1915–1930. [Google Scholar] [CrossRef] [PubMed]
- Rezanoor, M.W.; Dutta, P. Combined AC electroosmosis and dielectrophoresis for controlled rotation of microparticles. Biomicrofluidics 2016, 10, 024101. [Google Scholar] [CrossRef] [PubMed]
- Andreev, V.P. Cytoplasmic Electric Fields and Electroosmosis: Possible Solution for the Paradoxes of the Intracellular Transport of Biomolecules. PLoS ONE 2013, 8, e61884. [Google Scholar] [CrossRef] [PubMed]

| DEP Medium | IMEM Medium | DEP Medium 20 Vpp | IMEM Medium 20 Vpp | DEP Medium 20 Vpp Followed by Replacement of DEP Medium by IMEM |
|---|---|---|---|---|
| 1 h | 1 h | 1 h | 1 h | 1 h |
| 240,000 | 1,100,000 | 120,000 | 1,320,000 | 80,000 |
| 1 d | 1 d | 1 d | 1 d | 1 d |
| 4000 | 1,460,000 | 8000 | 740,000 | 140,000 |
Disclaimer/Publisher’s Note: The statements, opinions and data contained in all publications are solely those of the individual author(s) and contributor(s) and not of MDPI and/or the editor(s). MDPI and/or the editor(s) disclaim responsibility for any injury to people or property resulting from any ideas, methods, instructions or products referred to in the content. |
© 2024 by the authors. Licensee MDPI, Basel, Switzerland. This article is an open access article distributed under the terms and conditions of the Creative Commons Attribution (CC BY) license (https://creativecommons.org/licenses/by/4.0/).
Share and Cite
Yan, S.; Rajestari, Z.; Morse, T.C.; Li, H.; Kulinsky, L. Electrokinetic Manipulation of Biological Cells towards Biotechnology Applications. Micromachines 2024, 15, 341. https://doi.org/10.3390/mi15030341
Yan S, Rajestari Z, Morse TC, Li H, Kulinsky L. Electrokinetic Manipulation of Biological Cells towards Biotechnology Applications. Micromachines. 2024; 15(3):341. https://doi.org/10.3390/mi15030341
Chicago/Turabian StyleYan, Songyuan, Zarya Rajestari, Timothy Clifford Morse, Harbour Li, and Lawrence Kulinsky. 2024. "Electrokinetic Manipulation of Biological Cells towards Biotechnology Applications" Micromachines 15, no. 3: 341. https://doi.org/10.3390/mi15030341
APA StyleYan, S., Rajestari, Z., Morse, T. C., Li, H., & Kulinsky, L. (2024). Electrokinetic Manipulation of Biological Cells towards Biotechnology Applications. Micromachines, 15(3), 341. https://doi.org/10.3390/mi15030341