
Non-Destructive Sensor for Glucose Solution Concentration Detection Using Electromagnetic Technology


Abstract
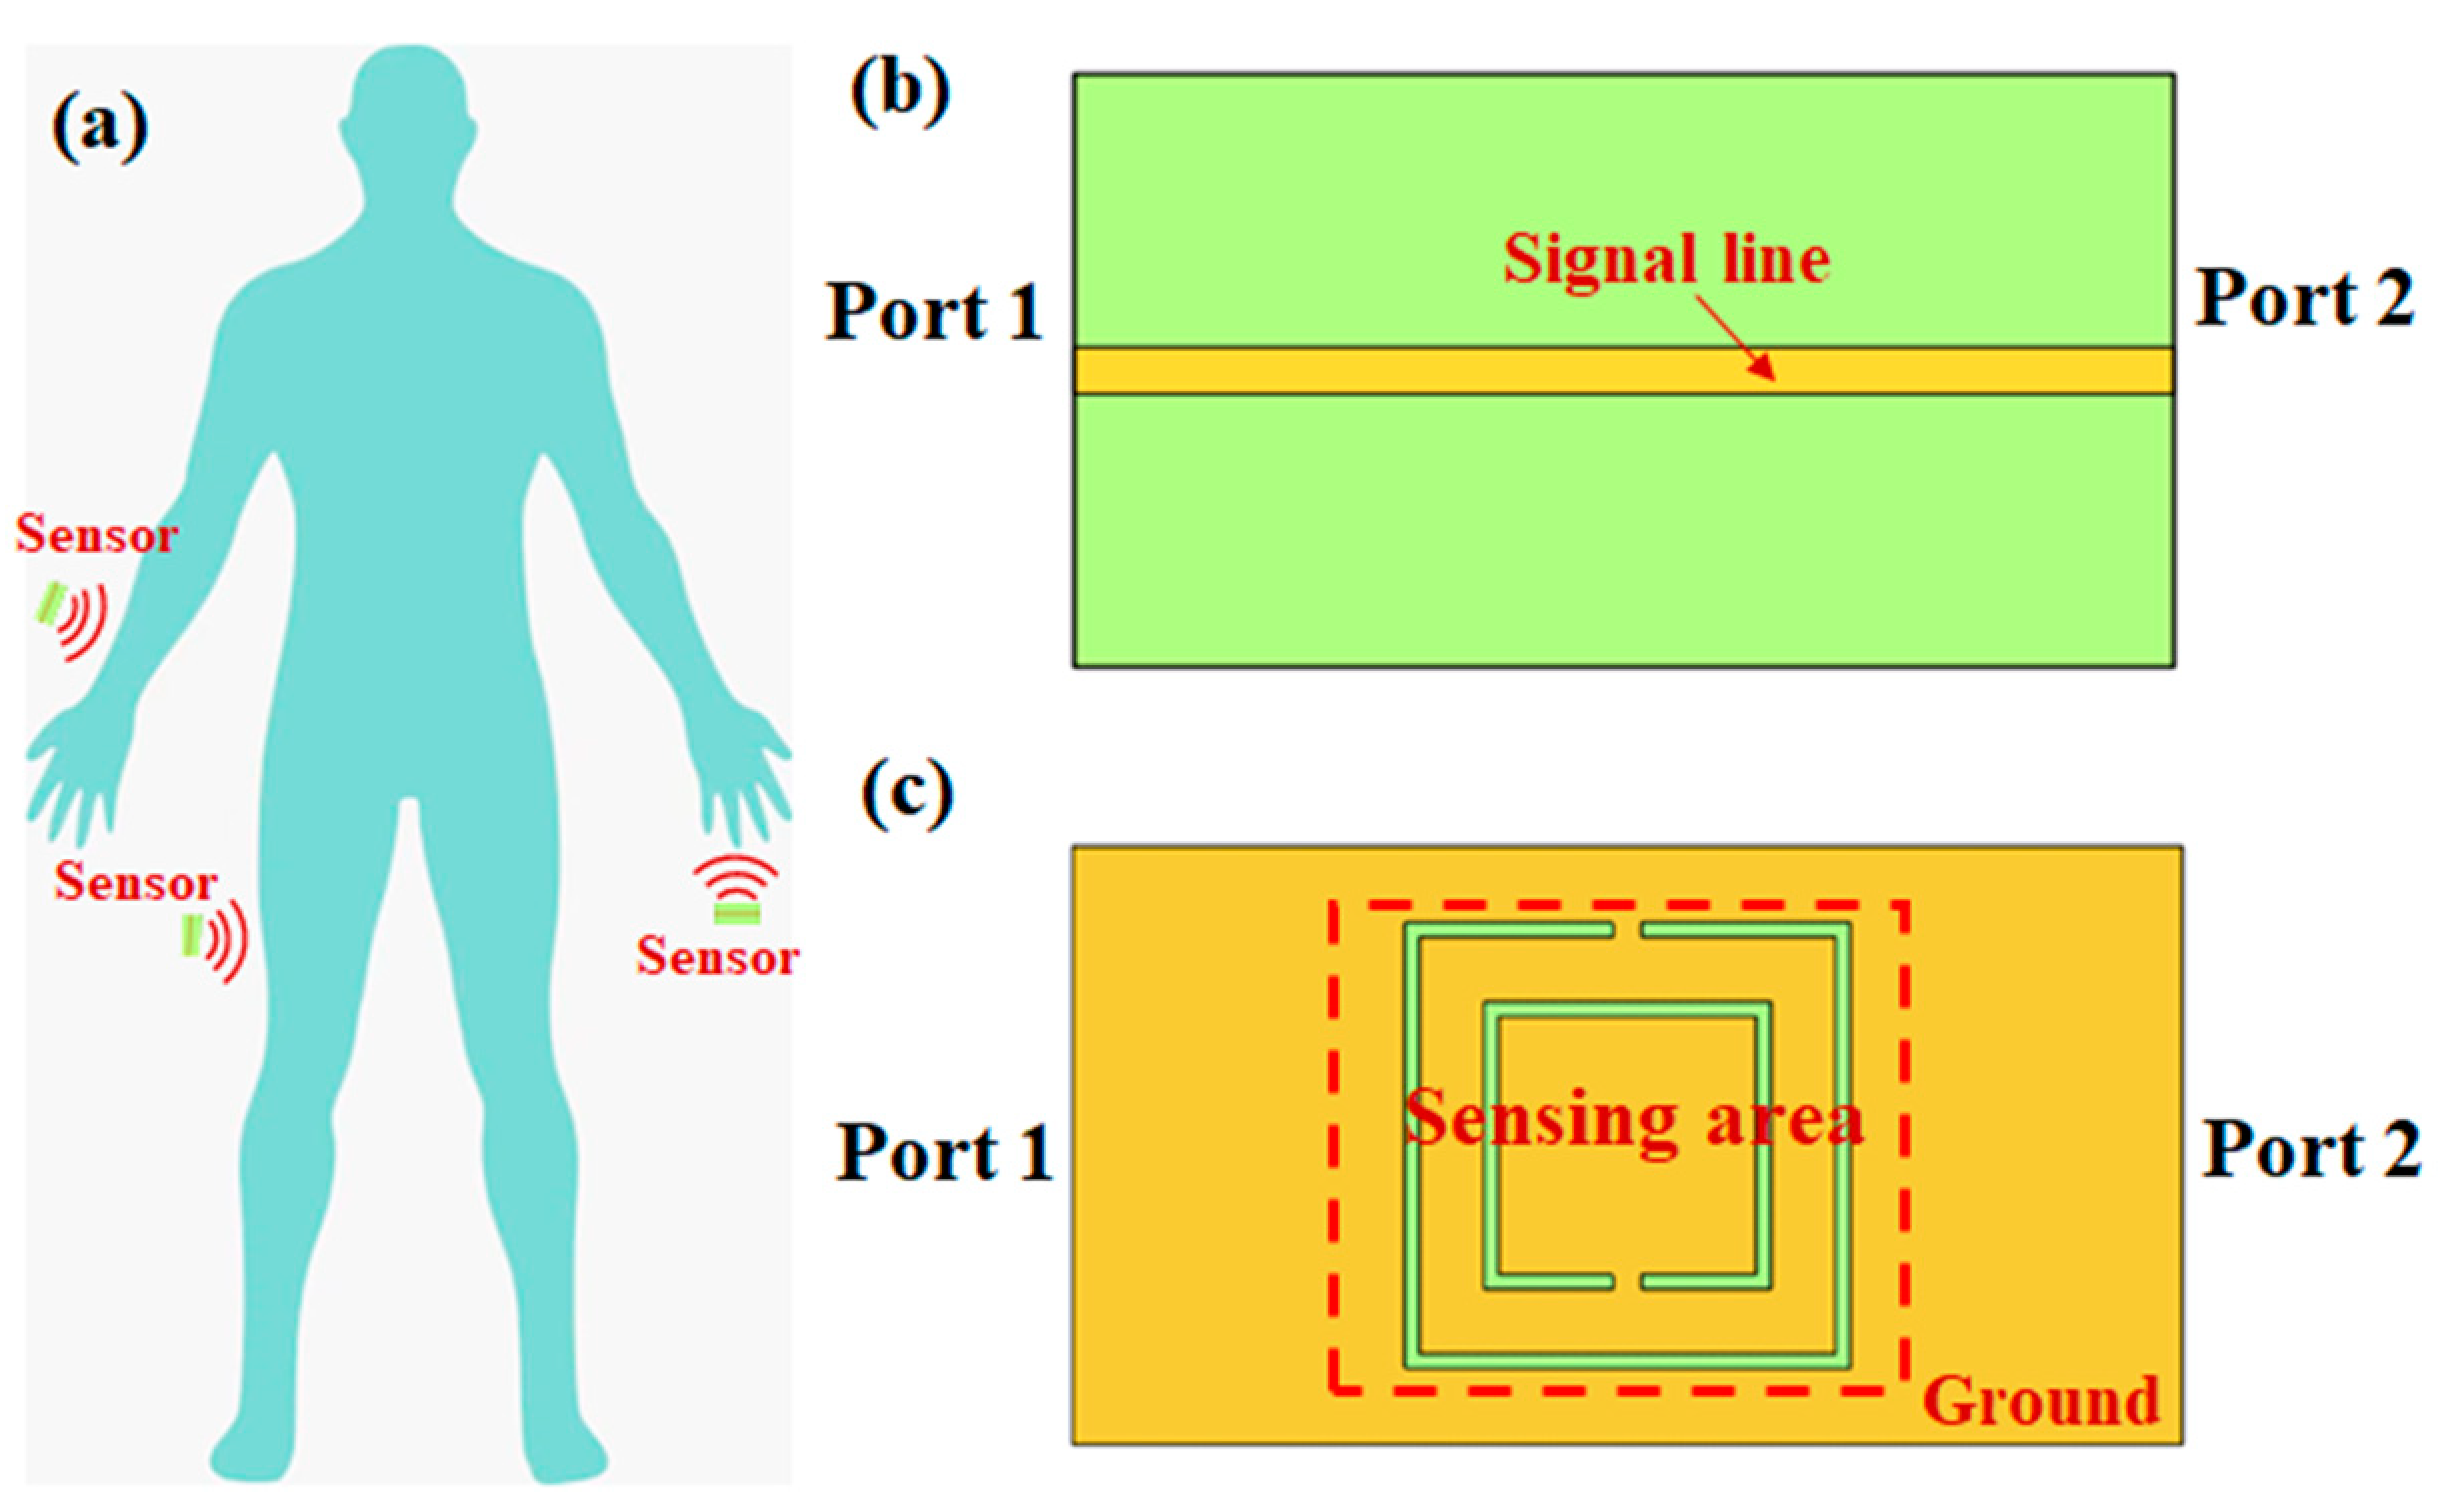
:1. Introduction
2. Theory and Simulation
2.1. Theoretical Analysis
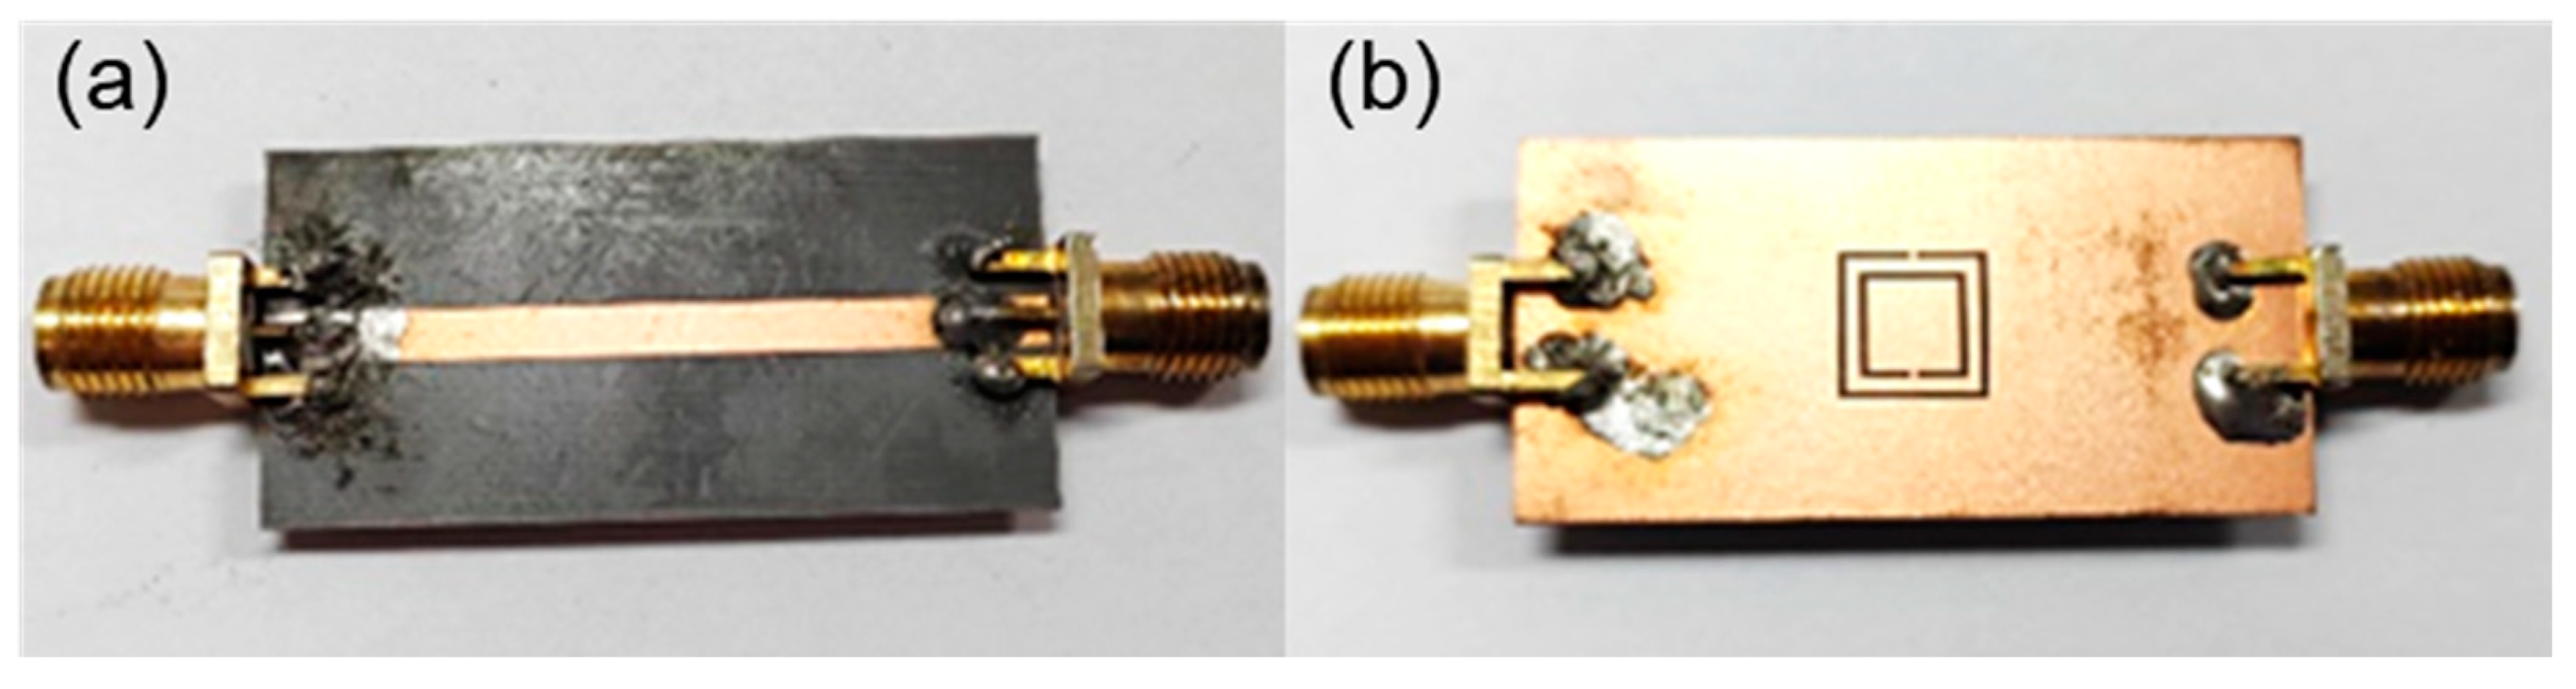
2.2. FEM Simulation
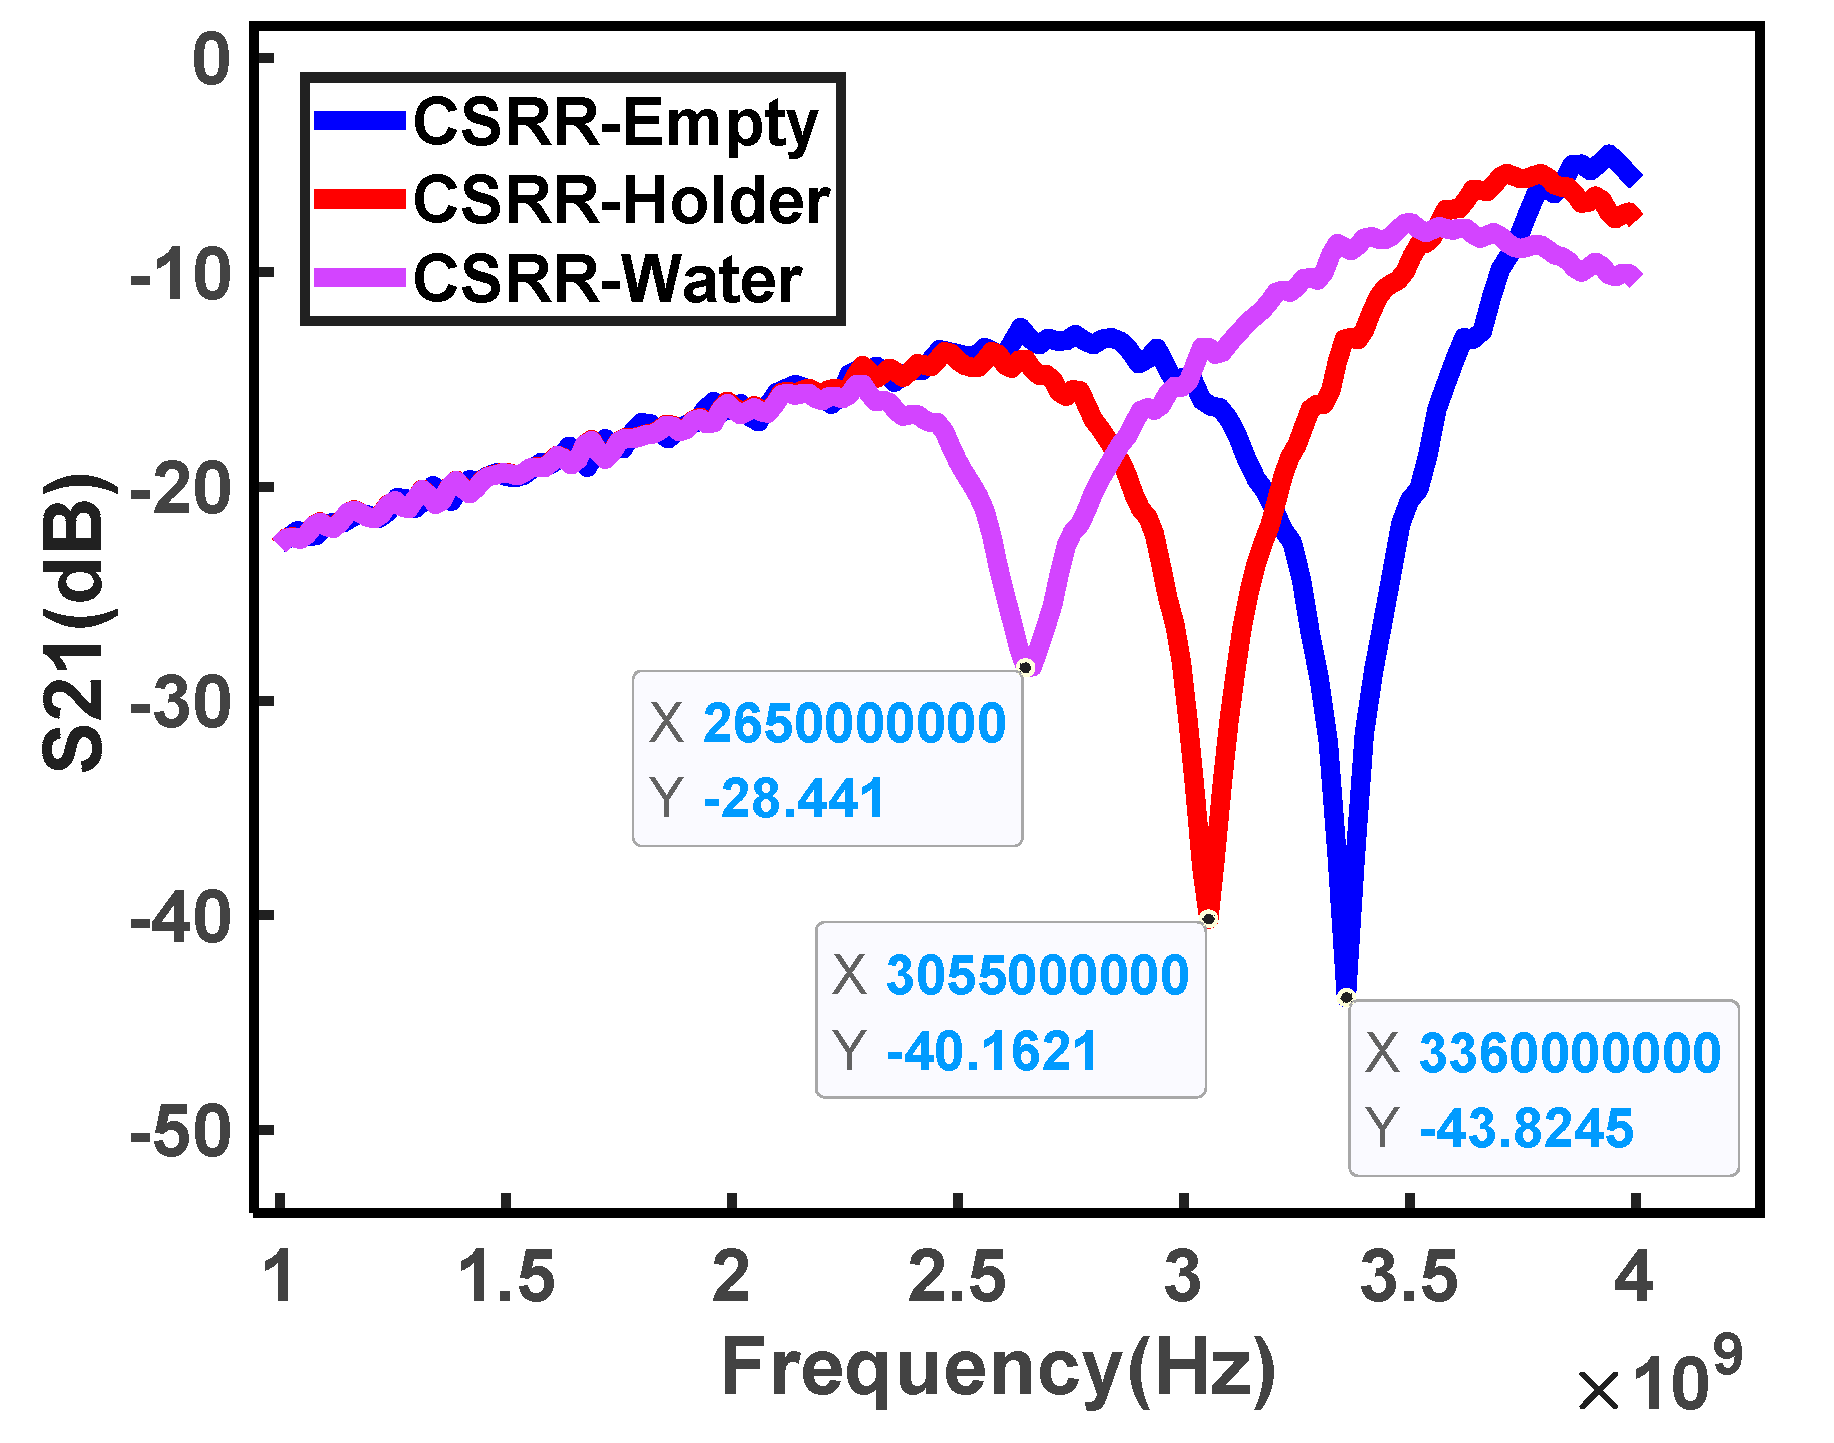
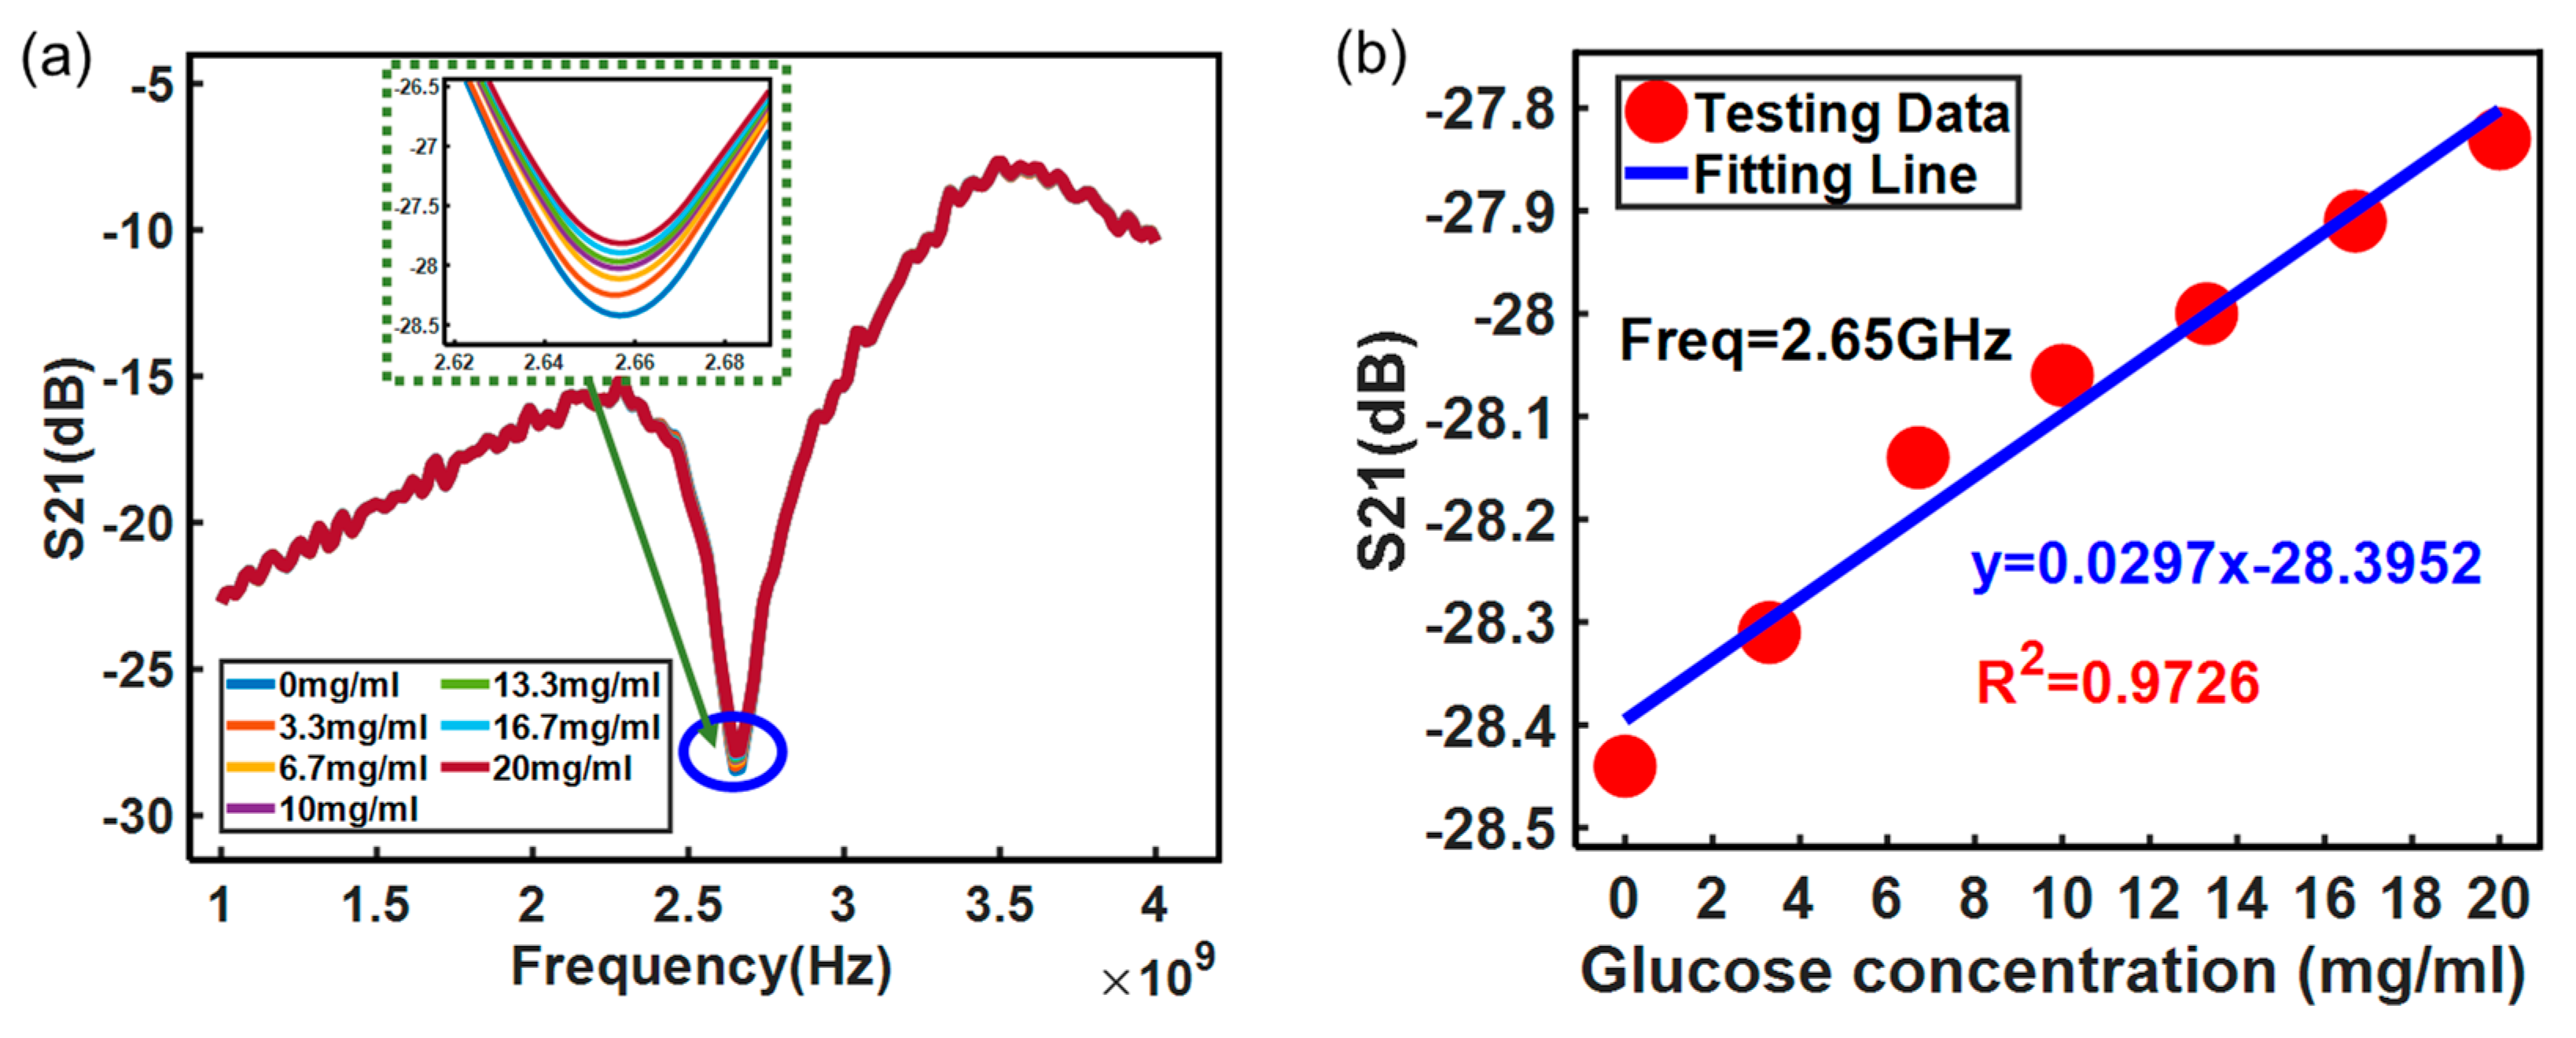
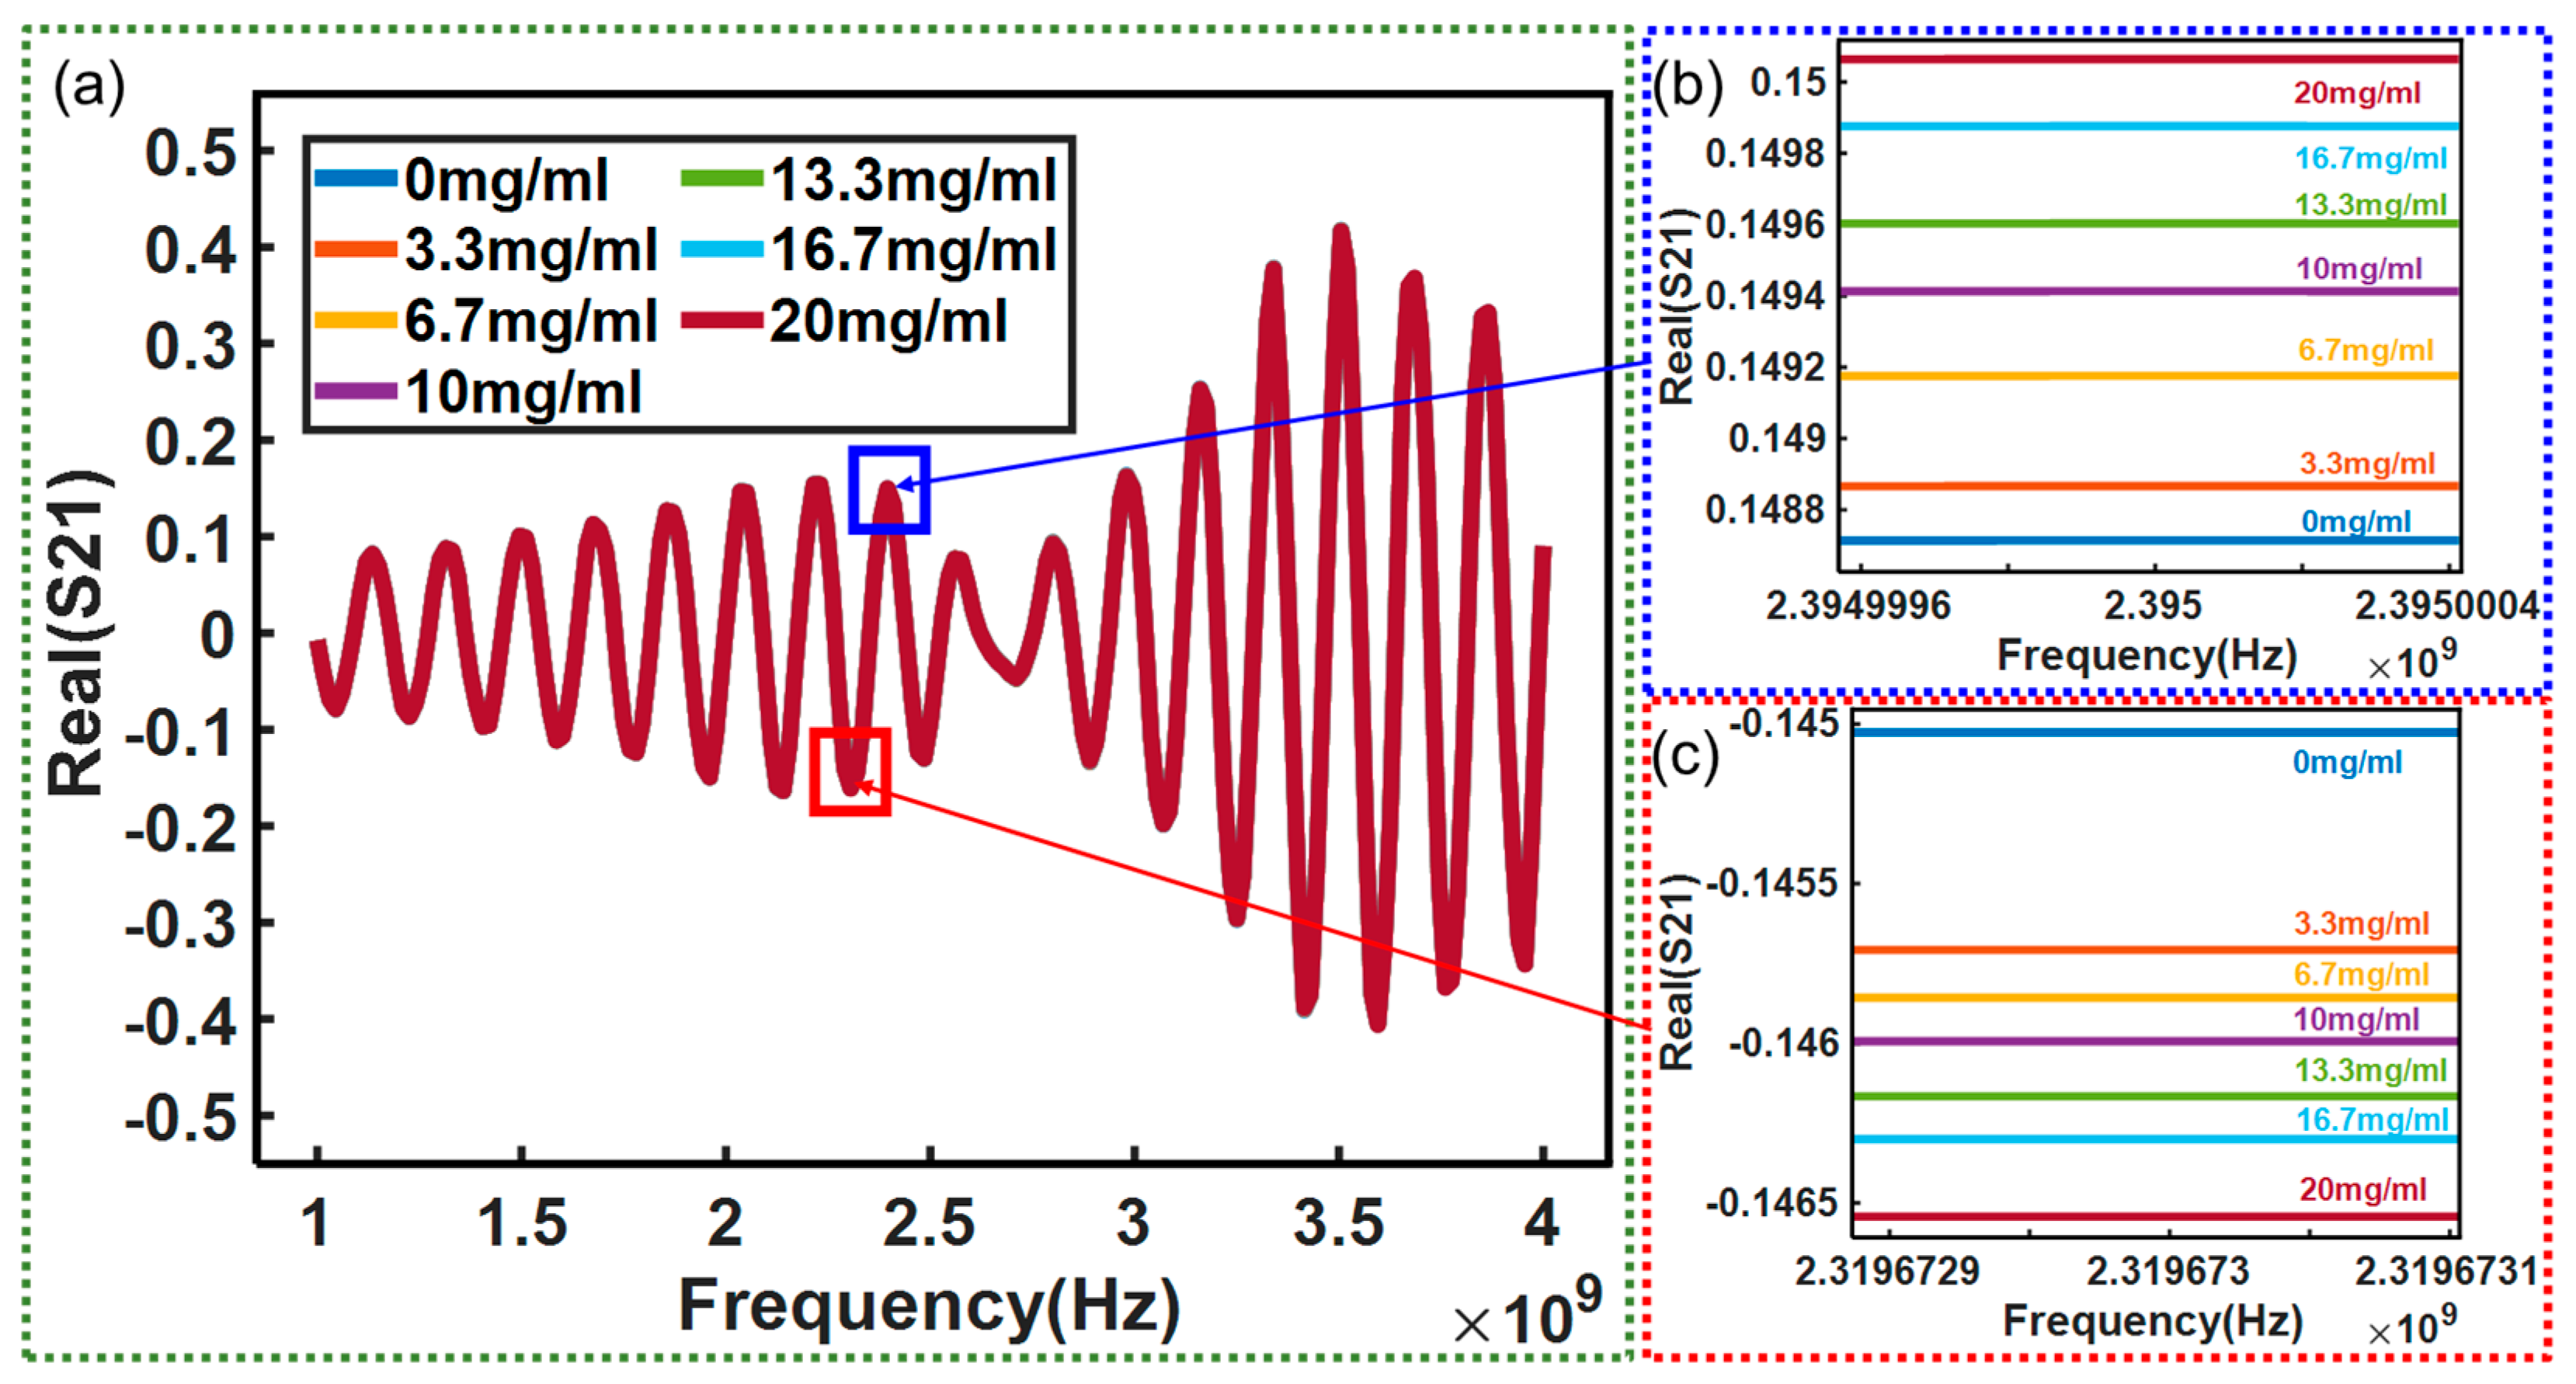
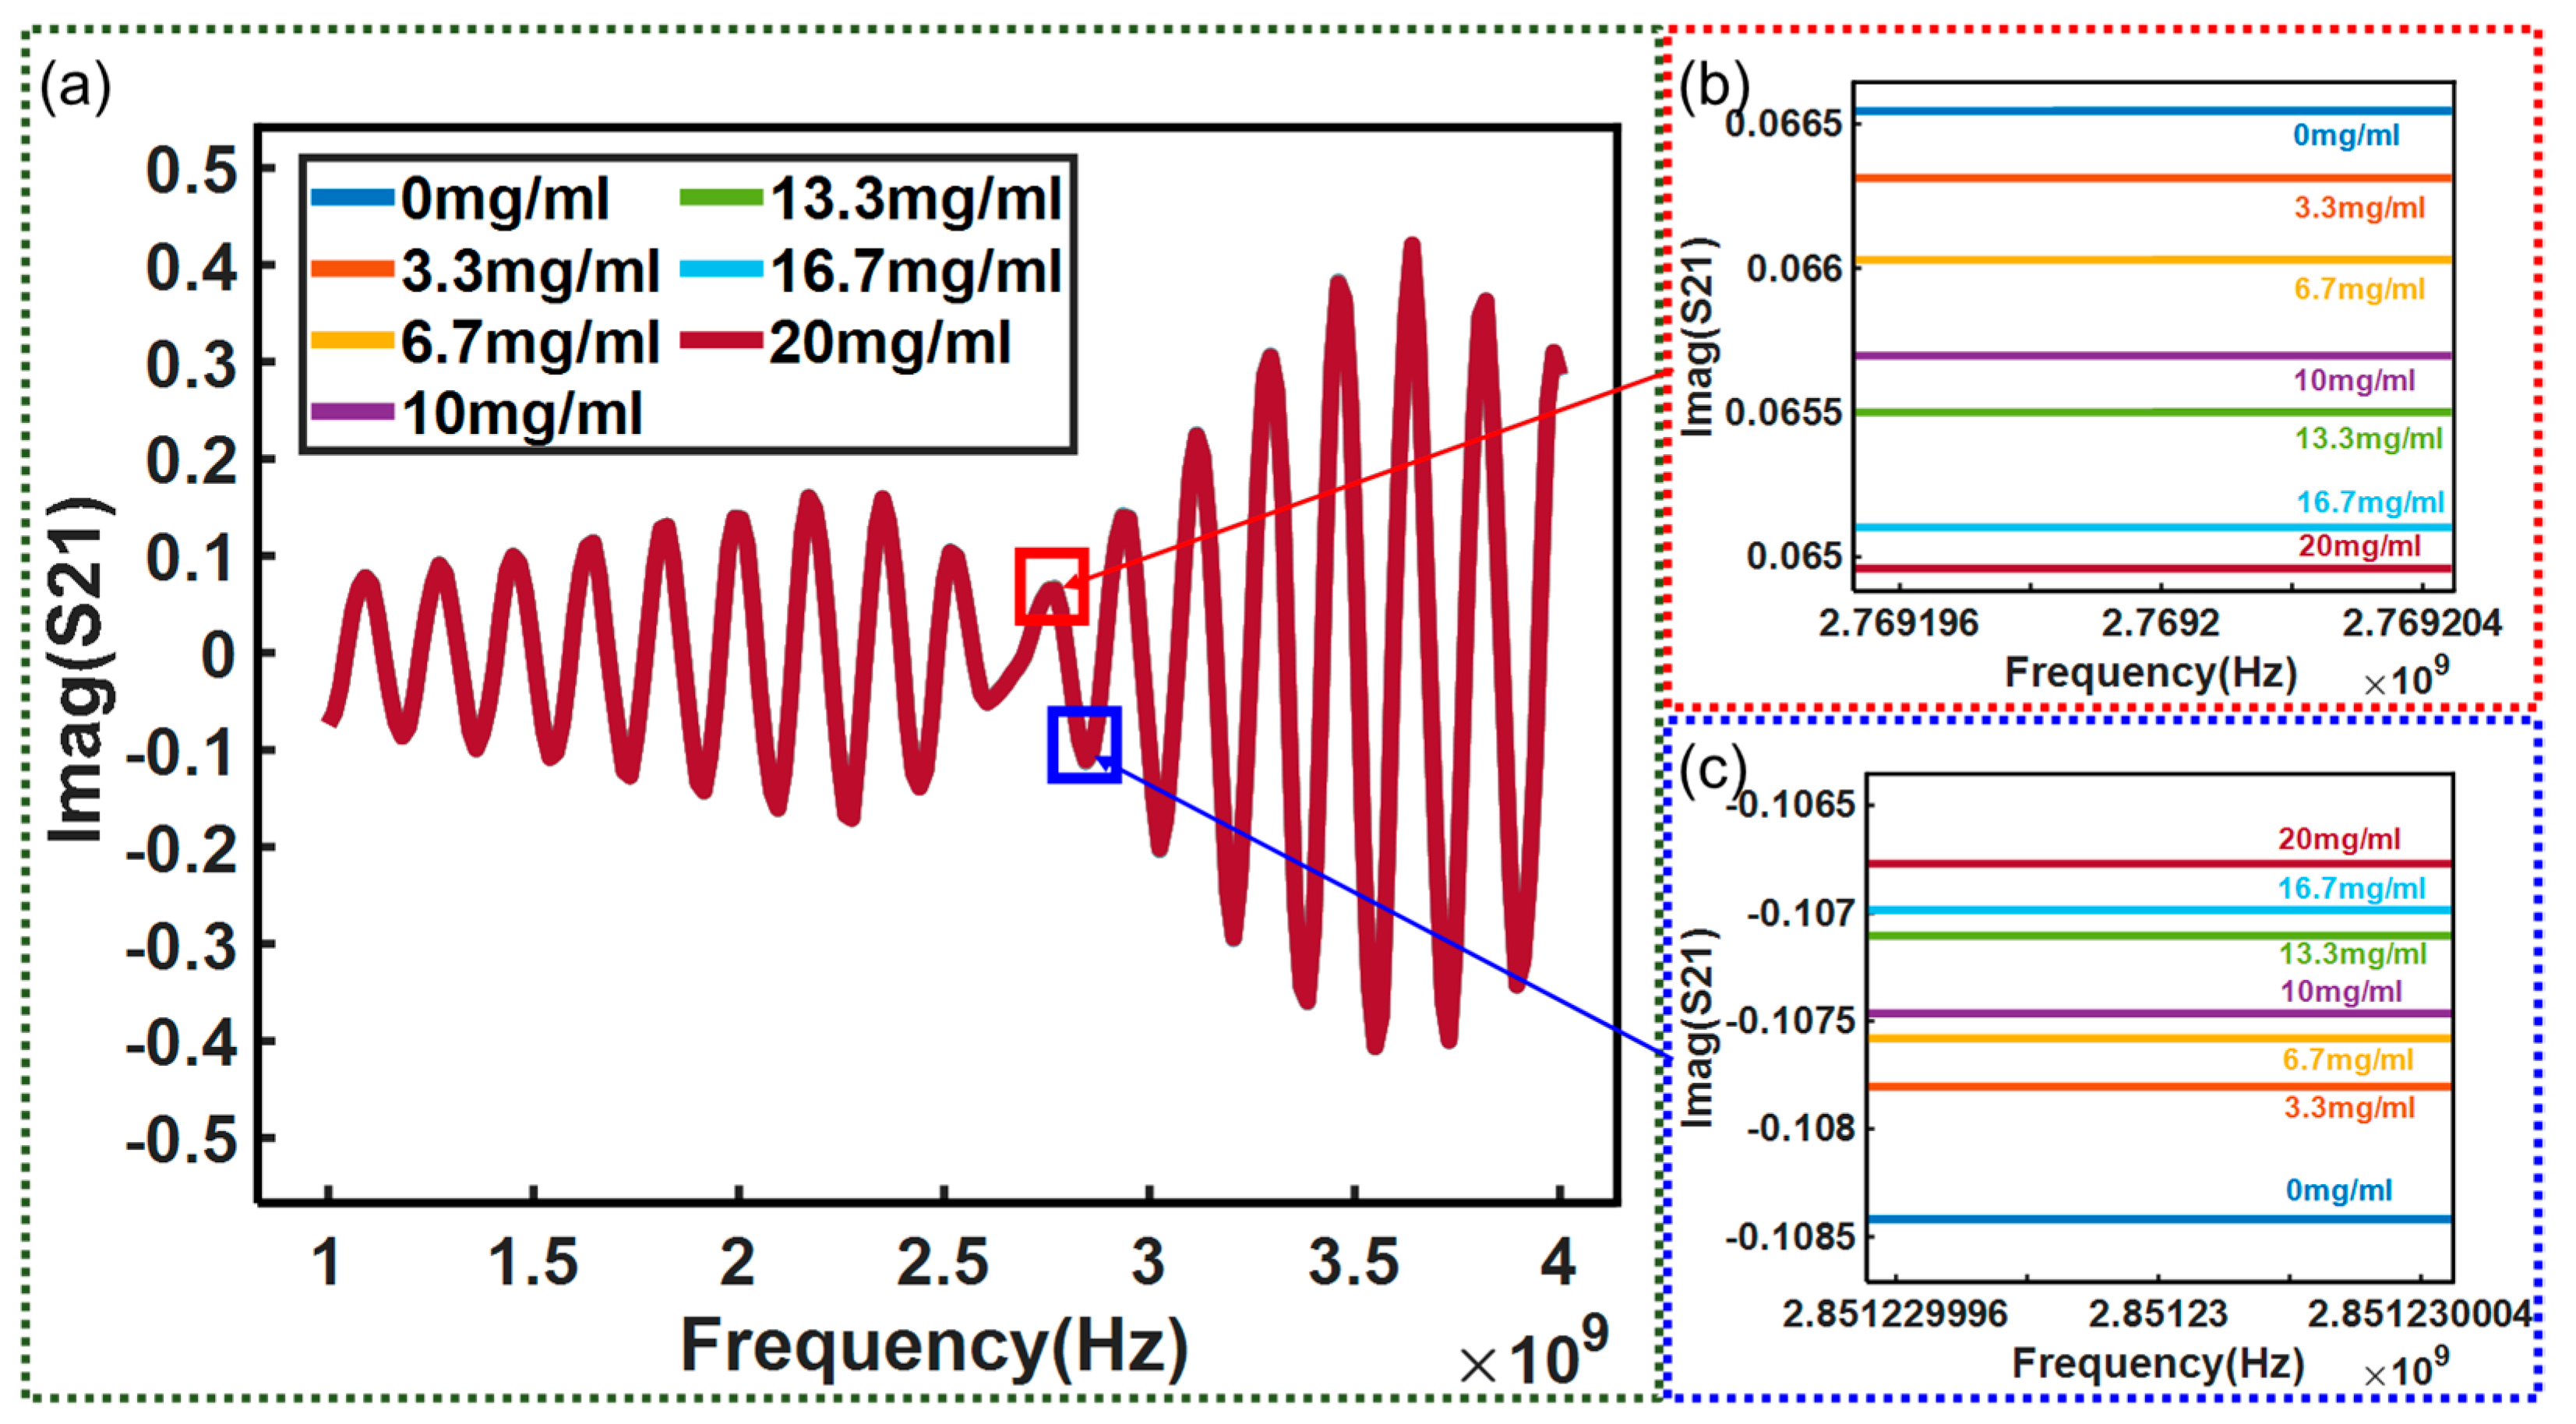
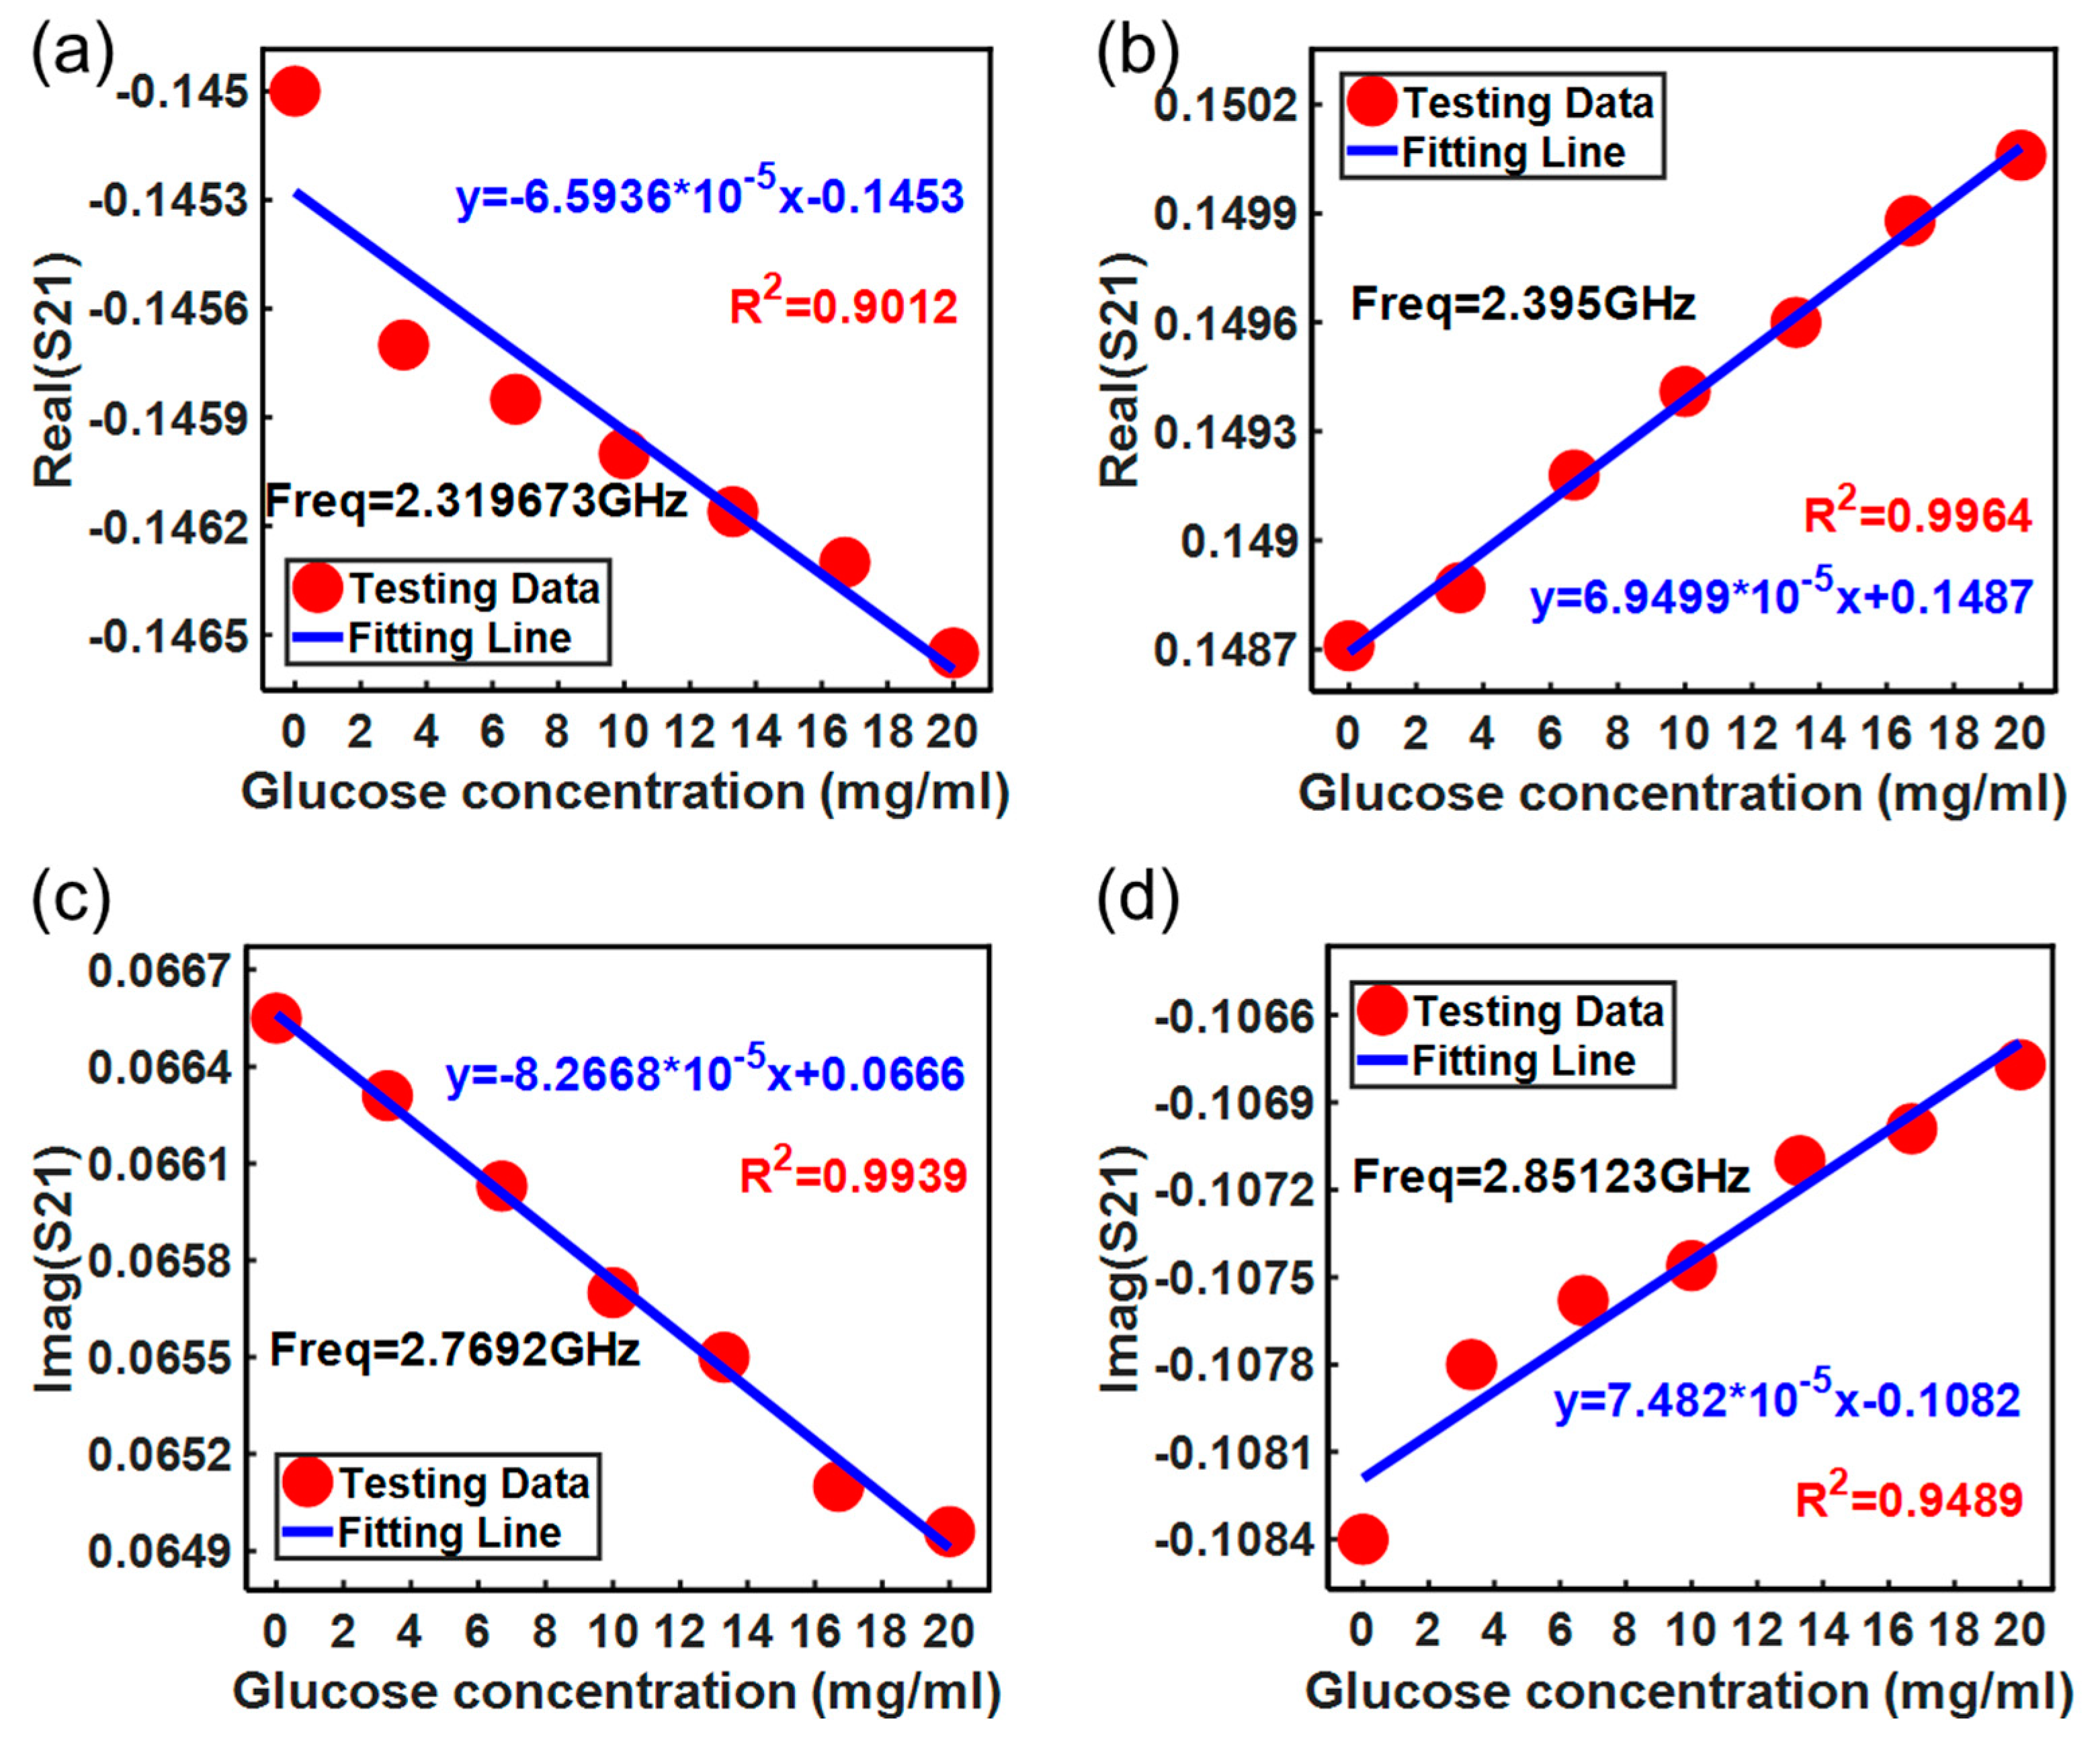
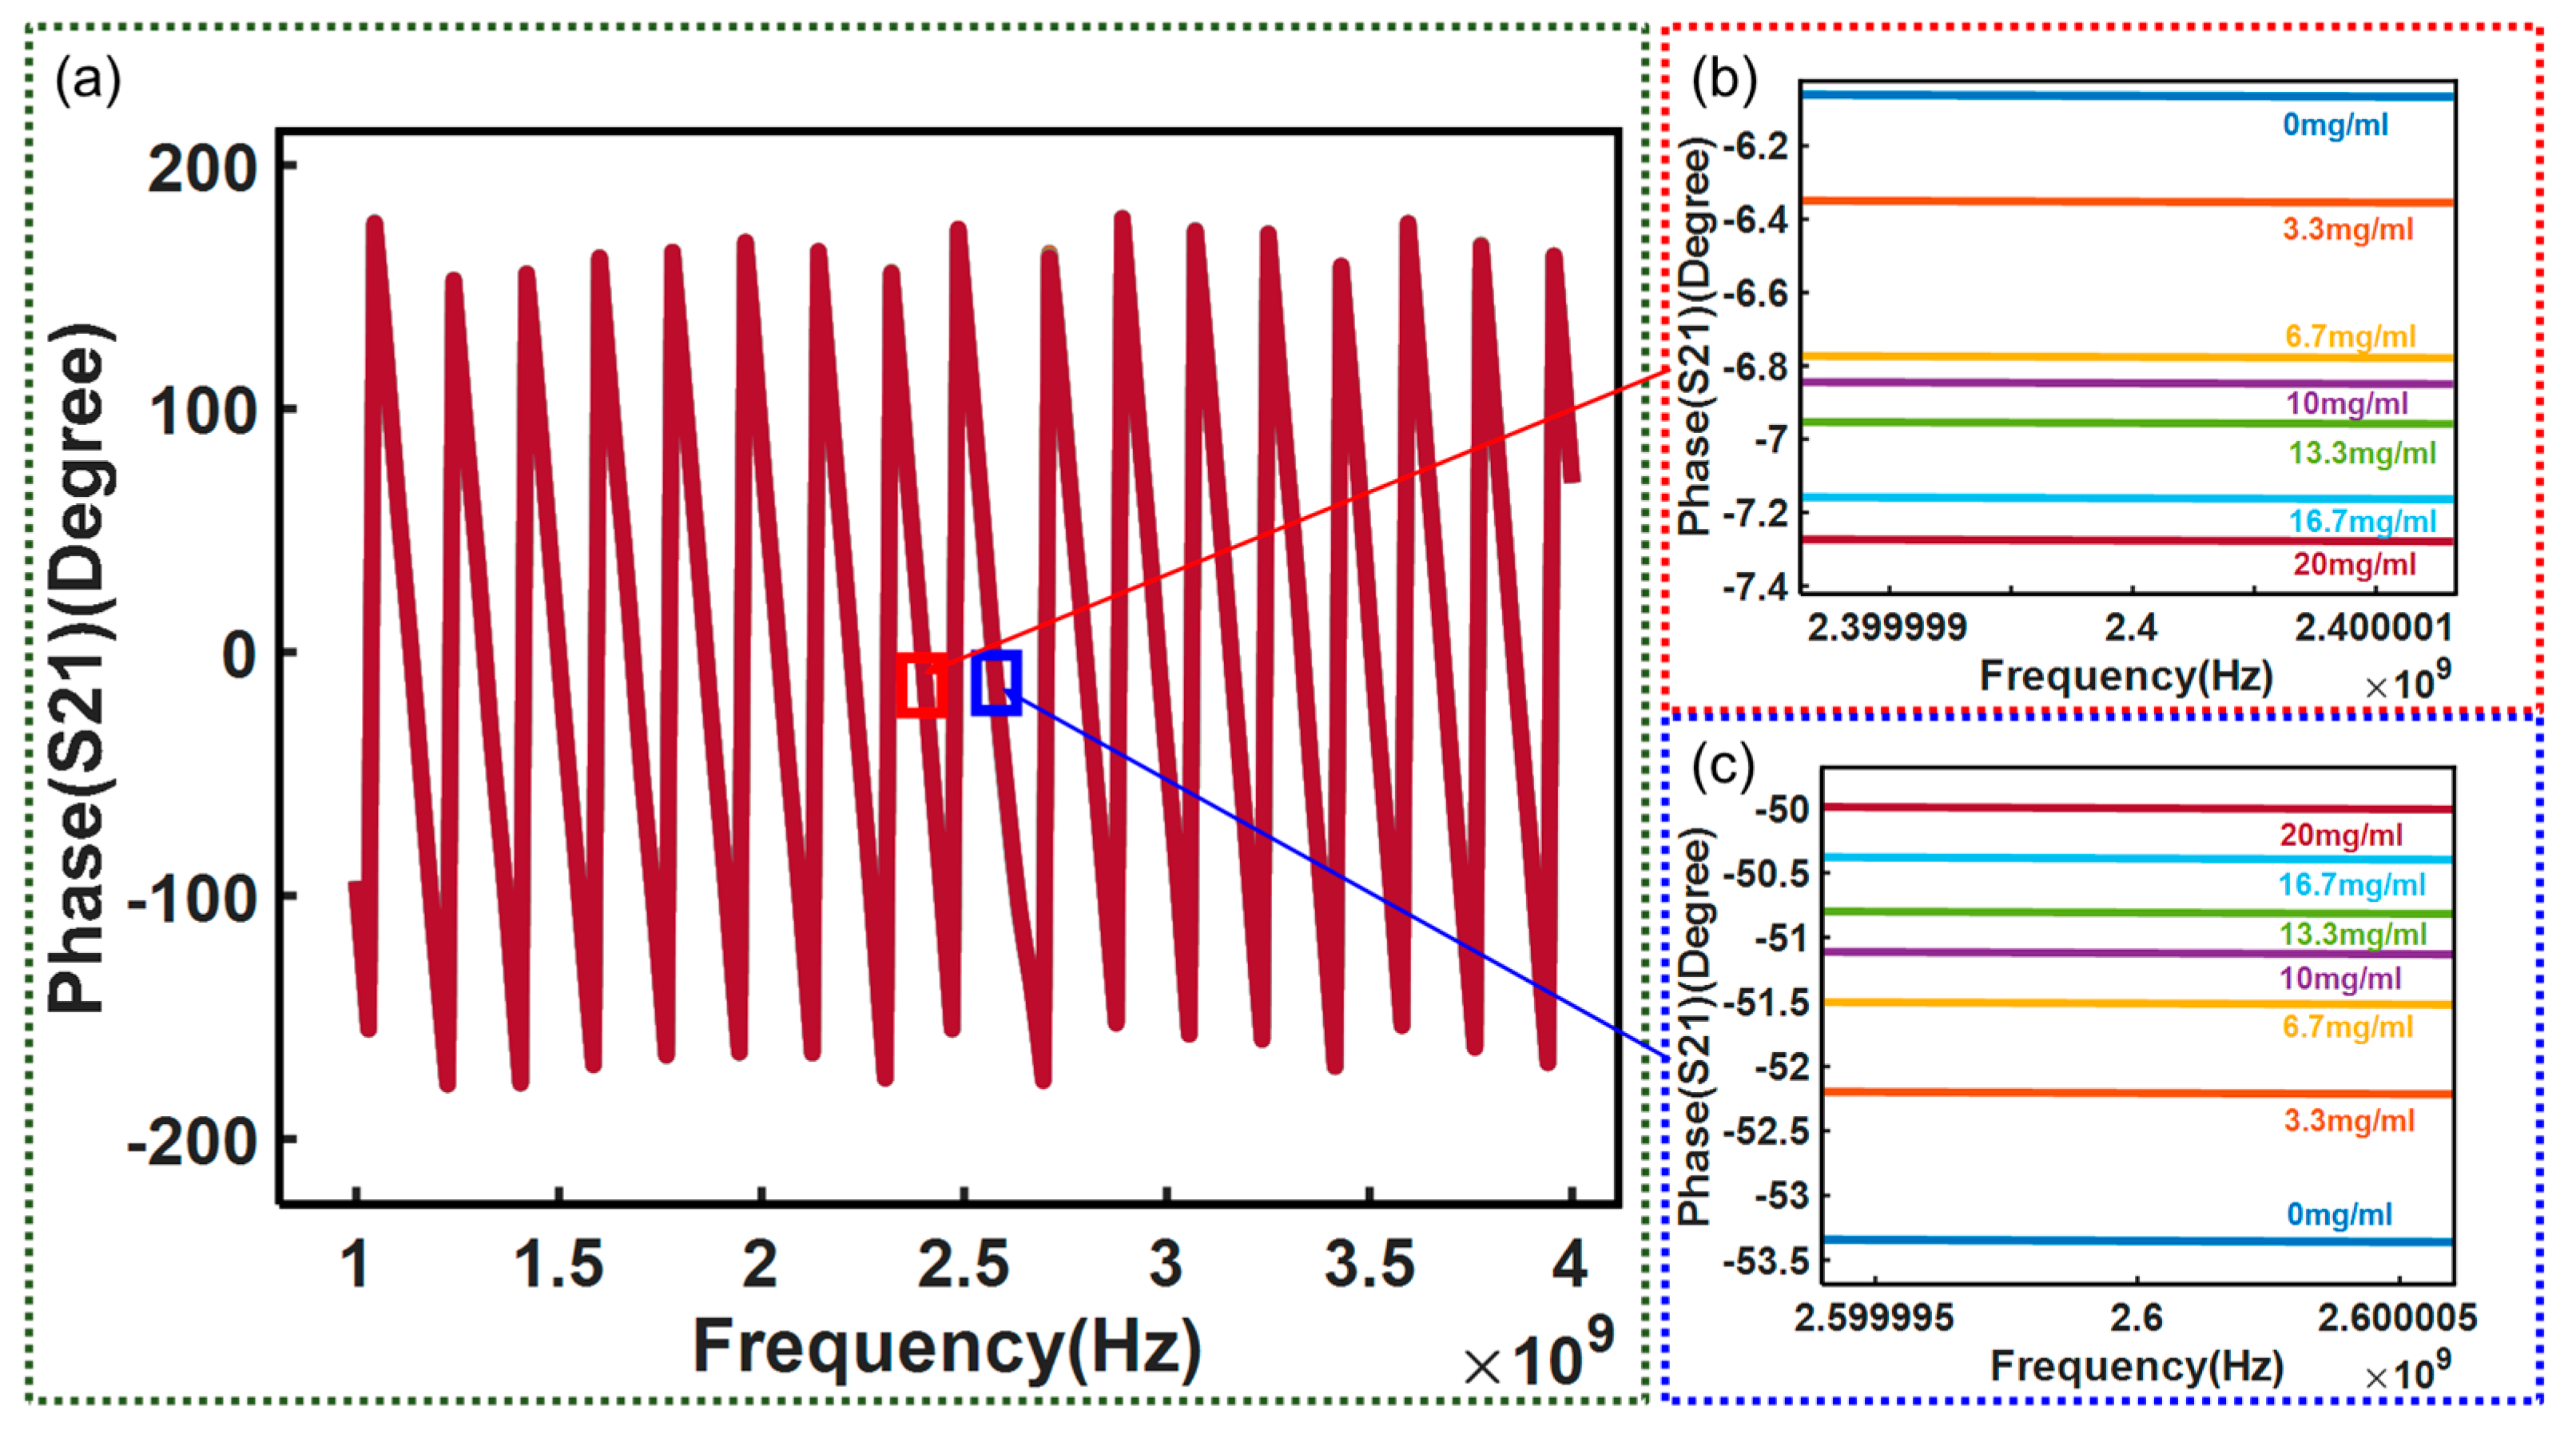
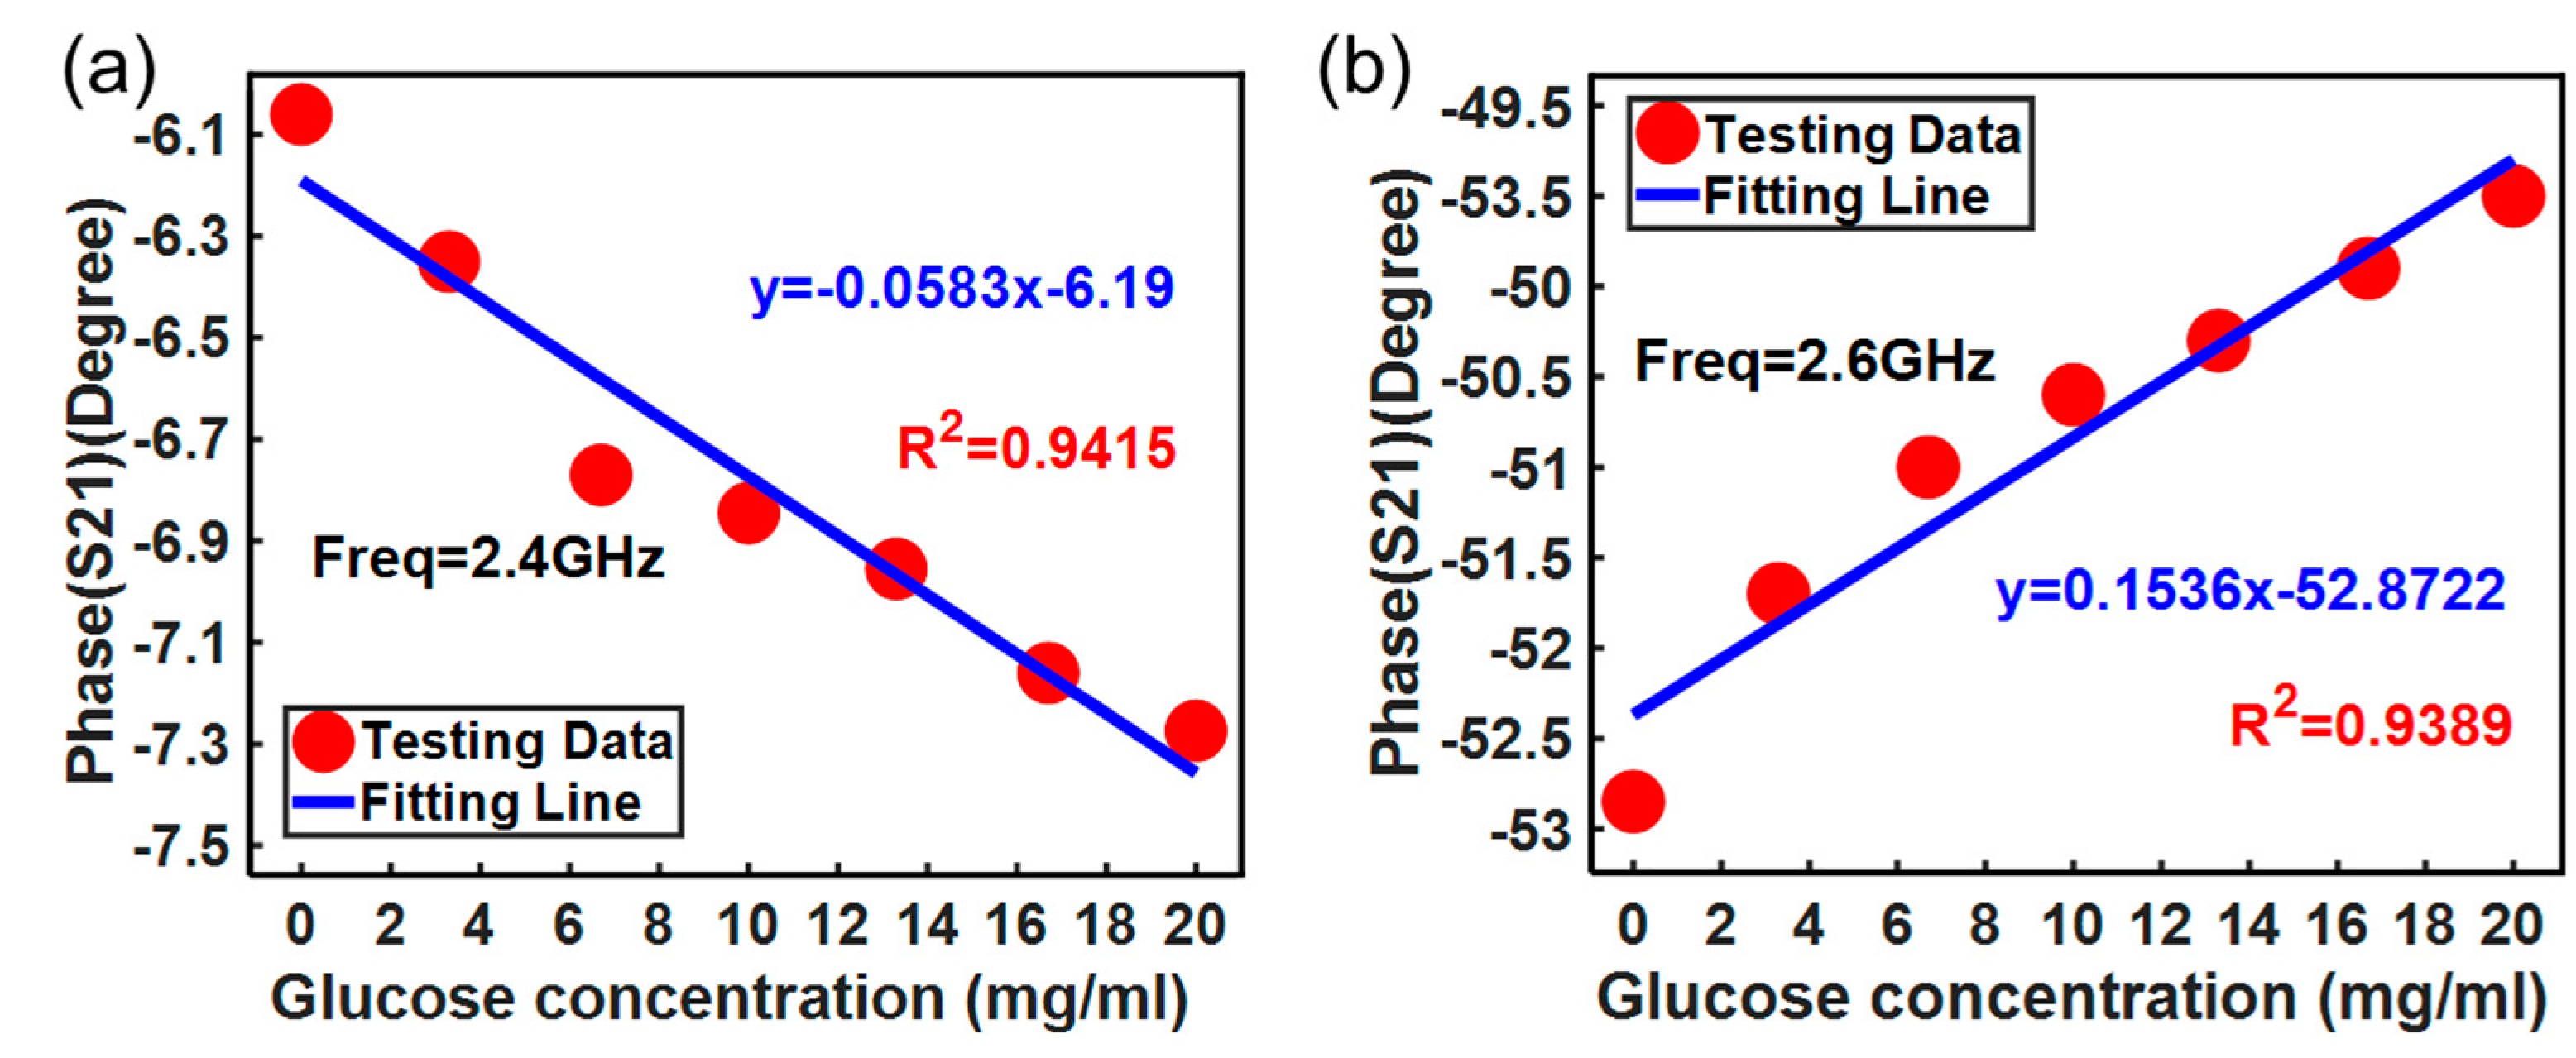
3. Results and Discussion
4. Conclusions
Author Contributions
Funding
Data Availability Statement
Conflicts of Interest
References
- Wild, S.; Roglic, G.; Green, A.; Sicree, R.; King, H. Global prevalent of diabetes. Diabetes Care 2004, 27, 1047–1053. [Google Scholar] [CrossRef] [PubMed]
- Choi, H.; Naylon, J.; Luzio, S.; Beutler, J.; Birchall, J.; Martin, C.; Porch, A. Design and In Vitro Interference Test of Microwave Noninvasive Blood Glucose Monitoring Sensor. IEEE Trans. Microw. Theory Technol. 2015, 63, 3016–3026. [Google Scholar] [CrossRef]
- Chen, J.; Arnold, M.A.; Small, G.W. Comparison of combination and first overtone spectral regions for near-infrared calibration models for glucose and other biomolecules in aqueous solutions. Anal. Chem. 2004, 76, 5405–5413. [Google Scholar] [CrossRef] [PubMed]
- Heise, H.M.; Damm, U.; Kondepati, V.R. Reliable long-term continuous blood glucose monitoring for patients in critical care using microdialysis and infrared spectrometry. Proc. SPIE 2006, 6093, 609303. [Google Scholar]
- Maruo, K.; Oota, T.; Tsurugi, M.; Nakagawa, T.; Arimoto, H.; Hayakawa, M.; Tamura, M.; Ozaki, Y.; Yamada, Y. Noninvasive near-infrared blood glucose monitoring using a calibration model built by a numerical simulation method: Trial application to patients in an intensive care unit. Appl. Spectrosc. 2006, 60, 1423–1431. [Google Scholar] [CrossRef] [PubMed]
- Shi, X.W.; Xiao, X. Research on non-invasive blood glucose detector based on photoacoustic effect. Infrared Ray 2009, 30, 20–23. [Google Scholar]
- Pai, P.P.; Sanki, P.K.; Sarangi, S.; Banerjee, S. Modelling, verification, and calibration of a photoacoustics based continuous non-invasive blood glucose monitoring system. Rev. Sci. Instrum. 2015, 86, 064901. [Google Scholar] [CrossRef] [PubMed]
- Ling, M.S.; Qian, Z.Y.; Liang, C.Y. Study on fluorescence Spectral Detection of Blood glucose concentration. J. Quantum Electron. 2007, 24, 635–639. [Google Scholar]
- Srinivasan, G.; Chen, J.; Parisi, J.; Brückner, C.; Yao, X.; Lei, Y. An Injectable PEG-BSA-Coumarin-GOx Hydrogel for Fluorescence Turn-on Glucose Detection. Appl. Biochem. Biotechnol. 2015, 177, 1115–1126. [Google Scholar]
- Li, A.Q.; Guo, C.; Xu, S.Y. A novel fluorescent Nano sensor for highly sensitive Detection of glucose. Anal. Chem. 2017, 45, 824–829. [Google Scholar]
- Hanna, J.; Bteich, M.; Tawk, Y.; Ramadan, A.H.; Dia, B.; Asadallah, F.A.; Eid, A.; Kanj, R.; Costantine, J.; Eid, A.A. Noninvasive, wearable, and tunable electromagnetic multisensing system for continuous glucose monitoring, mimicking vasculature anatomy. Sci. Adv. 2020, 6, eaba5320. [Google Scholar] [CrossRef] [PubMed]
- Sieg, A.; Guy, R.H.; Delgado-Charro, M.B. Delgado-Charro, Noninvasive glucose monitoring by reverse iontophoresis in vivo: Application of the internal standard concept. Clin. Chem. 2004, 50, 1383–1390. [Google Scholar] [CrossRef]
- Lipani, L.; Dupont, B.G.R.; Doungmene, F.; Marken, F.; Tyrrell, R.M.; Guy, R.H.; Ilie, A. Non-invasive, transdermal, path-selective and specific glucose monitoring via a graphene-based platform. Nat. Nanotechnol. 2018, 13, 504–511. [Google Scholar] [CrossRef] [PubMed]
- Miya, N.; Machogo-Phao, L.F.E.; Ntsendwana, B. Exploring Copper Oxide and Copper Sulfide for Non-Enzymatic Glucose Sensors: Current Progress and Future Directions. Micromachines 2023, 14, 1849. [Google Scholar] [CrossRef]
- Kannan, P.; Maduraiveeran, G. Bimetallic Nanomaterials-Based Electrochemical Biosensor Platforms for Clinical Applications. Micromachines 2022, 13, 76. [Google Scholar] [CrossRef]
- Müsse, A.; La Malfa, F.; Brunetti, V.; Rizzi, F.; De Vittorio, M. Flexible Enzymatic Glucose Electrochemical Sensor Based on Polystyrene-Gold Electrodes. Micromachines 2021, 12, 805. [Google Scholar] [CrossRef]
- Li, J.; Igbe, T.; Liu, Y.; Nie, Z.; Qin, W.; Wang, L.; Hao, Y. An Approach for Noninvasive Blood Glucose Monitoring Based on Bioimpedance Difference Considering Blood Volume Pulsation. IEEE Access 2018, 6, 51119–51129. [Google Scholar] [CrossRef]
- Dai, T.; Adler, A. In Vivo Blood Characterization from Bioimpedance Spectroscopy of Blood Pooling. IEEE Trans. Instrum. Meas. 2009, 58, 3831–3838. [Google Scholar]
- Sreenivas, C.; Laha, S. Compact Continuous Non-Invasive Blood Glucose Monitoring using Bluetooth. In Proceedings of the 2019 IEEE Biomedical Circuits and Systems Conference (BioCAS), Nara, Japan, 17–19 October 2019; pp. 1–4. [Google Scholar]
- Nampoothiri, S.N.; Pathinarupothi, R.K.; Ramesh, M.V.; Menonet, K.A.U. Comparison of Infrared and Red Photoplethysmography signals for Non-calibrated Non-invasive Blood Glucose Monitoring. In Proceedings of the 2020 IEEE Region 10 Symposium (TENSYMP), Dhaka, Bangladesh, 5–7 June 2020; pp. 1568–1571. [Google Scholar]
- Kim, S.; Melikyan, H.; Kim, J.; Babajanyan, A.; Lee, J.H.; Enkhtur, L.; Friedman, B.; Lee, K. Noninvasive in vitro measurement of pig-blood d-glucose by using a microwave cavity sensor. Diabetes Res. Clin. Pract. 2012, 96, 379–384. [Google Scholar] [CrossRef]
- Turgul, V.; Kale, I. Characterization of the complex permittivity of glucose/water solutions for noninvasive RF/Microwave blood glucose sensing. In Proceedings of the2016 IEEE International Instrumentation and Measurement Technology Conference Proceedings, Taipei, Taiwan, 23–26 May 2016; pp. 1–5. [Google Scholar]
- Abdolrazzaghi, M.; Katchinskiy, N.; Elezzabi, A.Y.; Light, P.E.; Daneshmand, M. Noninvasive Glucose Sensing in Aqueous Solutions Using an Active Split-Ring Resonator. IEEE Sens. J. 2021, 21, 18742–18755. [Google Scholar] [CrossRef]
- Yun, G.-H. A Study on Slot Coupled Capacitor Resonator for Non-Invasive Glucose Monitoring in Earlobe. J. Korean Inst. Electromagn. Eng. Sci. 2017, 28, 279–285. [Google Scholar] [CrossRef]
- Martίn, F.; Bonache, J.; Falcone, F.; Sorolla, M.; Marqués, R. Split ring resonator-based left-handed coplanar waveguide. Appl. Phys. Lett. 2003, 83, 4652–4654. [Google Scholar] [CrossRef]
- Navarro-Cía, M.; Falcone, F.; Beruete, M.; Arnedo, I.; Illescas, J.; Marcotegui, A.; Laso, M.A.G.; Lopetegi, T. Left-handed behavior in a microstrip line loaded with squared split-ring resonators and an EBG pattern. Microw. Opt. Technol. Lett. 2007, 49, 2689–2692. [Google Scholar] [CrossRef]
- Dong, Y.D.; Yang, T.; Itoh, T. Substrate Integrated Waveguide Loaded by Complementary Split-Ring Resonators and Its Applications to Miniaturized Waveguide Filters. IEEE Trans. Microw. Theory Tech. 2009, 57, 2211–2223. [Google Scholar] [CrossRef]
- Jang, C.; Park, J.K.; Lee, H.J.; Yun, G.H.; Yook, J.G. Temperature-Corrected Fluidic Glucose Sensor Based on Microwave Resonator. Sensors 2018, 18, 3850. [Google Scholar] [CrossRef] [PubMed]
- Tripathi, P.; Kumar, P.; Raj, S.; Tripathi, S.S.; Tripathi, V.S. ANN Based Design of SRR Loaded Patch Antenna for Non-Invasive Blood Glucose Monitoring. In Proceedings of the 2019 4th International Conference on Information Systems and Computer Networks (ISCON), Mathura, India, 21–22 November 2019; pp. 279–283. [Google Scholar]
- Ibnath, A.; Rimu, R.S.; Ullah, M.A. Dual Ring Complementary Split Ring Resonator (DR-CSRR) Sensor for Non-invasive Glucose Sensing Application. In Proceedings of the 2020 11th International Conference on Electrical and Computer Engineering (ICECE), Dhaka, Bangladesh, 17–19 December 2020; pp. 407–410. [Google Scholar]
- Schurig, D.; Mock, J.J.; Smith, D.R. Electric-field-coupled resonators for negative permittivity metamaterials. Appl. Phys. Lett. 2006, 88, 041109. [Google Scholar] [CrossRef]
- Hand, T.H.; Gollub, J.N.; Sajuyigbe, S.; Smith, D.R.; Cummer, S.A. Characterization of complementary electric field coupled resonant surfaces. Appl. Phys. Lett. 2008, 93, 212504. [Google Scholar] [CrossRef]
- Odabasi, H.; Teixeira, F.L.; Guney, D.O. Electrically small, complementary electric-field-coupled resonator antennas. J. Appl. Phys. 2013, 113, 084903. [Google Scholar] [CrossRef]
- Serebryannikov, A.E.; Gokkavas, M.; Gundogdu, T.F.; Volski, V.; Vandenbosch, G.A.; Vasylchenko, A.; Ozbay, E. Ultraminiature Antennas Combining Subwavelength Resonators and a Very-High-ε Uniform Substrate: The Case of Lithium Niobate. IEEE Trans. Antennas Propag. 2020, 68, 5071–5081. [Google Scholar] [CrossRef]
- Kitanaka, S.; Sakakibara, K.; Kikuma, N. Compact planar transmission-line transition direct-connecting from a waveguide to four microstrip-lines. In Proceedings of the International Symposium on Antennas and Propagation, Okinawa, Japan, 24–28 October 2016; pp. 376–377. [Google Scholar]
- Yilmaz, T.; Foster, R.; Hao, Y. Broadband Tissue Mimicking Phantoms and a Patch Resonator for Evaluating Noninvasive Monitoring of Blood Glucose Levels. IEEE Trans. Antennas Propag. 2014, 62, 3064–3075. [Google Scholar] [CrossRef]
- Kapilevich, B.; Litvak, B. Microwave sensor for accurate measurements of water solution concentrations. In Proceedings of the 2007 Asia-Pacific Microwave Conference, Bangkok, Thailand, 11–14 December 2007; pp. 1–4. [Google Scholar]
- Gennarelli, G.; Romeo, S.; Scarfì, M.R.; Soldovieri, F. A Microwave Resonant Sensor for Concentration Measurements of Liquid Solutions. IEEE Sens. J. 2013, 13, 1857–1864. [Google Scholar] [CrossRef]
- Sharafadinzadeh, N.; Abdolrazzaghi, M.; Daneshmand, M. Highly sensitive microwave split ring resonator sensor using gap extension for glucose sensing. In Proceedings of the 2017 IEEE MTT-S International Microwave Workshop Series on Advanced Materials and Processes for RF and THz Applications (IMWS-AMP), Pavia, Italy, 20–22 September 2017; pp. 1–3. [Google Scholar]


| Parameter | Value (mm) |
|---|---|
| a | 7 |
| b | 5.02 |
| c | 2.4 |
| d | 0.385 |
| g | 0.29 |
| w | 18 |
| l | 37 |
| e | 2.4 |
| Method | Solutions to Be Tested | Sensitivity (dB/(mg/mL)) |
|---|---|---|
| Microwave sensor [37] | Water-Sugar | 0.0065 |
| Rectangular waveguide cavity [38] | Water-Sucrose | 0.018 |
| SRR [39] | Water-glucose | 0.0126 (10–50 mg/mL) |
| This study | Water-glucose | 0.0297 |
Disclaimer/Publisher’s Note: The statements, opinions and data contained in all publications are solely those of the individual author(s) and contributor(s) and not of MDPI and/or the editor(s). MDPI and/or the editor(s) disclaim responsibility for any injury to people or property resulting from any ideas, methods, instructions or products referred to in the content. |
© 2024 by the authors. Licensee MDPI, Basel, Switzerland. This article is an open access article distributed under the terms and conditions of the Creative Commons Attribution (CC BY) license (https://creativecommons.org/licenses/by/4.0/).
Share and Cite
Yang, S.; Gao, S.; Zhuang, Y.; Hu, W.; Zhao, J.; Yi, Z. Non-Destructive Sensor for Glucose Solution Concentration Detection Using Electromagnetic Technology. Micromachines 2024, 15, 758. https://doi.org/10.3390/mi15060758
Yang S, Gao S, Zhuang Y, Hu W, Zhao J, Yi Z. Non-Destructive Sensor for Glucose Solution Concentration Detection Using Electromagnetic Technology. Micromachines. 2024; 15(6):758. https://doi.org/10.3390/mi15060758
Chicago/Turabian StyleYang, Shasha, Shiwen Gao, Yi Zhuang, Wence Hu, Junyi Zhao, and Zhenxiang Yi. 2024. "Non-Destructive Sensor for Glucose Solution Concentration Detection Using Electromagnetic Technology" Micromachines 15, no. 6: 758. https://doi.org/10.3390/mi15060758