

Microfluidic Wound-Healing Assay for Comparative Study on Fluid Dynamic, Chemical and Mechanical Wounding on Microglia BV2 Migration


Abstract
1. Introduction
2. Materials and Methods
2.1. Device Design and Fabrication
2.2. Cell Culture
2.3. Cell Seeding
2.4. Experimental Setup for Wound Edge Formation
2.5. Simulation of Fluid Flow Behavior in the Device
2.6. Scratch Assay
2.7. Data and Statistical Analysis
3. Results and Discussion
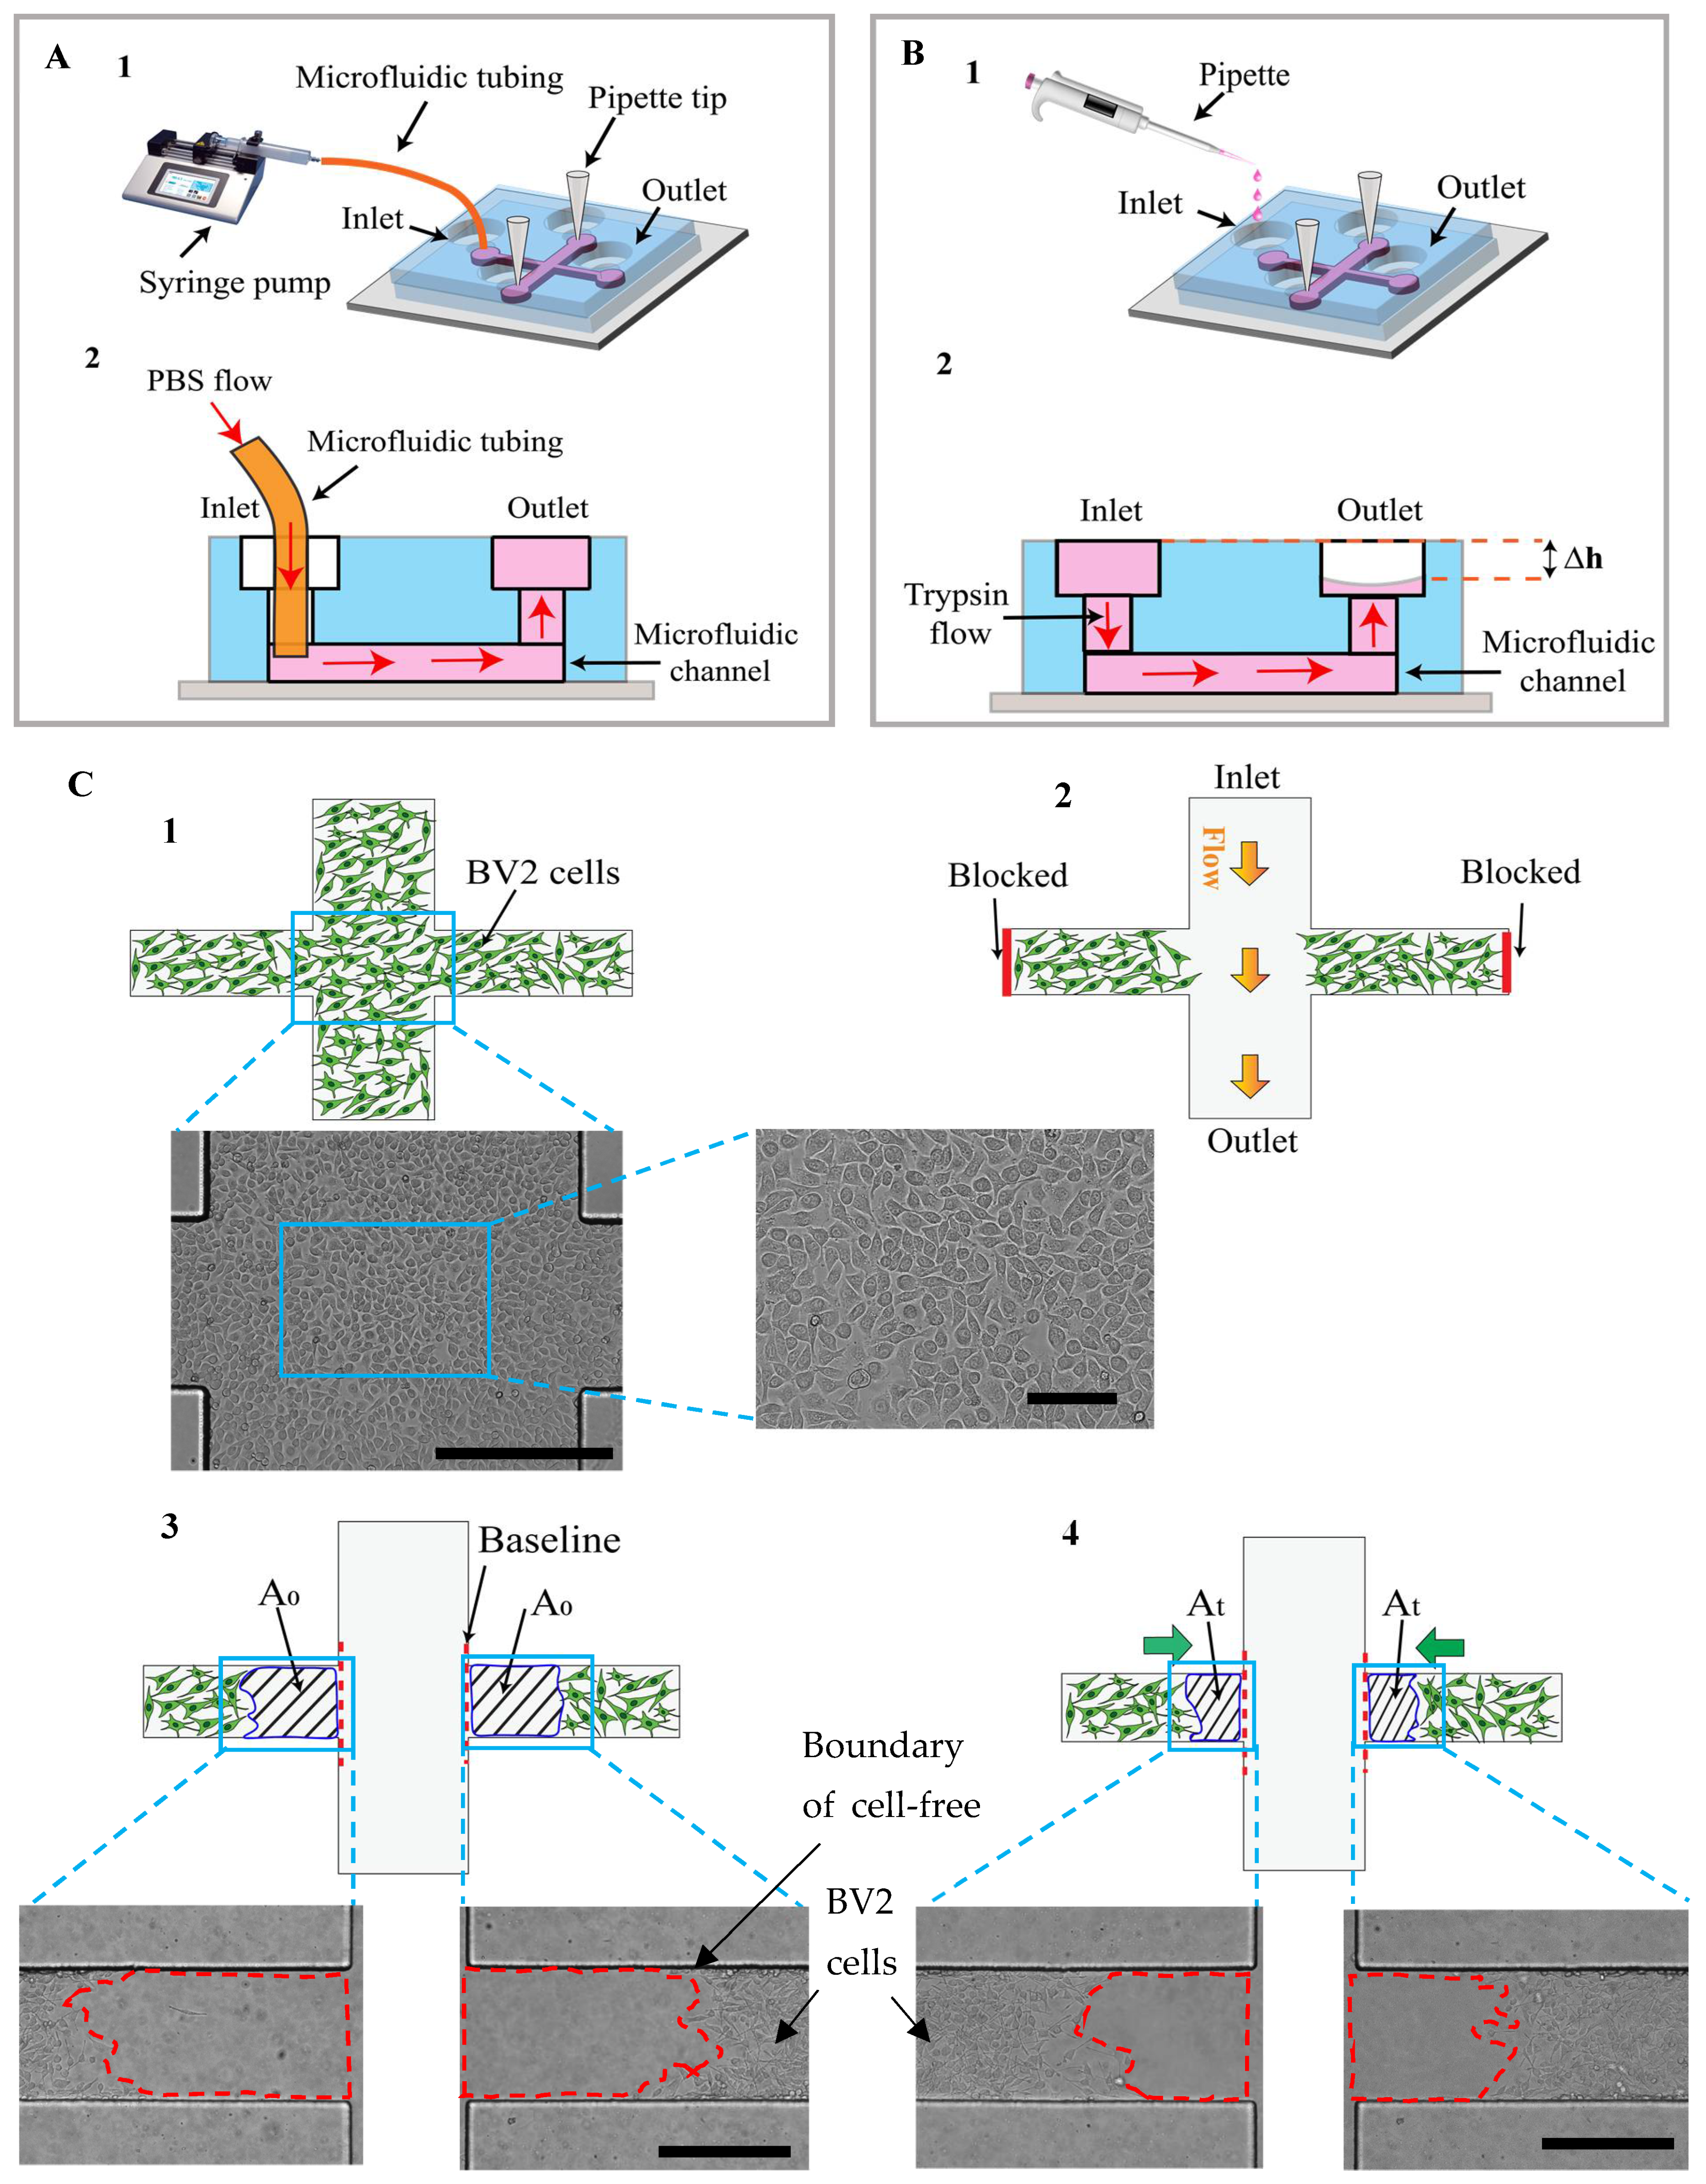
3.1. Conceptual Design of the Microfluidic Adhesion and Migration Assay
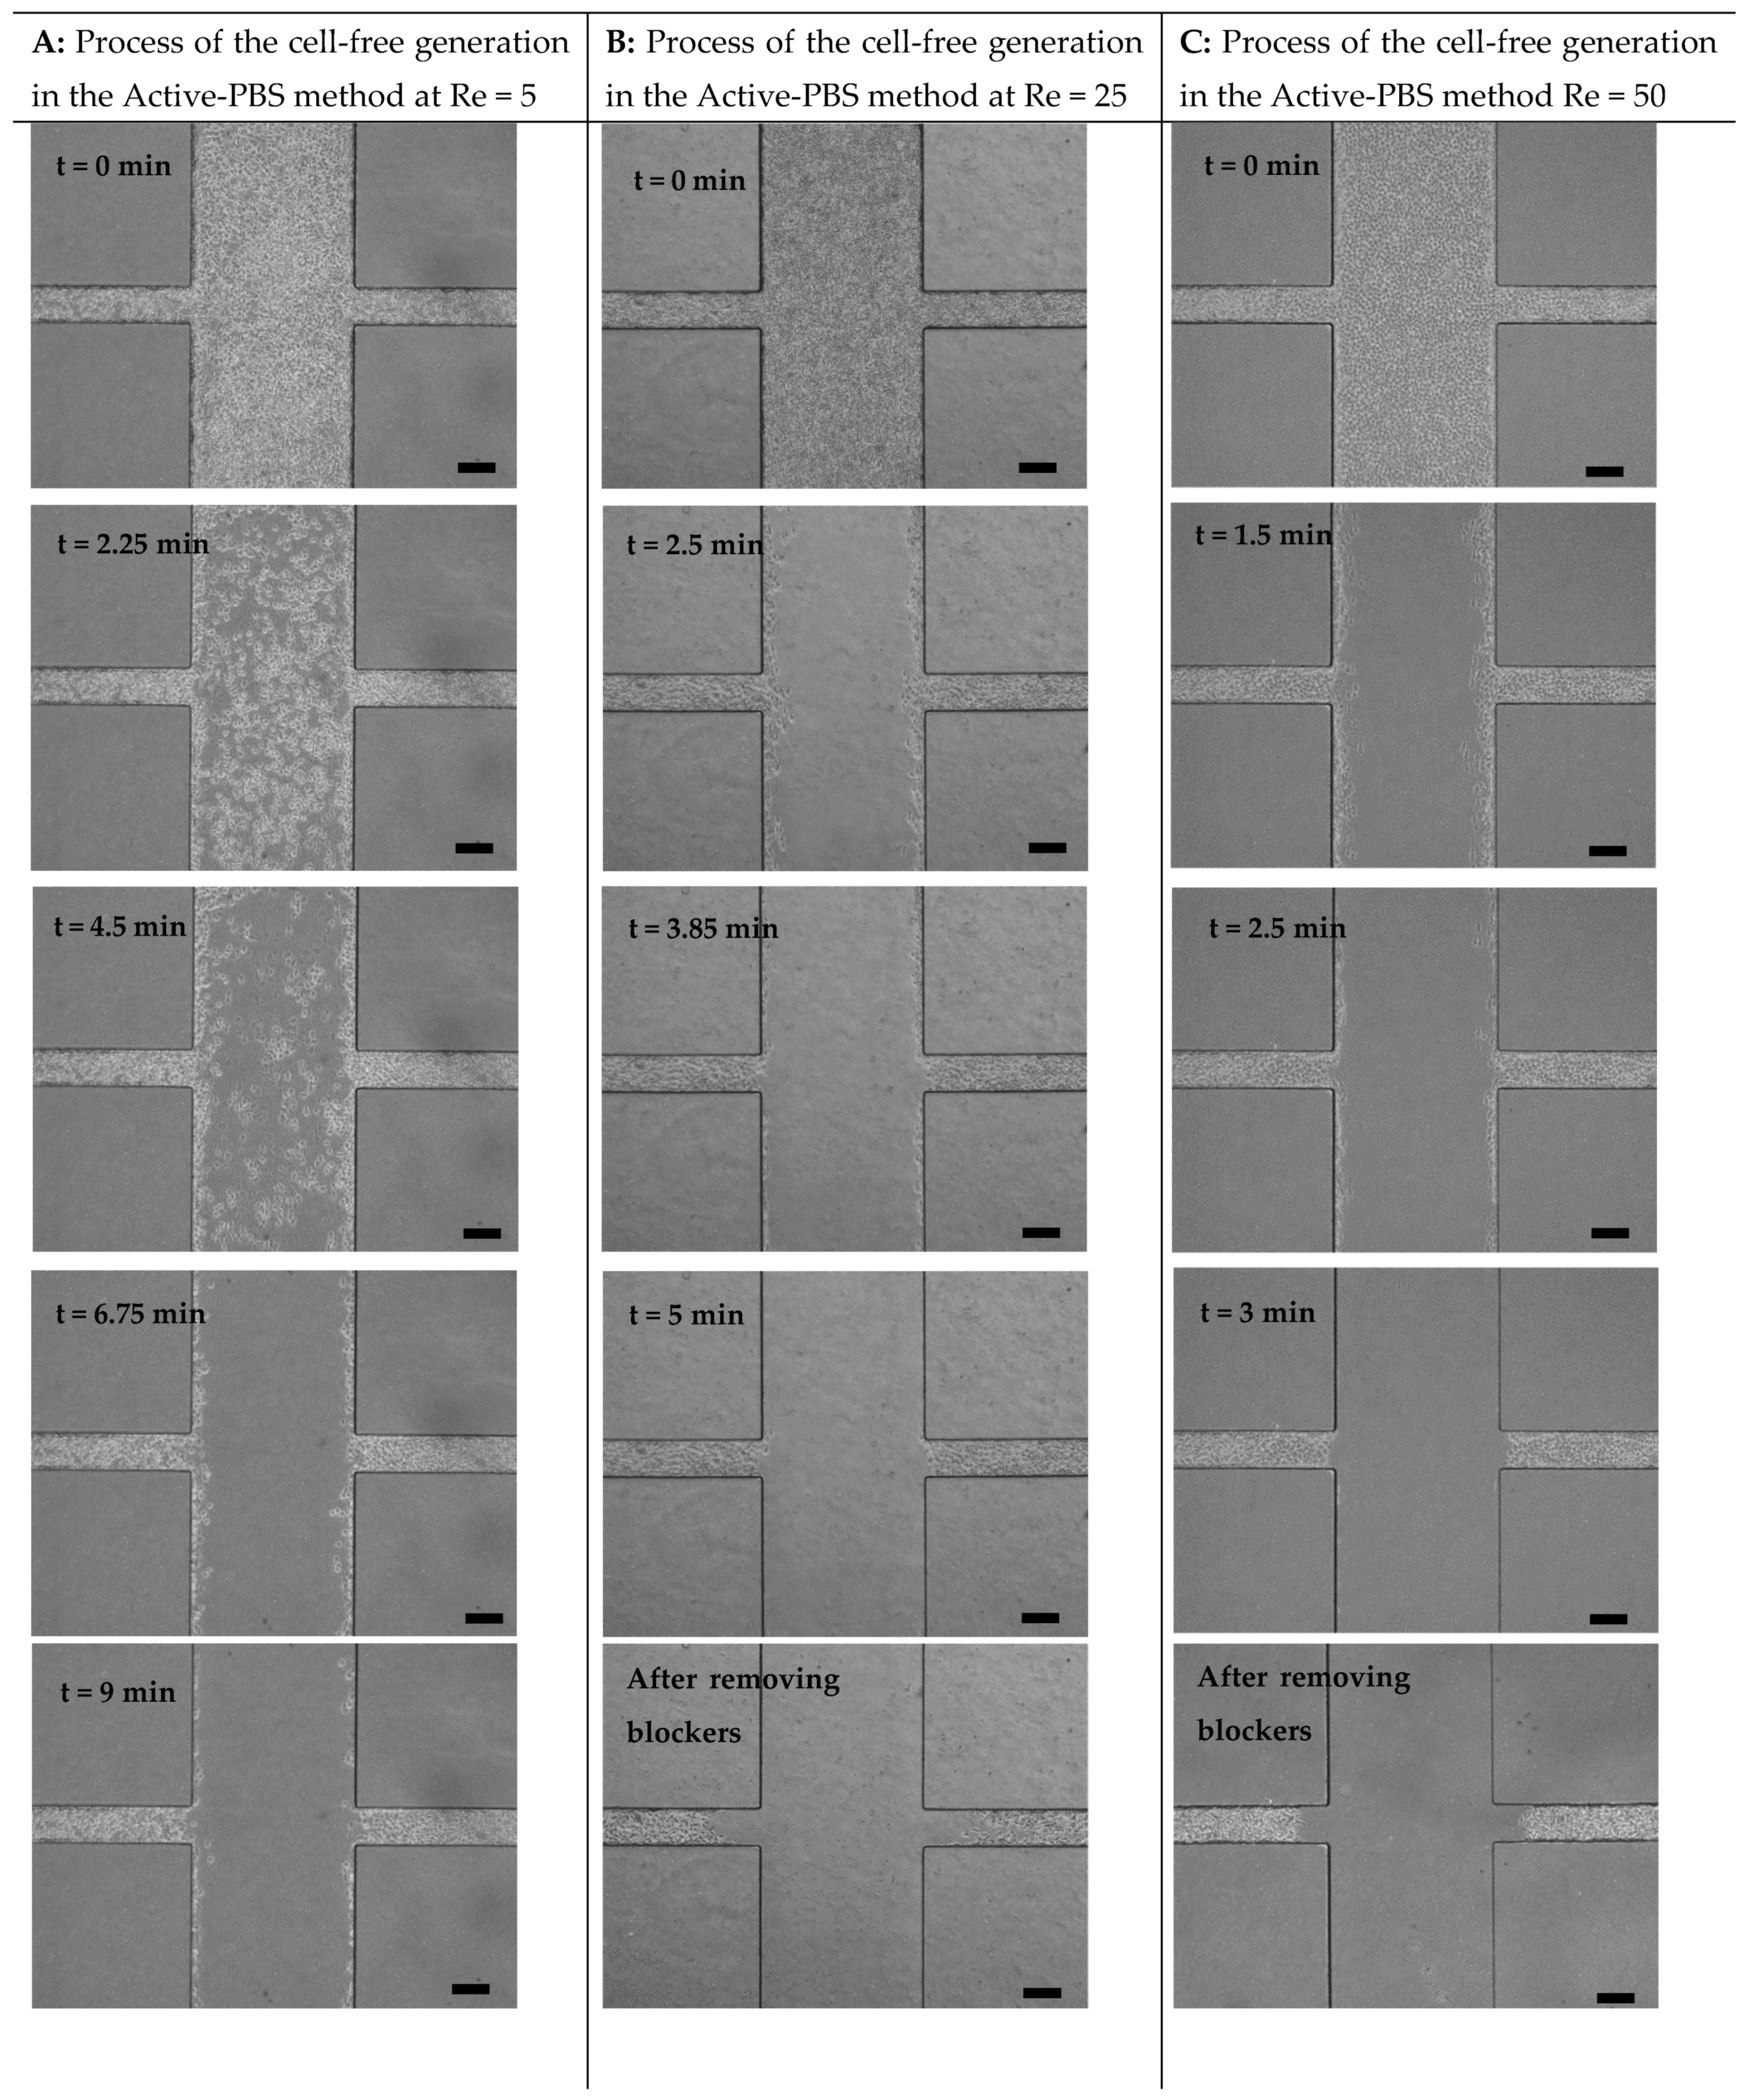
3.2. Mechanism of Cell-Free Area Generation
3.3. Quantitative Analysis of Cell Adhesion
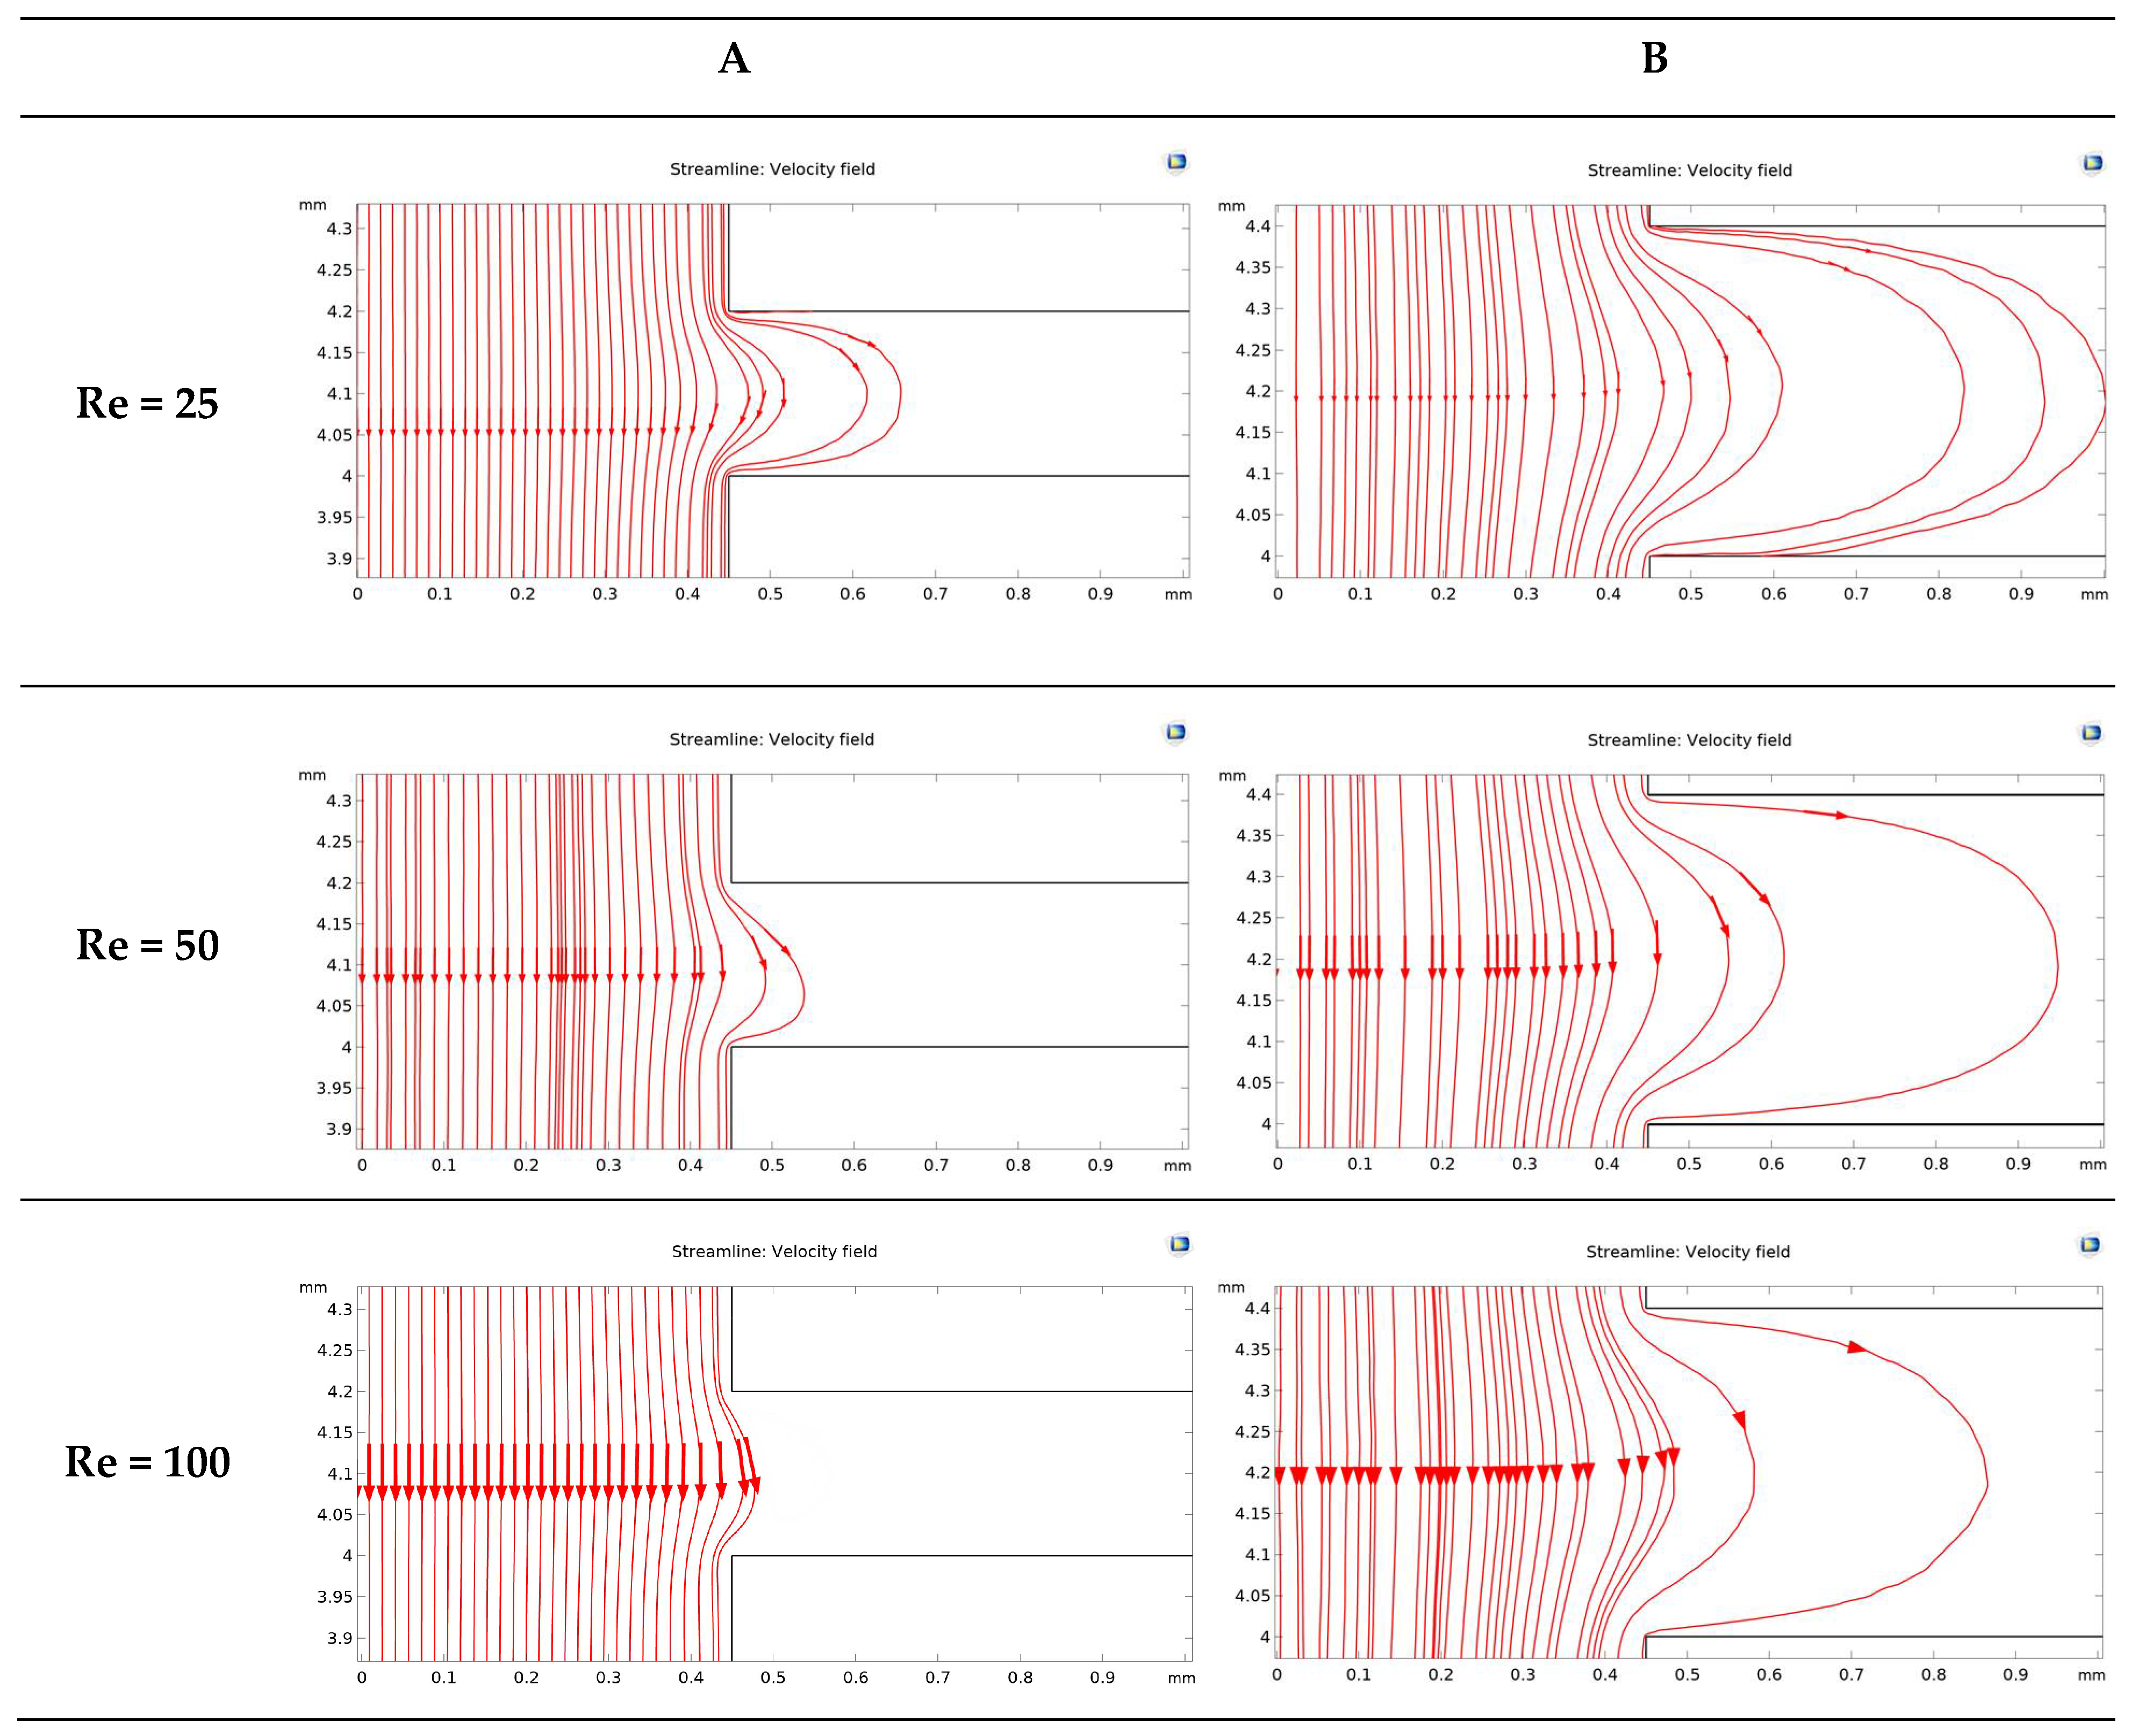
3.4. Investigation of Fluid Flow Behavior in the Microfluidic Device
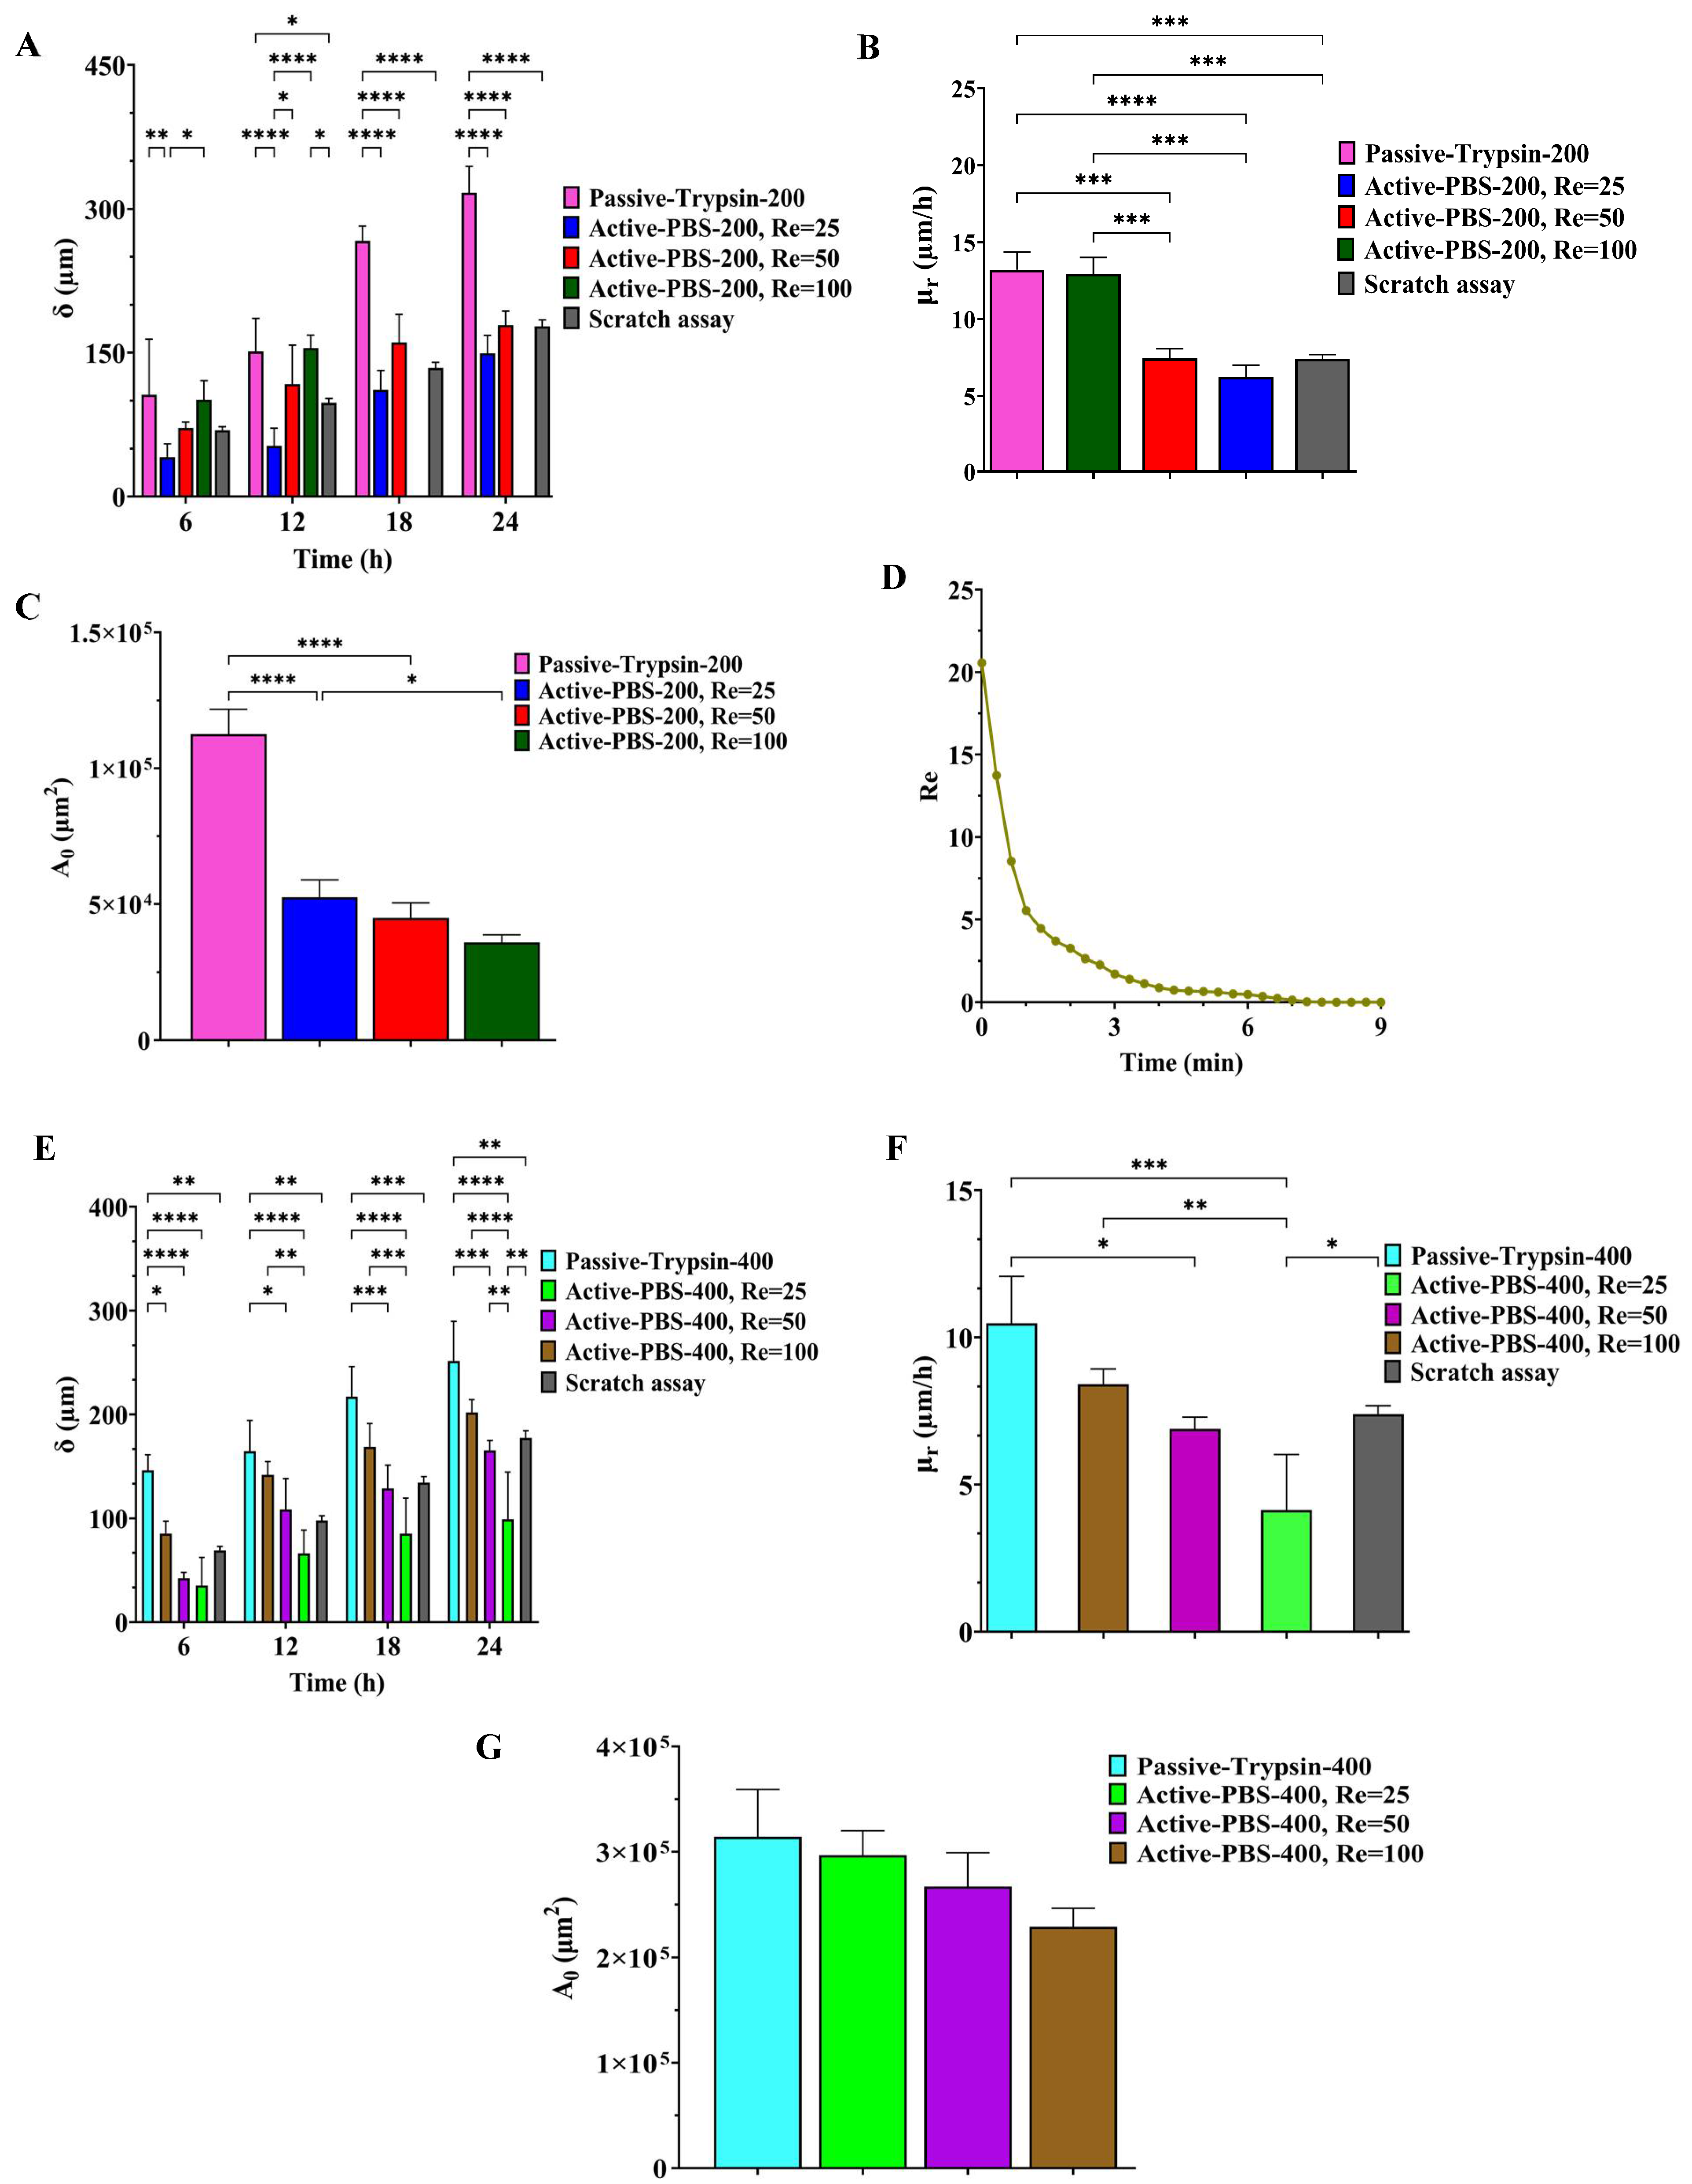
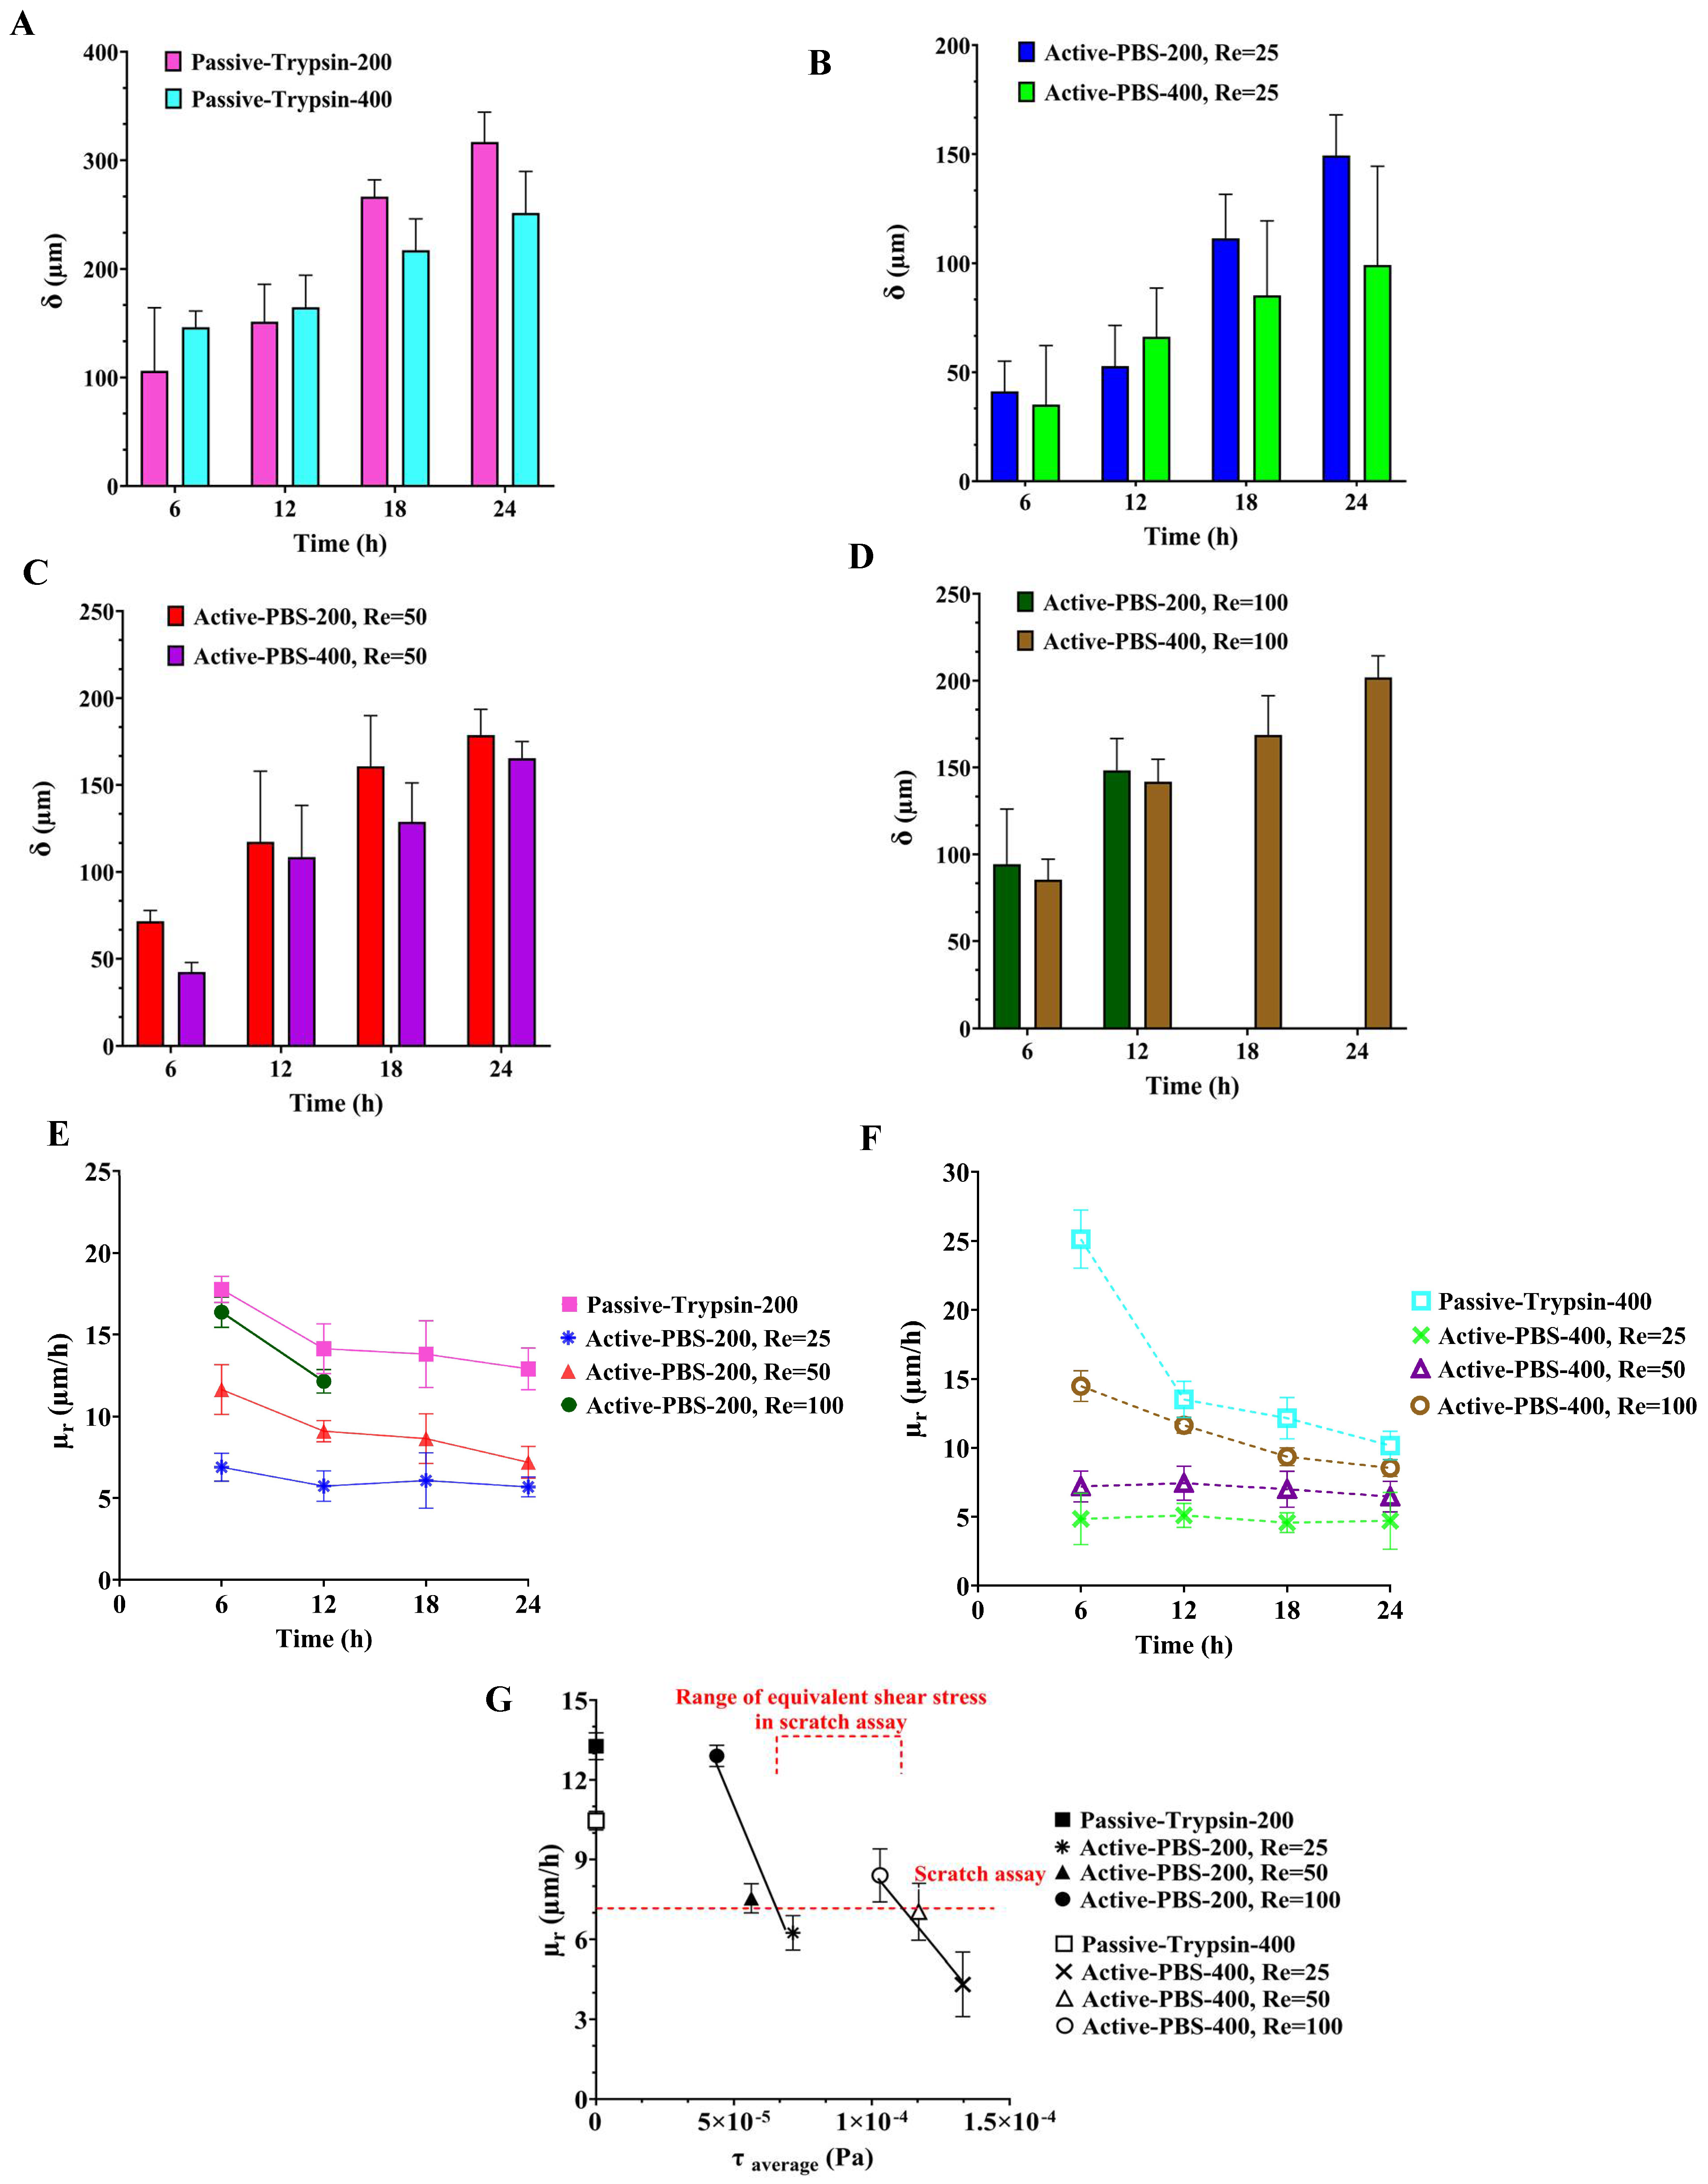
3.5. Quantification of Cell Migration in the Process of Cell-Free Area Generation Chemically and Mechanically
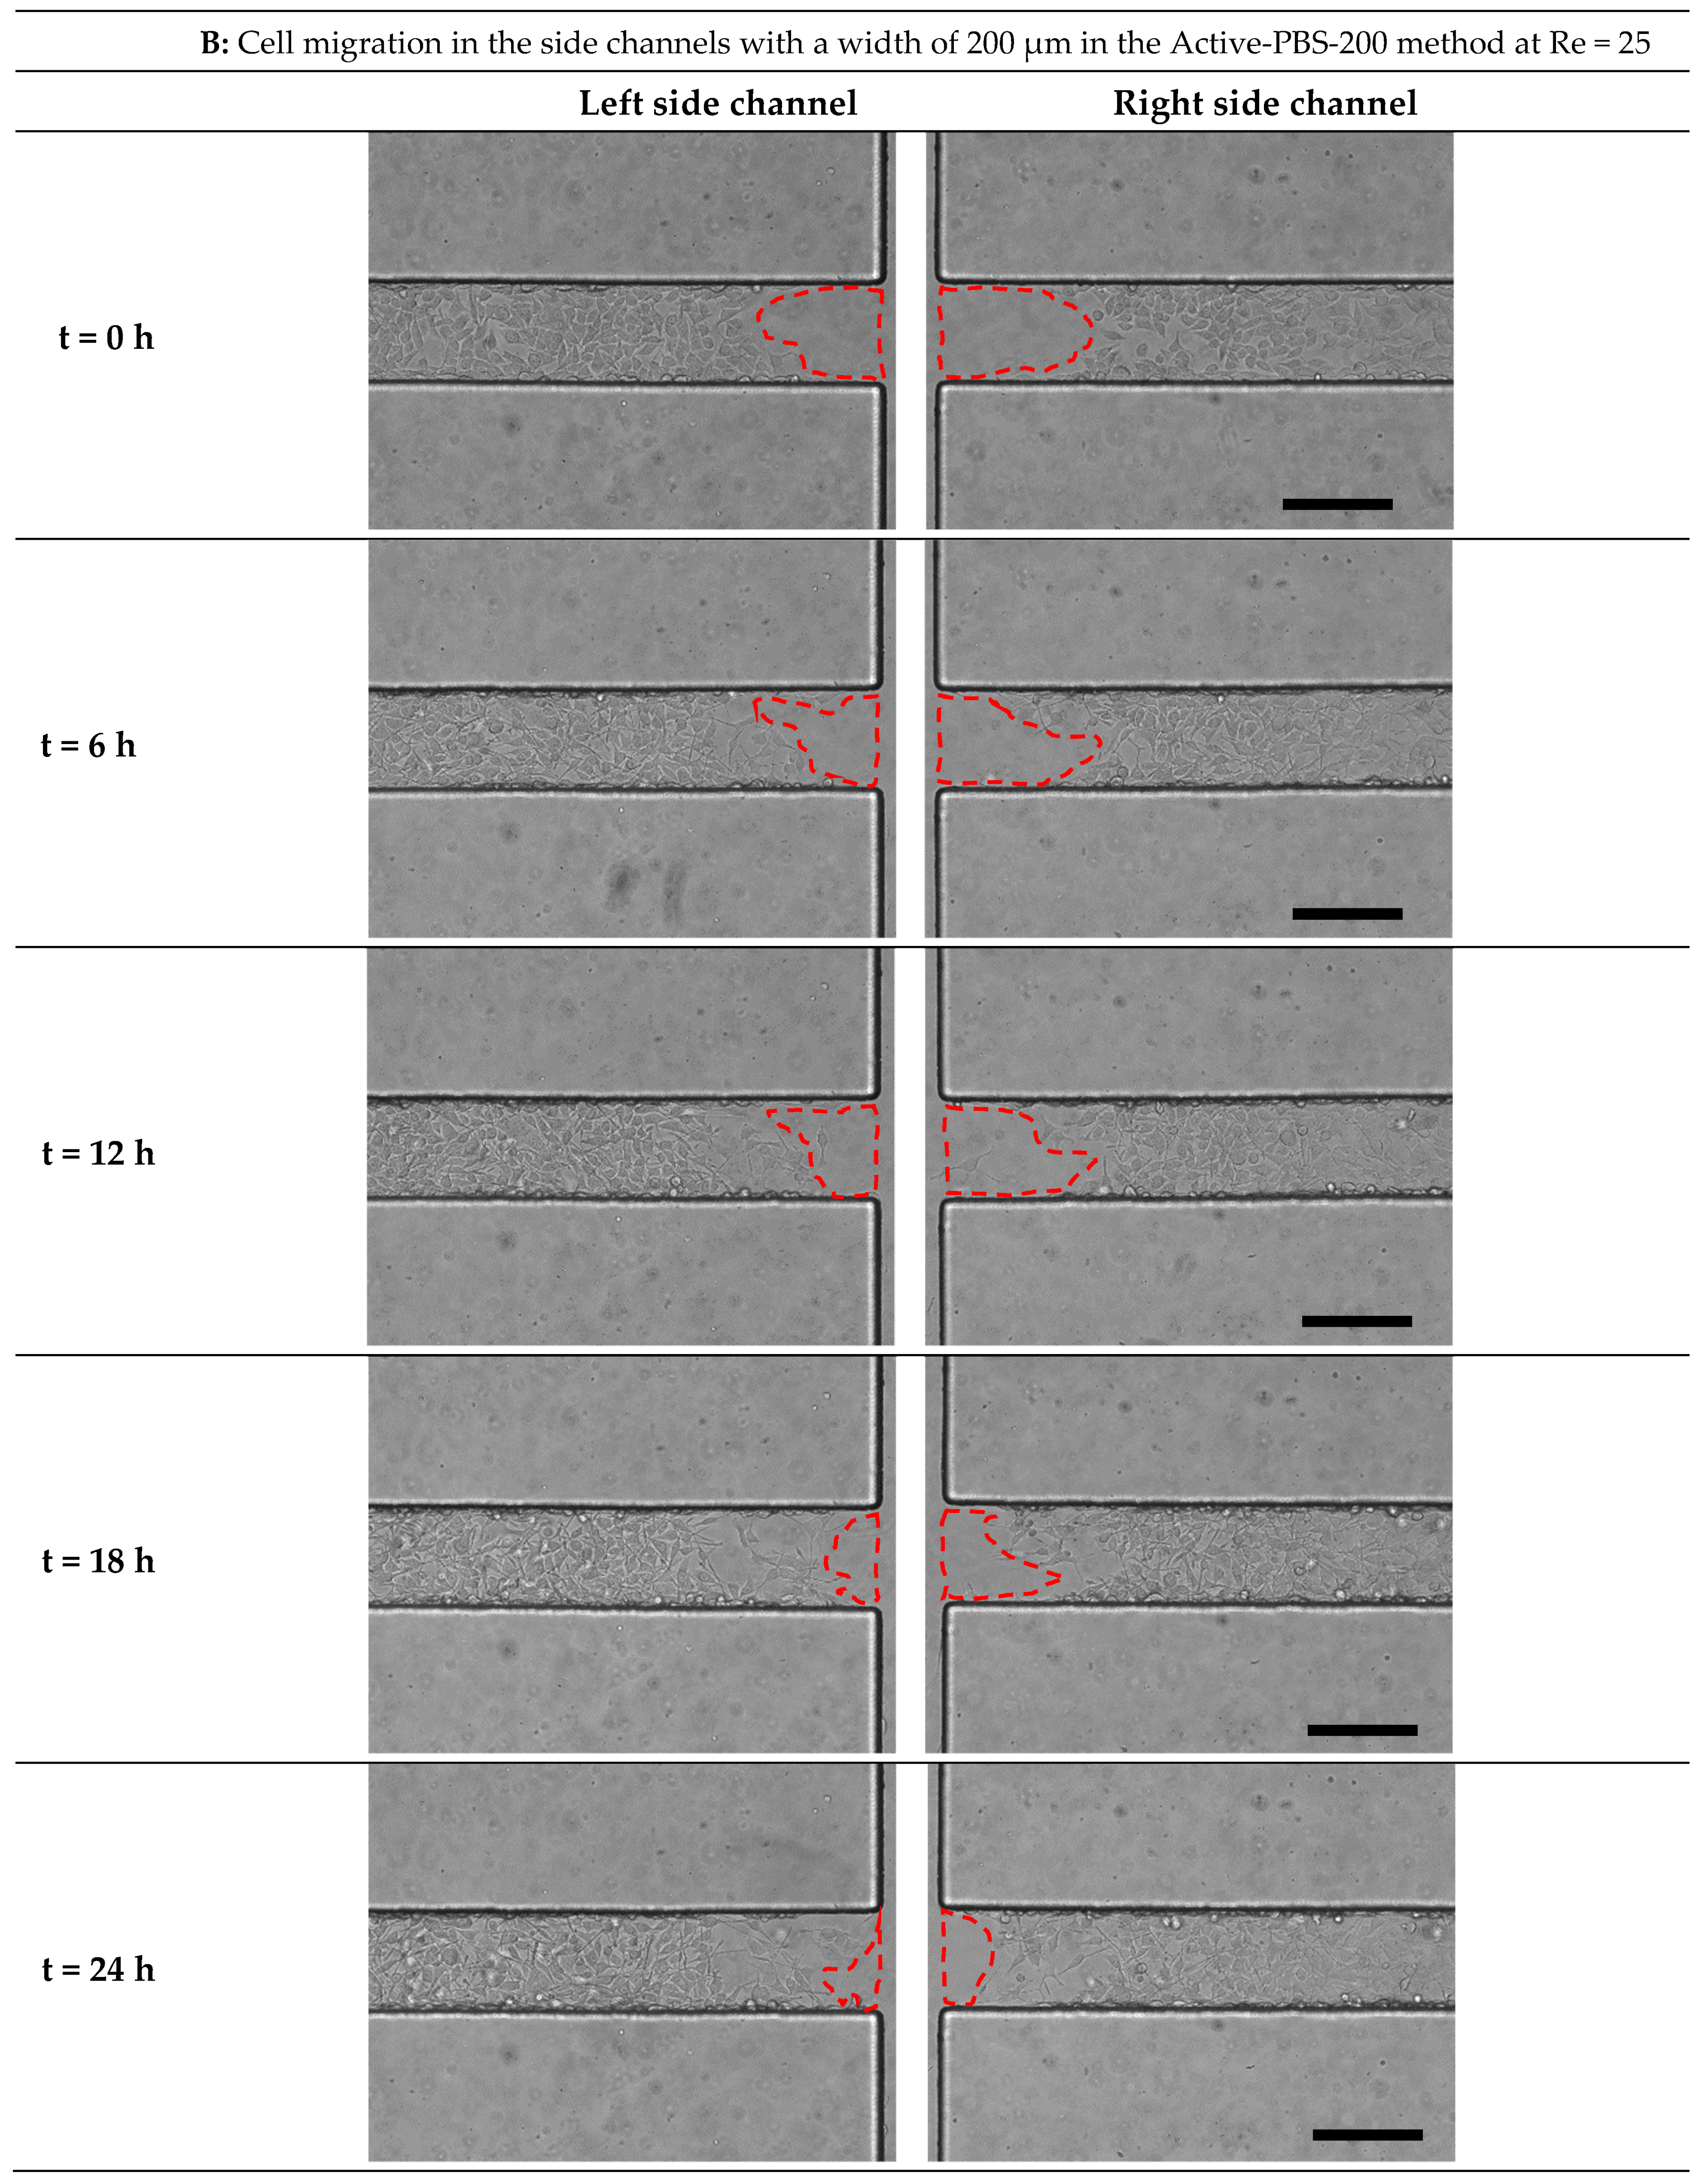
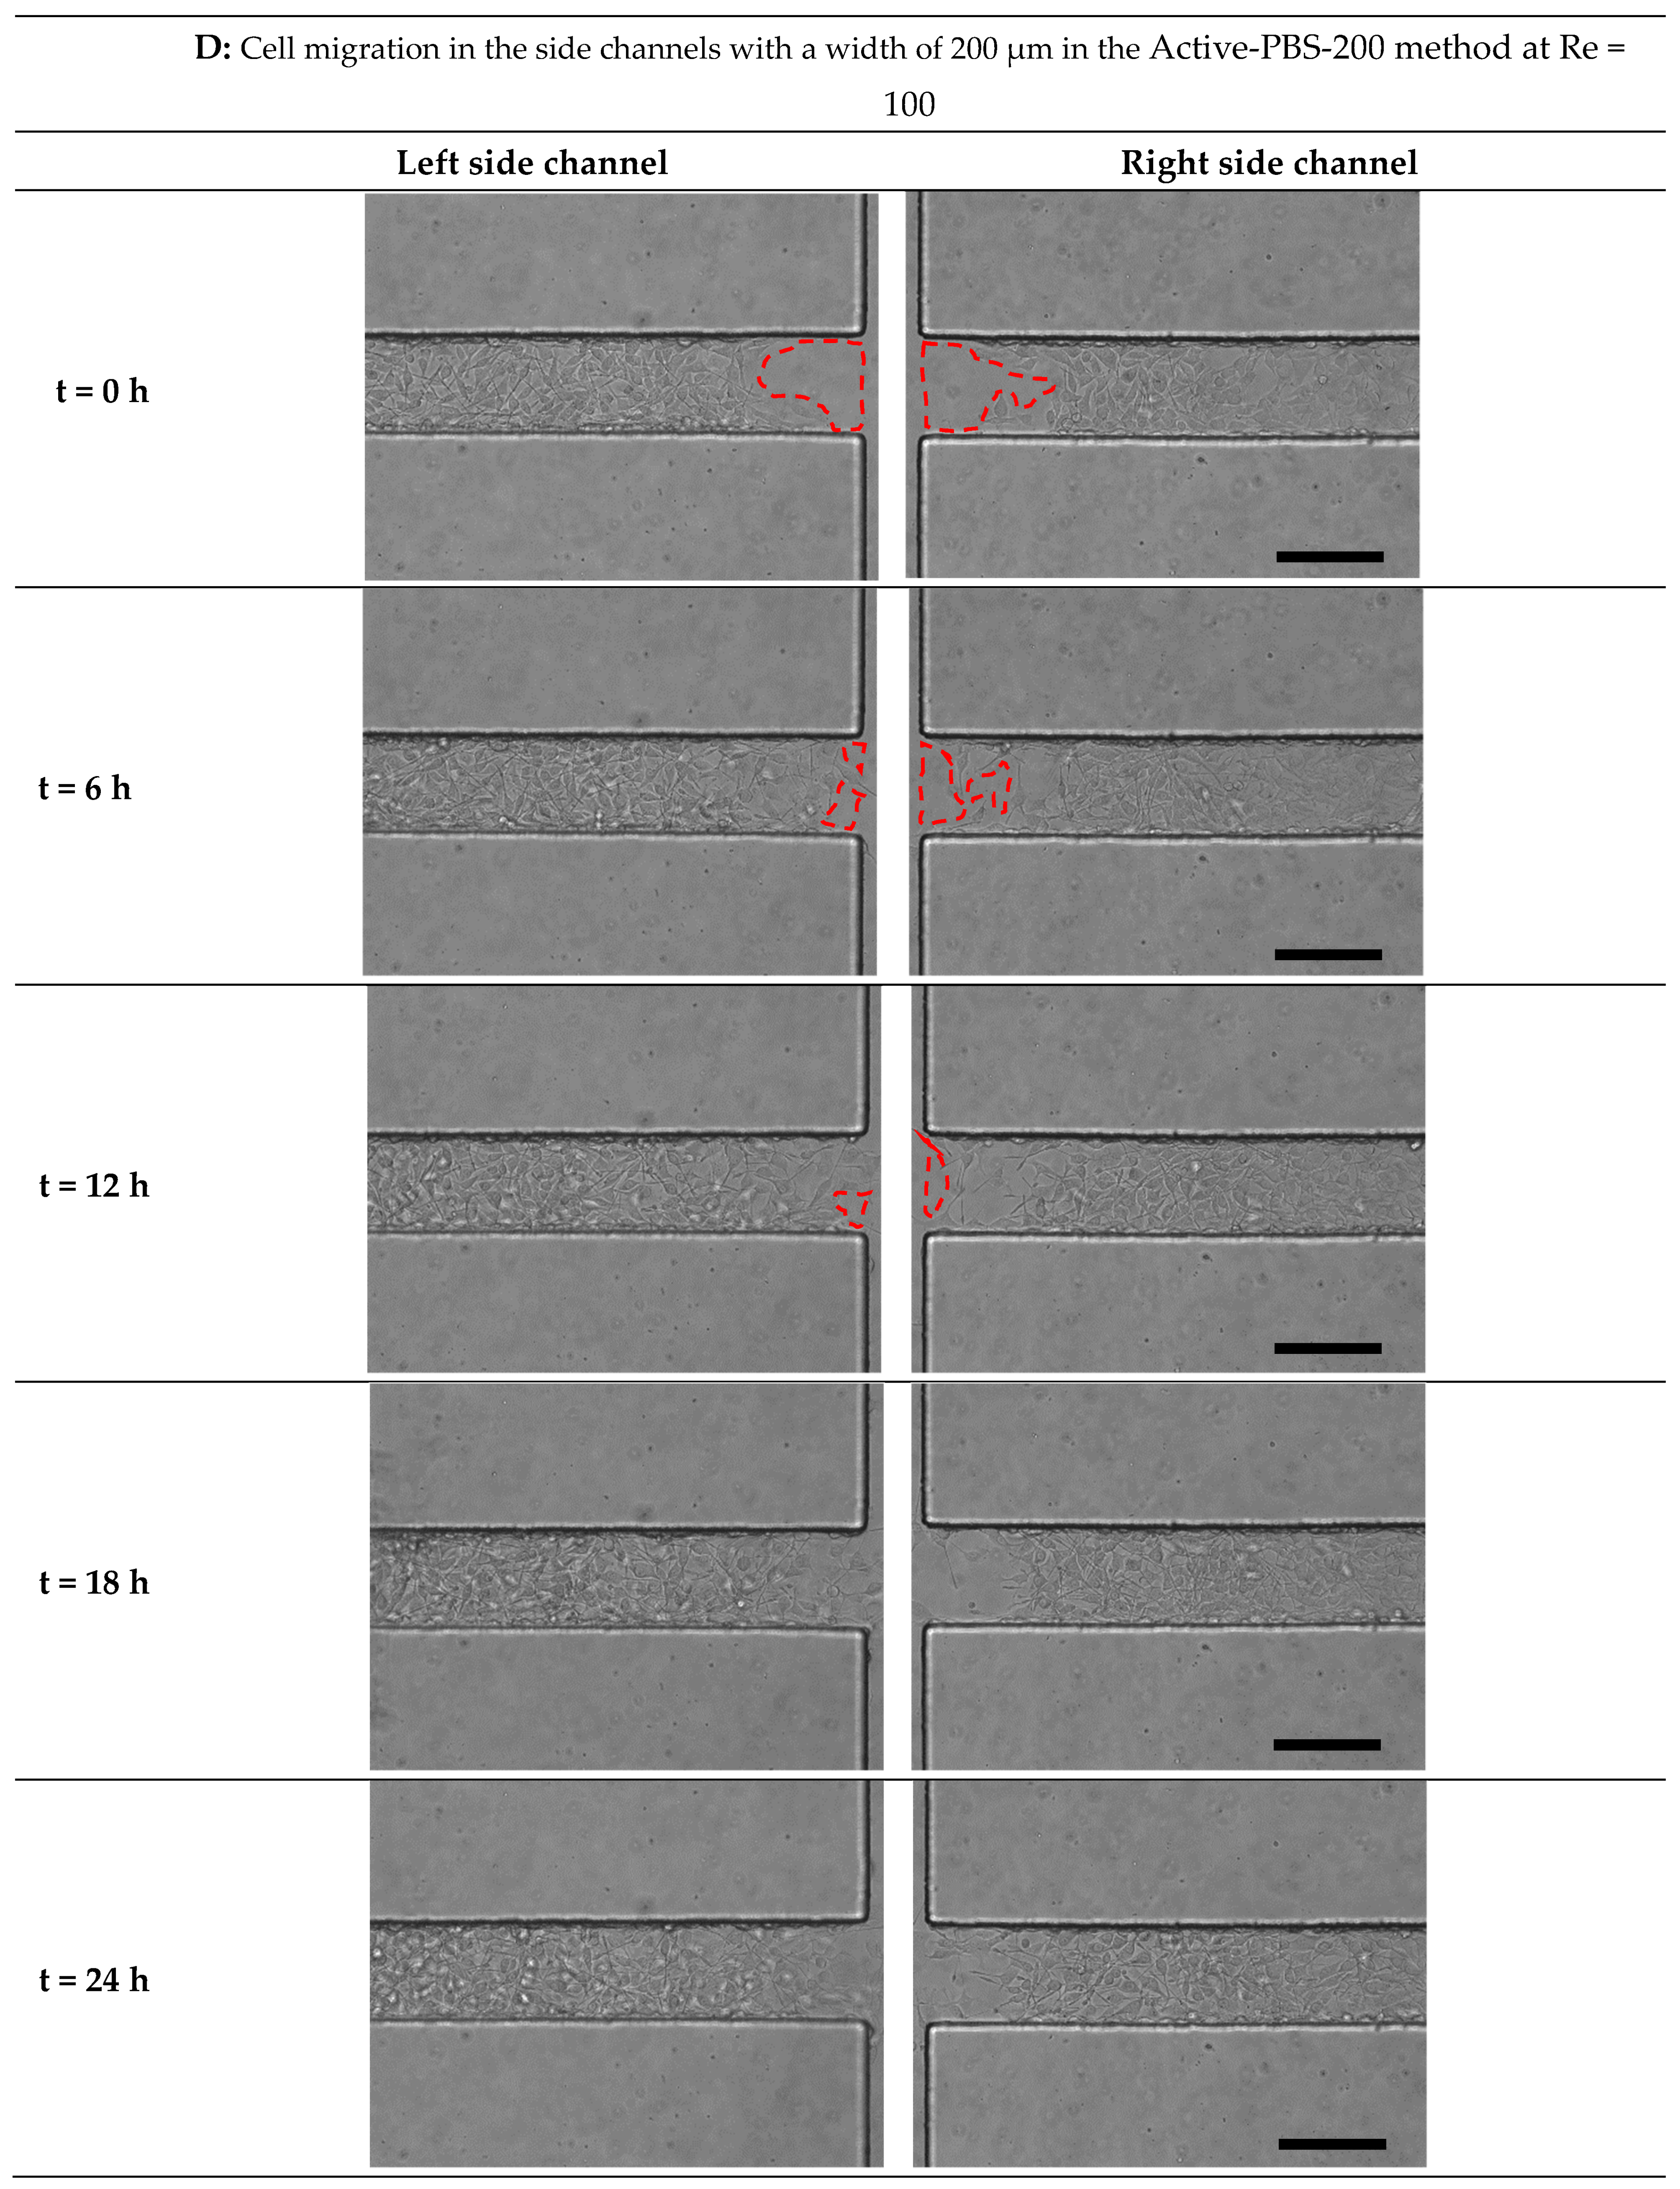
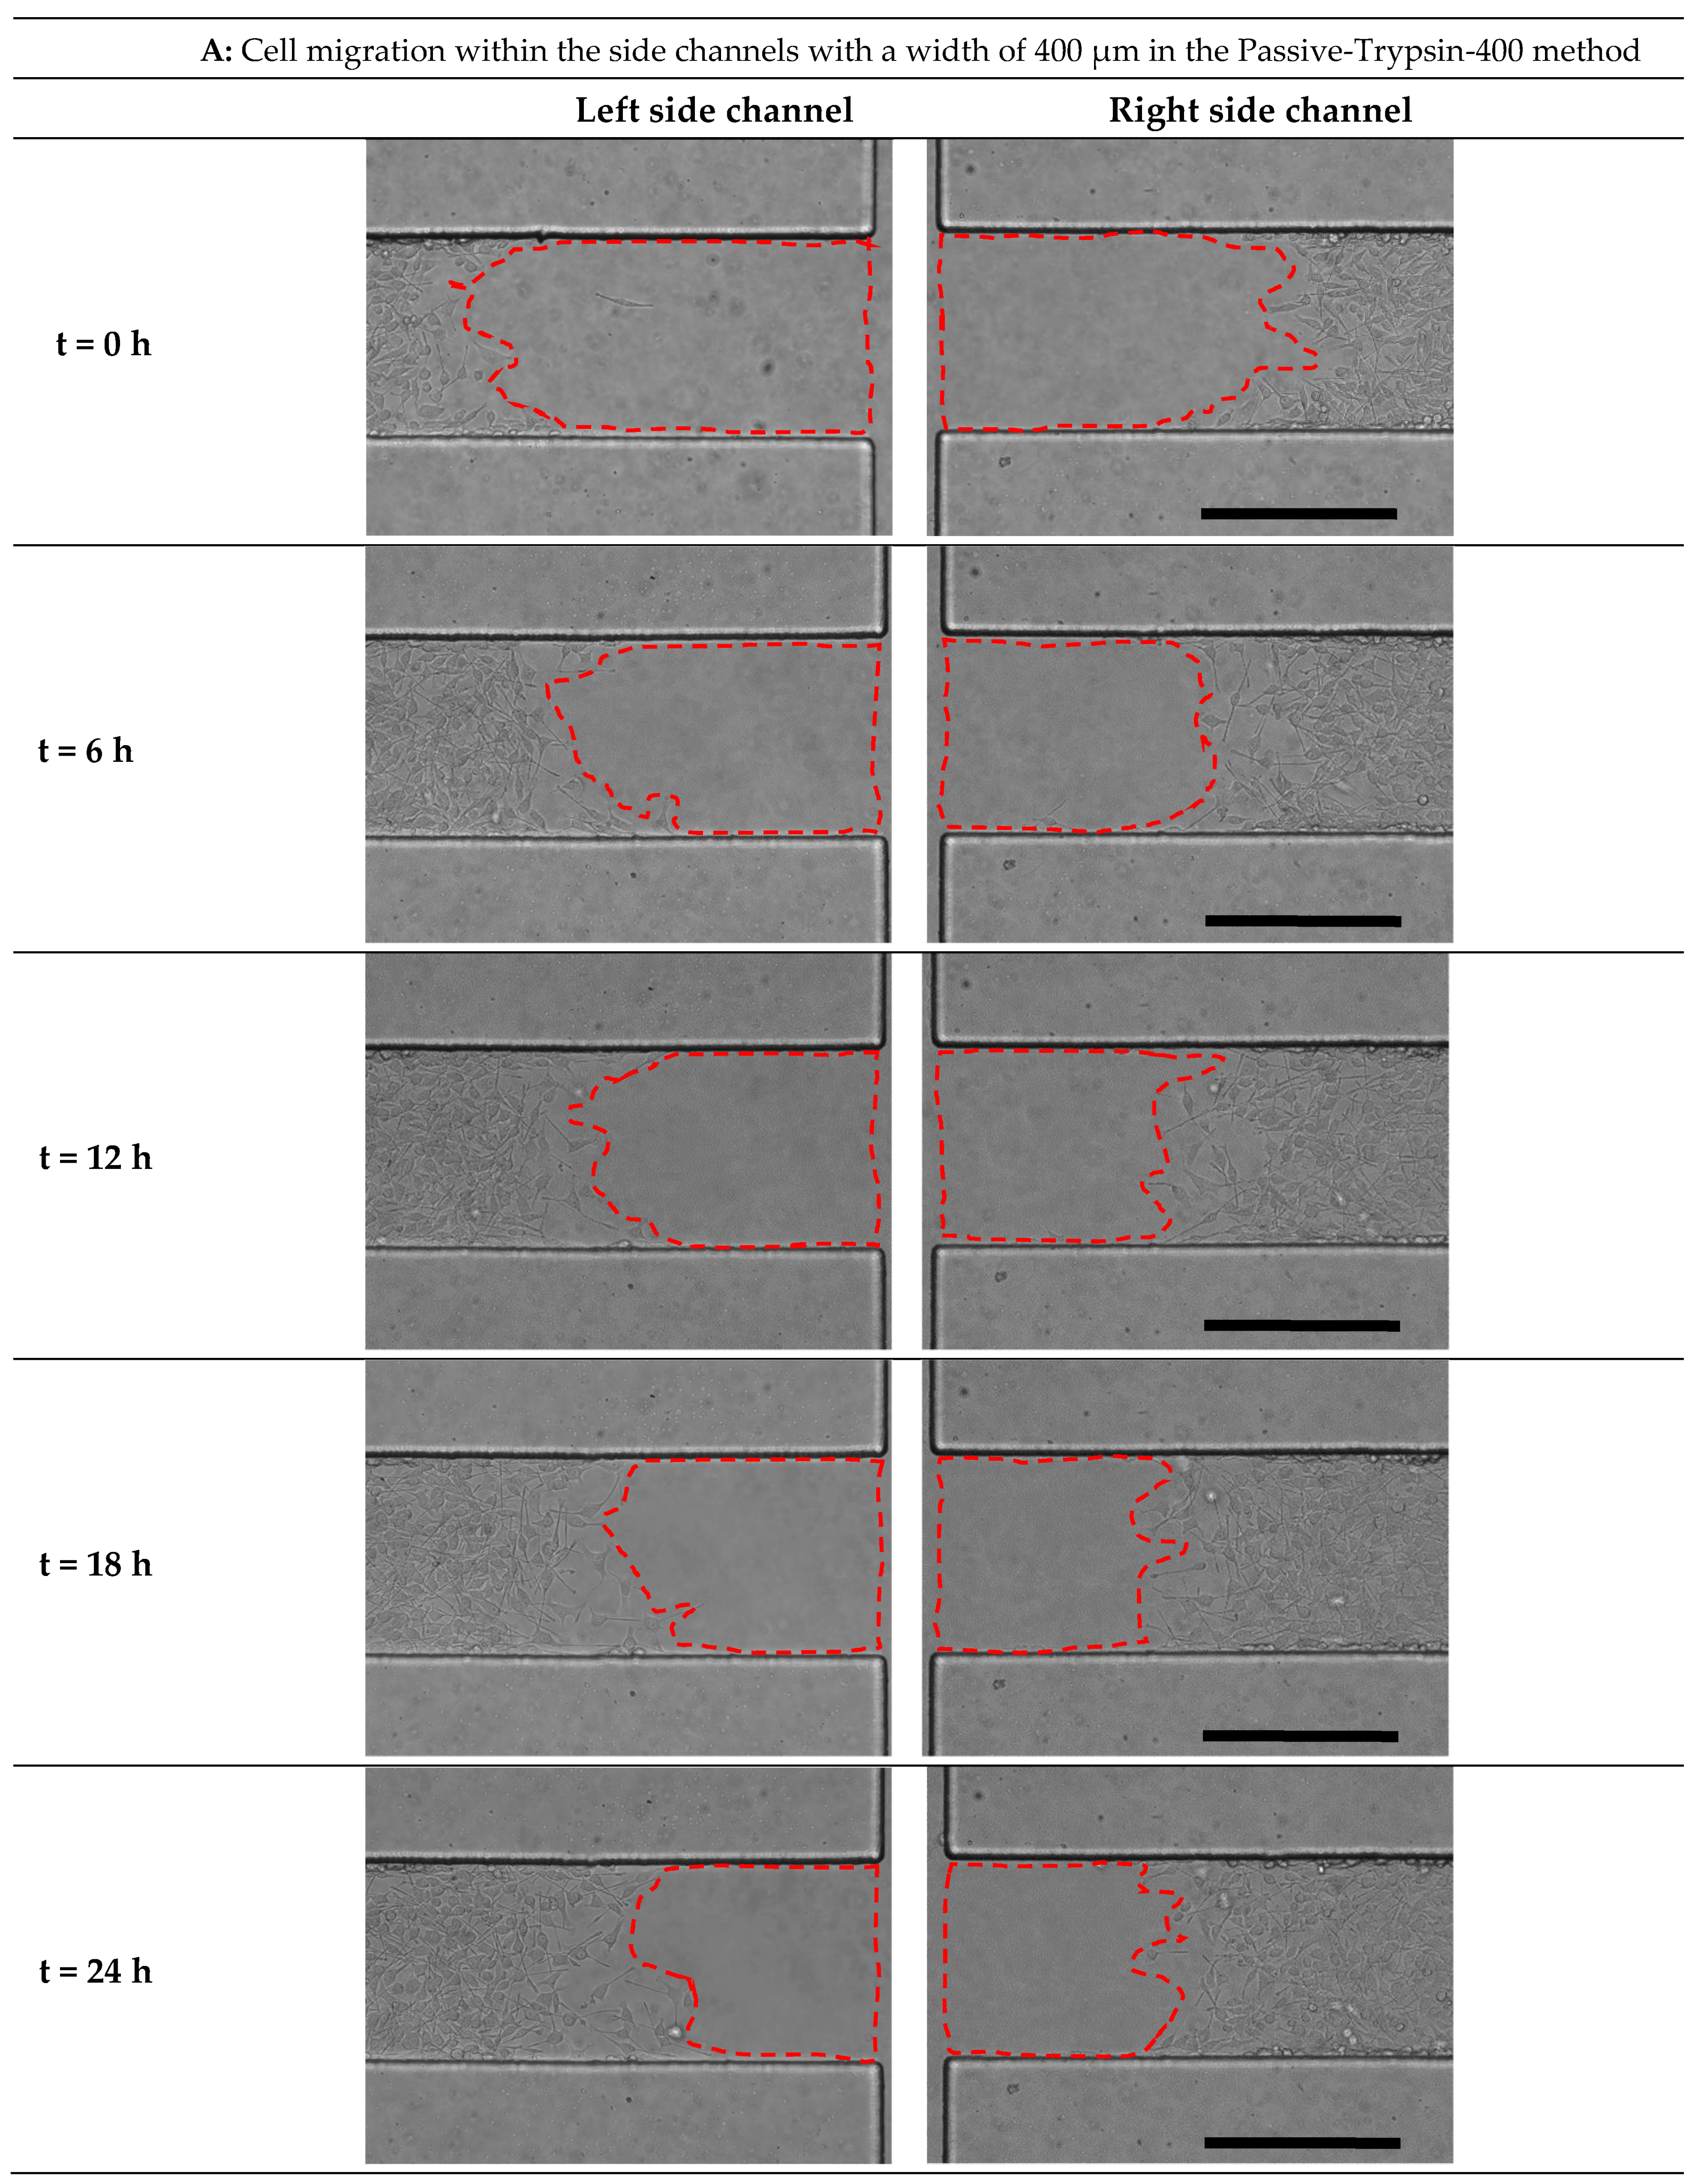
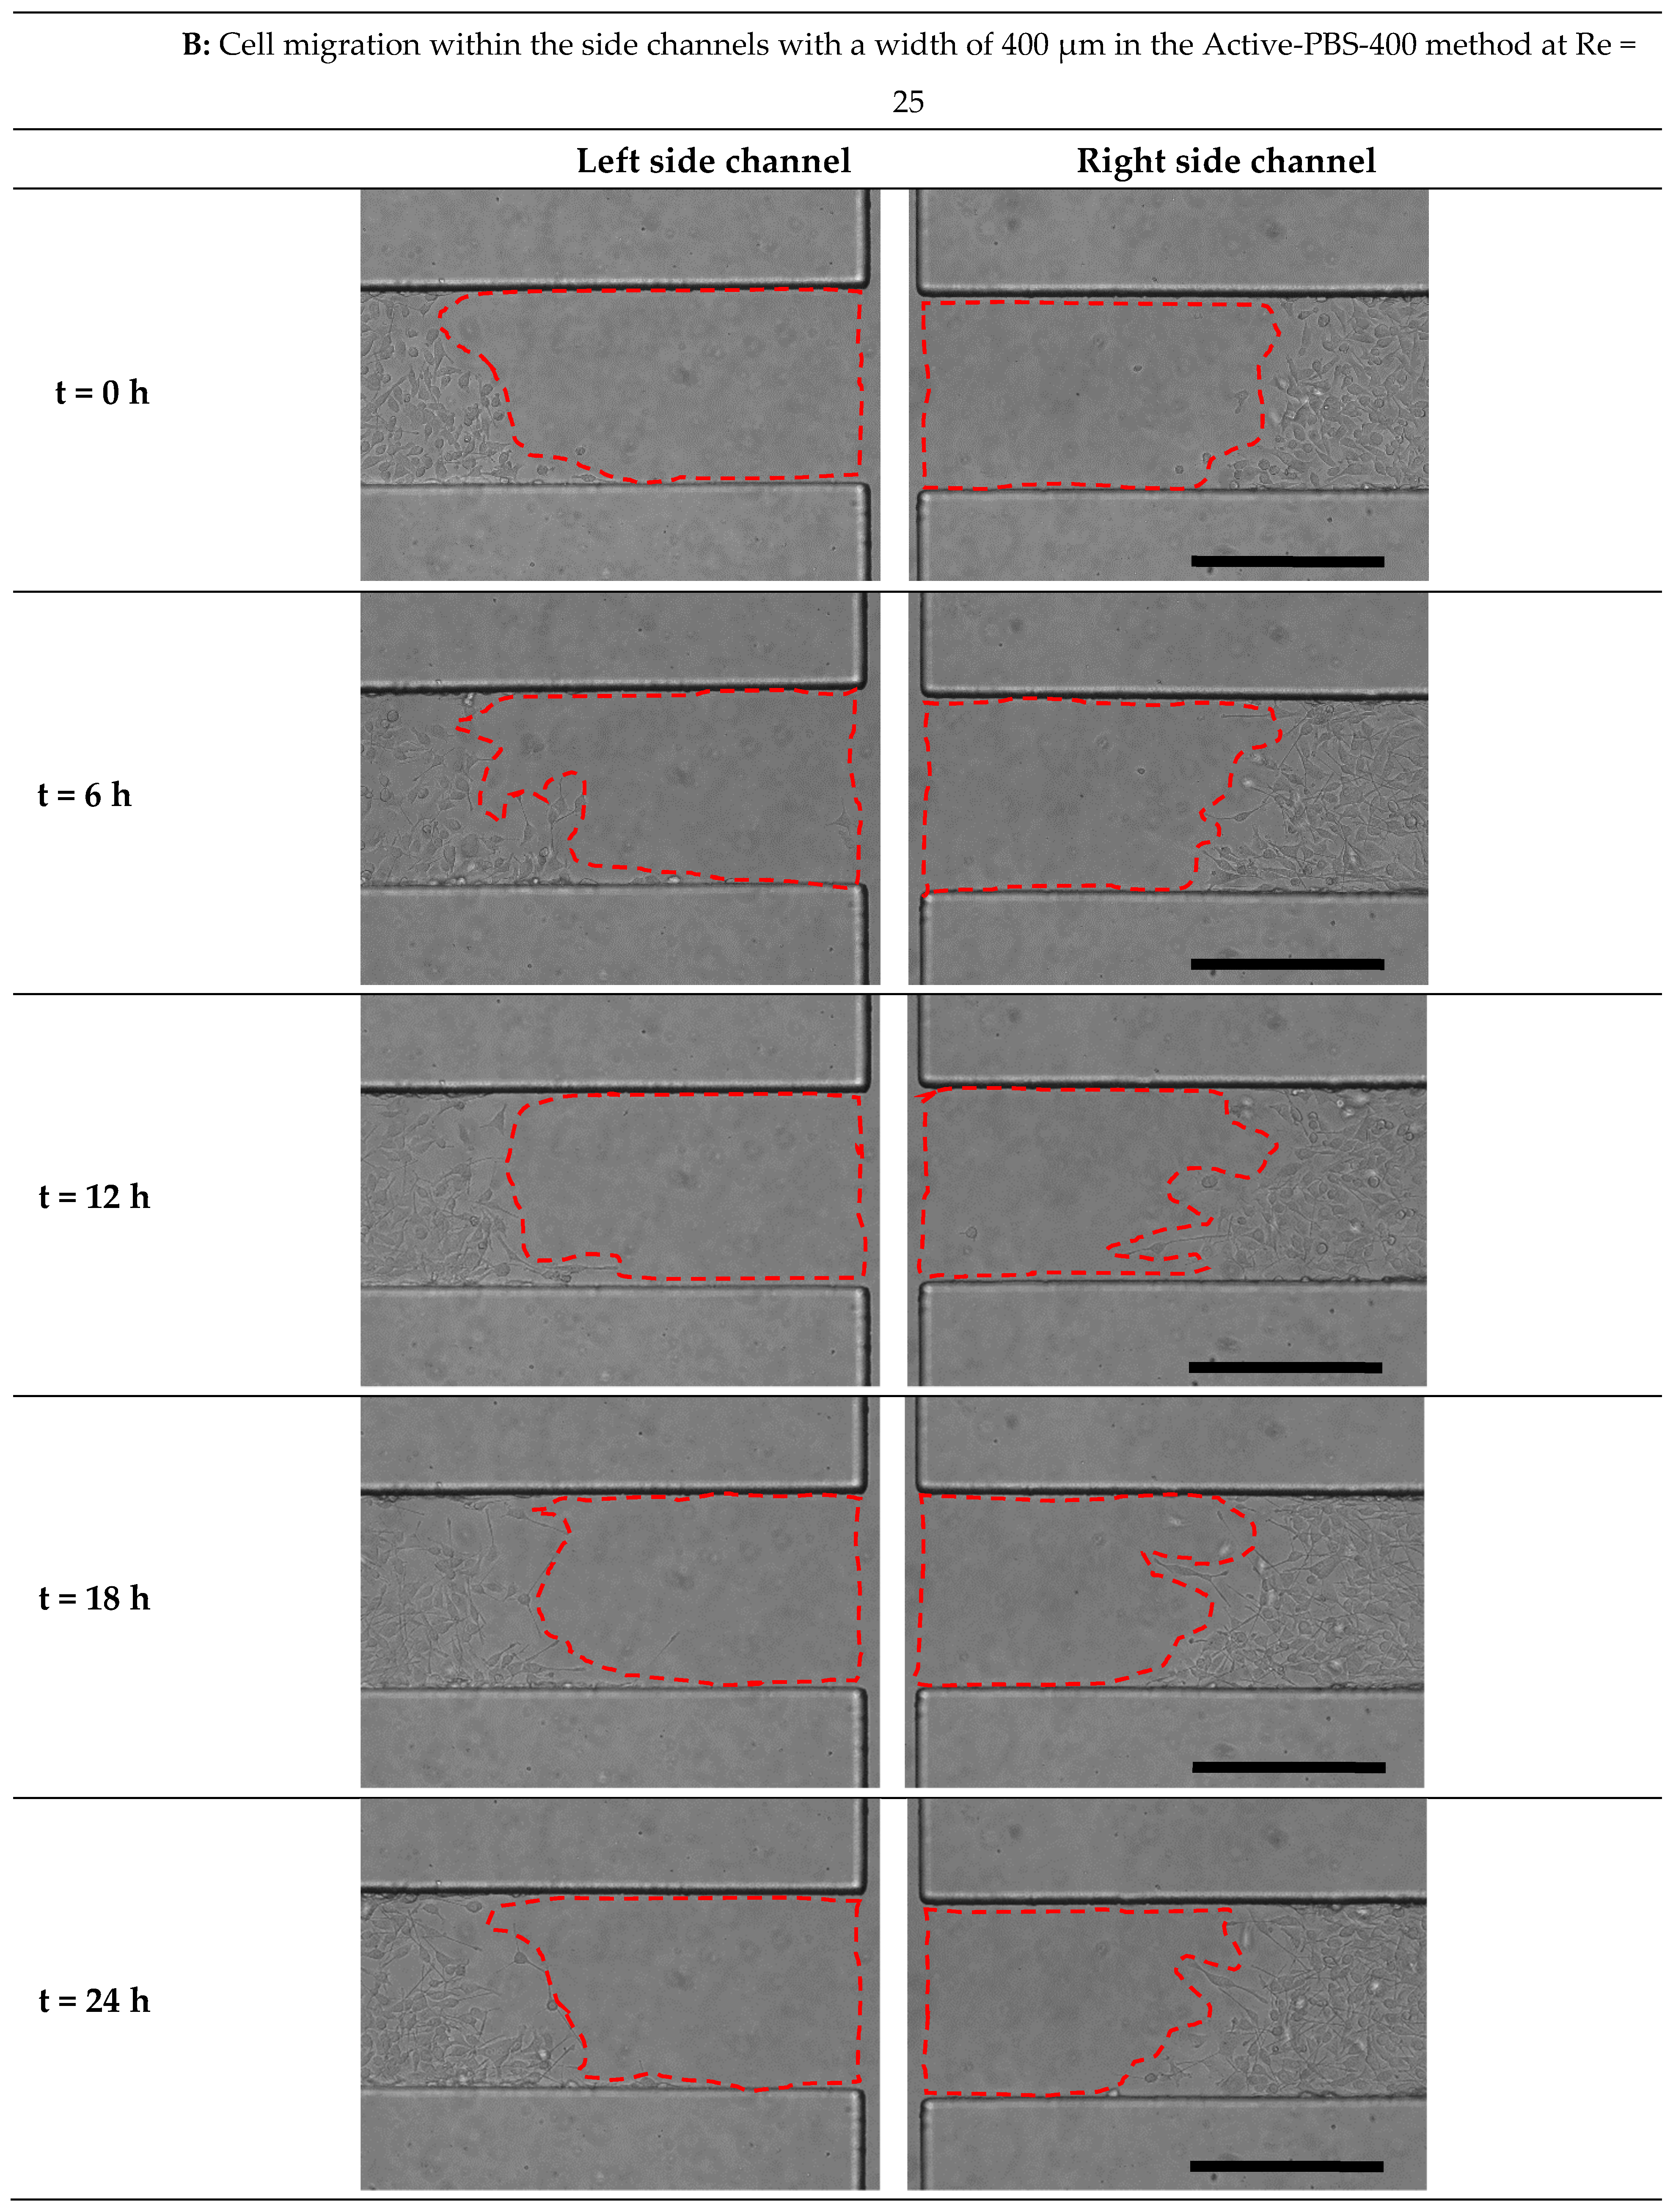
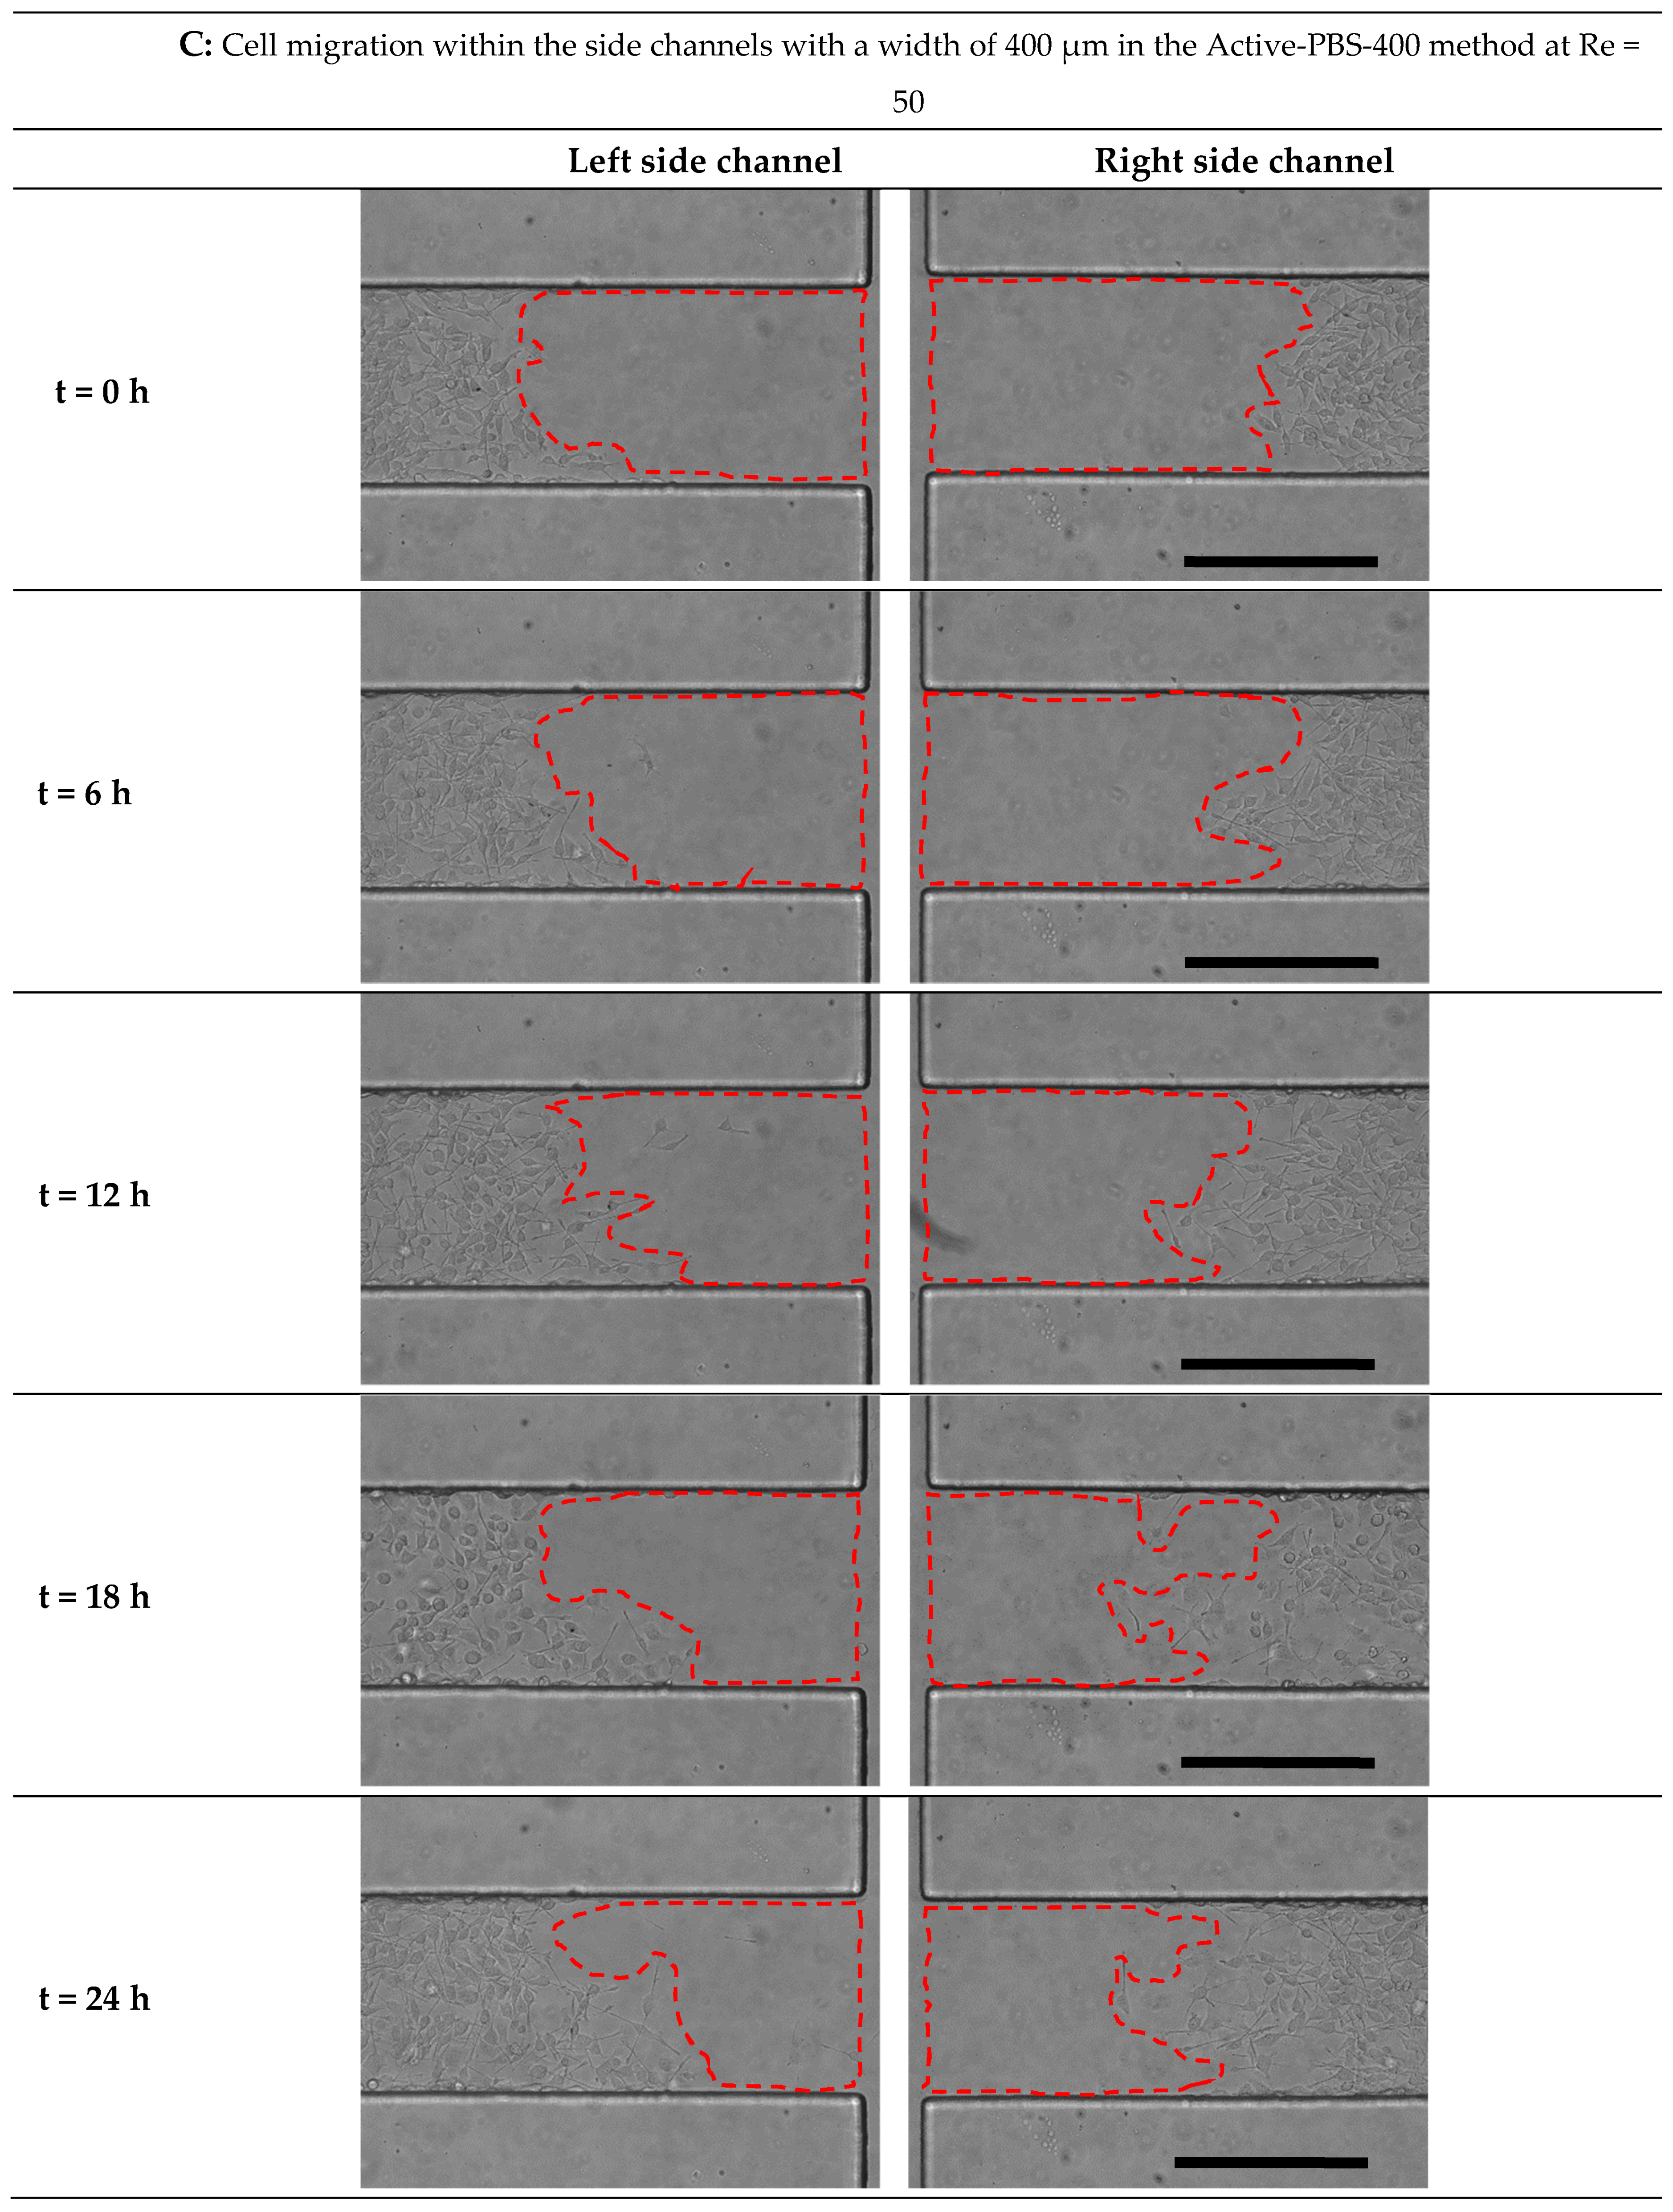
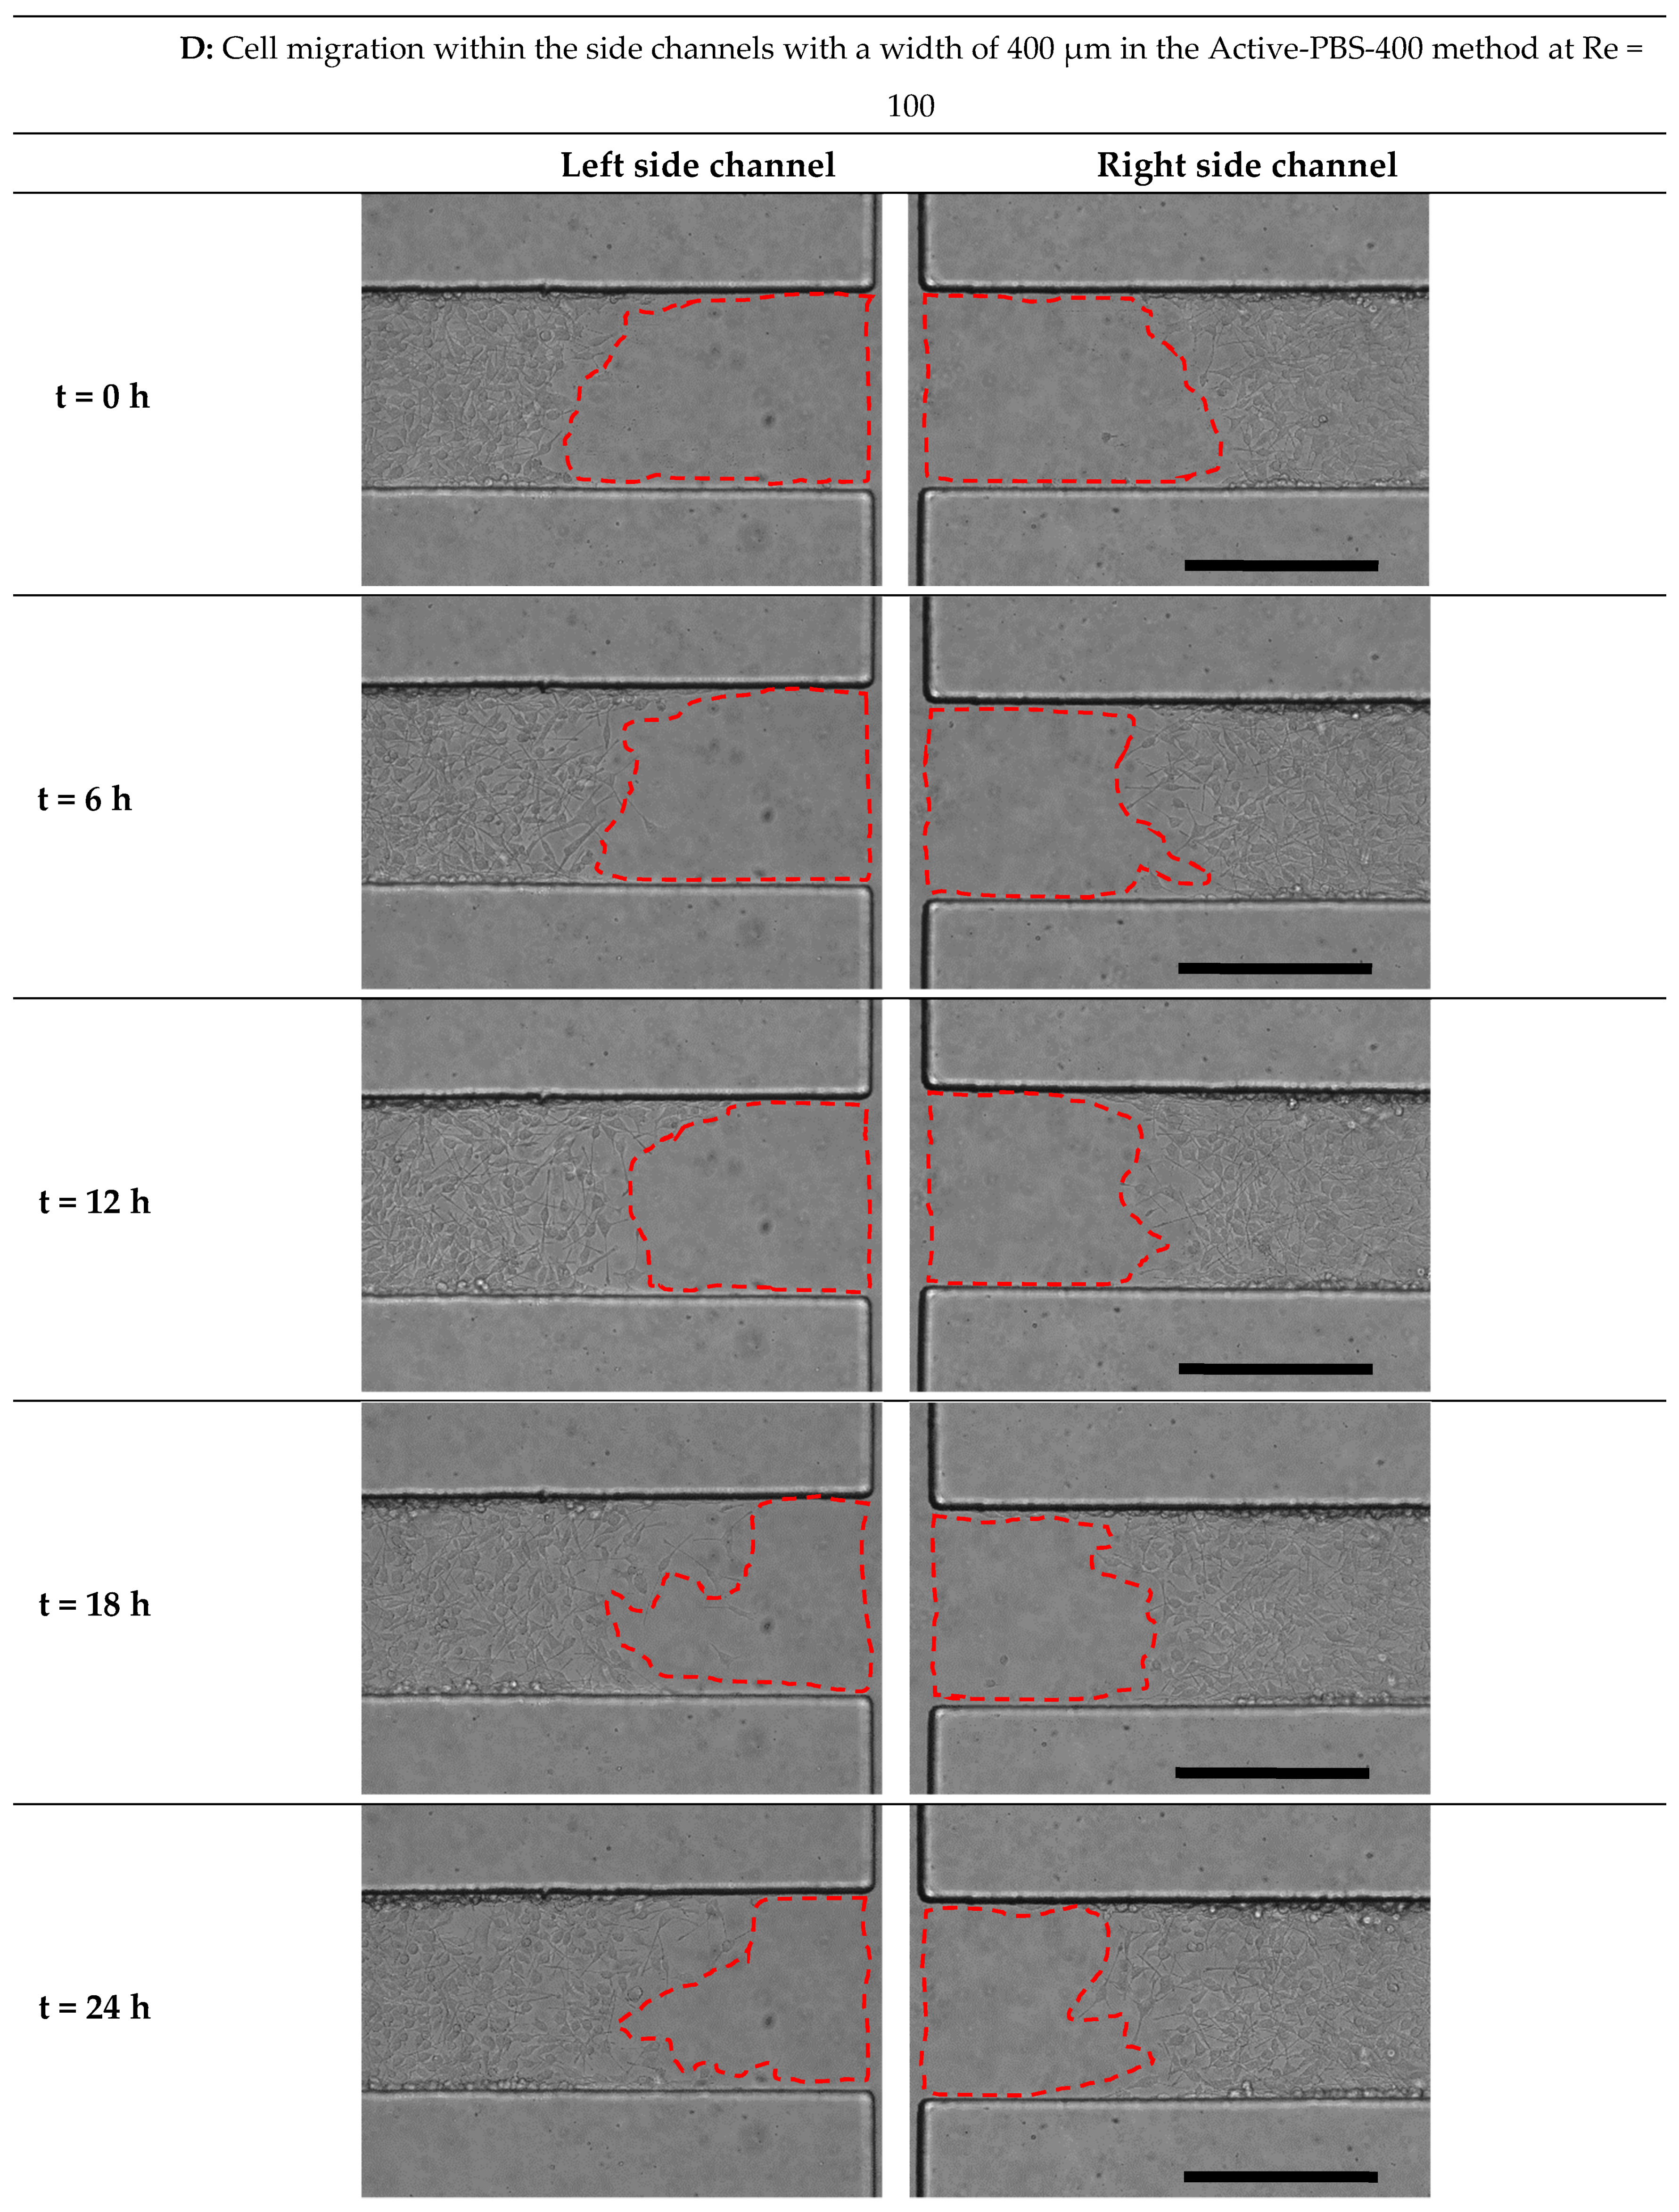
3.6. Effect of Fluid Loading through the Geometry Variation of the Side Channel on Cell Migration
3.7. Comparison of All Methods of Chemical and Mechanical Woundings
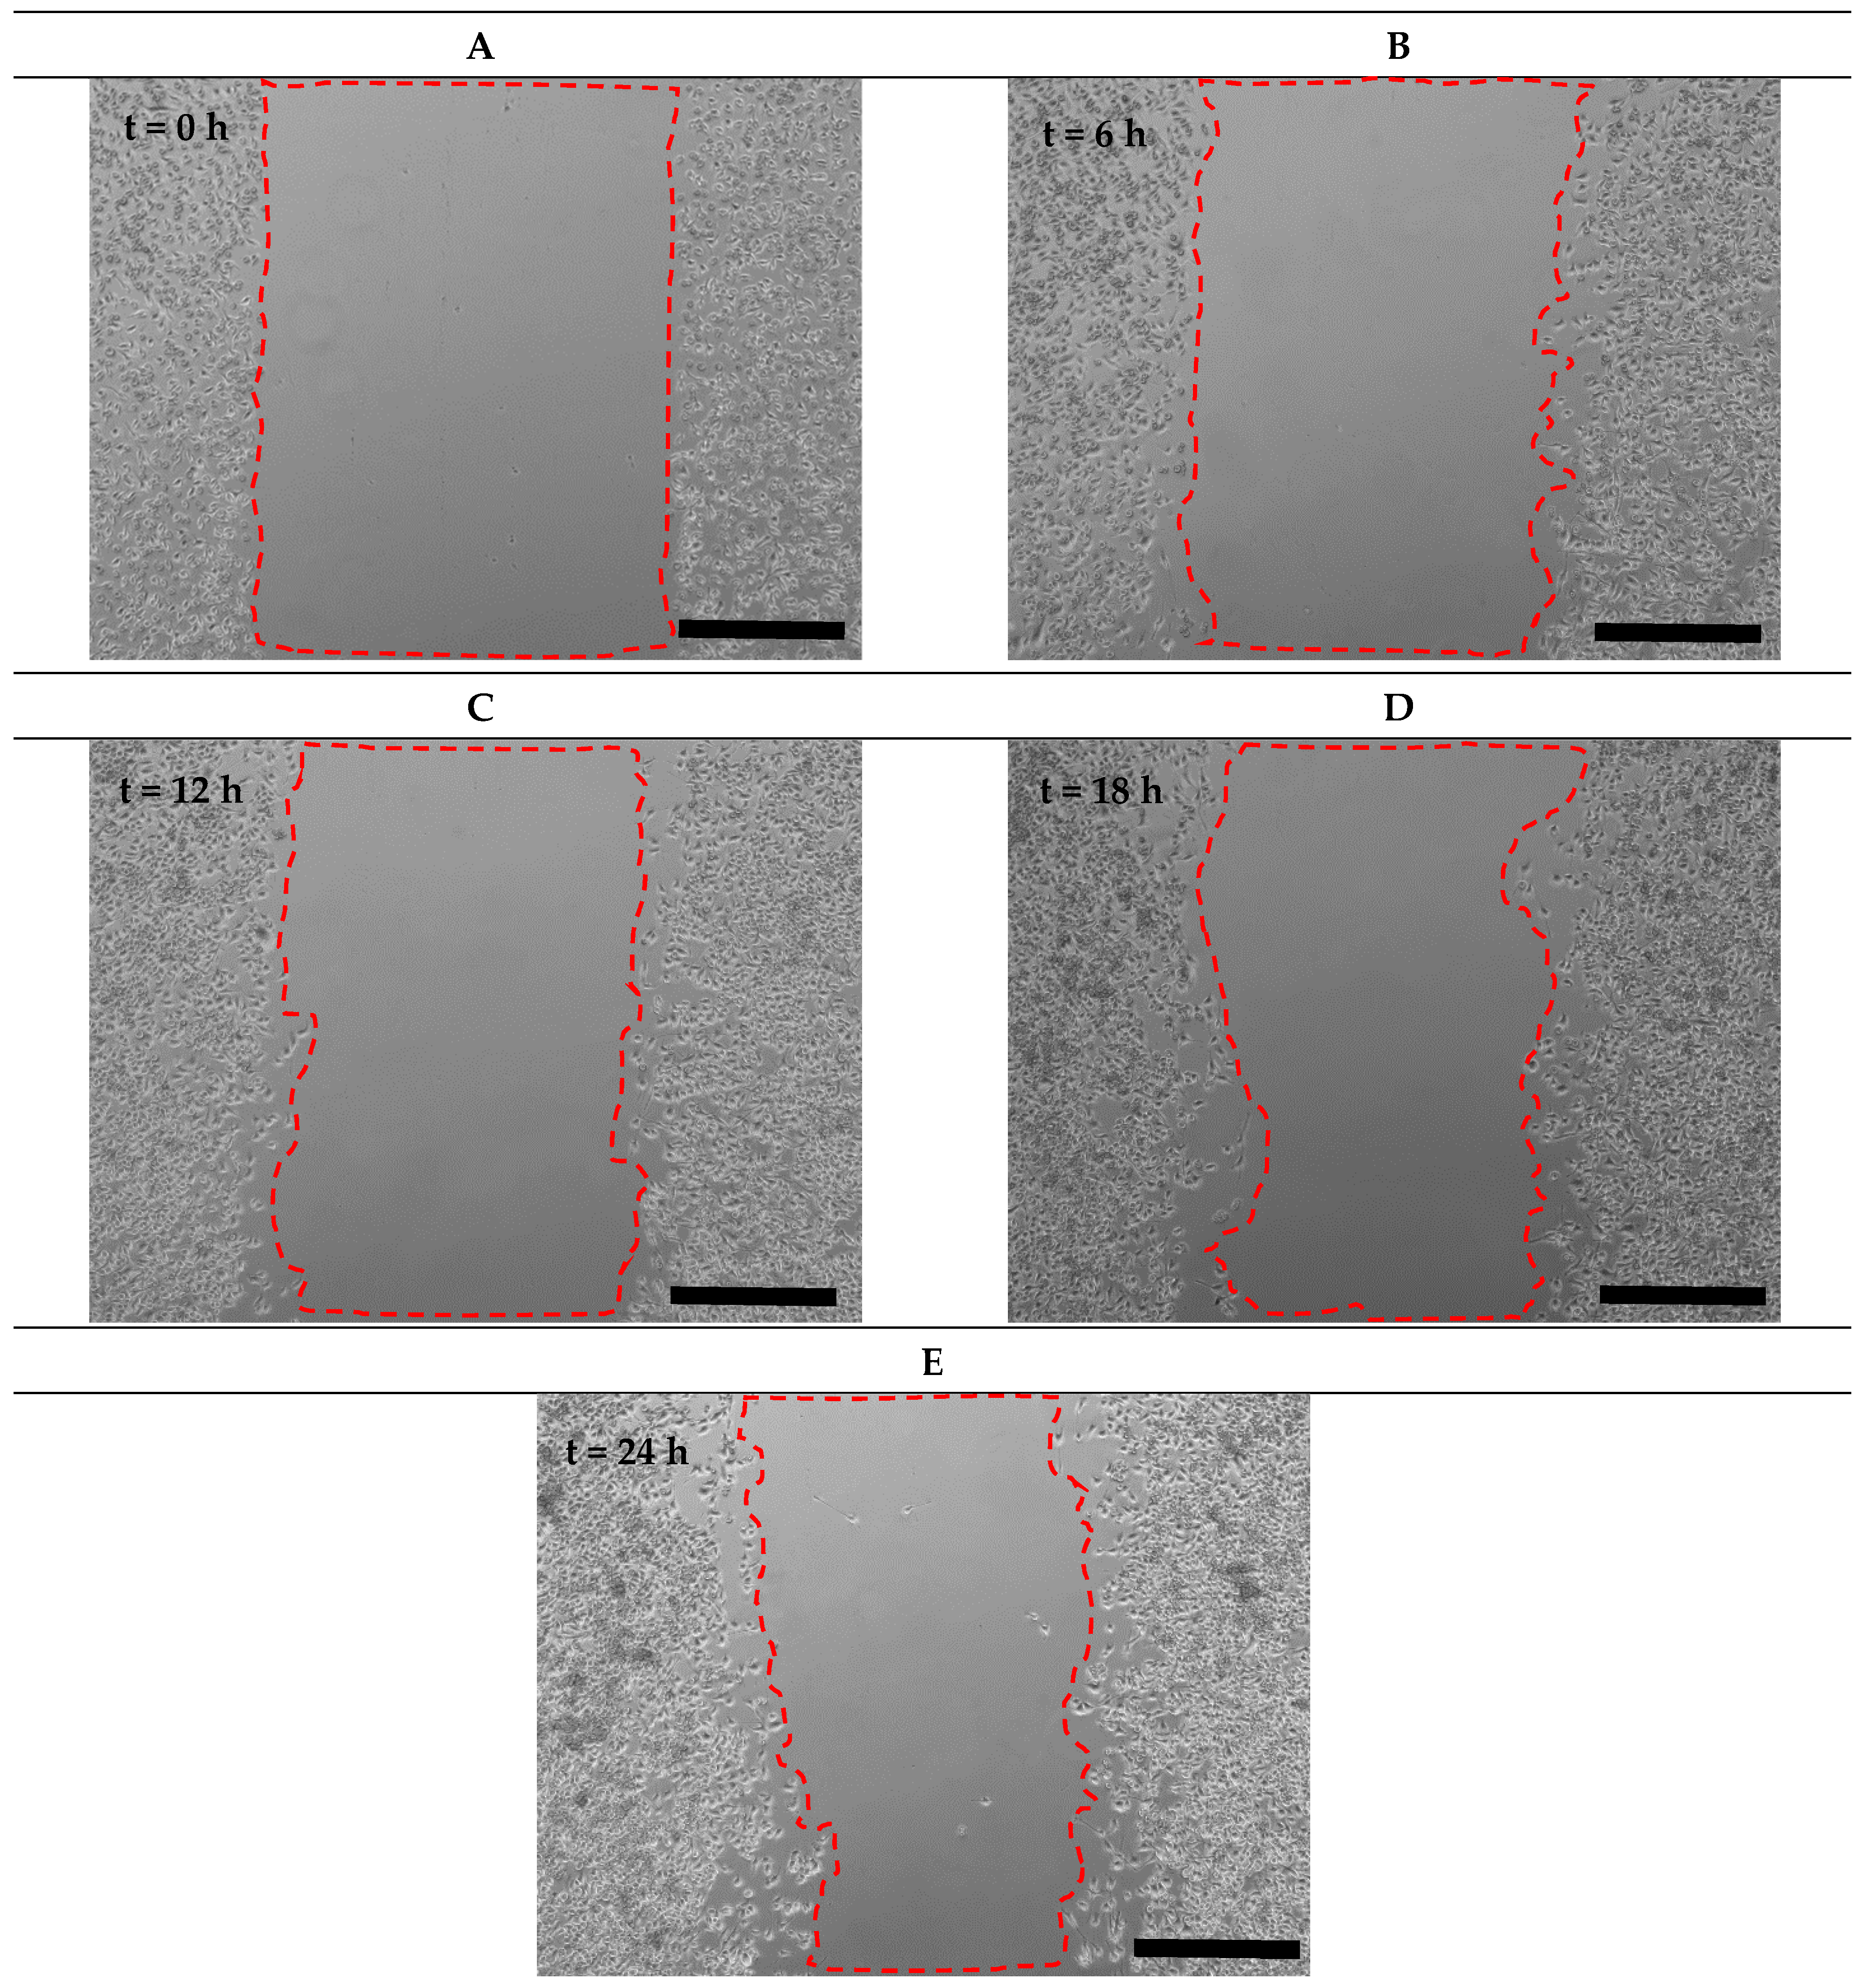
3.8. Comparsion of Cell Migration in Microfluidic and Scratch Assays
4. Conclusions
Supplementary Materials
Author Contributions
Funding
Data Availability Statement
Conflicts of Interest
References
- Galloway, D.A.; Phillips, A.E.M.; Owen, D.R.J.; Moore, C.S. Phagocytosis in the brain: Homeostasis and disease. Front. Immunol. 2019, 10, 1–15. [Google Scholar]
- Lenz, K.M.; Nelson, L.H. Microglia and beyond: Innate immune cells as regulators of brain development and behavioral function. Front. Immunol. 2018, 9, 698. [Google Scholar] [CrossRef]
- Parkhurst, C.N.; Gan, W.B. Microglia dynamics and function in the CNS. Curr. Opin. Neurobiol. 2010, 20, 595–600. [Google Scholar] [CrossRef] [PubMed]
- Kotecha, S.A.; Schlichter, L.C. A Kv1.5 to Kv1.3 switch in endogenous hippocampal microglia and a role in proliferation. J. Neurosci. 1999, 19, 10680–10693. [Google Scholar] [CrossRef] [PubMed]
- Wake, H.; Moorhouse, A.J.; Nabekura, J. Functions of microglia in the central nervous system--beyond the immune response. Neuron Glia Biol. 2011, 7, 47–53. [Google Scholar] [CrossRef] [PubMed]
- Von Bernhardi, R. Glial Cells in Health and Disease of the CNS; Advances in Experimental Medicine and Biology; Springer: Cham, Switzerland, 2016; Volume 949, pp. 1–348. [Google Scholar]
- Perea, J.R.; Llorens-Martín, M.; Ávila, J.; Bolós, M. The role of microglia in the spread of Tau: Relevance for tauopathies. Front. Cell. Neurosci. 2018, 12, 172. [Google Scholar] [CrossRef] [PubMed]
- Chen, Y.; Colonna, M. Two-faced behavior of microglia in Alzheimer’s disease. Nat. Neurosci. 2022, 25, 3–4. [Google Scholar] [CrossRef]
- Roesch, S.; Rapp, C.; Dettling, S.; Herold-Mende, C. When immune cells turn bad—Tumor-associated microglia/macrophages in glioma. Int. J. Mol. Sci. 2018, 19, 436. [Google Scholar] [CrossRef] [PubMed]
- Deal, H.E.; Brown, A.C.; Daniele, M.A. Microphysiological systems for the modeling of wound healing and evaluation of pro-healing therapies. J. Mater. Chem. B 2020, 8, 7062–7075. [Google Scholar] [CrossRef]
- Huttenlocher, A.; Sandborg, R.R.; Horwitz, A.F. Synthesis of Graphene by Microwave Surface Wave Plasma Chemical Vapor Deposition. Appl. Phys. Lett. 1995, 66, 449–451. [Google Scholar]
- Giacomello, E.; Neumayer, J.; Colombatti, A.; Perns, R. Centrifugal assay for fluorescence-based cell adhesion adapted to the analysis of ex vivo cells and capable of determining relative binding strengths. Biotechniques 1999, 26, 758–766. [Google Scholar] [CrossRef]
- Channavajjala, L.S.; Eidsath, A.; Saxinger, W.C. A simple method for measurement of cell-substrate attachment forces: Application to HIV-1 Tat. J. Cell Sci. 1997, 110, 249–256. [Google Scholar] [CrossRef] [PubMed]
- Reyes, C.D.; García, A.J. A centrifugation cell adhesion assay for high-throughput screening of biomaterial surfaces. J. Biomed. Mater. Res.-Part A 2003, 67, 328–333. [Google Scholar] [CrossRef] [PubMed]
- Reutelingsperger, C.P.M.; Van Gool, R.G.J.; Heijnen, V.; Frederik, P.; Lindhout, T. The rotating disc as a device to study the adhesive properties of endothelial cells under differential shear stresses. J. Mater. Sci. Mater. Med. 1994, 5, 361–367. [Google Scholar] [CrossRef]
- García, A.J.; Ducheyne, P.; Boettiger, D. Quantification of cell adhesion using a spinning disc device and application to surface-reactive materials. Biomaterials 1997, 18, 1091–1098. [Google Scholar] [CrossRef] [PubMed]
- Michael, K.E.; Dumbauld, D.W.; Burns, K.L.; Hanks, S.K.; García, A.J. Focal adhesion kinase modulates cell adhesion strengthening via integrin activation. Mol. Biol. Cell 2009, 20, 2508–2519. [Google Scholar] [CrossRef] [PubMed]
- Garcia, A.J.; Gallant, N.D. Stick and grip: Measurement systems and quantitative analyses of integrin-mediated cell adhesion strength. Cell Biochem. Biophys. 2003, 39, 61–73. [Google Scholar] [CrossRef] [PubMed]
- Khalili, A.A.; Ahmad, M.R. A Review of cell adhesion studies for biomedical and biological applications. Int. J. Mol. Sci. 2015, 16, 18149–18184. [Google Scholar] [CrossRef] [PubMed]
- Tang, Z.; Akiyama, Y.; Itoga, K.; Kobayashi, J.; Yamato, M.; Okano, T. Shear stress-dependent cell detachment from temperature-responsive cell culture surfaces in a microfluidic device. Biomaterials 2012, 33, 7405–7411. [Google Scholar] [CrossRef]
- Yan, J.; Zhou, X.; Guo, J.; Mao, L.; Wang, Y.; Sun, J.; Sun, L.; Zhang, L.; Zhou, X.; Liao, H. Nogo-66 inhibits adhesion and migration of microglia via GTPase Rho pathway in vitro. J. Neurochem. 2012, 120, 721–731. [Google Scholar] [CrossRef]
- Wang, L.; Jiang, Q.; Chu, J.; Lin, L.; Li, X.-G.; Chai, G.-S.; Wang, Q.; Wang, J.-Z.; Tian, Q. Expression of Tau40 Induces Activation of Cultured Rat Microglial Cells. PLoS ONE 2013, 8, e76057. [Google Scholar] [CrossRef] [PubMed]
- Yang, Z.; Zhao, T.; Zou, Y.; Zhang, J.H.; Feng, H. Curcumin inhibits microglia inflammation and confers neuroprotection in intracerebral hemorrhage. Immunol. Lett. 2014, 160, 89–95. [Google Scholar] [CrossRef]
- Caponegro, M.D.; Torres, L.F.; Rastegar, C.; Rath, N.; Anderson, M.E.; Robinson, J.K.; Tsirka, S.E. Pifithrin-μ modulates microglial activation and promotes histological recovery following spinal cord injury. CNS Neurosci. Ther. 2019, 25, 200–214. [Google Scholar] [CrossRef]
- Wang, L.; Yin, C.; Xu, X.; Liu, T.; Wang, B.; Abdul, M.; Zhou, Y.; Cao, J.; Lu, C. Pellino1 Contributes to Morphine Tolerance by Microglia Activation via MAPK Signaling in the Spinal Cord of Mice. Cell. Mol. Neurobiol. 2020, 40, 1117–1131. [Google Scholar] [CrossRef] [PubMed]
- Gov, N.S. Collective cell migration patterns: Follow the leader. Proc. Natl. Acad. Sci. USA 2007, 104, 15970–15971. [Google Scholar] [CrossRef] [PubMed]
- Nikolić, D.L.; Boettiger, A.N.; Bar-Sagi, D.; Carbeck, J.D.; Shvartsman, S.Y. Role of boundary conditions in an experimental model of epithelial wound healing. Am. J. Physiol.-Cell Physiol. 2006, 291, 68–75. [Google Scholar] [CrossRef]
- Kroening, S.; Goppelt-Struebe, M. Analysis of matrix-dependent cell migration with a barrier migration assay. Sci. Signal. 2010, 3, 1–11. [Google Scholar] [CrossRef] [PubMed]
- Jonkman, J.E.; Cathcart, J.A.; Xu, F.; Bartolini, M.E.; Amon, J.E.; Stevens, K.M.; Colarusso, P. An introduction to the wound healing assay using livecell microscopy An introduction to the wound healing assay using livecell microscopy. Cell Adhes. Migr. 2014, 8, 440–451. [Google Scholar] [CrossRef]
- Lin, J.Y.; Lo, K.Y.; Sun, Y.S. Effects of substrate-coating materials on the wound-healing process. Materials 2019, 12, 2775. [Google Scholar] [CrossRef]
- Ungai-Salánki, R.; Peter, B.; Gerecsei, T.; Orgovan, N.; Horvath, R.; Szabó, B. A practical review on the measurement tools for cellular adhesion force. Adv. Colloid Interface Sci. 2019, 269, 309–333. [Google Scholar] [CrossRef]
- Ren, J.; Wang, N.; Guo, P.; Fan, Y.; Lin, F.; Wu, J. Recent advances in microfluidics-based cell migration research. Lab Chip 2022, 22, 3361–3376. [Google Scholar] [CrossRef] [PubMed]
- Tehranirokh, M.; Kouzani, A.Z.; Francis, P.S.; Kanwar, J.R. Microfluidic devices for cell cultivation and proliferation. Biomicrofluidics 2013, 7, 1–32. [Google Scholar] [CrossRef] [PubMed]
- Kunze, A.; Pushkarsky, I.; Kittur, H.; Di Carlo, D. Research highlights: Measuring and manipulating cell migration. Lab Chip 2014, 14, 4117–4121. [Google Scholar] [CrossRef]
- Kwon, K.W.; Choi, S.S.; Lee, S.H.; Kim, B.; Na Lee, S.; Park, M.C.; Kim, P.; Hwang, S.Y.; Suh, K.Y. Label-free, microfluidic separation and enrichment of human breast cancer cells by adhesion difference. Lab Chip 2007, 7, 1461–1468. [Google Scholar] [CrossRef] [PubMed]
- Young, E.W.K.; Wheeler, A.R.; Simmons, C.A. Matrix-dependent adhesion of vascular and valvular endothelial cells in microfluidic channels. Lab Chip 2007, 7, 1759–1766. [Google Scholar] [CrossRef] [PubMed]
- Lu, H.; Koo, L.Y.; Wang, W.M.; Lauffenburger, D.A.; Griffith, L.G.; Jensen, K.F. Microfluidic shear devices for quantitative analysis of cell adhesion. Anal. Chem. 2004, 76, 5257–5264. [Google Scholar] [CrossRef] [PubMed]
- Riahi, R.; Yang, Y.; Zhang, D.D.; Wong, P.K. Advances in wound-healing assays for probing collective cell migration. J. Lab. Autom. 2012, 17, 59–65. [Google Scholar] [CrossRef] [PubMed]
- Zhao, W.; Zhang, Y.; Liu, L.; Gao, Y.; Sun, W.; Sun, Y.; Ma, Q. Microfluidic-based functional materials: New prospects for wound healing and beyond. J. Mater. Chem. B 2022, 10, 8357–8374. [Google Scholar] [CrossRef] [PubMed]
- Zhang, M.; Li, H.; Ma, H.; Qin, J. A simple microfluidic strategy for cell migration assay in an in vitro wound-healing model. Wound Repair Regen. 2013, 21, 897–903. [Google Scholar] [CrossRef]
- Zheng, C.; Yu, Z.; Zhou, Y.; Tao, L.; Pang, Y.; Chen, T.; Zhang, X.; Qiu, H.; Zhou, H.; Chen, Z.; et al. Live cell imaging analysis of the epigenetic regulation of the human endothelial cell migration at single-cell resolution. Lab Chip 2012, 12, 3063–3072. [Google Scholar] [CrossRef]
- Sticker, D.; Lechner, S.; Jungreuthmayer, C.; Zanghellini, J.; Ertl, P. Microfluidic Migration and Wound Healing Assay Based on Mechanically Induced Injuries of Defined and Highly Reproducible Areas. Anal. Chem. 2017, 89, 2326–2333. [Google Scholar] [CrossRef] [PubMed]
- Shabestani Monfared, G.; Ertl, P.; Rothbauer, M. An on-chip wound healing assay fabricated by xurography for evaluation of dermal fibroblast cell migration and wound closure. Sci. Rep. 2020, 10, 16192. [Google Scholar] [CrossRef] [PubMed]
- Gao, A.X.; Tian, Y.L.; Shi, Z.Z.; Yu, L. A cost-effective microdevice bridges microfluidic and conventional in vitro scratch/wound-healing assay for personalized therapy validation. Biochip J. 2016, 10, 56–64. [Google Scholar] [CrossRef]
- Nie, F.-Q.; Yamada, M.; Kobayashi, J.; Yamato, M.; Kikuchi, A.; Okano, T. On-chip cell migration assay using microfluidic channels. Biomaterials 2007, 28, 4017–4022. [Google Scholar] [CrossRef] [PubMed]
- Conant, C.G.; Nevill, J.T.; Schwartz, M.; Ionescu-Zanetti, C. Wound Healing Assays in Well Plate—Coupled Microfluidic Devices with Controlled Parallel Flow. J. Lab. Autom. 2010, 15, 52–57. [Google Scholar] [CrossRef]
- Shih, H.-C.; Lee, T.-A.; Wu, H.-M.; Ko, P.-L.; Liao, W.-H.; Tung, Y.-C. Microfluidic Collective Cell Migration Assay for Study of Endothelial Cell Proliferation and Migration under Combinations of Oxygen Gradients, Tensions, and Drug Treatments. Sci. Rep. 2019, 9, 8234. [Google Scholar] [CrossRef] [PubMed]
- Van Der Meer, A.D.; Vermeul, K.; Poot, A.A.; Feijen, J.; Vermes, I. A microfluidic wound-healing assay for quantifying endothelial cell migration. Am. J. Physiol.-Hear. Circ. Physiol. 2010, 298, 719–725. [Google Scholar] [CrossRef]
- Huang, X.; Li, L.; Tu, Q.; Wang, J.; Liu, W.; Wang, X.; Ren, L.; Wang, J. On-chip cell migration assay for quantifying the effect of ethanol on MCF-7 human breast cancer cells. Microfluid. Nanofluidics 2011, 10, 1333–1341. [Google Scholar] [CrossRef]
- Murrell, M.; Kamm, R.; Matsudaira, P. Tension, free space, and cell damage in a microfluidic wound healing assay. PLoS ONE 2011, 6, e24283. [Google Scholar] [CrossRef]
- Felder, M.; Sallin, P.; Barbe, L.; Haenni, B.; Gazdhar, A.; Geiser, T.; Guenat, O. Microfluidic wound-healing assay to assess the regenerative effect of HGF on wounded alveolar epithelium. Lab Chip 2012, 12, 640–646. [Google Scholar] [CrossRef]
- Felder, M.; Stucki, A.O.; Stucki, J.D.; Geiser, T.; Guenat, O.T. The potential of microfluidic lung epithelial wounding: Towards in vivo-like alveolar microinjuries. Integr. Biol. 2014, 6, 1132–1140. [Google Scholar] [CrossRef]
- Sheng Lin, Y.; Liu, W.; Hu, C. Investigation of Cells Migration Effects in Microfluidic Chips. J. Chromatogr. Sep. Tech. 2017, 8, 10–13. [Google Scholar] [CrossRef]
- Lin, J.Y.; Lo, K.Y.; Sun, Y.S. A microfluidics-based wound-healing assay for studying the effects of shear stresses, wound widths, and chemicals on the wound-healing process. Sci. Rep. 2019, 9, 20016. [Google Scholar] [CrossRef] [PubMed]
- Wei, Y.; Chen, F.; Zhang, T.; Chen, D.; Jia, X.; Wang, J.; Guo, W.; Chen, J. A Tubing-Free Microfluidic Wound Healing Assay Enabling the Quantification of Vascular Smooth Muscle Cell Migration. Sci. Rep. 2015, 5, 14049. [Google Scholar] [CrossRef] [PubMed]
- Yazdanpanah Moghadam, E.; Sonenberg, N.; Packirisamy, M. Microfluidic Wound-Healing Assay for ECM and Microenvironment Properties on Microglia BV2 Cells Migration. Biosensors 2023, 13, 290. [Google Scholar] [CrossRef]
- Moghadam, E.Y.; Parimalam, S.S.; Packirisamy, M. Effect of Shear Stress on Microglia (BV2) Single Cell in a Microfluidic Platform—3D Modeling Under Fluid Flow Stimulation. In Proceedings of the IEEE SENSORS 2019, Montreal, QC, USA, 27–30 October 2019; IEEE: New York, NY, USA, 2019; pp. 1–4. [Google Scholar]
- Henn, A.; Lund, S.; Hedtjärn, M.; Schrattenholz, A.; Pörzgen, P.; Leist, M. The suitability of BV2 cells as alternative model system for primary microglia cultures or for animal experiments examining brain inflammation. ALTEX 2009, 26, 83–94. [Google Scholar] [CrossRef] [PubMed]
- Kim, K.M.; Choi, Y.J.; Hwang, J.H.; Kim, A.R.; Cho, H.J.; Hwang, E.S.; Park, J.Y.; Lee, S.H.; Hong, J.H. Shear stress induced by an interstitial level of slow flow increases the osteogenic differentiation of mesenchymal stem cells through TAZ activation. PLoS ONE 2014, 9, e92427. [Google Scholar] [CrossRef] [PubMed]
- Bruus, H. Lecture Notes Theoretical microfluidics. Physics 2008, 18, 363. [Google Scholar]
- Gu, R.; Zhang, X.; Zhang, G.; Tao, T.; Yu, H.; Liu, L.; Dou, Y.; Li, A.; Qin, J. Probing the Bi-directional Interaction Between Microglia and Gliomas in a Tumor Microenvironment on a Microdevice. Neurochem. Res. 2017, 42, 1478–1487. [Google Scholar] [CrossRef]
- Nam, H.Y.; Nam, J.H.; Yoon, G.; Lee, J.-Y.; Nam, Y.; Kang, H.-J.; Cho, H.-J.; Kim, J.; Hoe, H.-S. Ibrutinib suppresses LPS-induced neuroinflammatory responses in BV2 microglial cells and wild-type mice. J. Neuroinflamm. 2018, 15, 271. [Google Scholar] [CrossRef]
- Wang, Y.; Qi, Y.; Qi, J.; Wu, J.; Lin, F.; Cui, X.; Ge, J.; Liu, Z. Activin A is a novel chemoattractant for migration of microglial BV2 cells. J. Neuroimmunol. 2022, 371, 577929. [Google Scholar] [CrossRef] [PubMed]
- Pijuan, J.; Barceló, C.; Moreno, D.F.; Maiques, O.; Sisó, P.; Marti, R.M.; Macià, A.; Panosa, A. In vitro cell migration, invasion, and adhesion assays: From cell imaging to data analysis. Front. Cell Dev. Biol. 2019, 7, 107. [Google Scholar] [CrossRef] [PubMed]


| Shear Stress in Alow (Pa) | Shear Stress in Amedium (Pa) | Shear Stress in Ahigh (Pa) | |
|---|---|---|---|
| Re = 25 | 0–5 | 5–7 | 7–9 |
| Re = 50 | 0–8 | 8–14.5 | 14.6–17 |
| Re = 100 | 0–20 | 20–30 | 30–34 |
| Alow | Amedium | Ahigh | |
|---|---|---|---|
| Re = 25 | 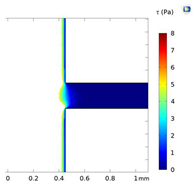 | 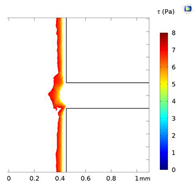 | 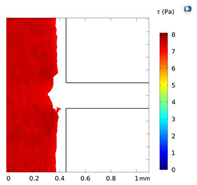 |
| Re = 50 | 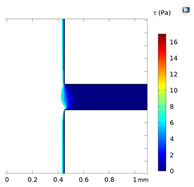 | 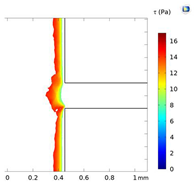 |  |
| Re = 100 |  | 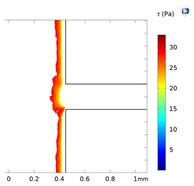 | 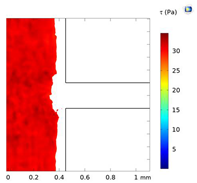 |
Disclaimer/Publisher’s Note: The statements, opinions and data contained in all publications are solely those of the individual author(s) and contributor(s) and not of MDPI and/or the editor(s). MDPI and/or the editor(s) disclaim responsibility for any injury to people or property resulting from any ideas, methods, instructions or products referred to in the content. |
© 2024 by the authors. Licensee MDPI, Basel, Switzerland. This article is an open access article distributed under the terms and conditions of the Creative Commons Attribution (CC BY) license (https://creativecommons.org/licenses/by/4.0/).
Share and Cite
Yazdanpanah Moghadam, E.; Sonenberg, N.; Packirisamy, M. Microfluidic Wound-Healing Assay for Comparative Study on Fluid Dynamic, Chemical and Mechanical Wounding on Microglia BV2 Migration. Micromachines 2024, 15, 1004. https://doi.org/10.3390/mi15081004
Yazdanpanah Moghadam E, Sonenberg N, Packirisamy M. Microfluidic Wound-Healing Assay for Comparative Study on Fluid Dynamic, Chemical and Mechanical Wounding on Microglia BV2 Migration. Micromachines. 2024; 15(8):1004. https://doi.org/10.3390/mi15081004
Chicago/Turabian StyleYazdanpanah Moghadam, Ehsan, Nahum Sonenberg, and Muthukumaran Packirisamy. 2024. "Microfluidic Wound-Healing Assay for Comparative Study on Fluid Dynamic, Chemical and Mechanical Wounding on Microglia BV2 Migration" Micromachines 15, no. 8: 1004. https://doi.org/10.3390/mi15081004
APA StyleYazdanpanah Moghadam, E., Sonenberg, N., & Packirisamy, M. (2024). Microfluidic Wound-Healing Assay for Comparative Study on Fluid Dynamic, Chemical and Mechanical Wounding on Microglia BV2 Migration. Micromachines, 15(8), 1004. https://doi.org/10.3390/mi15081004