
Low-Power Driving Waveform Design for Improving the Display Effect of Electrophoretic Electronic Paper

Abstract
1. Introduction
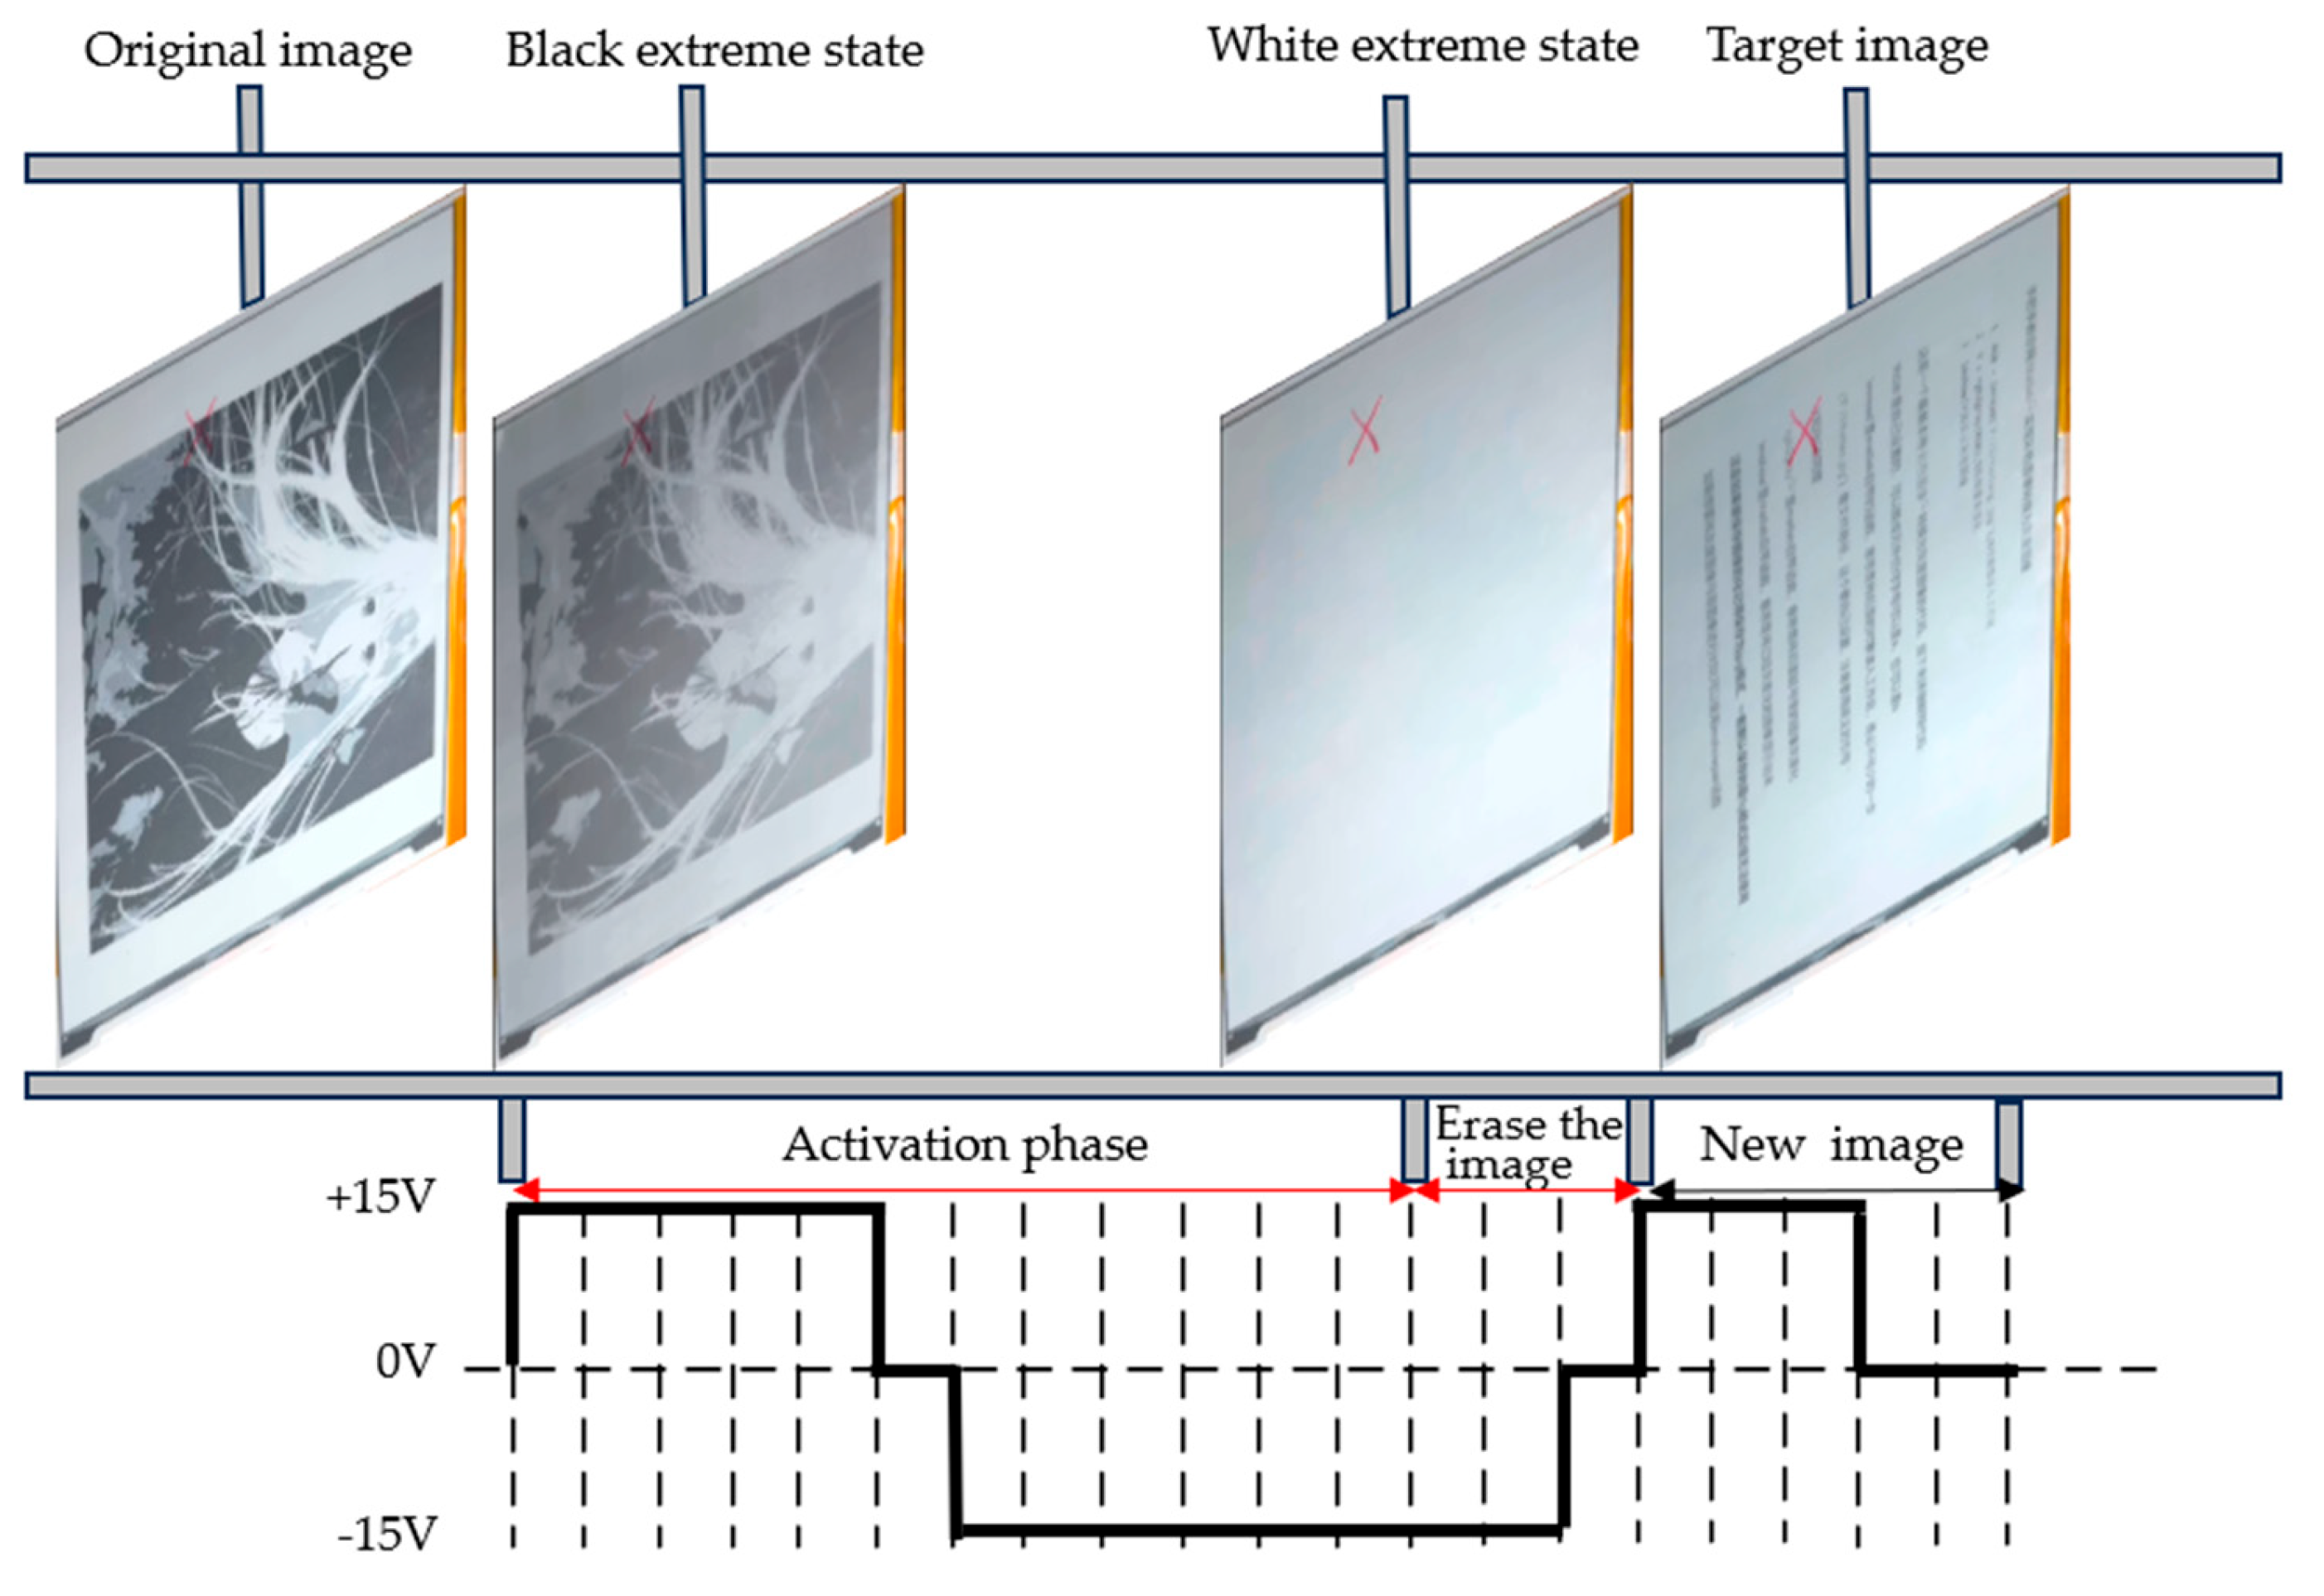
2. Principle
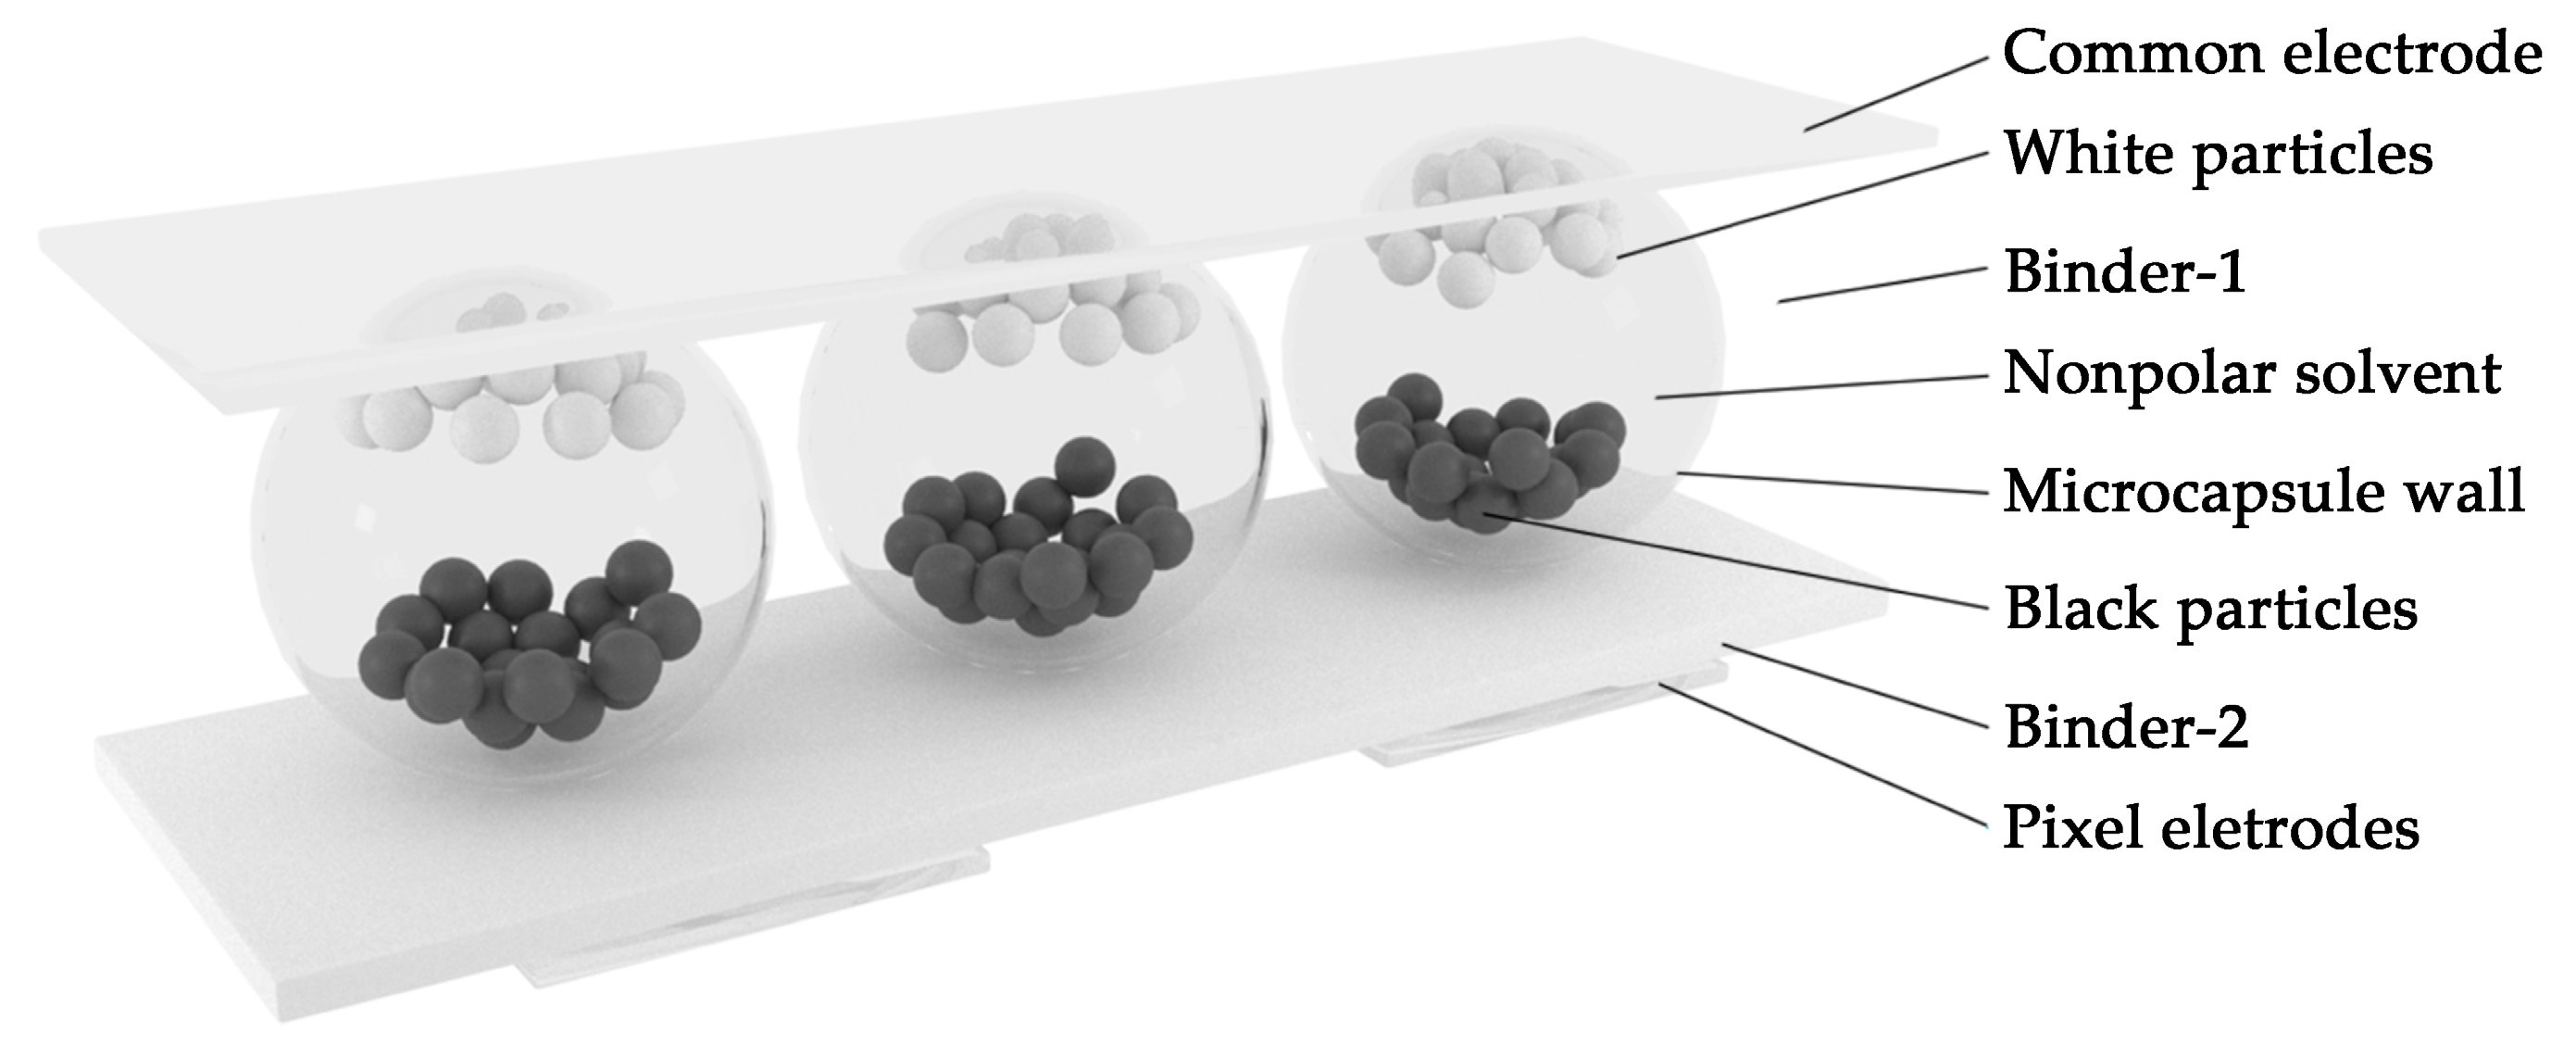
2.1. Principle of EPDs
2.2. Factors That Generate Power Consumption
3. Experiment and Discussion
3.1. Experiment Platform
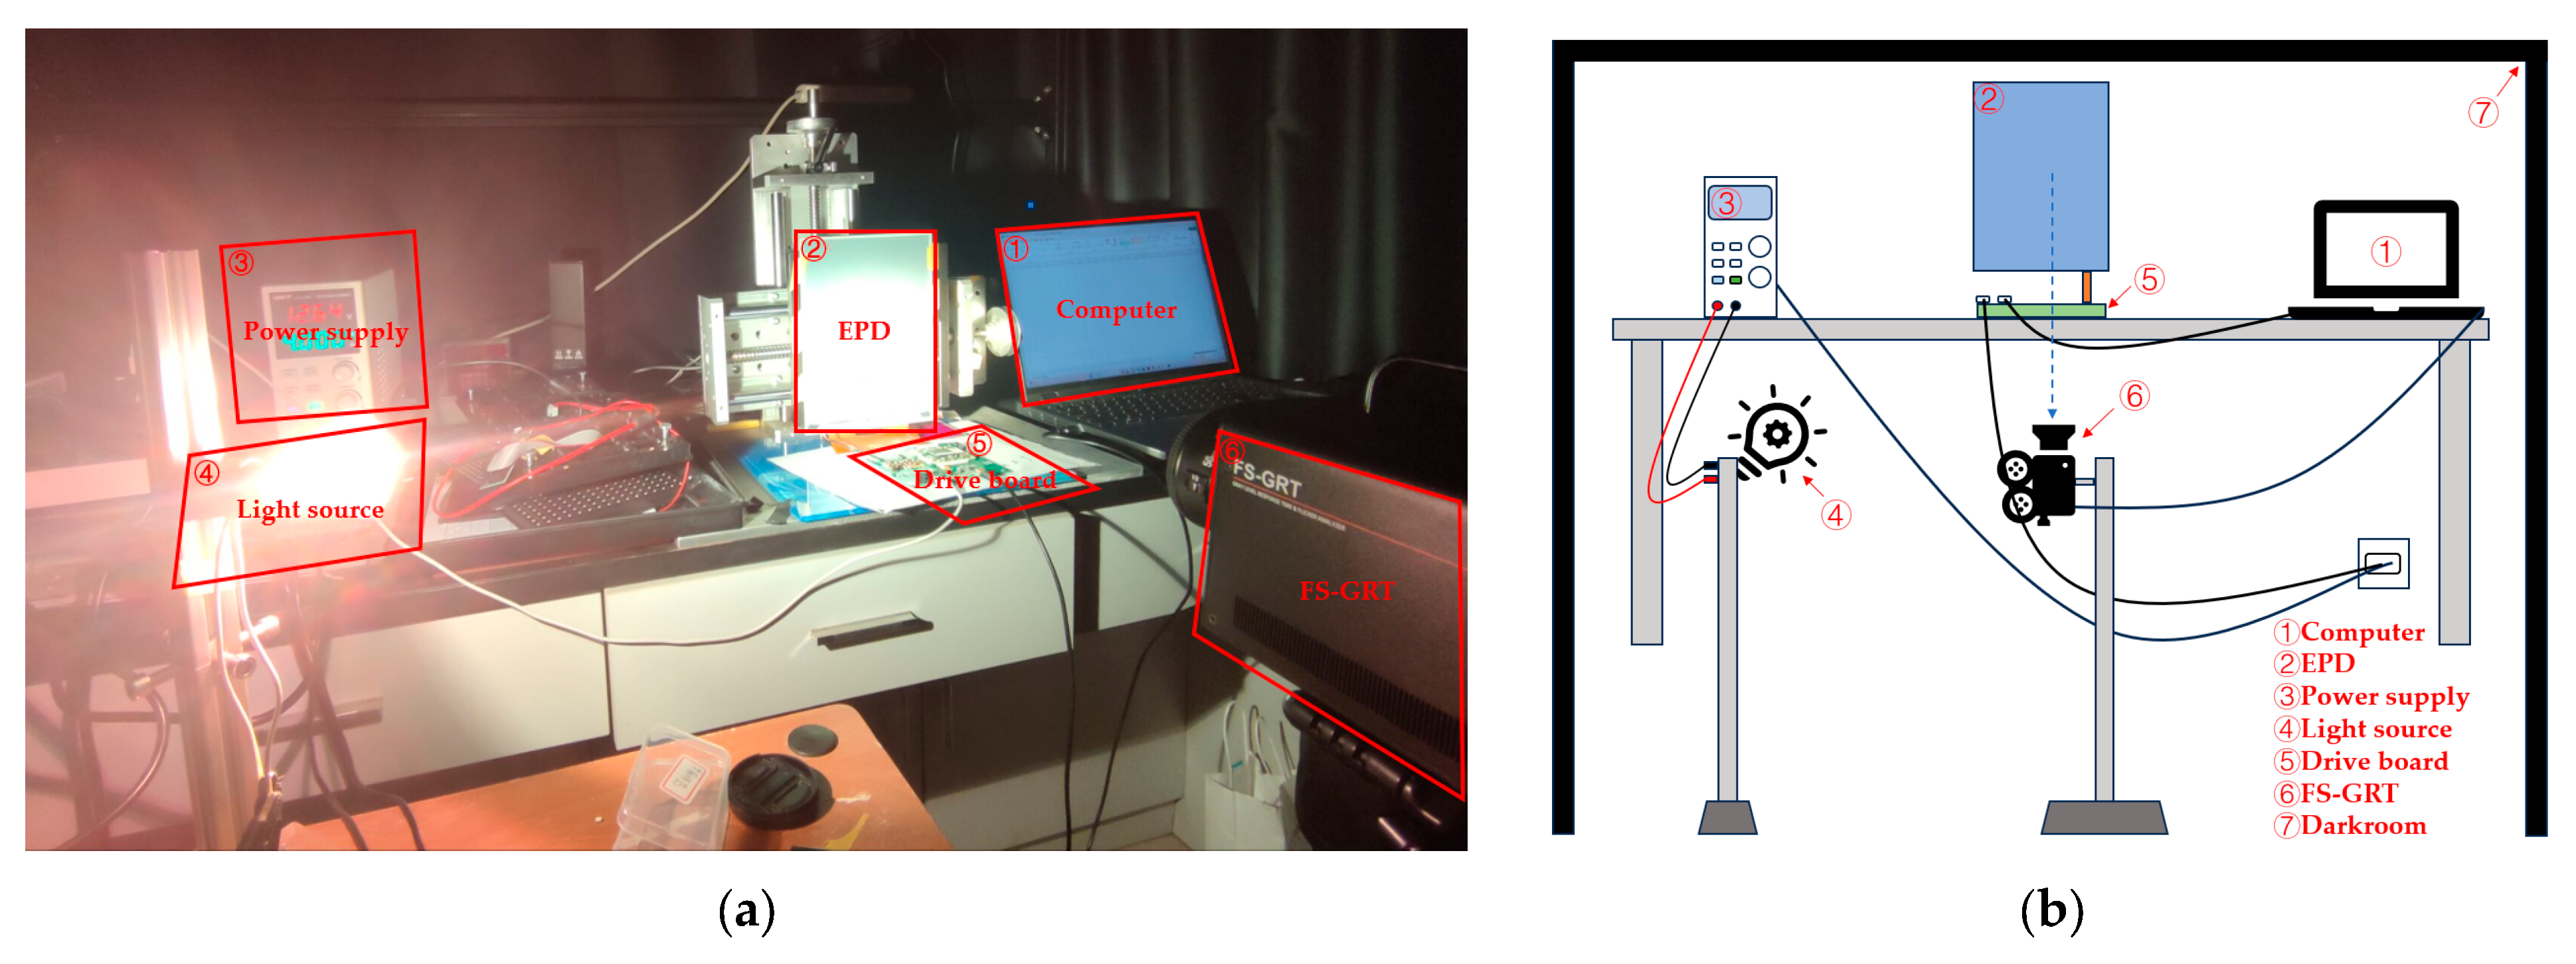
3.1.1. Optoelectronic Performance Test Platform
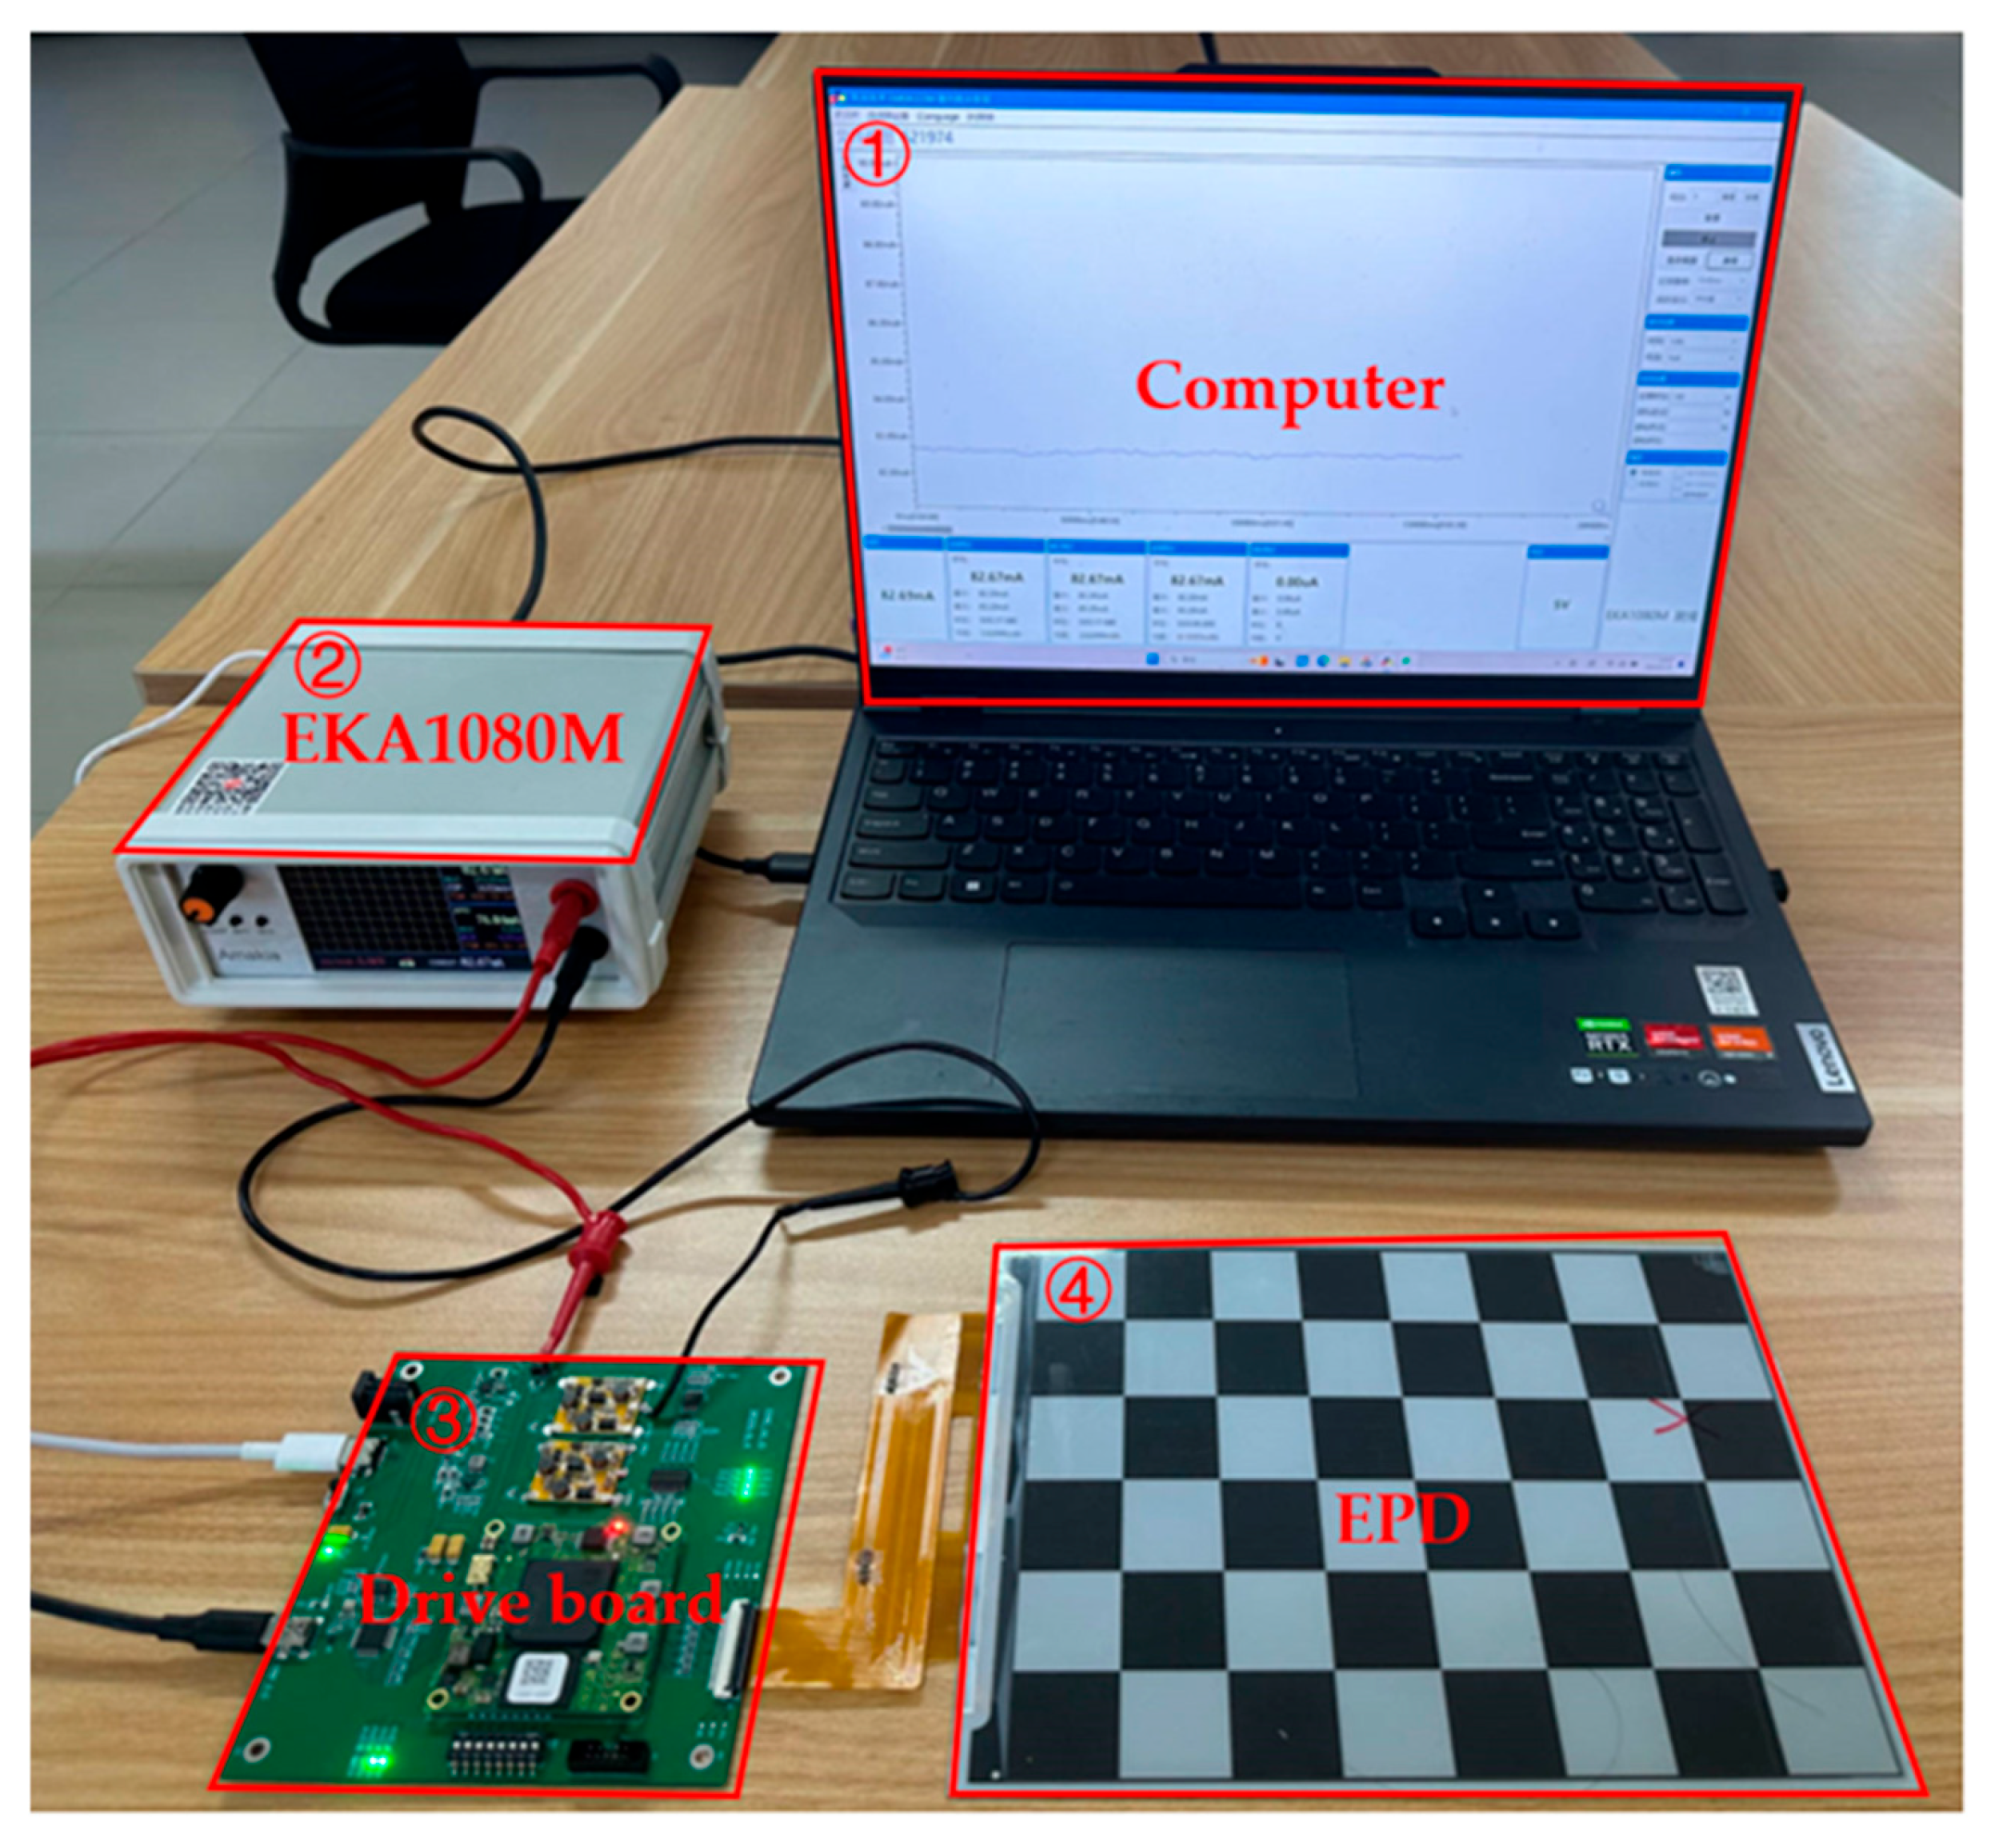
3.1.2. Power Test Platform
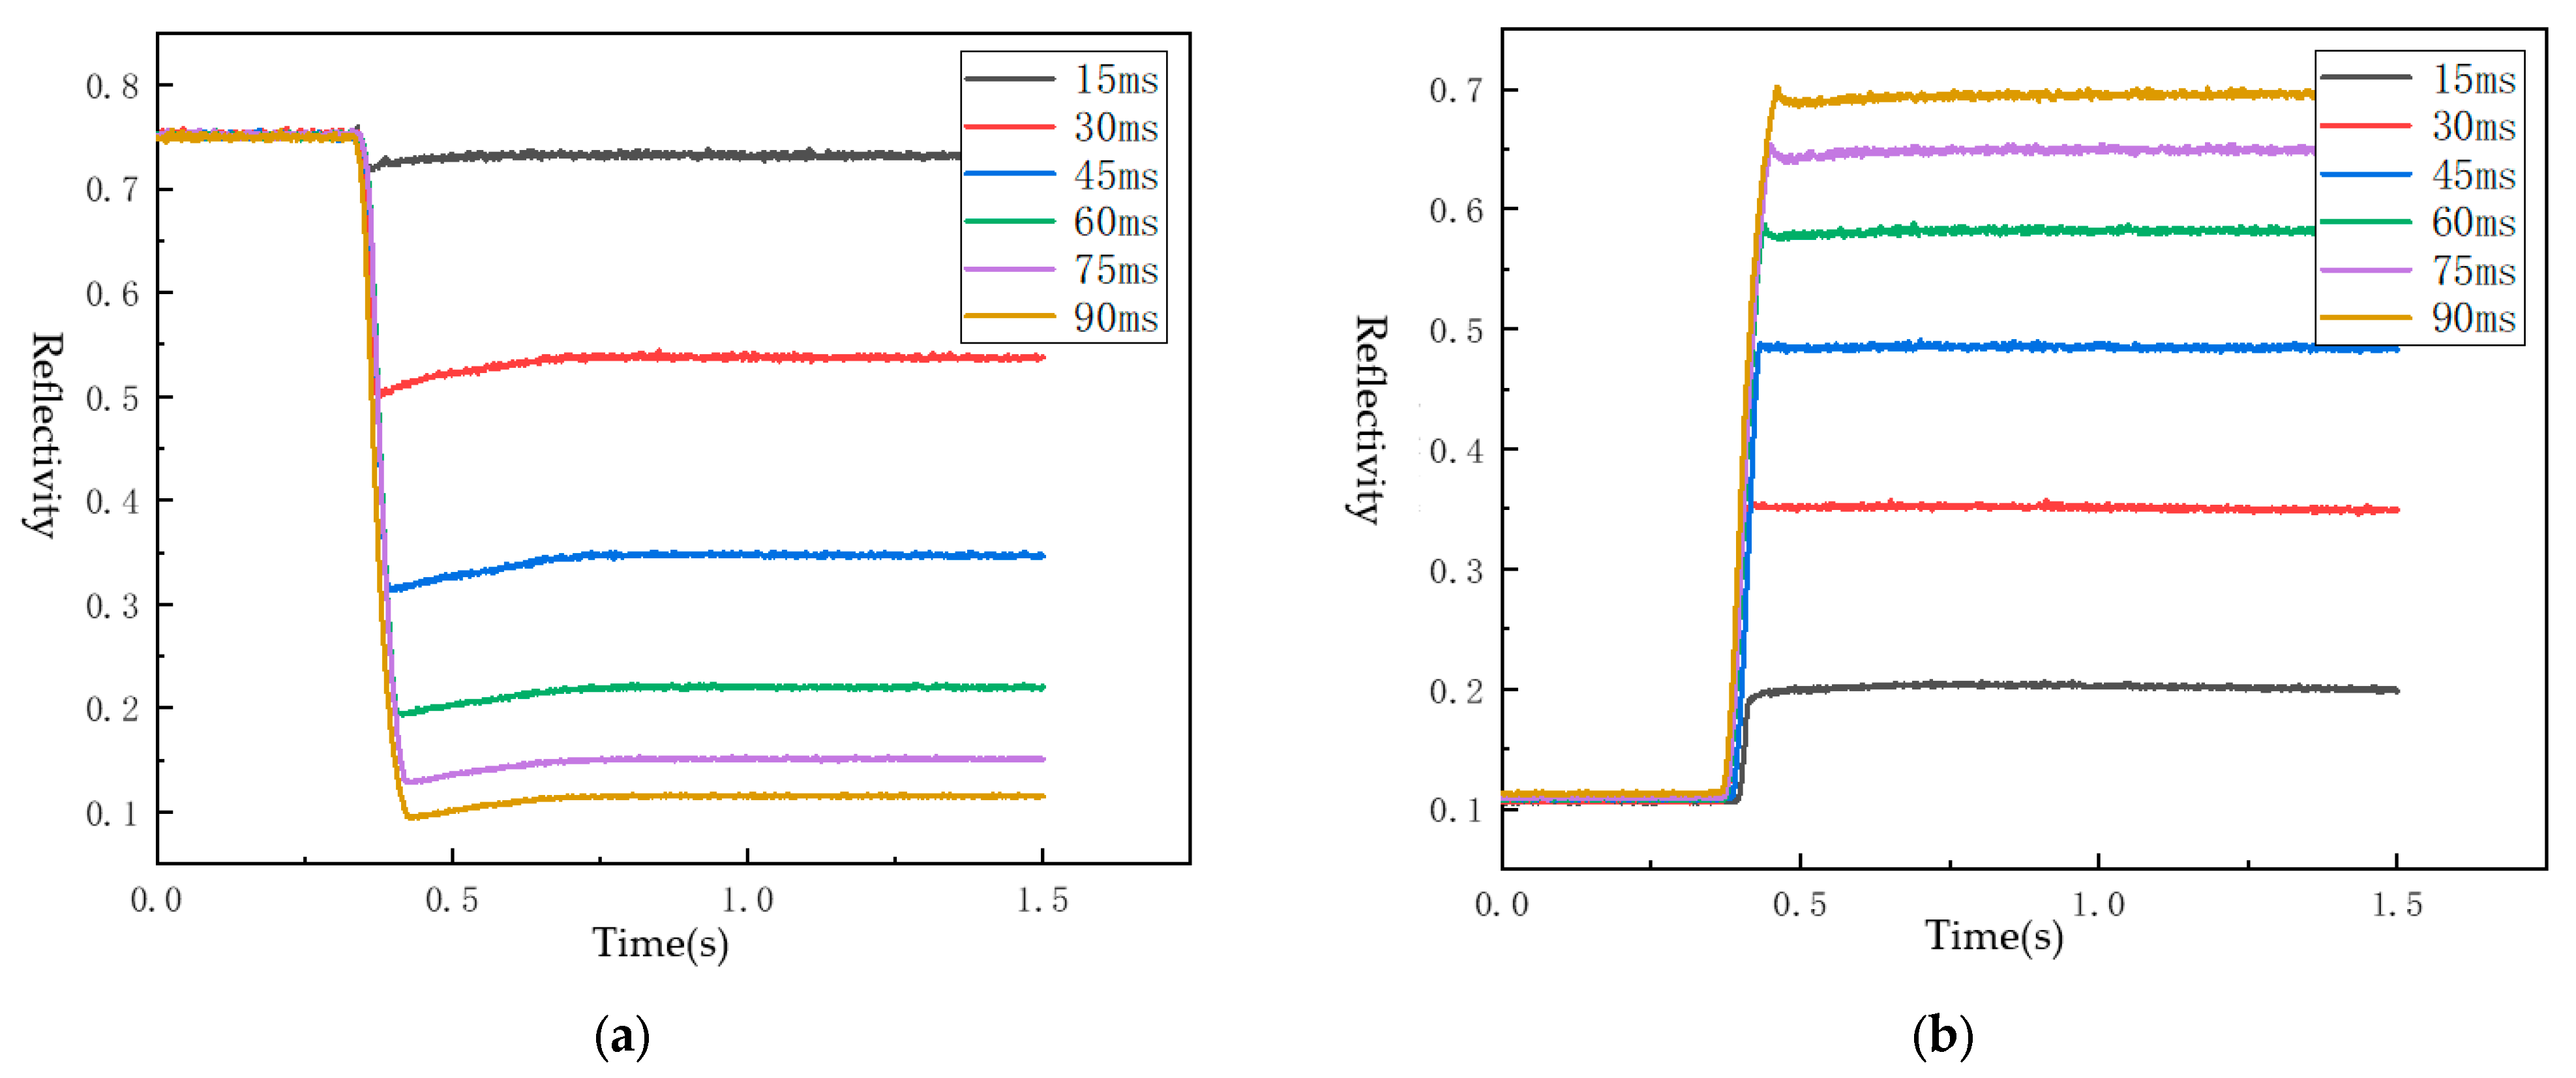
3.2. Optoelectronic Performance Test
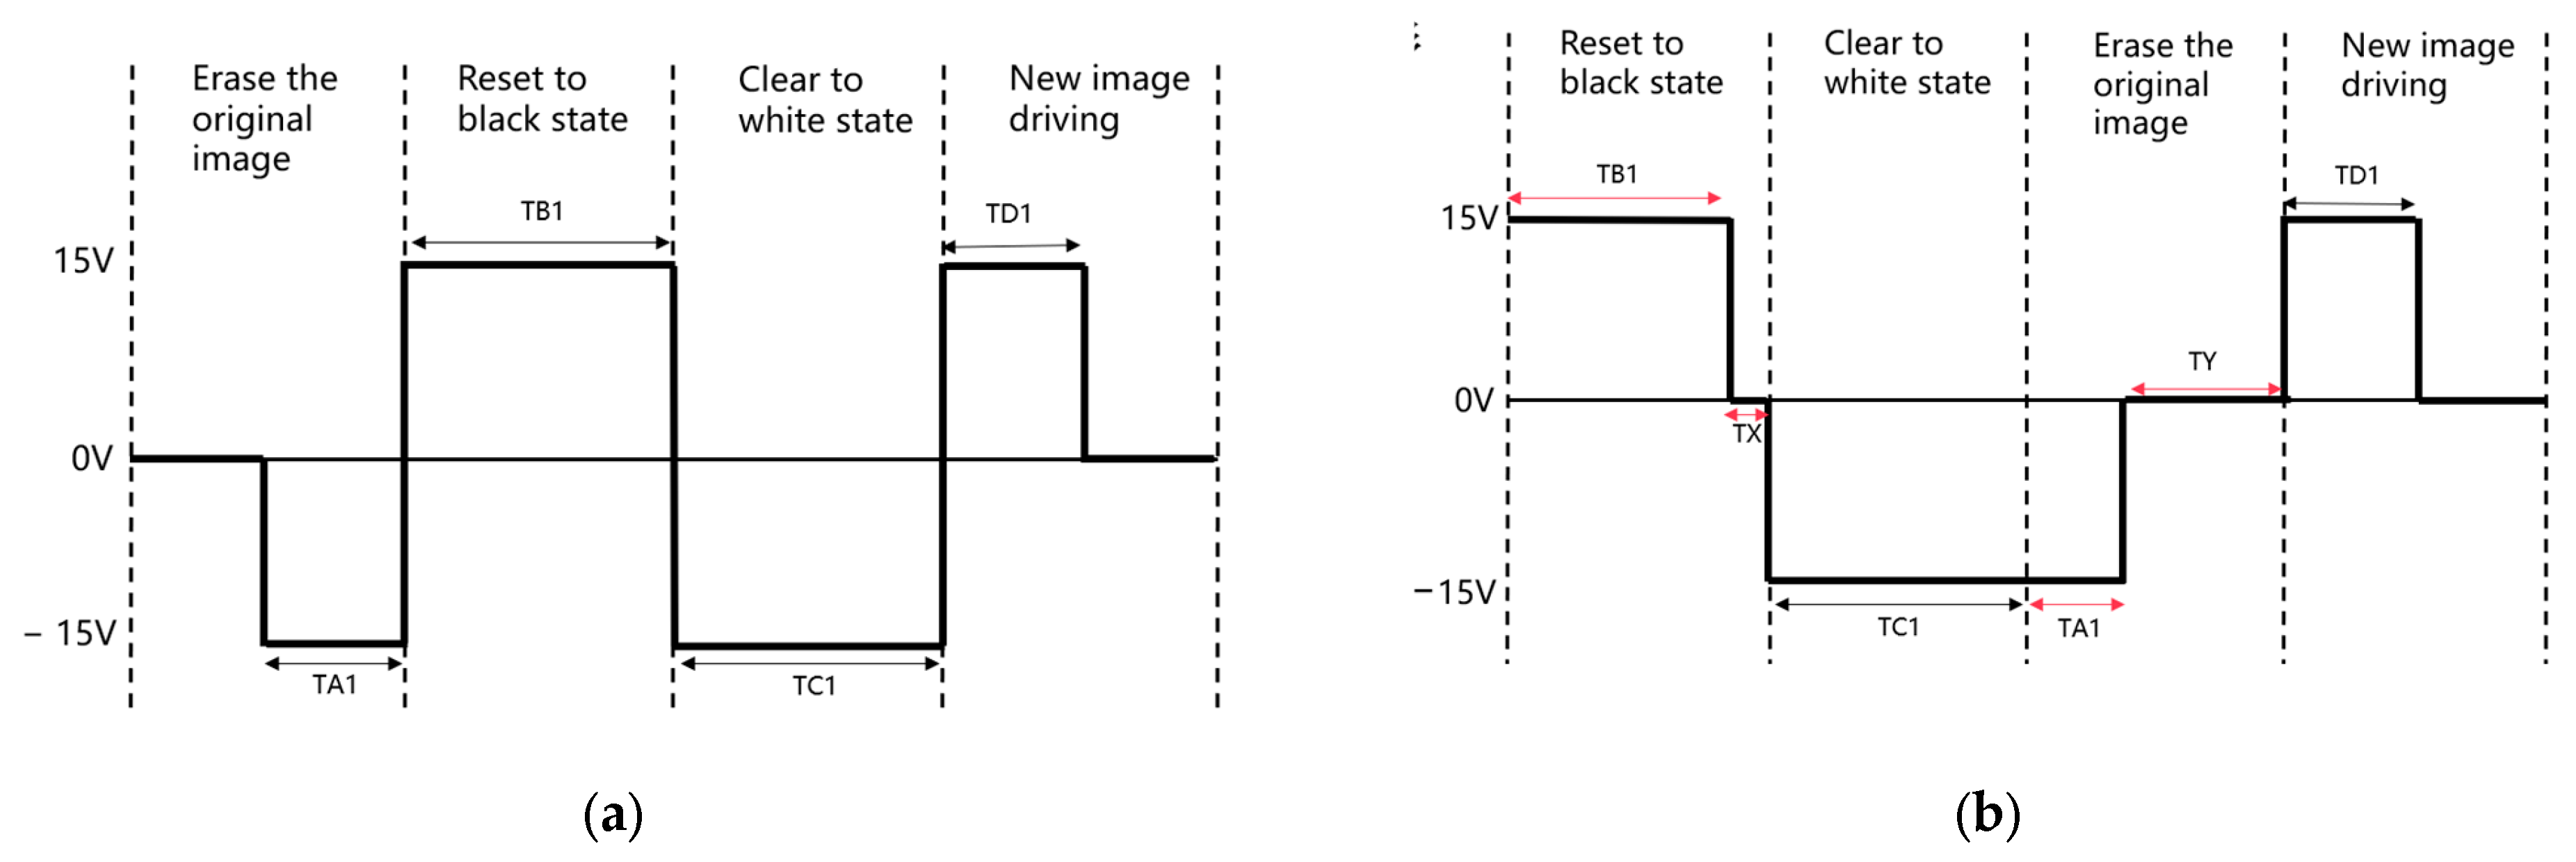
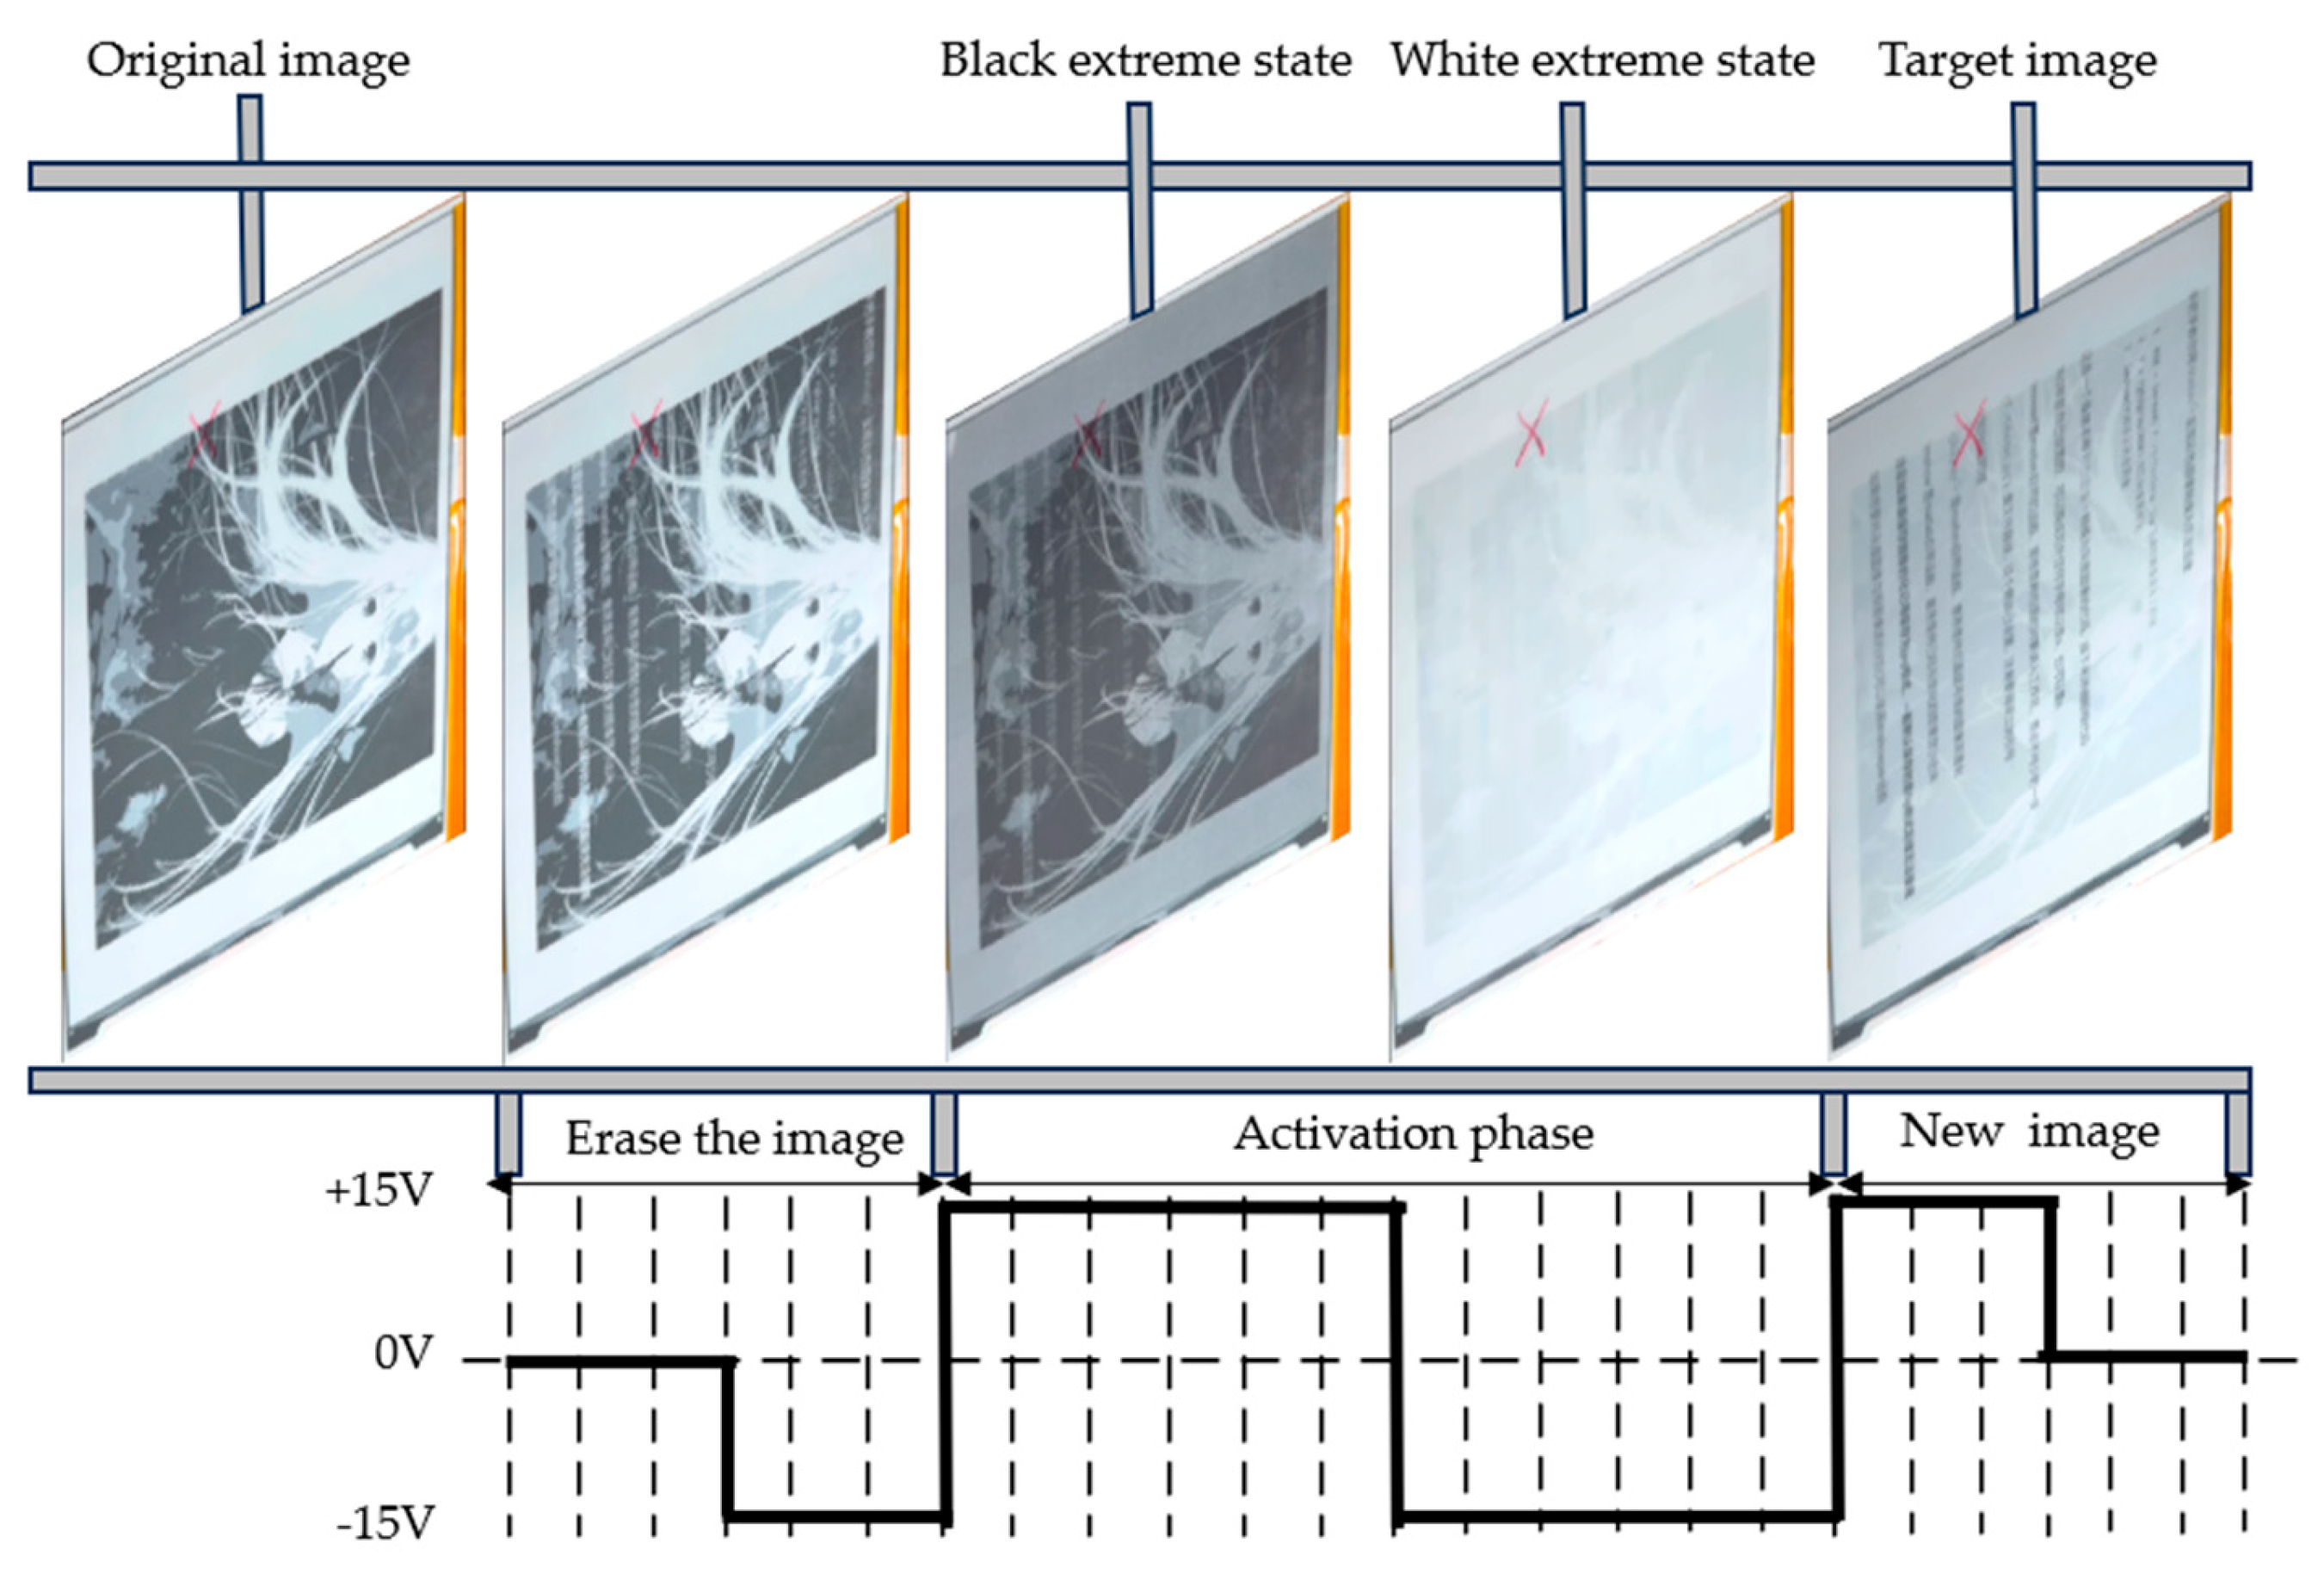
3.3. Low-Power Driving Waveform Design
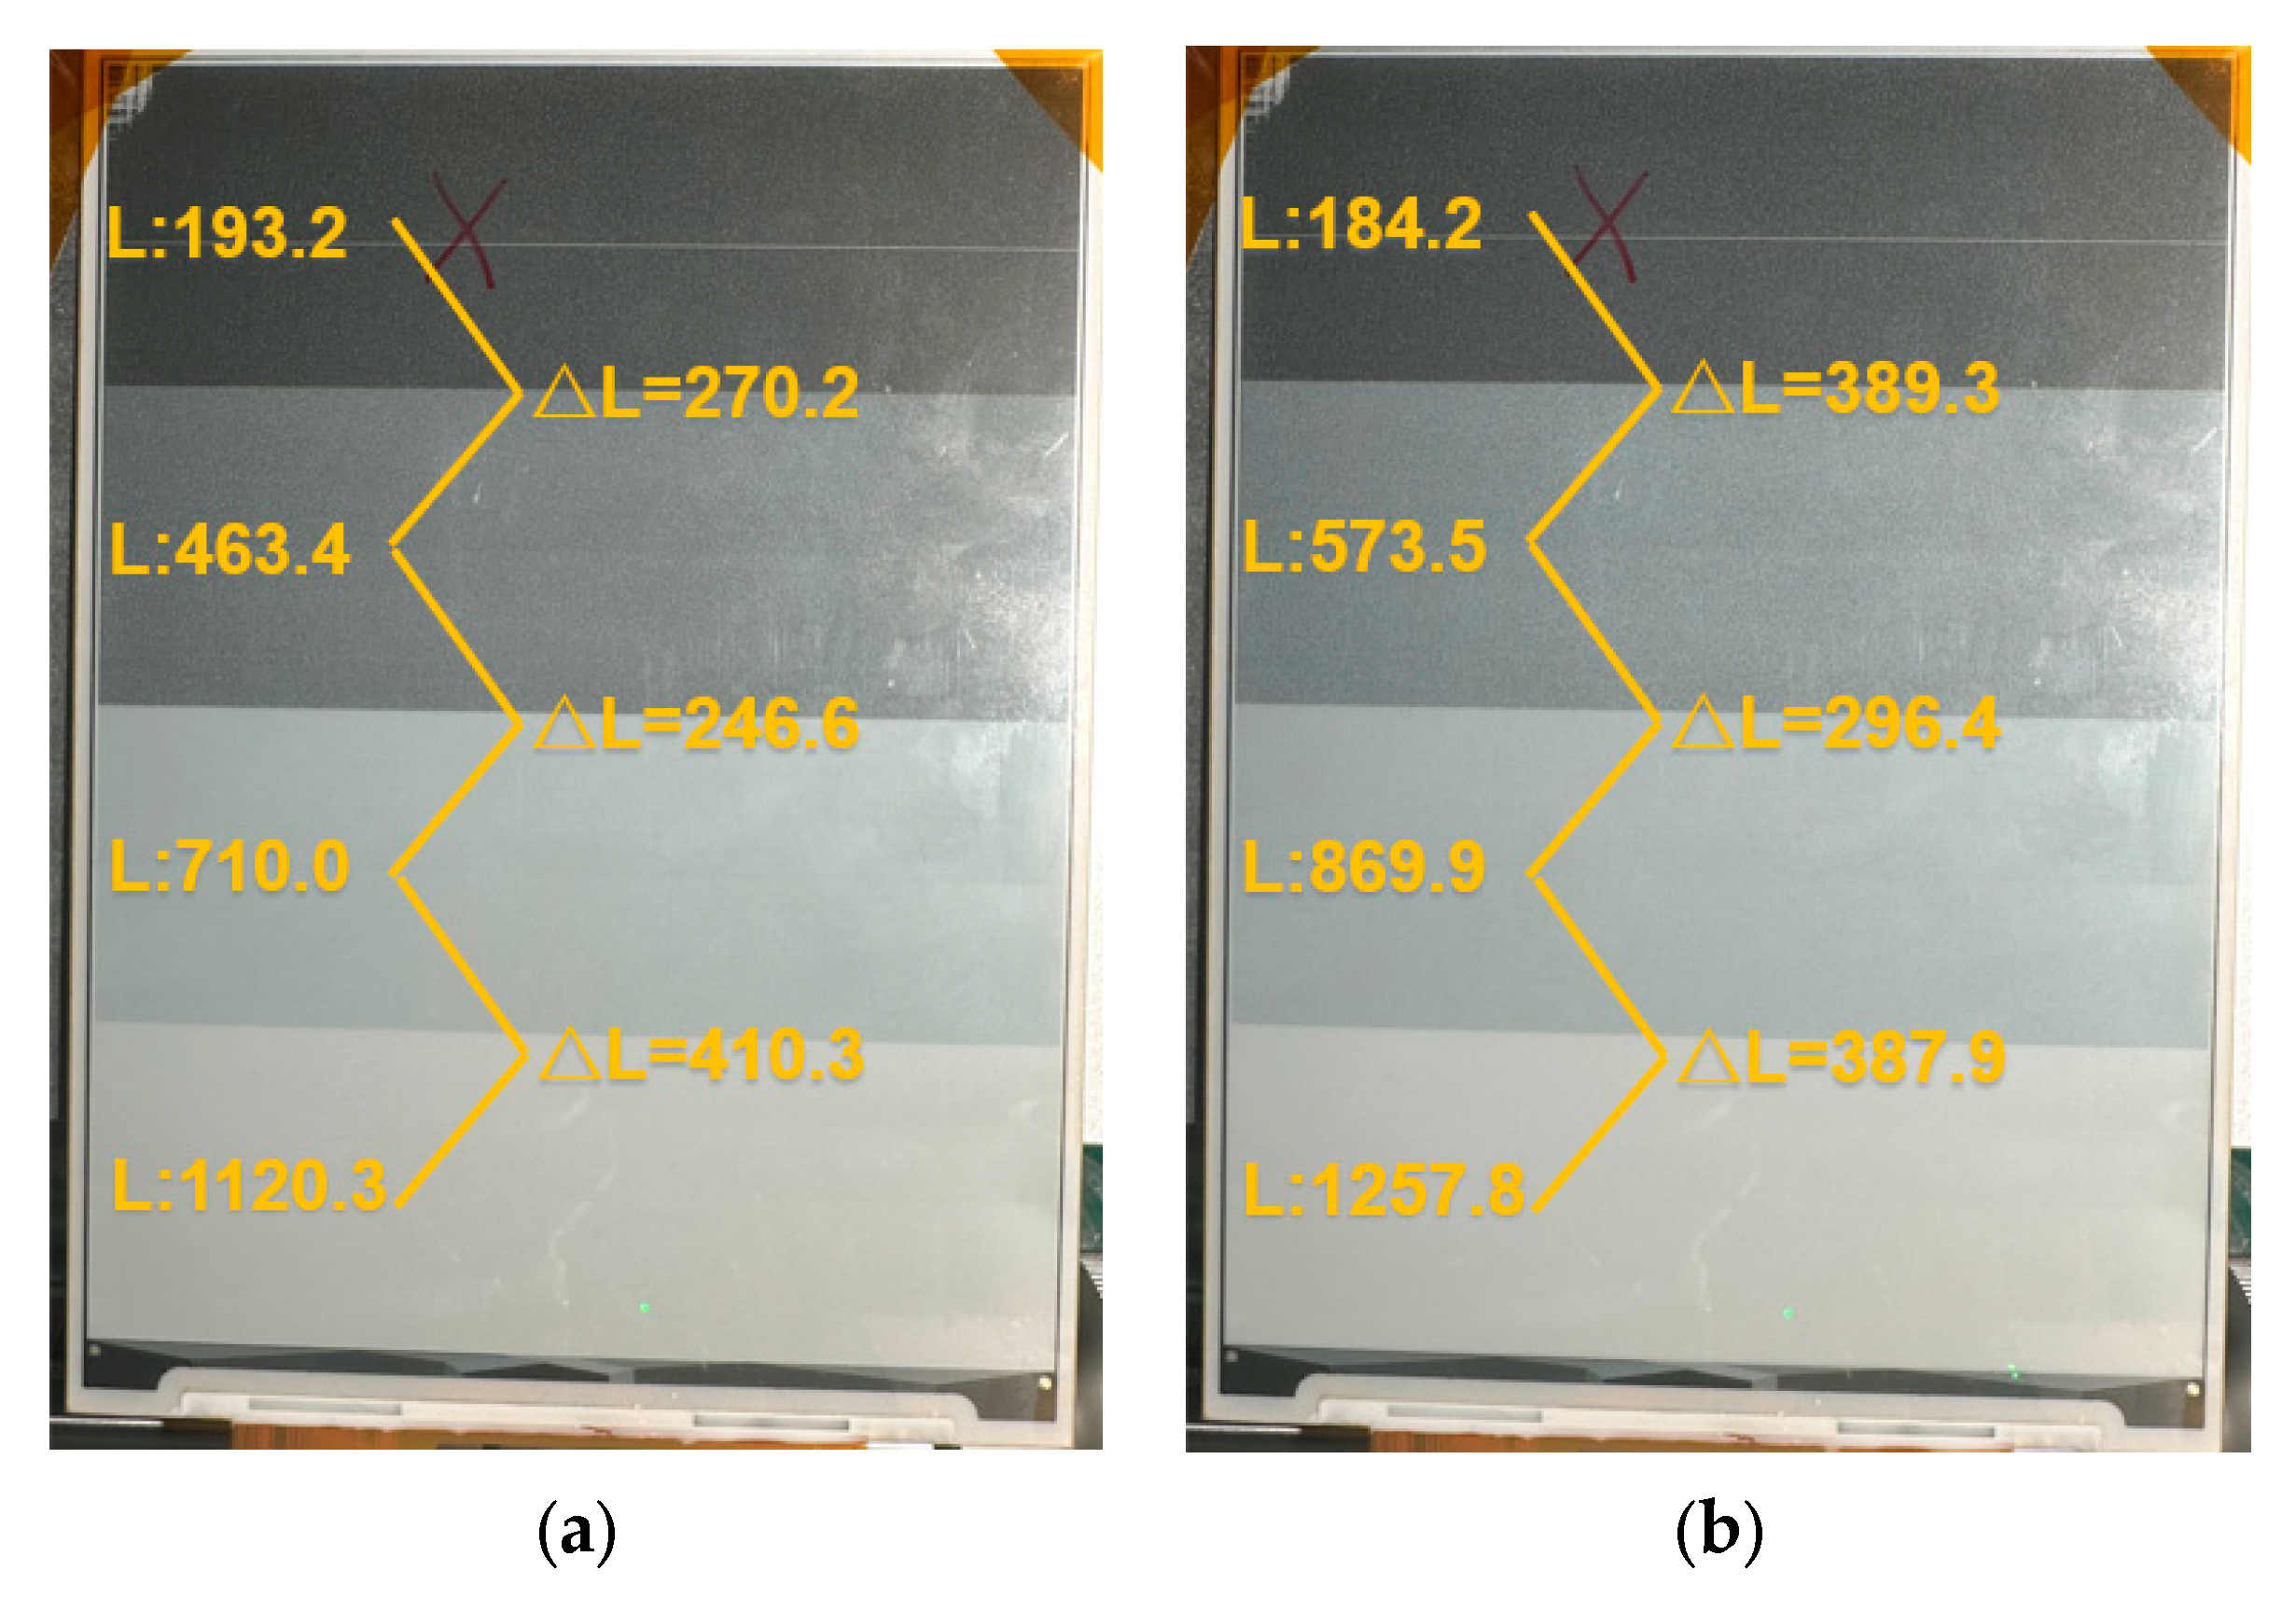
3.4. Gray Scale Display Effect Comparison
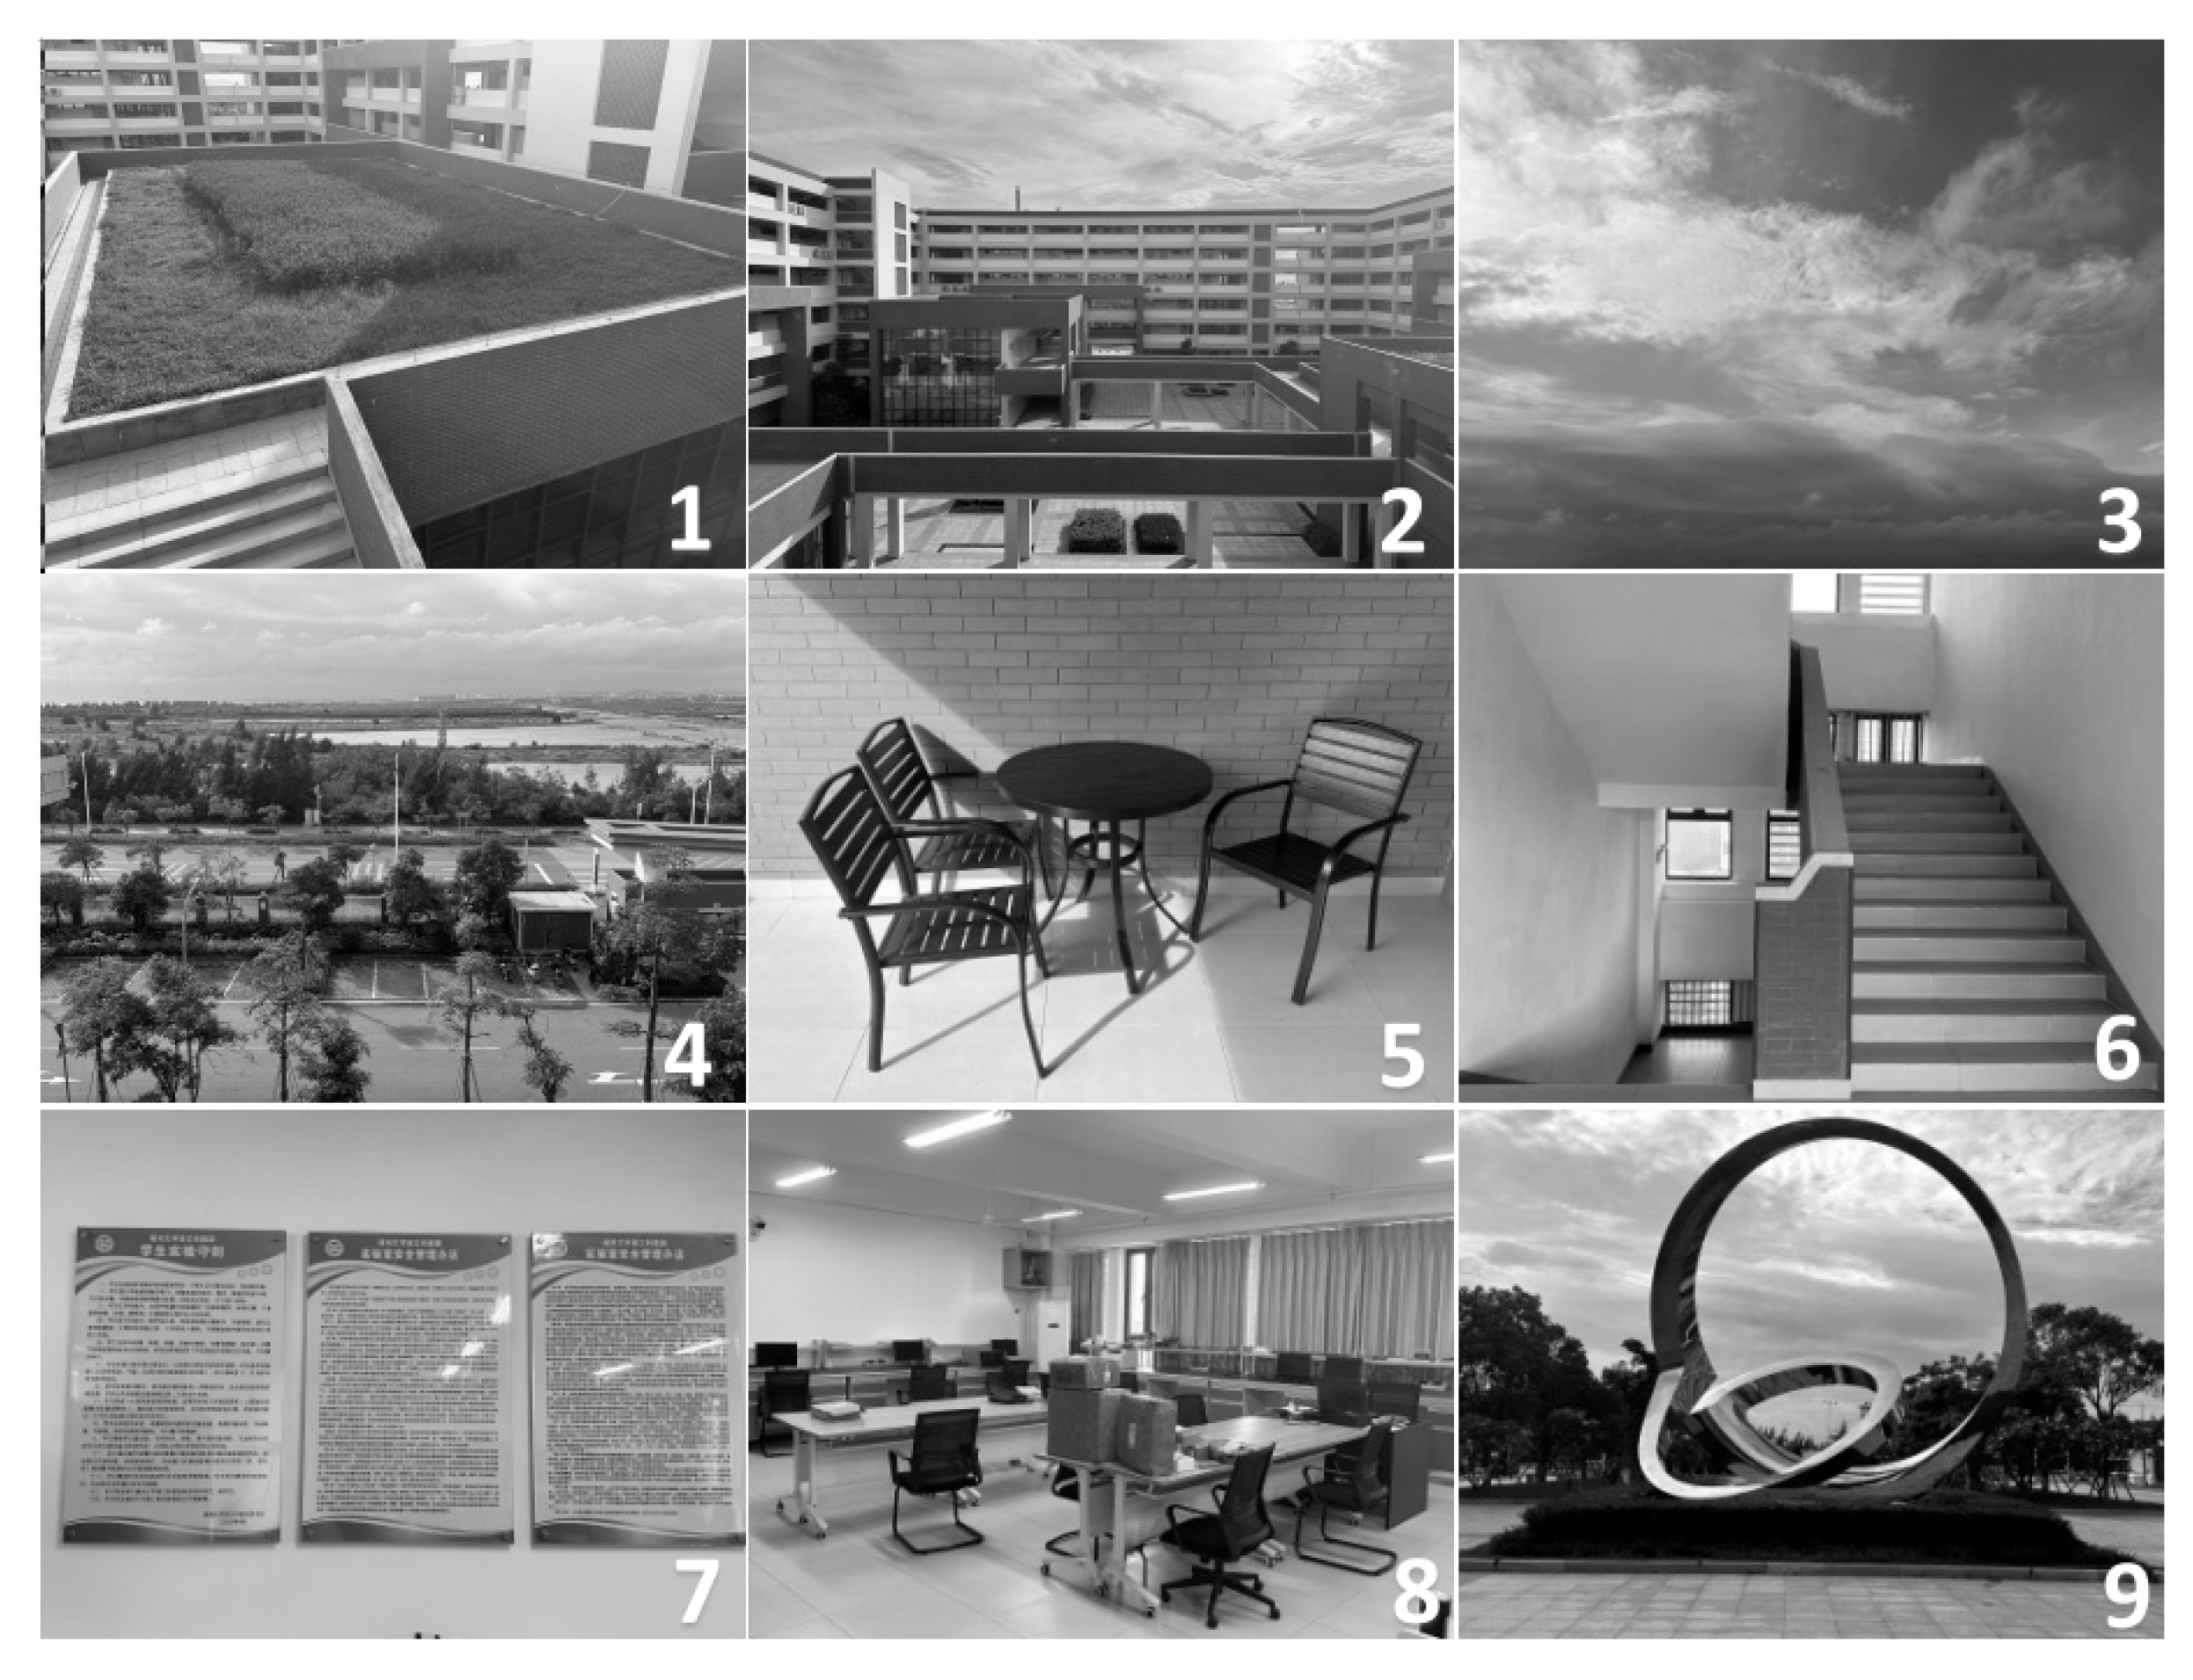
3.5. Power Test
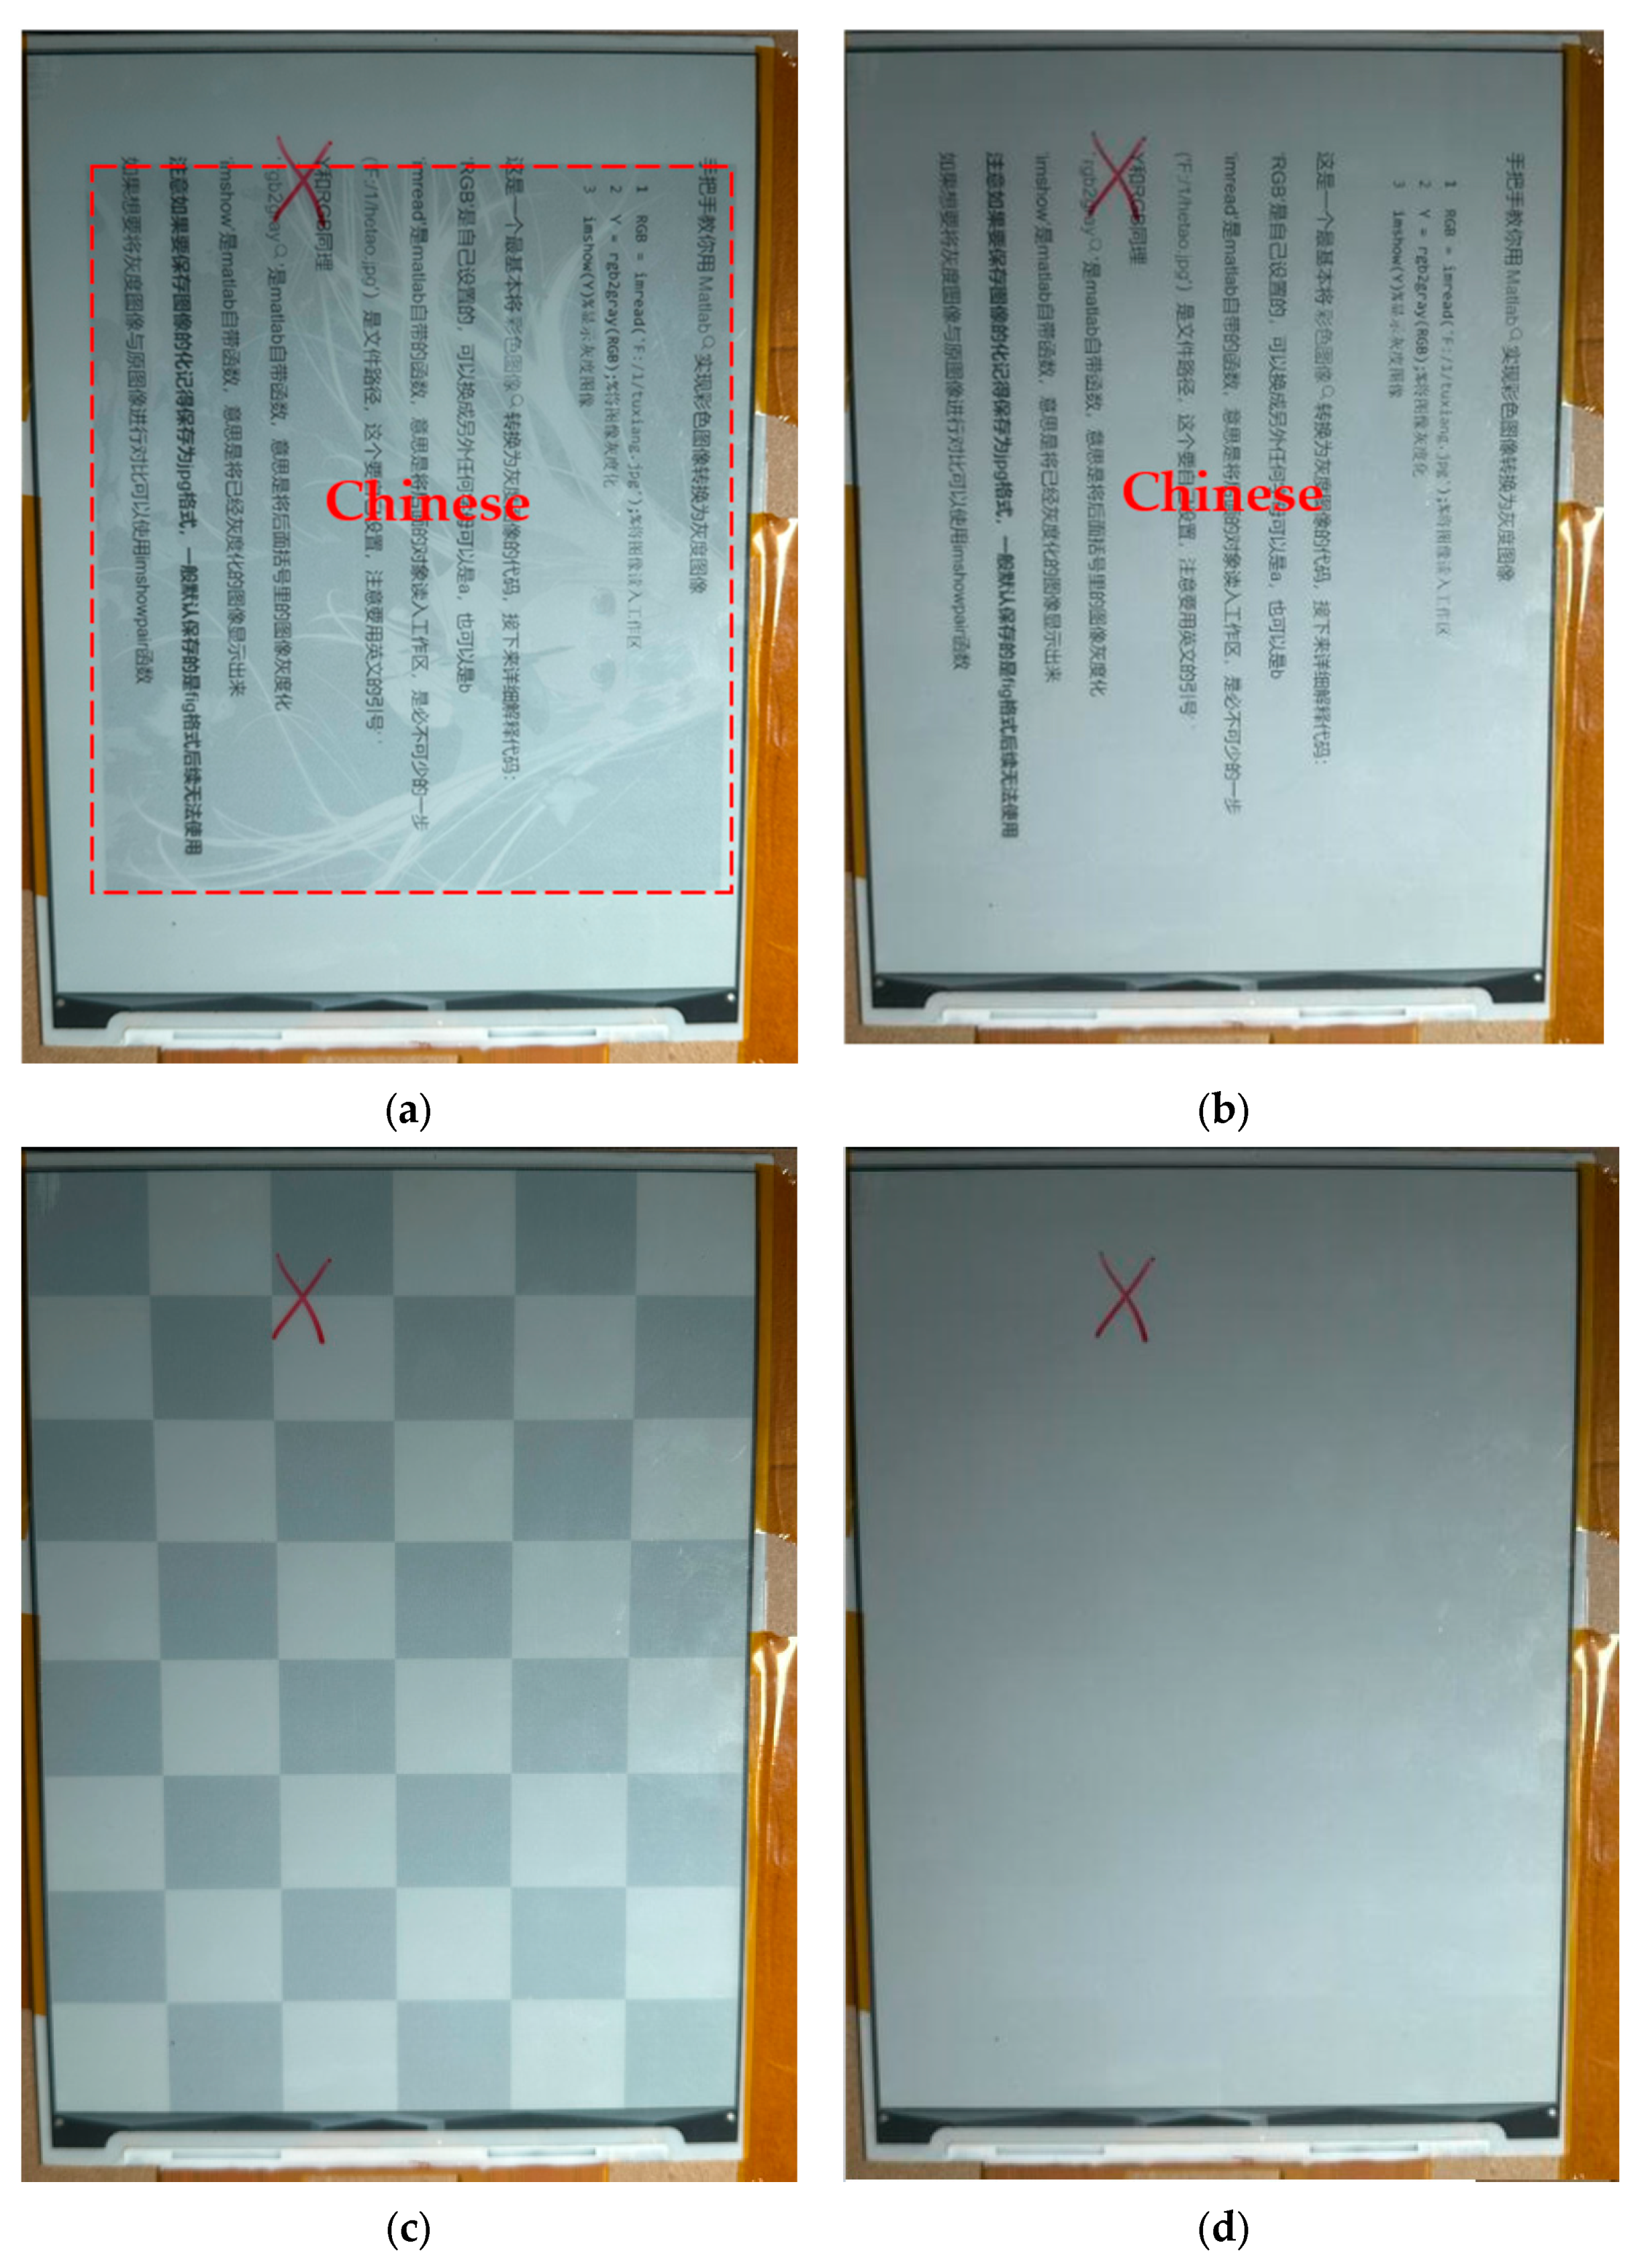
3.6. Display Effect Test
3.6.1. Flicker Test
3.6.2. Ghosting Test
4. Conclusions
Author Contributions
Funding
Data Availability Statement
Conflicts of Interest
References
- Liu, X.Q. Research on scientific evaluation system of electronic paper-like paper display. Inf. Technol. Stand. 2024, 84–87+92. (In Chinese) [Google Scholar] [CrossRef]
- Yuan, D.; Yang, T.H.; Tang, B.; Zhou, G. Development status and prospect of flexible e-paper display technology. China Basic Sci. 2023, 25, 15–25. (In Chinese) [Google Scholar]
- Bai, P.F.; Hayes, R.A.; Jin, M.; Shui, L.; Yi, Z.; Li, W.; Zhang, X.; Zhou, G. Review of paper-like display technologies (invited review). Prog. Electromagn. Res. 2014, 147, 95–116. [Google Scholar] [CrossRef]
- Pitt, M.G.; Zehner, R.W.; Amudson, K.R.; Gates, H. Power consumption of micro-encapsulated electrophoretic display for smart handheld applications. SID Symp. Dig. Tech. Pap. 2012, 33, 1378–1381. [Google Scholar] [CrossRef]
- Li, W.; Wang, L.; Zhang, T.; Lai, S.; Liu, L.; He, W.; Zhou, G.; Yi, Z. Driving waveform design with rising gradient and sawtoothwave of electrowetting displays for ultra-low-power consumption(Article). Micromachines 2020, 11, 145. [Google Scholar] [CrossRef] [PubMed]
- Luo, Q.Y. Optimization of Image and Power Consumption of Color e-Paper Based on Multi-Objective Optimization and Deep Learning. Master’s Thesis, Zhongshan University, Zhongshan, China, 2020. (In Chinese). [Google Scholar]
- Kim, J.Y.; Hwang, H.S.; Jung, H.Y.; Park, C.W.; Souk, J.H. Power consumption reductive driving method for the electrophoretic display. Sid Symp. Dig. Tech. Pap. 2012, 39, 1843–1845. [Google Scholar] [CrossRef]
- Cheng, W.; Hu, Z.P.; Xiao, X.M. A Voltage-Driven Waveform Debugging Method for Reducing Power Consumption of Electronic Paper. Chinese Patent CN113539191A, 22 October 2021. (In Chinese). [Google Scholar]
- Yang, Y.; Wang, T.J.; Jin, Y. Application of polymer materials in microcapsule electrophoretic display technology. Polym. Mater. Sci. Eng. 2005, 1–4+9. (In Chinese) [Google Scholar] [CrossRef]
- Yang, B.R.; Hu, W.J.; Zeng, Z.; Wu, Z.Y.; Gu, Y.F.; Xu, J.Z.; Cao, J.X.; Zhang, Y.D.; Chen, P. Understanding the mechanisms of electronic ink operation. J. Soc. Inf. Disp. 2020, 29, 38–46. [Google Scholar] [CrossRef]
- Wang, J.; Feng, Y.Q.; Li, X.G.; Meng, S.X.; Xie, J.Y.; Li, G. Microencapsulated electrophoretic display technology. Chem. Bull. 2005, 432–437. (In Chinese) [Google Scholar]
- Zeng, Z.; Liu, G.; Yang, M.; Yang, J.; Liu, Y.; Zou, G.; Qin, Z.; Wang, X.; Deng, S.; Yang, B.; et al. Simulation and analysis of edge ghosting for microcapsule E-Paper based on particles dynamics. SID Symp. Dig. Tech. Pap. 2022, 53, 29–32. [Google Scholar] [CrossRef]
- Royal Philips Electronics plc. Driving Method for Electrophoretic Display with High Frame Rate and Low Peak Power Consumption. Chinese Patent CN200480025683.0, 18 October 2006. (In Chinese).
- Duan, F.B.; Bai, P.F.; Alex, H.; Zhou, G.F. Optimization study of electrophoretic e-paper driving waveform based on DC balance. Liq. Cryst. Disp. 2016, 31, 943–948. (In Chinese) [Google Scholar] [CrossRef]
- Zhou, G.F.; Yi, Z.C.; Wang, L.; Lu, W.X. Current status and prospect of electrophoretic e-paper driving waveform research. J. South China Norm. Univ. (Nat. Sci. Ed.) 2013, 45, 56–61. (In Chinese) [Google Scholar]
- IEC 62679-3-2:2013; Electronic Paper Display Part 3-2: Measuring Method Electro-Optical. International organization-International Electrotechnical Commission: Geneva, Switzerland, 2024.
- GB/T 43789.32-2024; Electronic Paper Display Devices Part 3-2: Optical Performance Test Methods. State Administration for Market Supervision and Regulation, National Technical Committee for the Standardization of Electronic Display Devices. 2024. Available online: https://std.samr.gov.cn/gb/search/gbDetailed?id=14156507D2860337E06397BE0A0AE656 (accessed on 15 March 2024). (In Chinese)
- GB 24850-2020; Energy Efficiency Limit Values and Energy Efficiency Ratings for Flat-panel Televisions and Set-Top Boxes. State Administration of Market Supervision and Administration, National Standardization Administration: 2020. Available online: https://std.samr.gov.cn/gb/search/gbDetailed?id=AB2CA7A65EFC3FD1E05397BE0A0A98CA (accessed on 1 August 2021). (In Chinese)


| Refresh Power (W) | Static Display Power (W) | |
|---|---|---|
| Conventional Driving Waveforms | 0.4852 | 0.4055 |
| Low-power Driving Waveforms | 0.4798 |
| Experimental Scenario | Pt (W) | Pl (W) | Optimal Value ΔP (W) | Upt/Uwt (%) | Upl (%) | Uwl (%) |
|---|---|---|---|---|---|---|
| 1 | 0.5652 | 0.5256 | 0.0396 | 37.38 | 27.76 | 6.47 |
| 2 | 0.5323 | 0.5065 | 0.0258 | 29.39 | 23.12 | 2.60 |
| 3 | 0.4964 | 0.4858 | 0.0106 | 20.66 | 18.08 | −1.6 |
| 4 | 0.5797 | 0.5333 | 0.0464 | 40.91 | 29.63 | 8.03 |
| 5 | 0.5308 | 0.5053 | 0.0255 | 29.02 | 22.82 | 2.35 |
| 6 | 0.5068 | 0.4916 | 0.0152 | 23.19 | 19.49 | −0.42 |
| 7 | 0.5689 | 0.5272 | 0.0417 | 38.28 | 28.15 | 6.79 |
| 8 | 0.5349 | 0.5077 | 0.0272 | 30.02 | 23.41 | 2.84 |
| 9 | 0.5142 | 0.4963 | 0.0179 | 24.99 | 20.64 | 0.53 |
| average | 0.5366 | 0.5088 | 0.0278 | 30.43 | 23.68 | 3.06 |
Disclaimer/Publisher’s Note: The statements, opinions and data contained in all publications are solely those of the individual author(s) and contributor(s) and not of MDPI and/or the editor(s). MDPI and/or the editor(s) disclaim responsibility for any injury to people or property resulting from any ideas, methods, instructions or products referred to in the content. |
© 2024 by the authors. Licensee MDPI, Basel, Switzerland. This article is an open access article distributed under the terms and conditions of the Creative Commons Attribution (CC BY) license (https://creativecommons.org/licenses/by/4.0/).
Share and Cite
Lin, S.; Zhang, J.; Wei, J.; Xie, X.; Lv, S.; Mei, T.; Wang, T.; Cai, B.; Mao, W.; Guo, T.; et al. Low-Power Driving Waveform Design for Improving the Display Effect of Electrophoretic Electronic Paper. Micromachines 2024, 15, 1076. https://doi.org/10.3390/mi15091076
Lin S, Zhang J, Wei J, Xie X, Lv S, Mei T, Wang T, Cai B, Mao W, Guo T, et al. Low-Power Driving Waveform Design for Improving the Display Effect of Electrophoretic Electronic Paper. Micromachines. 2024; 15(9):1076. https://doi.org/10.3390/mi15091076
Chicago/Turabian StyleLin, Shanling, Jianhao Zhang, Jia Wei, Xinxin Xie, Shanhong Lv, Ting Mei, Tingyu Wang, Bipeng Cai, Wenjie Mao, Tailiang Guo, and et al. 2024. "Low-Power Driving Waveform Design for Improving the Display Effect of Electrophoretic Electronic Paper" Micromachines 15, no. 9: 1076. https://doi.org/10.3390/mi15091076
APA StyleLin, S., Zhang, J., Wei, J., Xie, X., Lv, S., Mei, T., Wang, T., Cai, B., Mao, W., Guo, T., Lin, J., & Lin, Z. (2024). Low-Power Driving Waveform Design for Improving the Display Effect of Electrophoretic Electronic Paper. Micromachines, 15(9), 1076. https://doi.org/10.3390/mi15091076