
Nonlinear Waveform Optimization for Enhanced Ink Droplet Formation in Material Jetting


Abstract
:1. Introduction
2. Experimental Details
2.1. Ink Composition and Rheological Properties
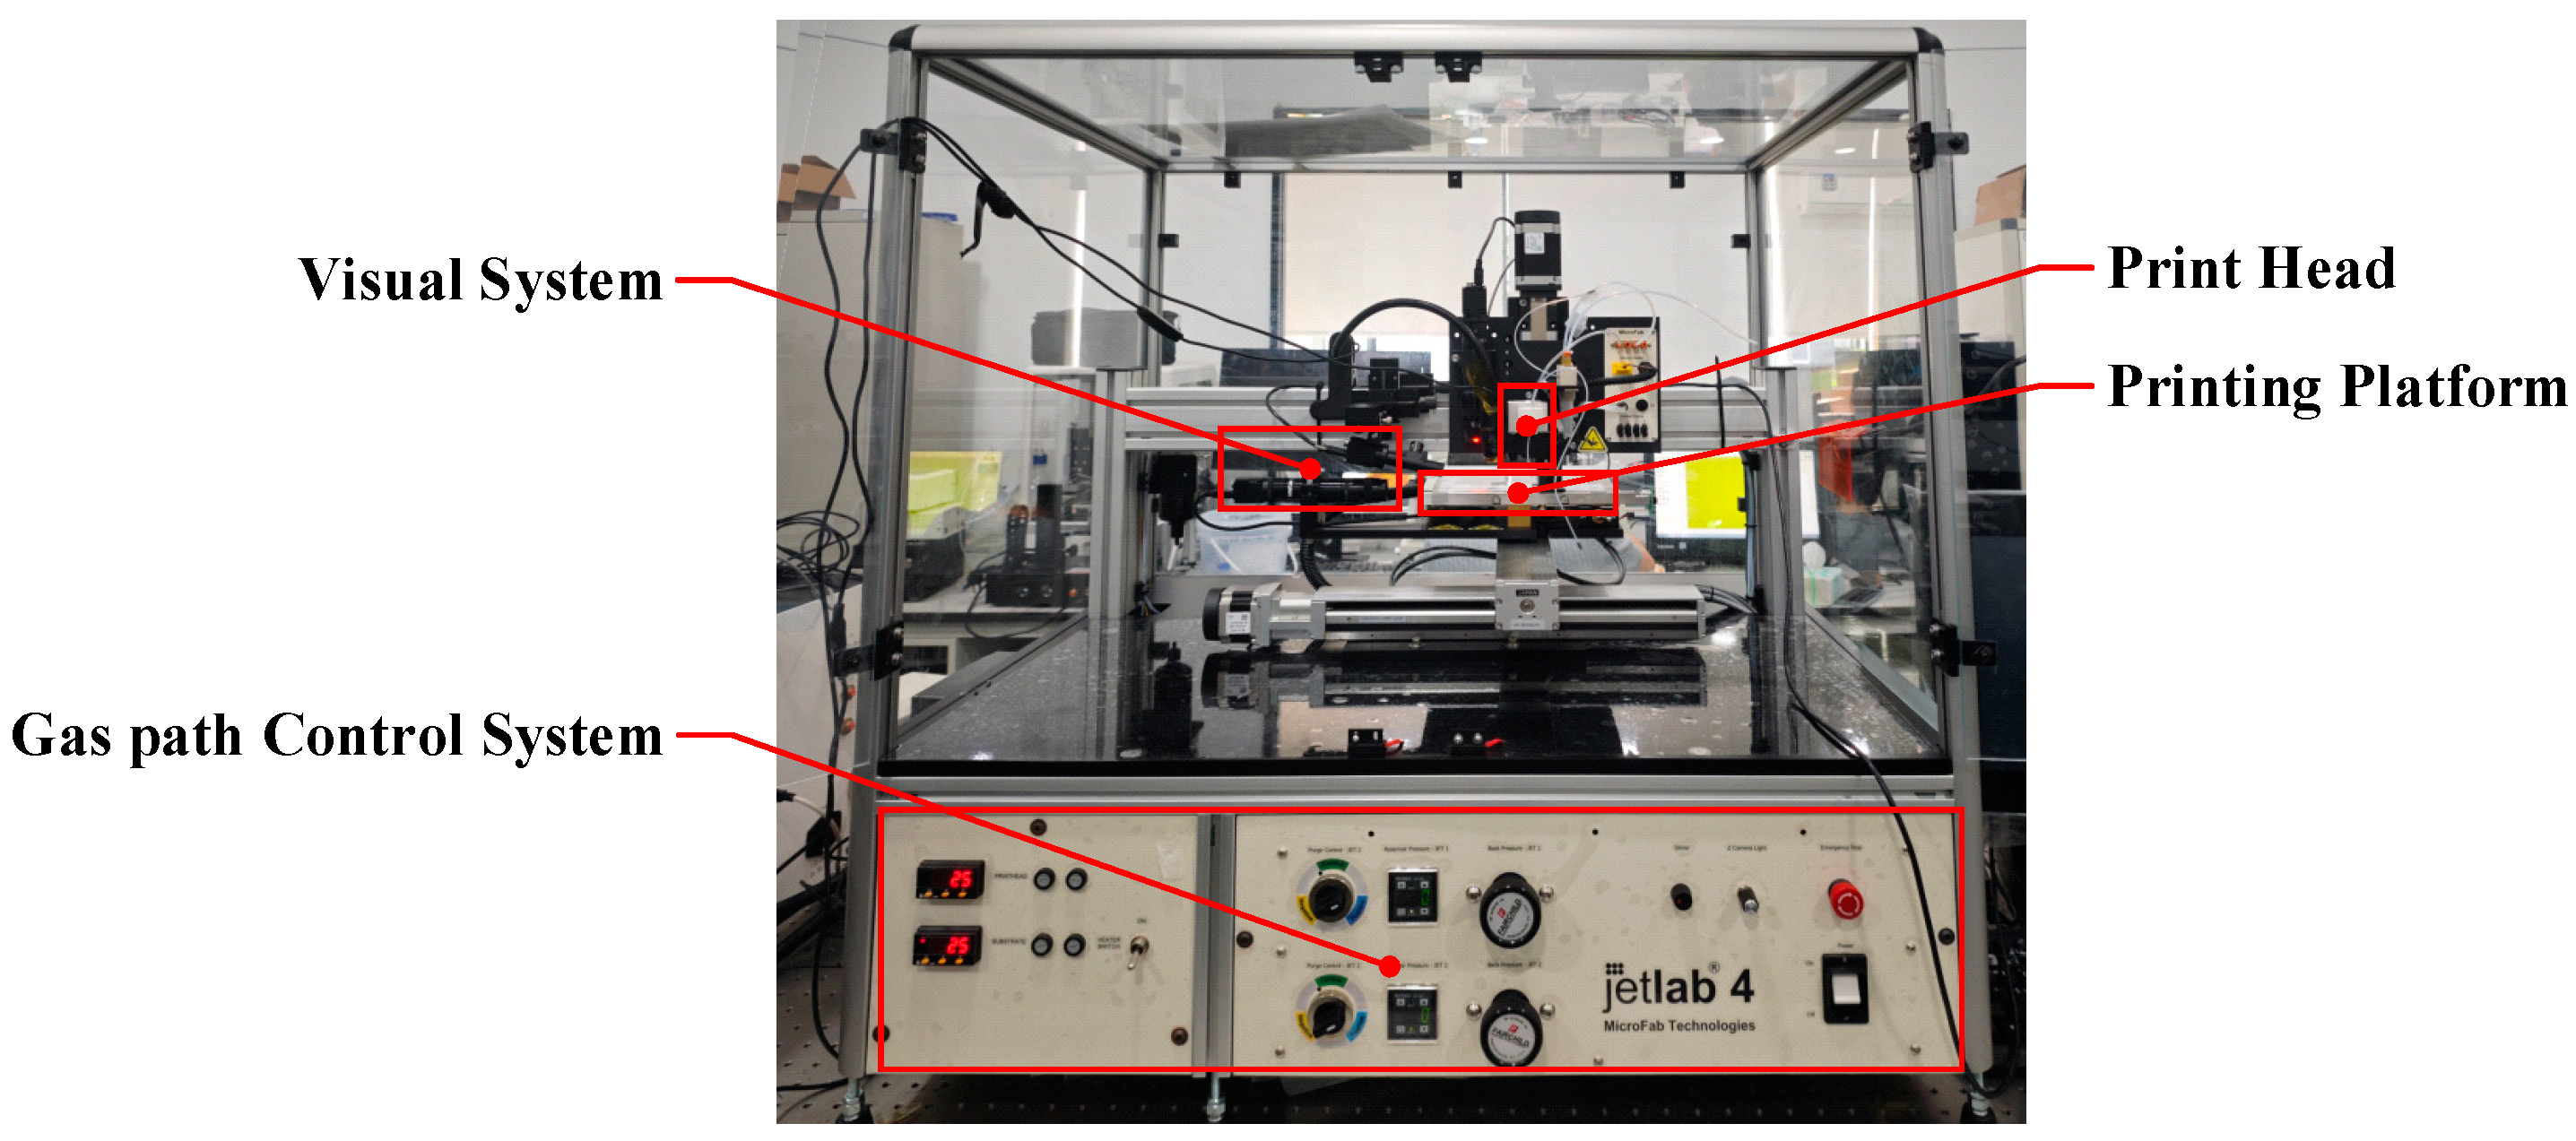
2.2. Inkjet Observation System
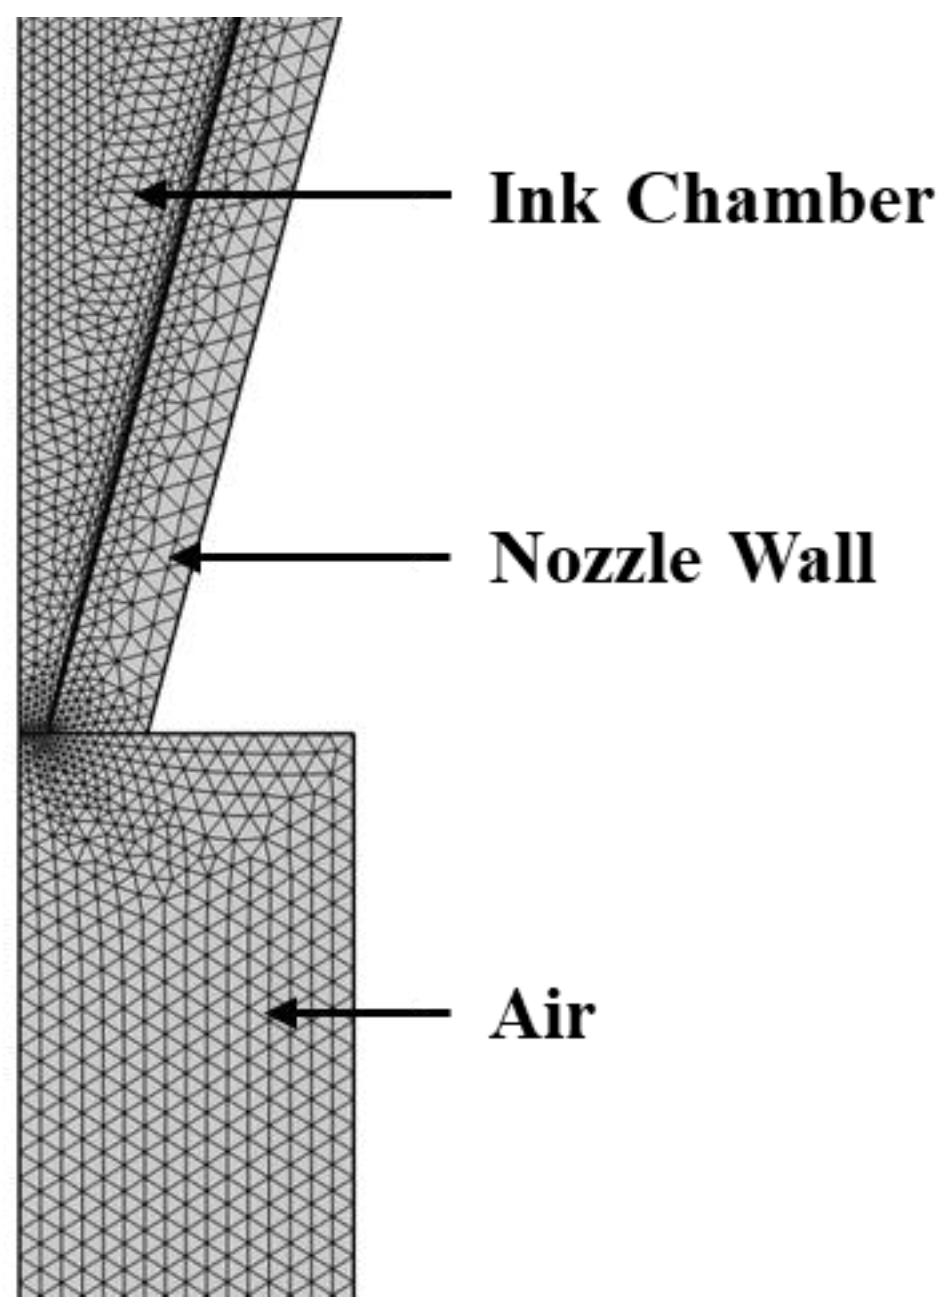
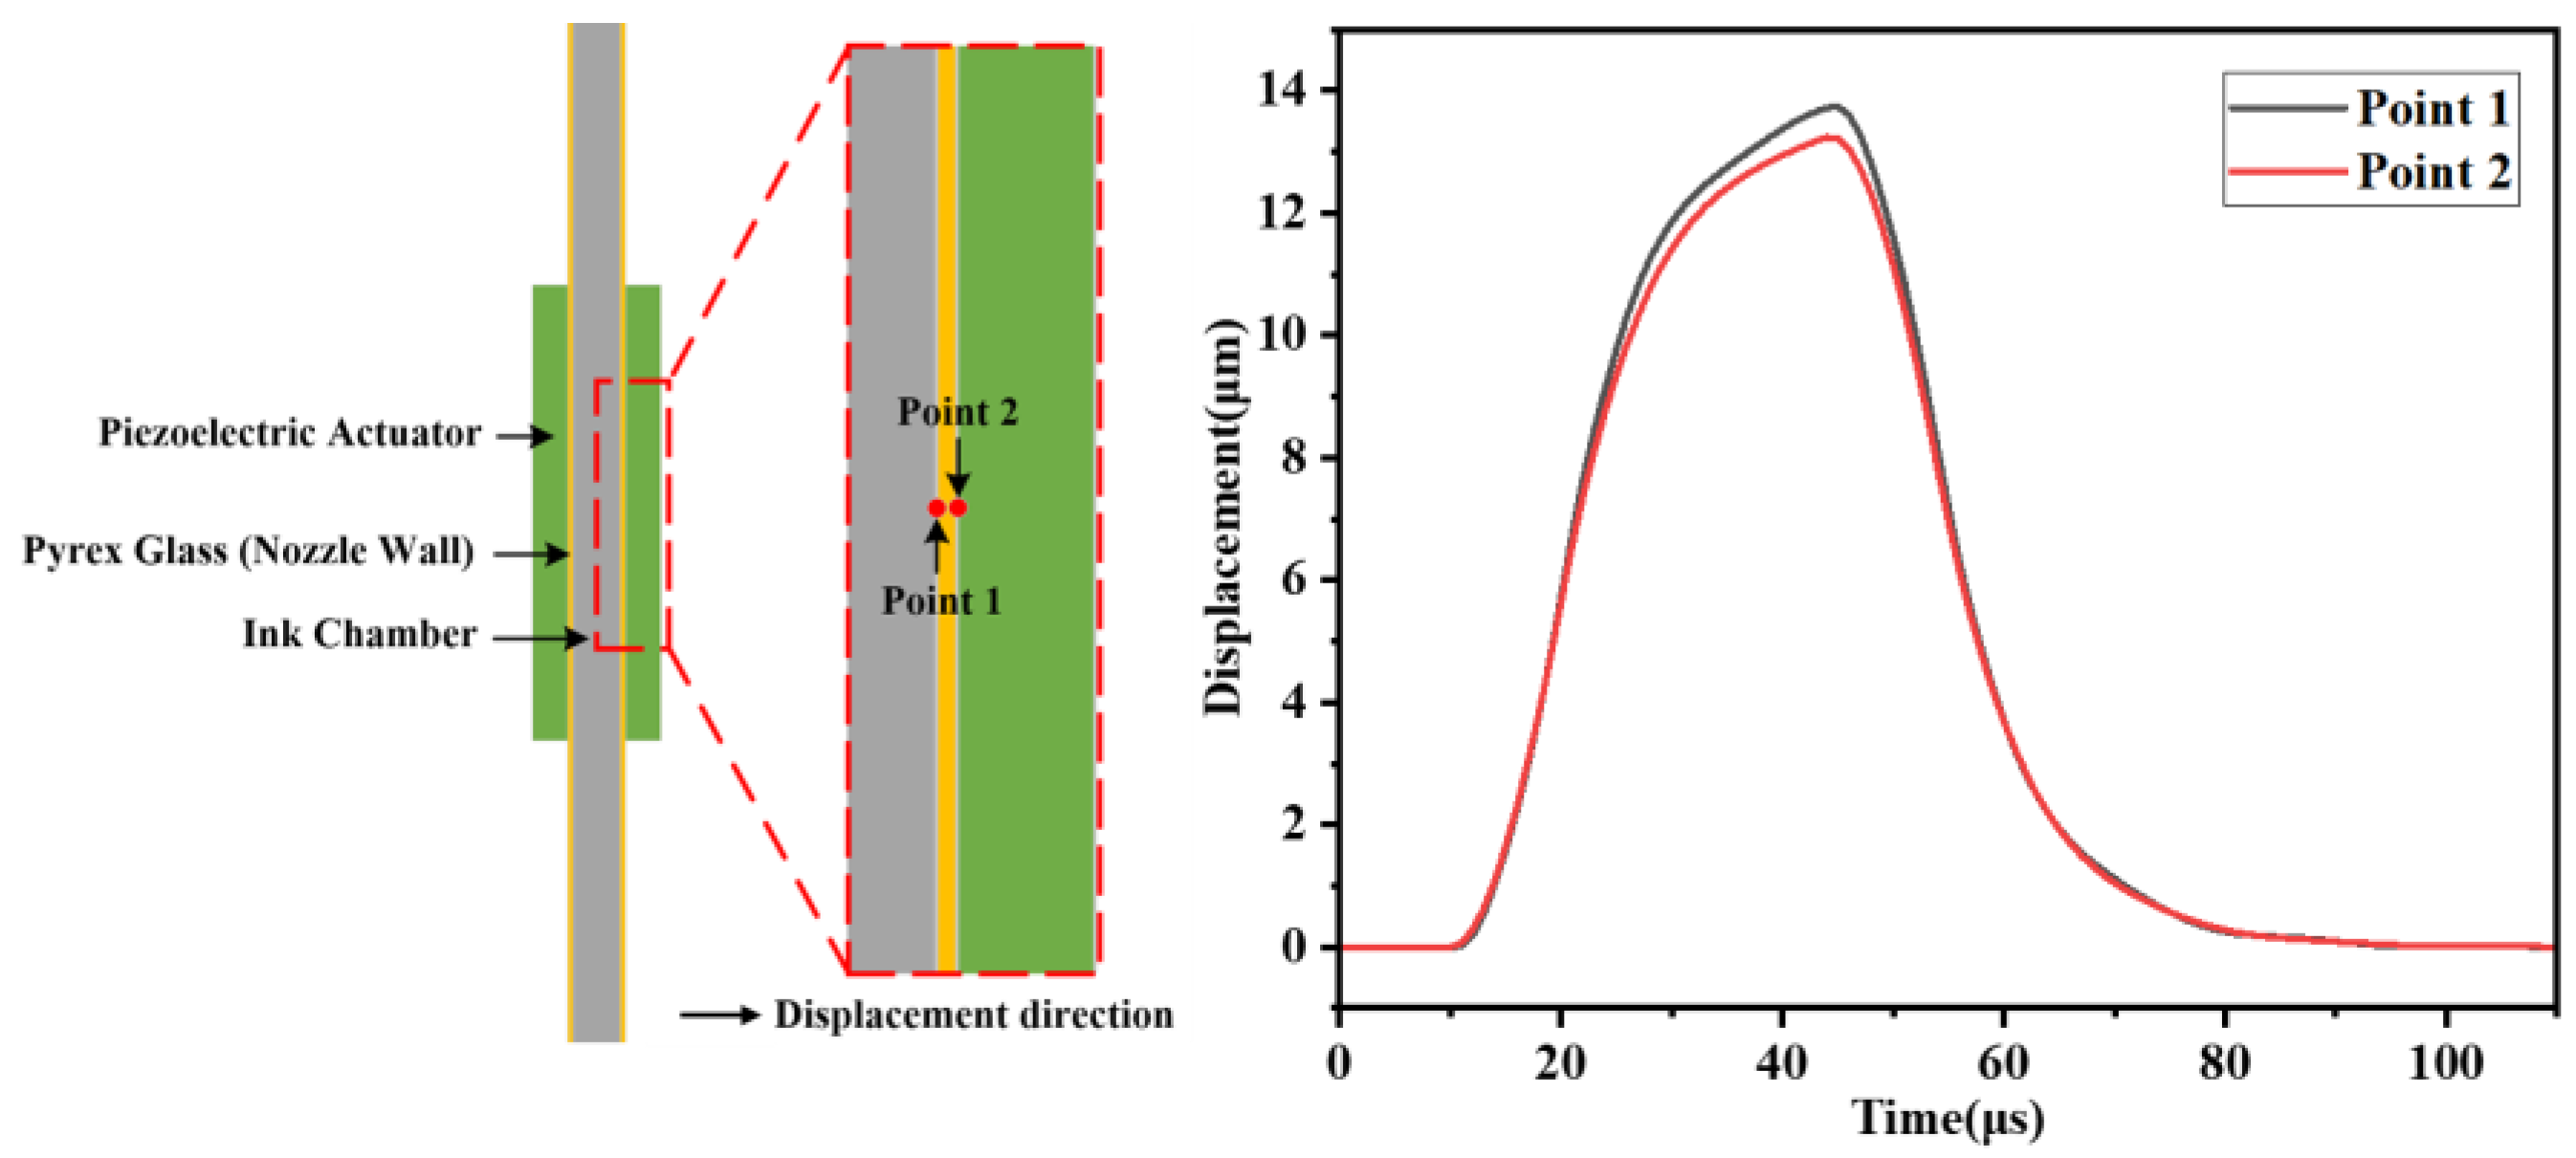
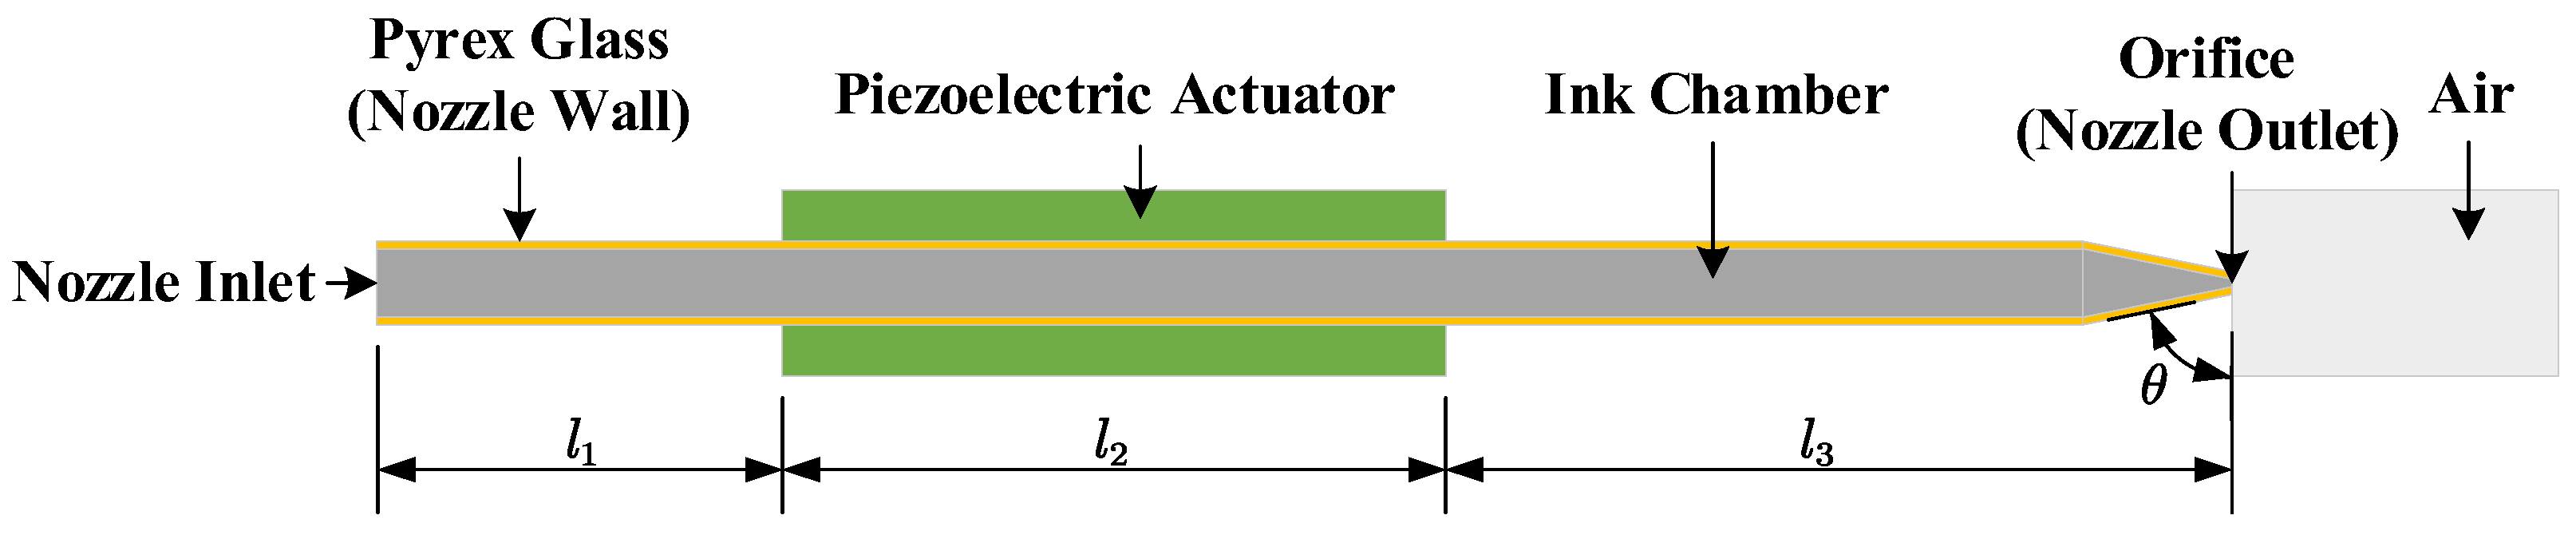
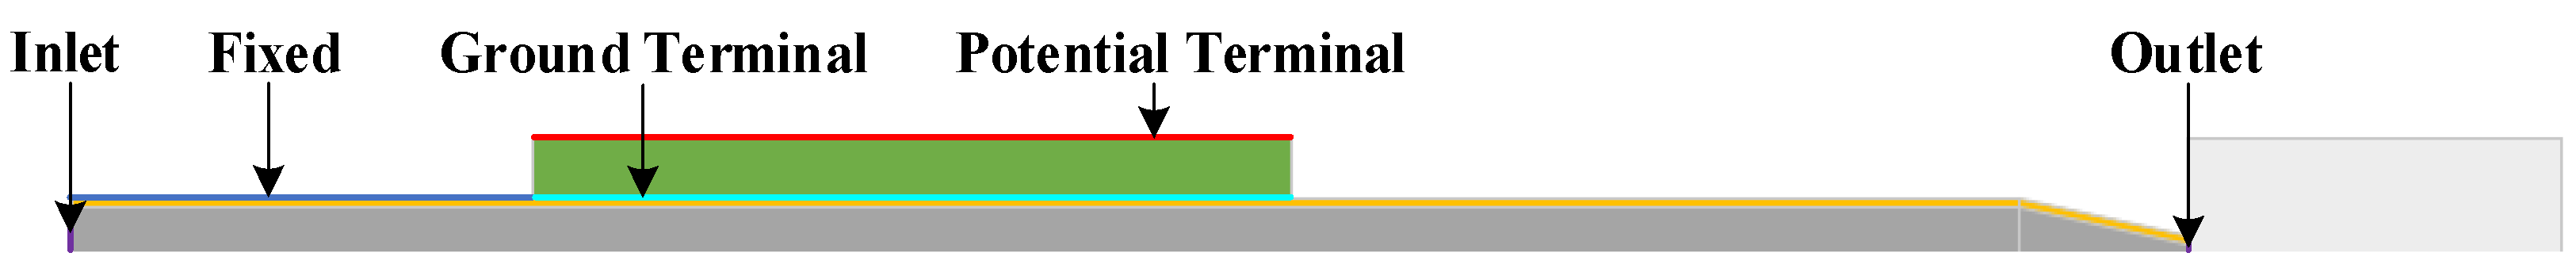
2.3. Model Setup
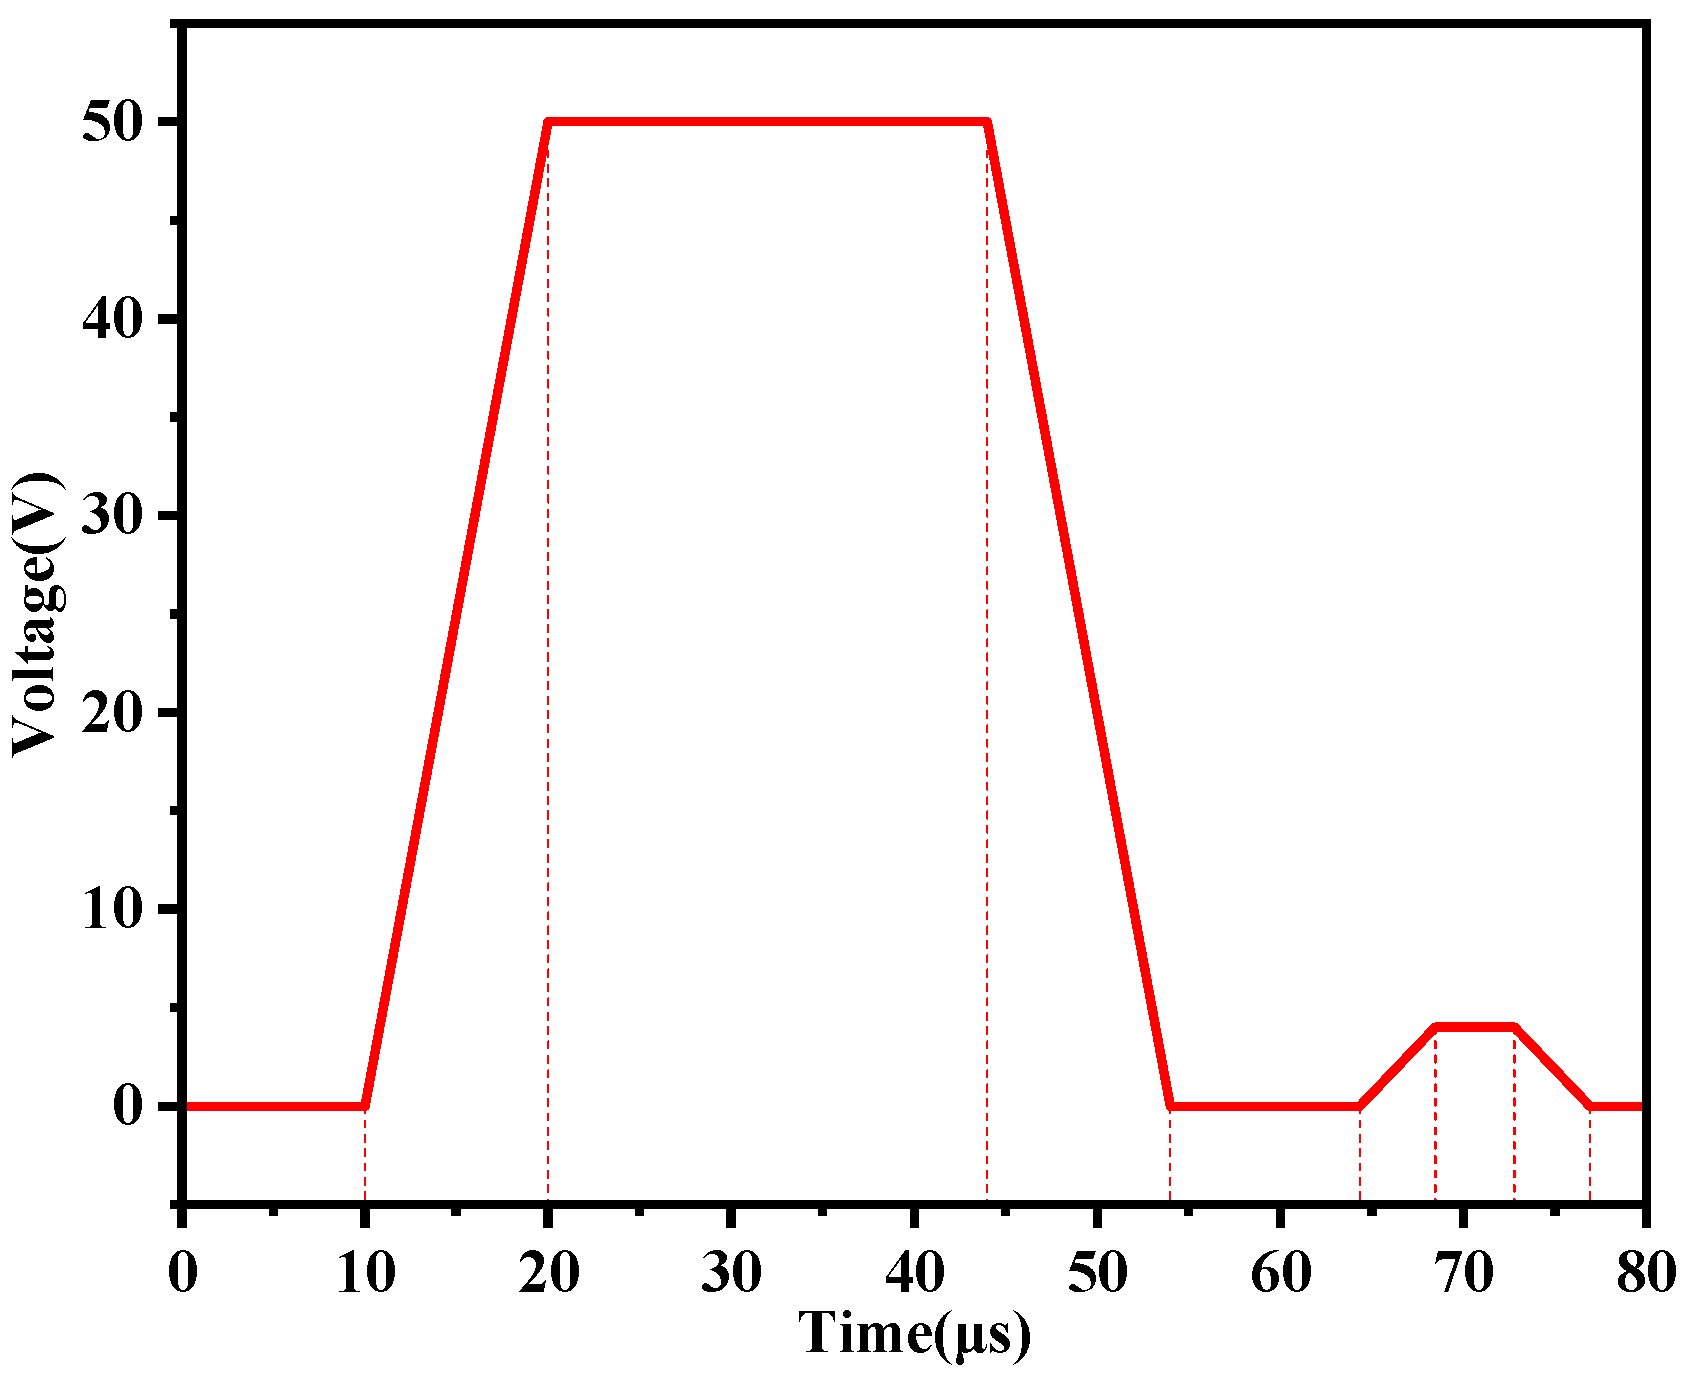
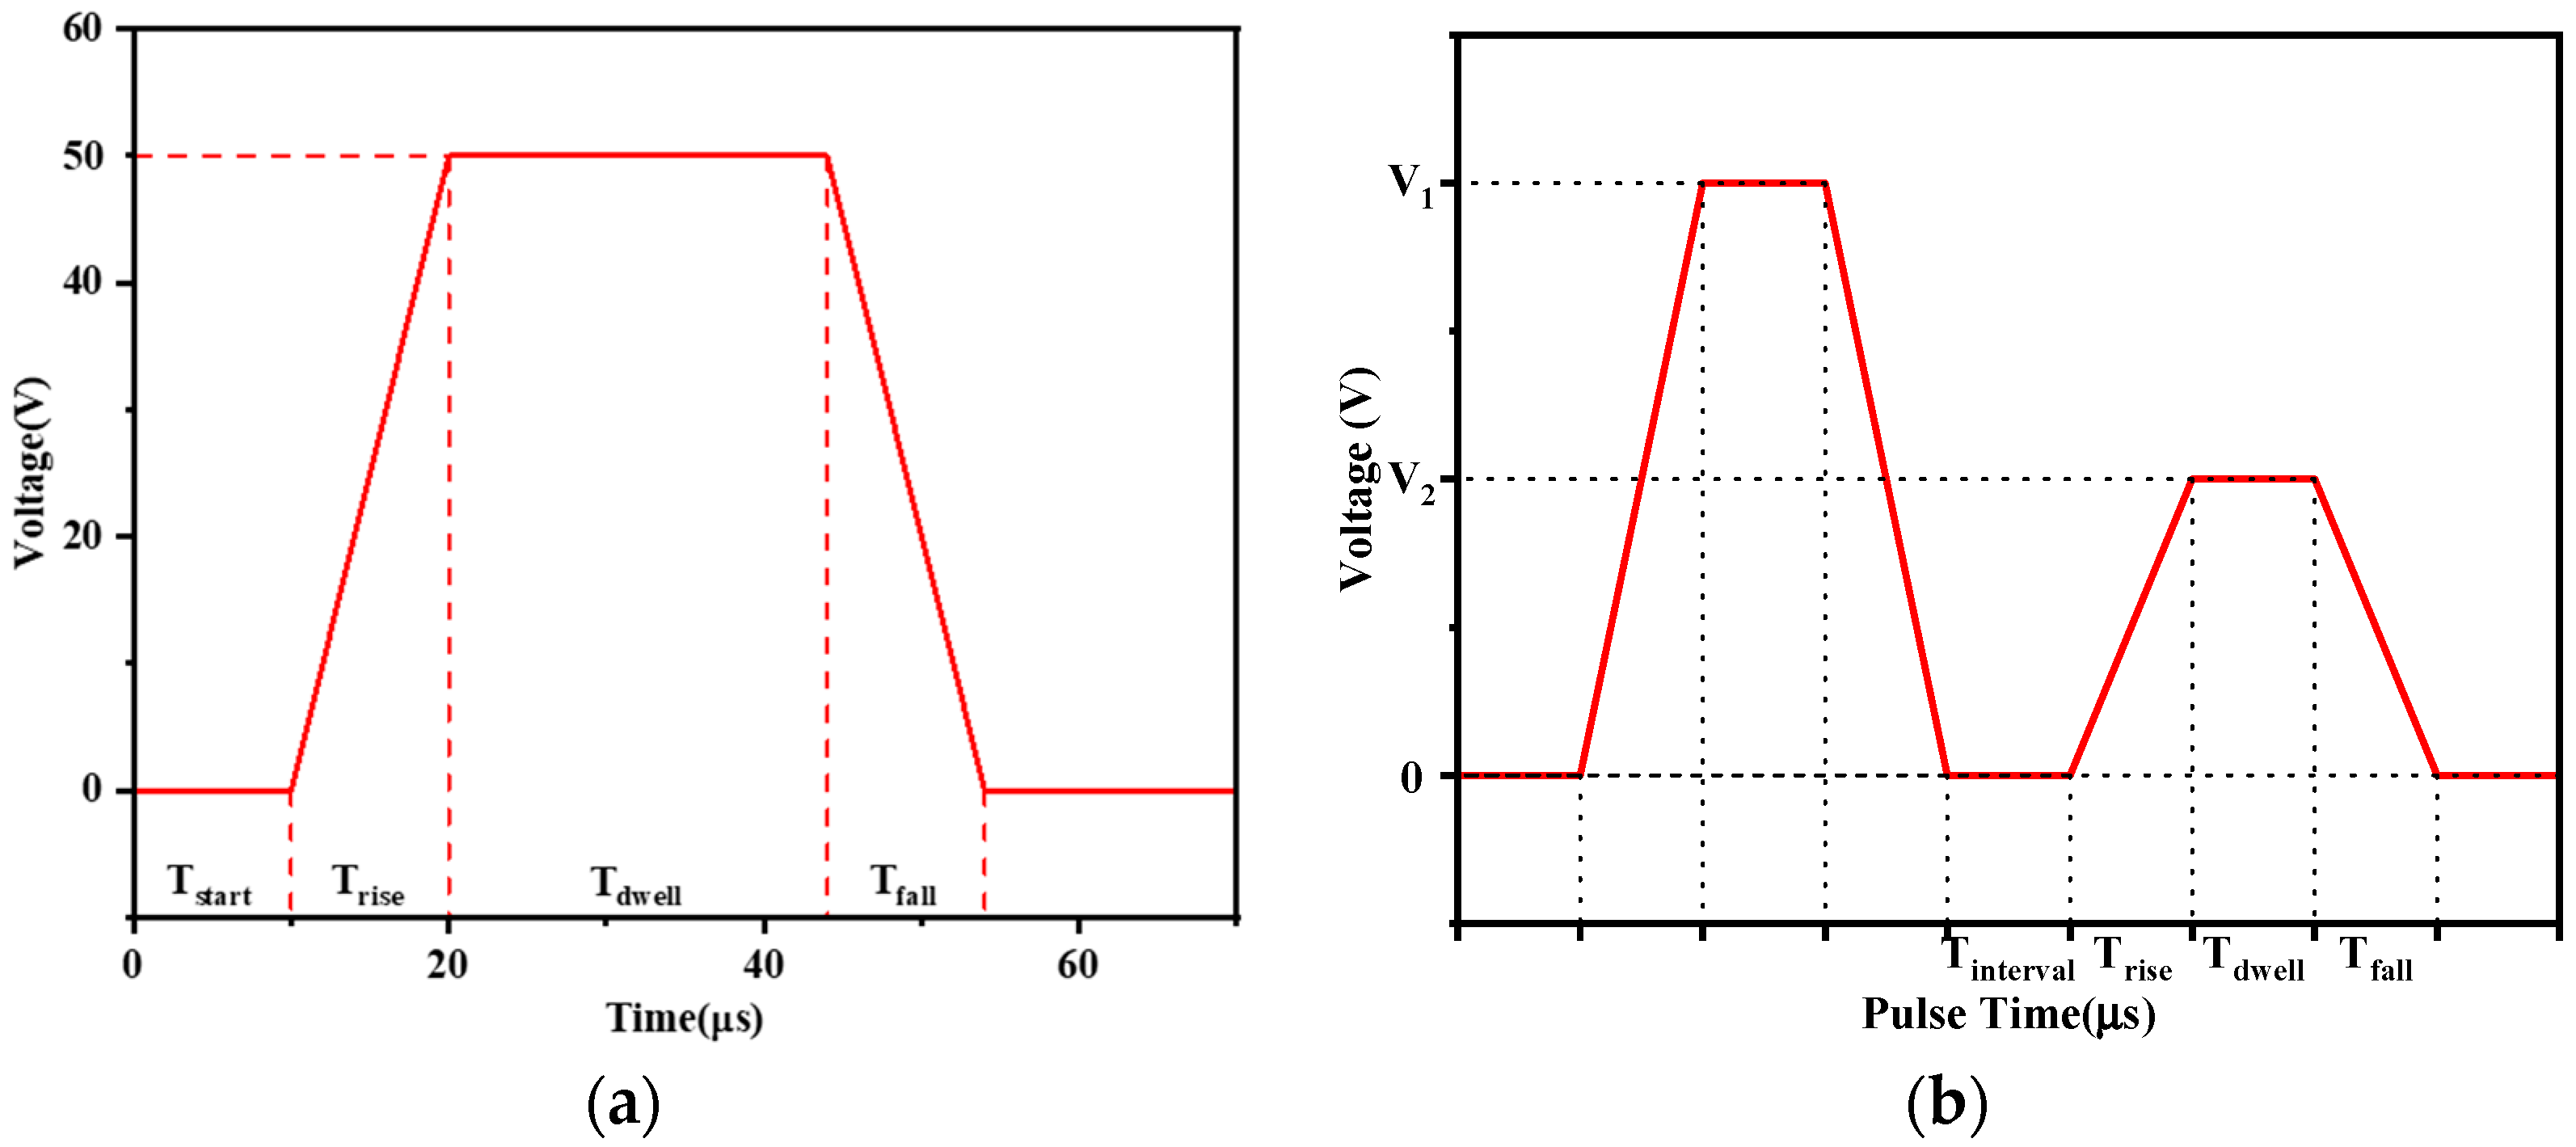
2.4. Drive Waveform
3. Simulation Results and Discussion
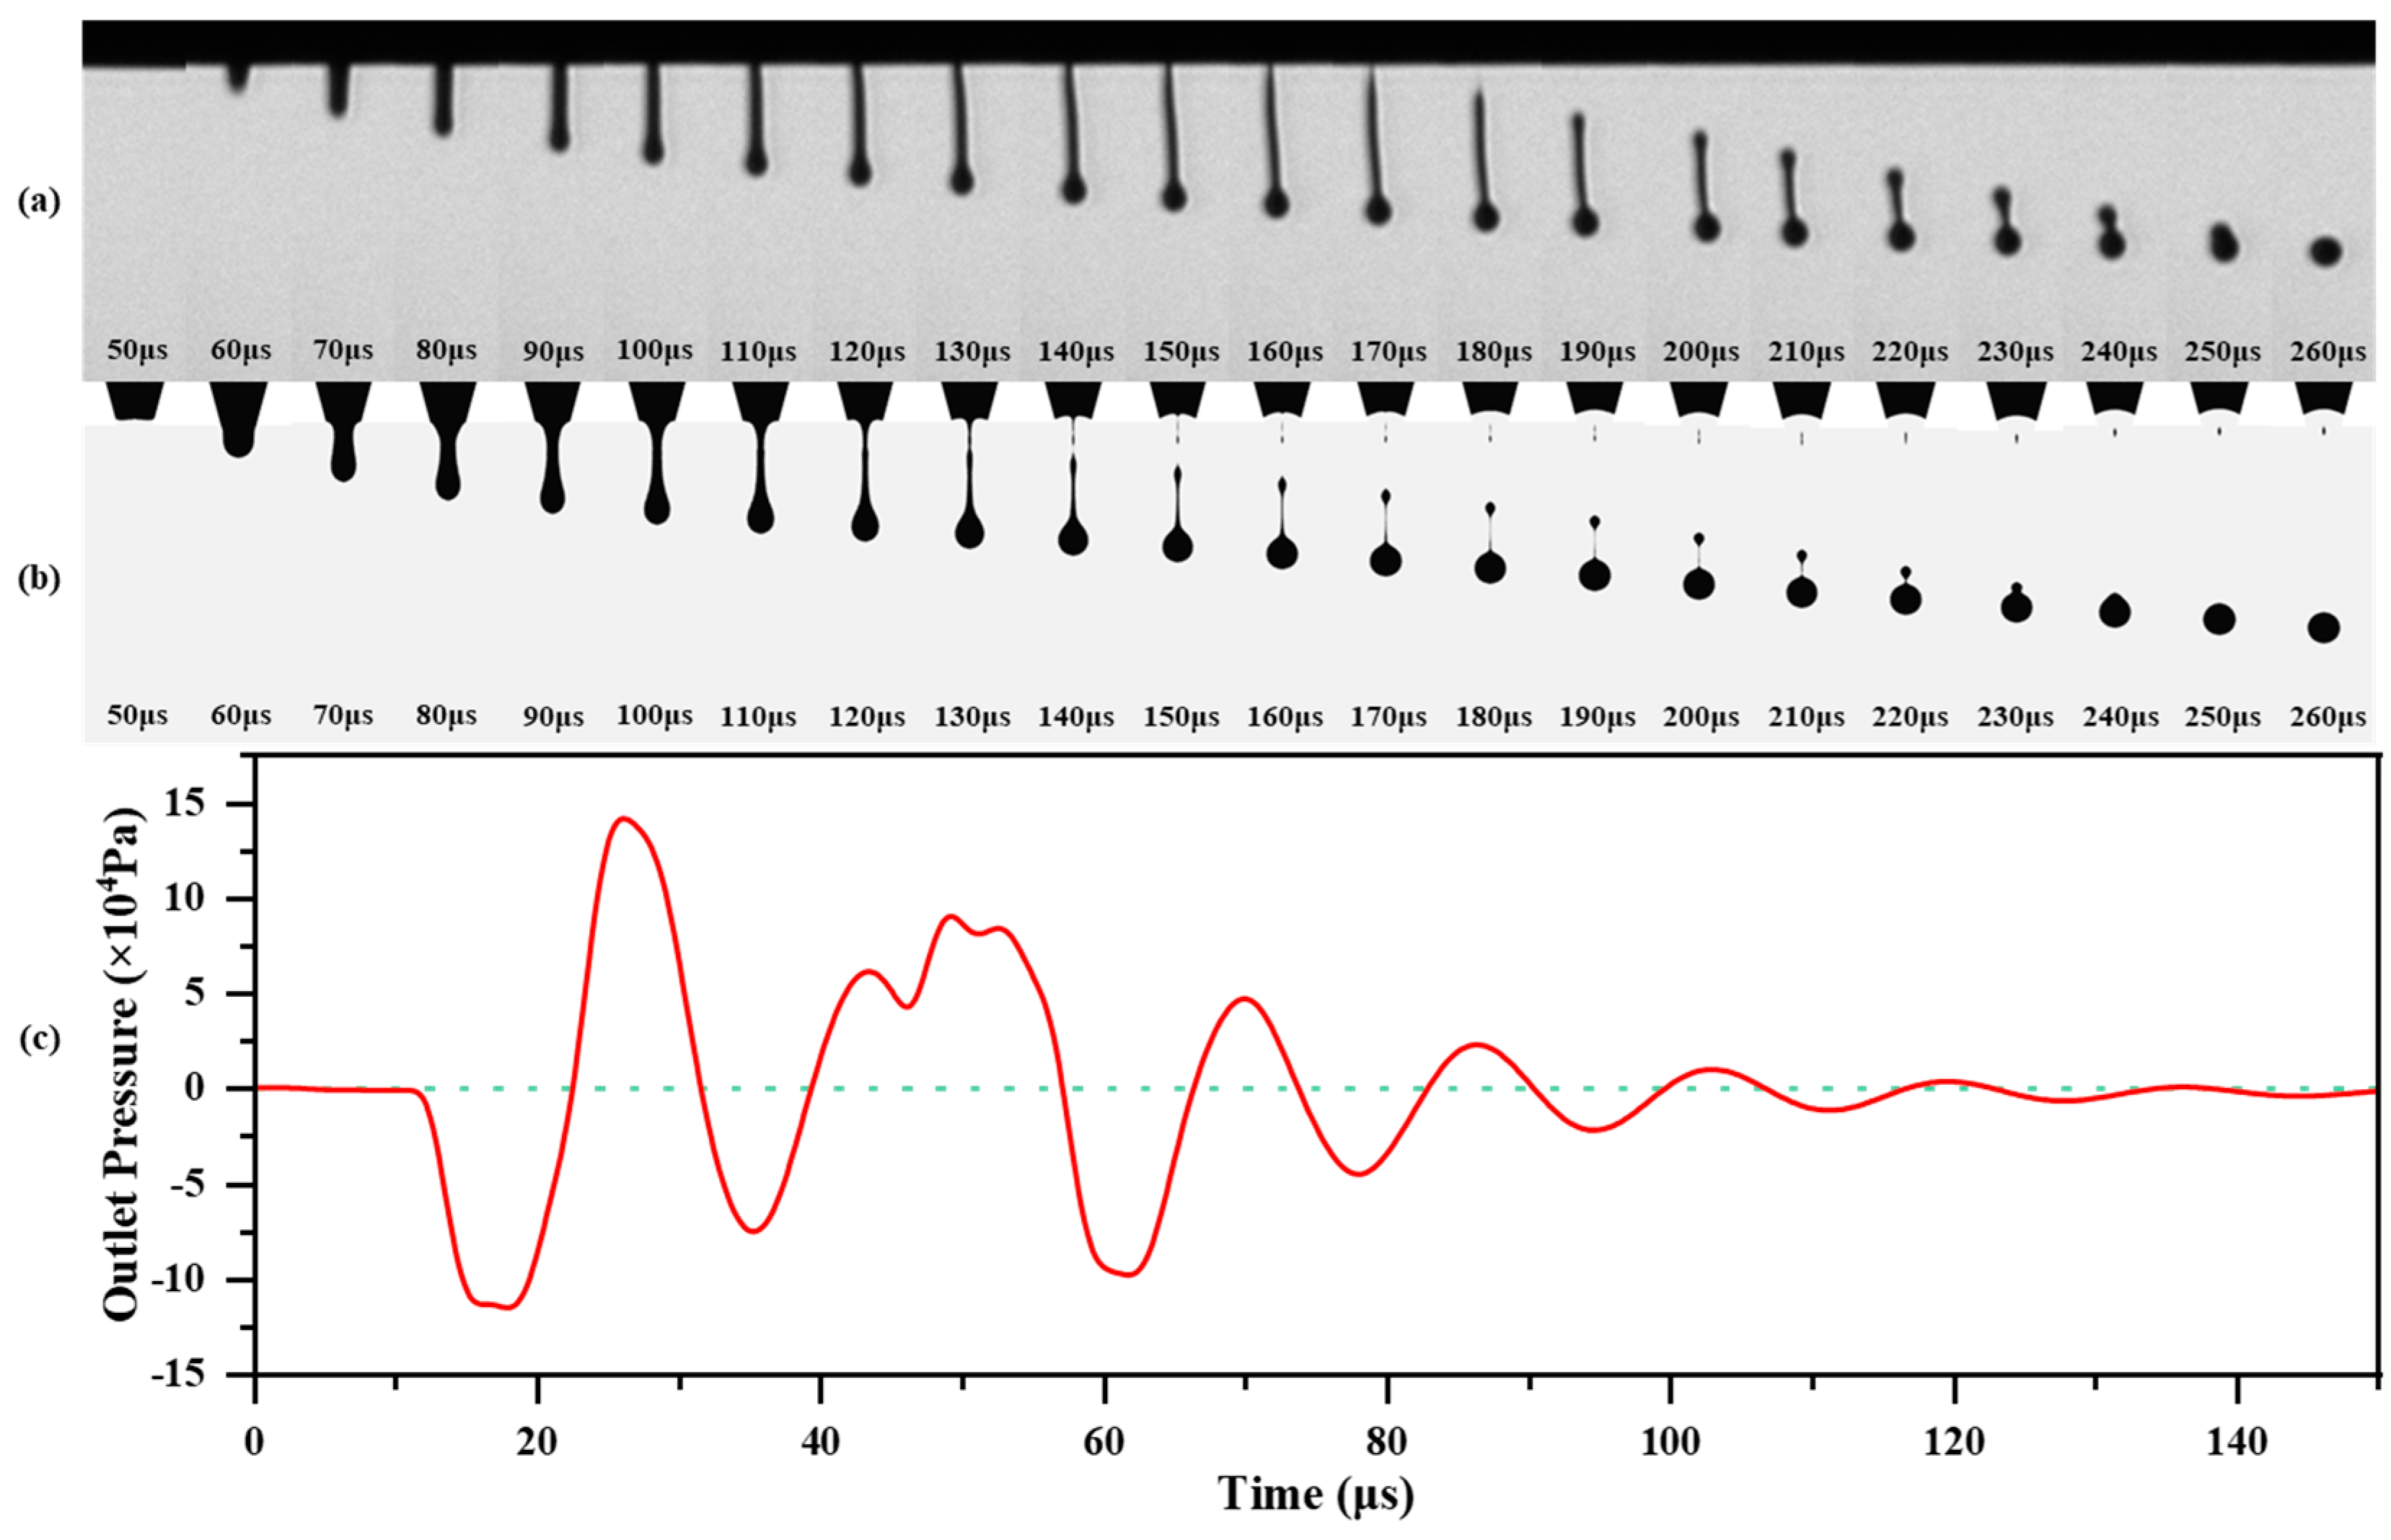
3.1. Droplet Formation Process
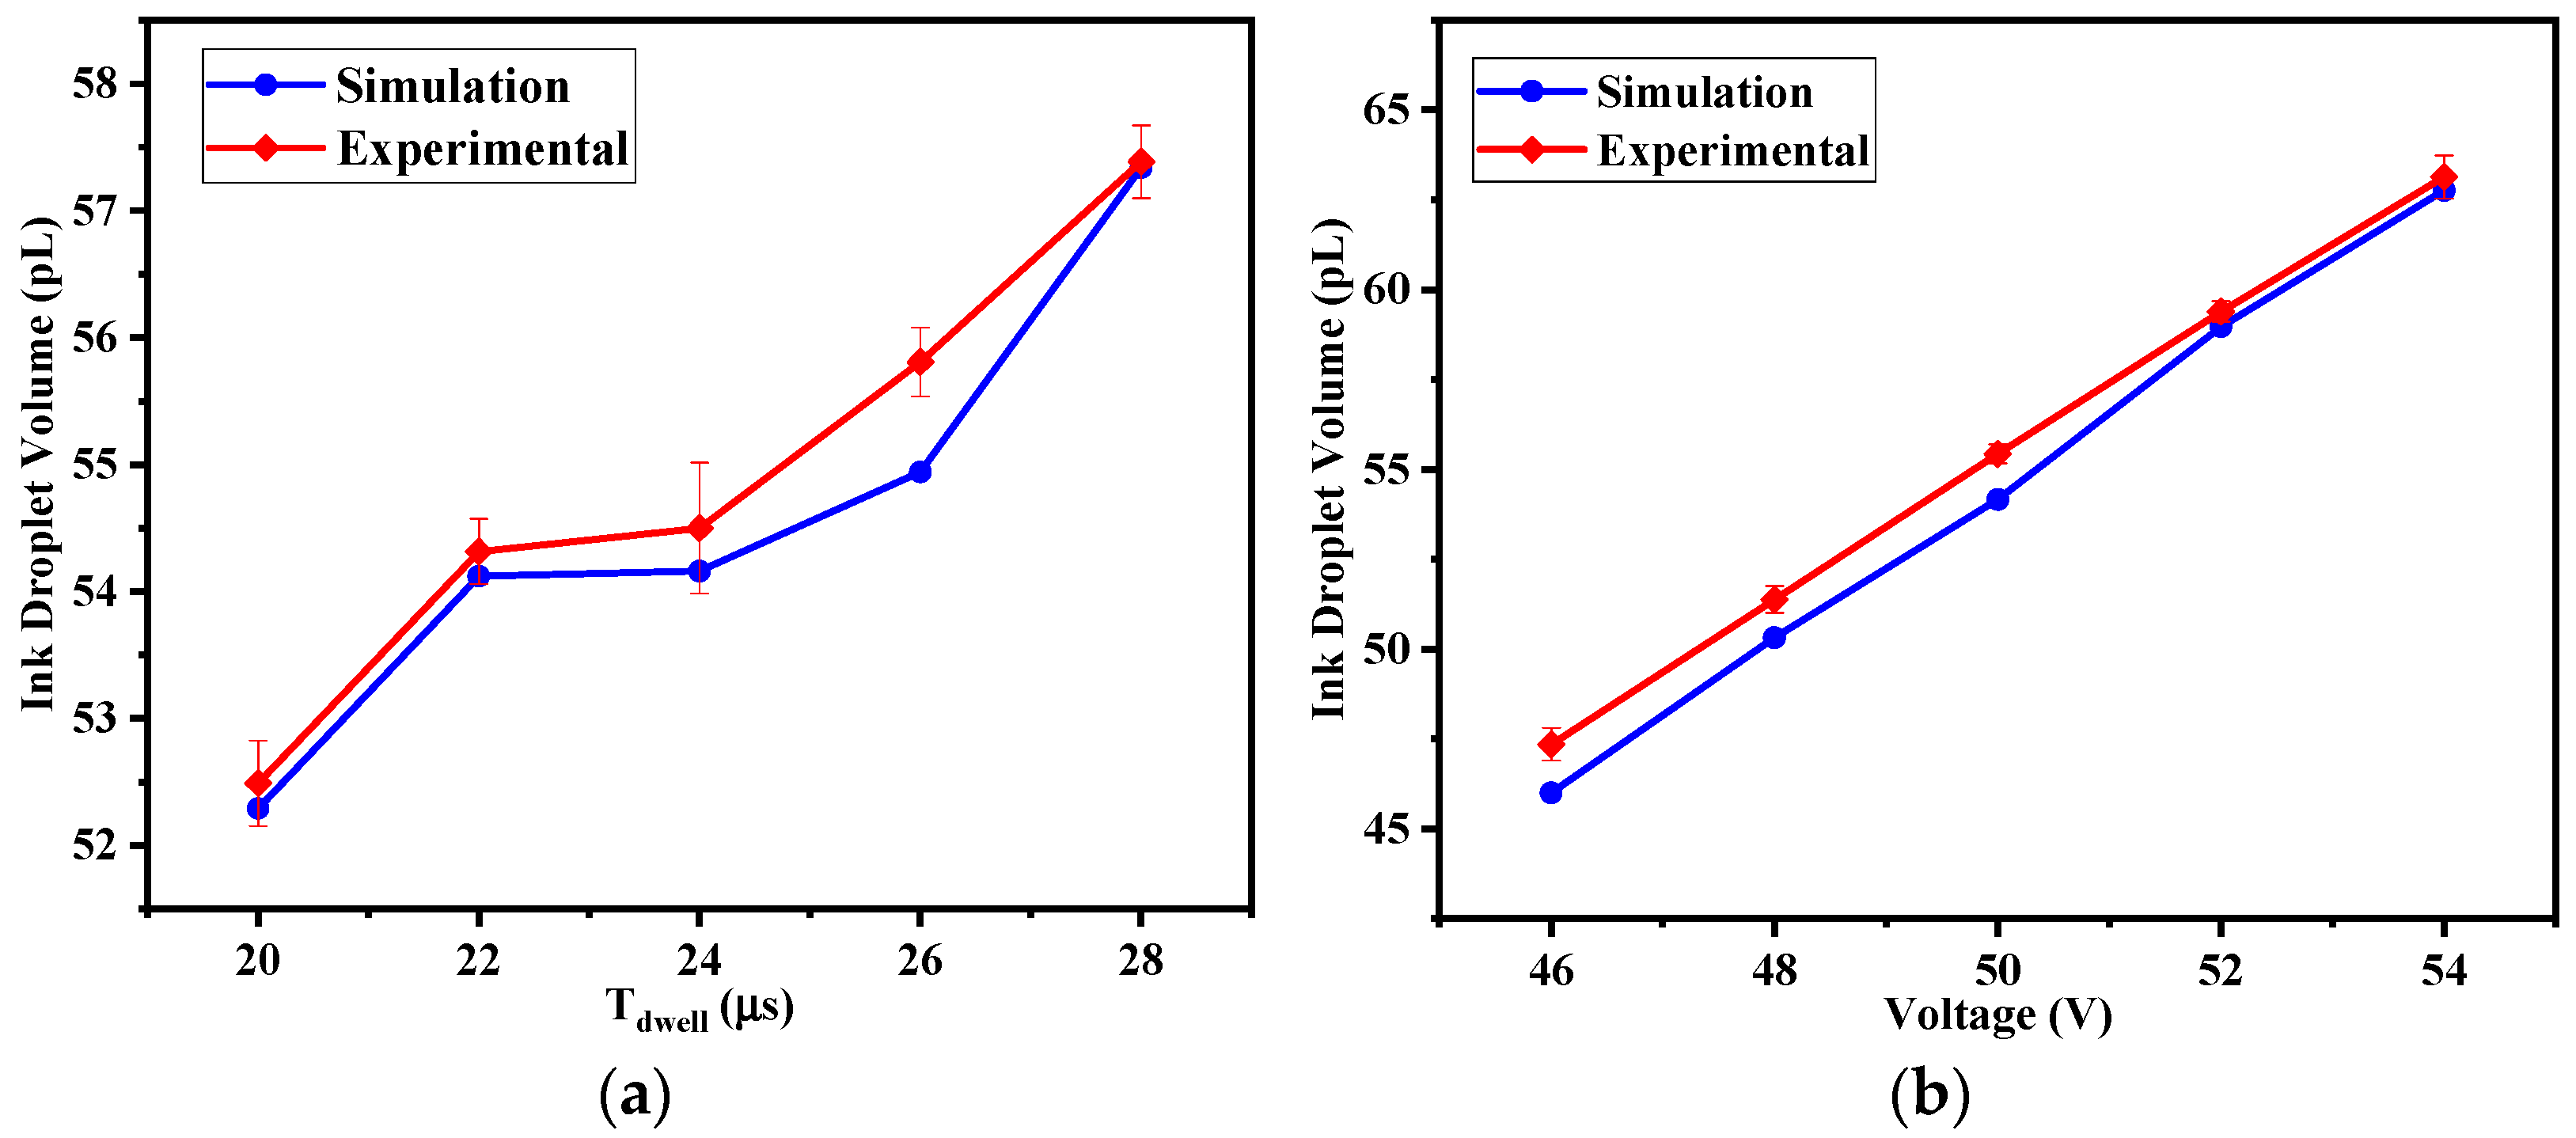
3.2. Effect of Waveform Parameters
3.3. Desired Pressure Fluctuation
4. Waveform Optimization
| Algorithm 1. Pseudocode for waveform optimization method—CNN-PSO |
| Begin Input: Ink Droplet Ejection Simulation Data Initialize the Convolutional Neural Network (CNN) model parameters Train the CNN model while (training stopping condition not met) do for each batch of data in the training set do Perform forward propagation to calculate predictions Compute loss value Update CNN weights through backpropagation End End Save the trained CNN model Initialize the particle swarm while (stopping condition not met) do for each particle in the swarm do Use the trained CNN model to calculate the fitness value of the current particle if (current fitness value is better than the individual best fitness value ) then Update individual best position End if (current fitness value is better than the global best fitness value ) then Update global best position End Update particle velocity and position End End End Return the global best position |
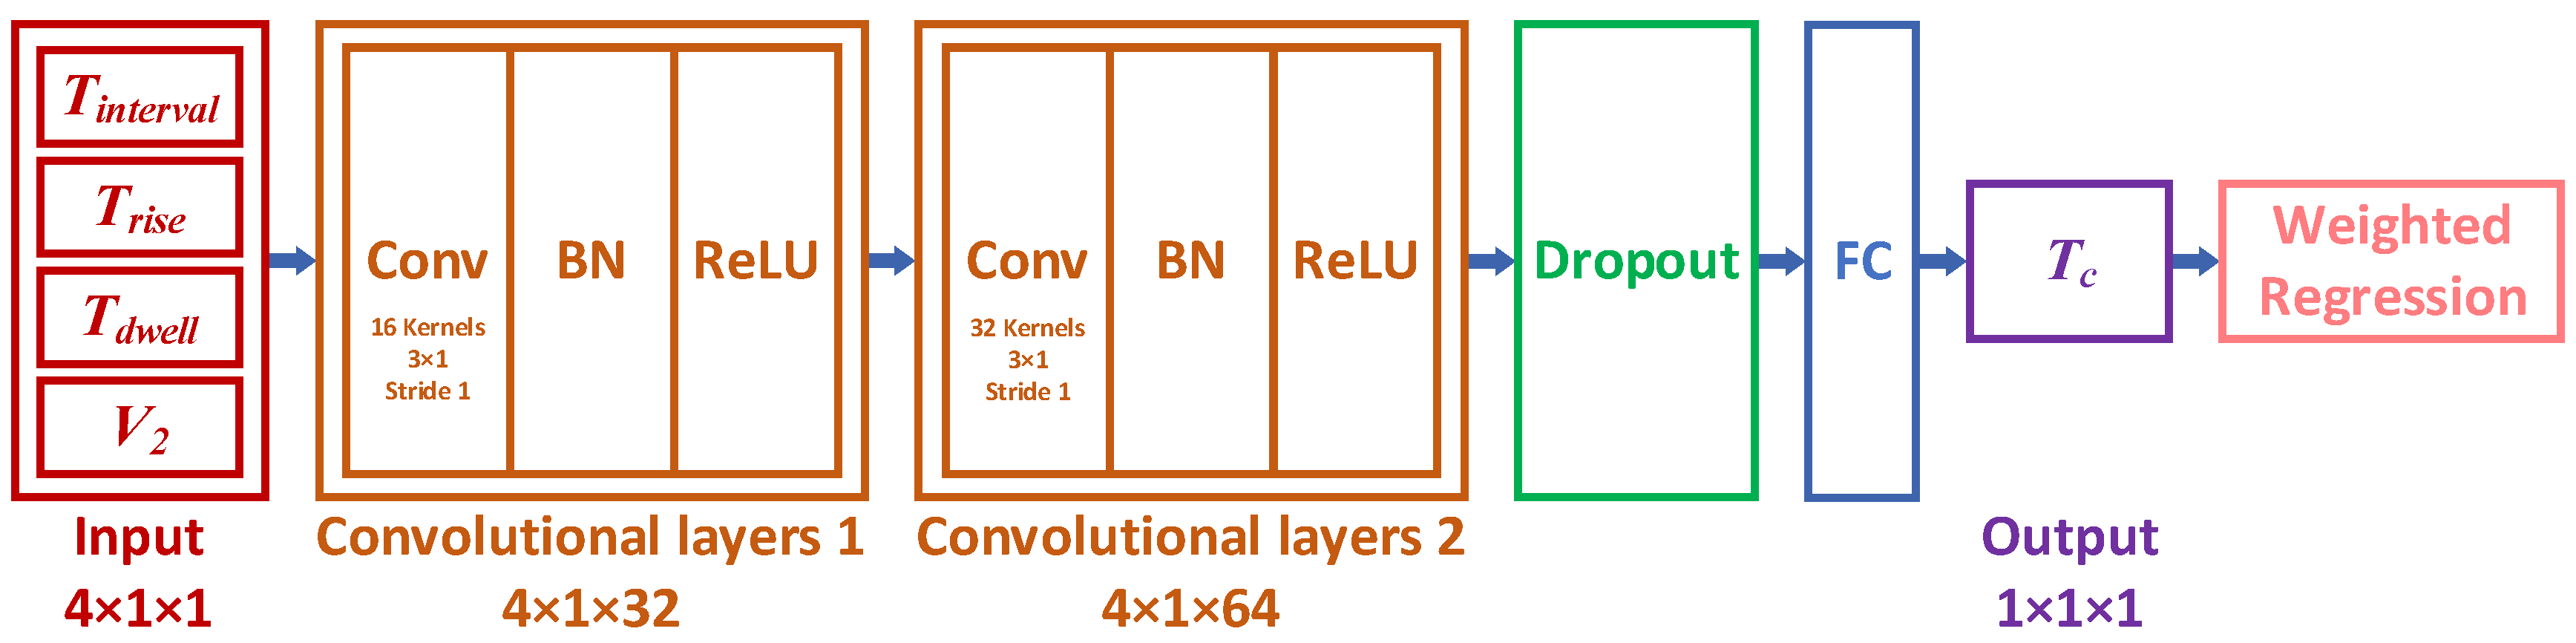
4.1. Pressure Fluctuation Convergence Regression Model
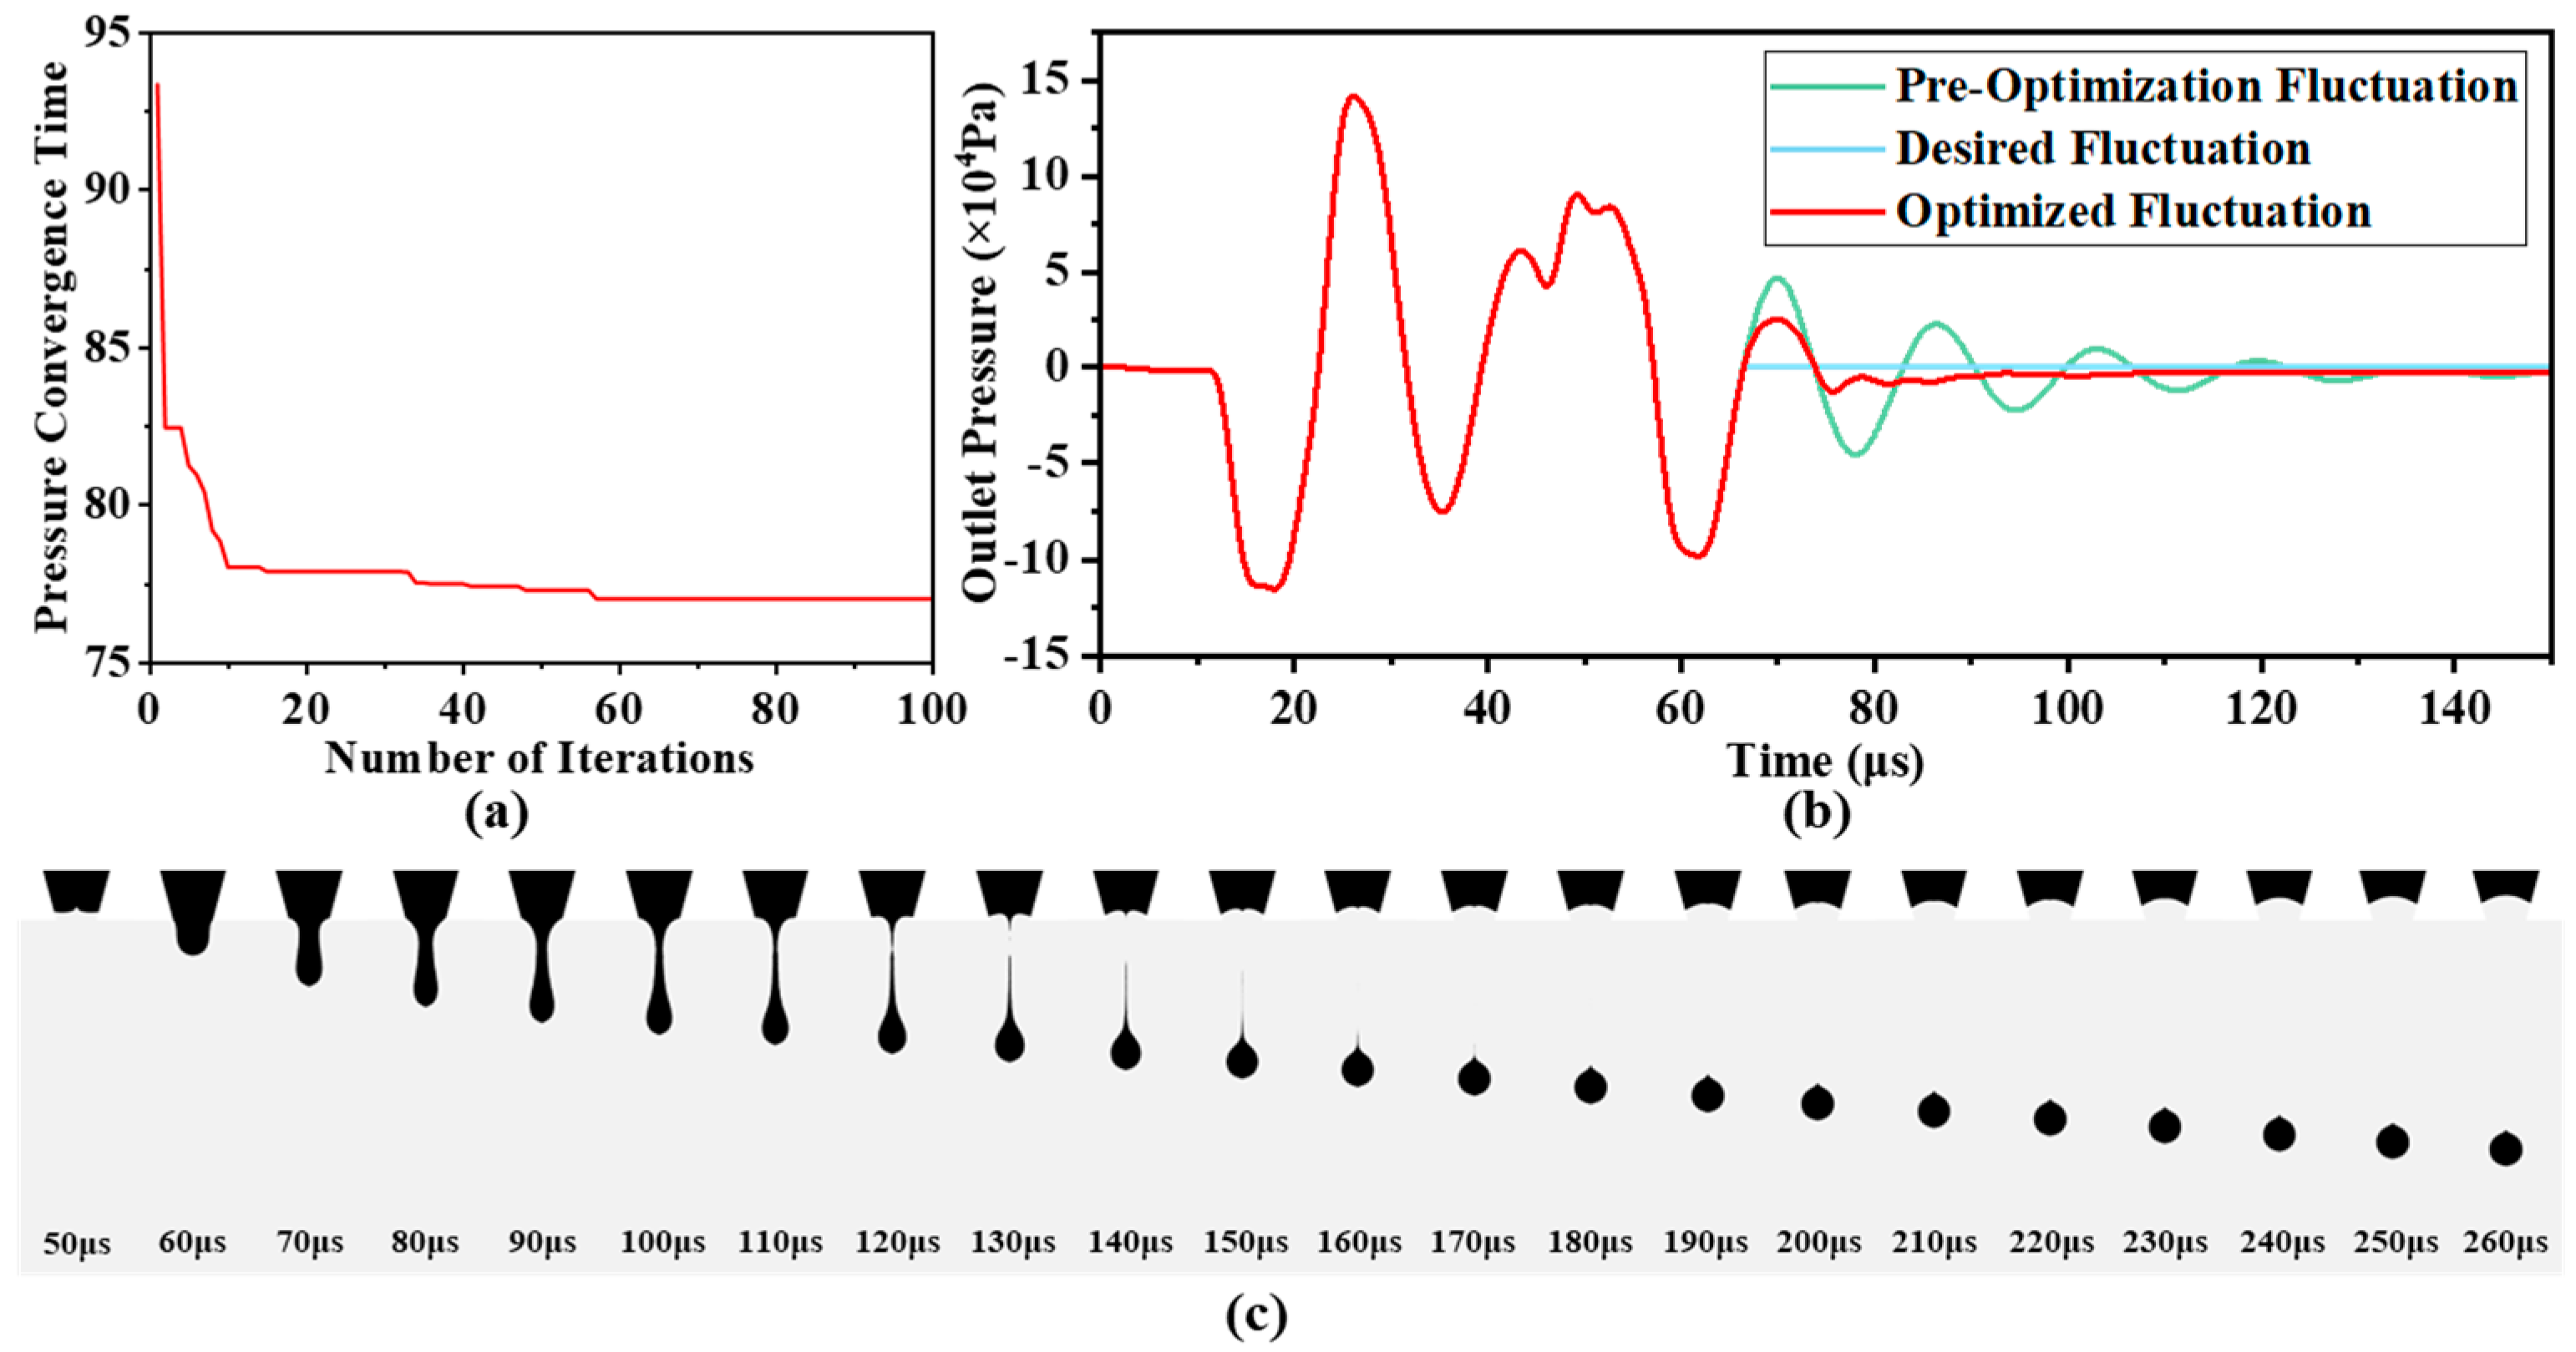
4.2. Optimization of Drive Waveform Parameters
5. Conclusions
Author Contributions
Funding
Data Availability Statement
Acknowledgments
Conflicts of Interest
Abbreviations
| CNN | Convolutional Neural Networks |
| PSO | Particle Swarm Optimization |
| DoD | Drop-on-Demand |
| AI | Artificial Intelligence |
| 3Y-TZP | 3 mol% Yttria-Stabilized Tetragonal Zirconia Polycrystals |
| XRD | X-Ray Diffraction |
| TEM | Transmission Electron Microscopy |
| PVA | Polyvinyl alcohol |
| CCD | Charge Coupled Device |
Appendix A
Appendix A.1

| Parameter | Value |
|---|---|
| Re-initialization parameter | 5 m/s |
| Interface thickness control parameter | 2 μm |
Appendix A.2
| Structure | Dimensional Parameters |
|---|---|
| Ink Chamber Inlet Length (mm) | 6.400 |
| Piezoelectric Actuator Length (mm) | 10.400 |
| Ink Chamber Outlet Length (mm) | 6.000 |
| Nozzle Conical Angle (°) | 75.000 |
| Outer Diameter of Piezoelectric Actuator (mm) | 0.648 |
| Outer Diameter of Nozzle Wall (mm) | 0.340 |
| Inner Diameter of Nozzle Wall (mm) | 0.254 |
| Nozzle Diameter (mm) | 0.025 |
Appendix A.3
| Mesh Feature Size | Maximum Peak of Pressure Fluctuation |
|---|---|
| Normal mesh | 141,480 Pa |
| Refined mesh | 141,510 Pa |
| Finer mesh | 141,520 Pa |
Appendix A.4
| Region | Physics Domain | Boundary Condition |
|---|---|---|
| Nozzle inlet | Fluid (Ink) | Inlet Pressure (−2 kPa) |
| Nozzle outlet | Fluid (Ink) | Outlet Pressure (0 Pa) |
| Inner surface of piezoelectric actuator | Solid/Electric | Electric Ground |
| Outer surface of piezoelectric actuator | Solid/Electric | Prescribed Electric Potential |
| Outer wall of nozzle at inlet | Solid | Fixed Constraint |
| Nozzle wall | Multiphase (Level Set) | Wetting Wall with fixed contact angle θ = π/2 |
Appendix A.5

Appendix A.6
References
- Yang, X.; Zhang, Z.; Huang, M.; Song, C.; Qi, H.; Tang, H. In-Depth Evaluation of Grain Morphology, Nanoprecipitate Dynamics, and Tensile Properties in SEBM H13 Steel. Mater. Today Commun. 2025, 43, 111664. [Google Scholar] [CrossRef]
- Lin, H.; Ma, M.; Qi, H.; Wang, X.; Xing, Z.; Alowasheeir, A.; Tang, H.; Chan Jun, S.; Yamauchi, Y.; Liu, S. 3D-Printed Photocatalysts for Revolutionizing Catalytic Conversion of Solar to Chemical Energy. Prog. Mater. Sci. 2025, 151, 101427. [Google Scholar] [CrossRef]
- Yang, X.; Zhang, Z.; Zhang, T.; Song, F.; Yao, X.; Xiao, B.; Lin, P.; Qi, H.; Liu, S.; Tang, H. Multi-Build Orientation Effects on Microstructural Evolution and Mechanical Behavior of Truly as-Built Selective Laser Melting Ti6Al4V Alloys. J. Mater. Res. Technol. 2024, 30, 3967–3976. [Google Scholar] [CrossRef]
- Ji, R.; Shen, Q.; Zhang, L.; Zeng, X.; Qi, H. Novel Photocatalysis-Assisted Mechanical Polishing of Laser Cladding Cobalt-Based Alloy Using TiO2 Nanoparticles. Powder Technol. 2024, 444, 119990. [Google Scholar] [CrossRef]
- Wang, L.; Hong, B.; Chen, H.; Qi, H.; Zhang, J.; Hang, W.; Han, Y.; Wang, J.; Ren, K.; Lyu, B. Enhancing Tungsten Machinability via Laser Pretreatment for Abrasive Particles-Based Shear Rheological Polishing. Powder Technol. 2025, 455, 120758. [Google Scholar] [CrossRef]
- Sumaiya, S.; Kardel, K.; El-Shahat, A. Organic Solar Cell by Inkjet Printing—An Overview. Technologies 2017, 5, 53. [Google Scholar] [CrossRef]
- Rafiq, M.; Khan, R.S.; Rather, A.H.; Wani, T.U.; Qureashi, A.; Pandith, A.H.; Rather, S.; Sheikh, F.A. Overview of Printable Nanoparticles through Inkjet Process: Their Application towards Medical Use. Microelectron. Eng. 2022, 266, 111889. [Google Scholar] [CrossRef]
- Nayak, L.; Mohanty, S.; Nayak, S.K.; Ramadoss, A. A Review on Inkjet Printing of Nanoparticle Inks for Flexible Electronics. J. Mater. Chem. C 2019, 7, 8771–8795. [Google Scholar] [CrossRef]
- Martins, P.; Pereira, N.; Lima, A.C.; Garcia, A.; Mendes-Filipe, C.; Policia, R.; Correia, V.; Lanceros-Mendez, S. Advances in Printing and Electronics: From Engagement to Commitment. Adv. Funct. Mater. 2023, 33, 2213744. [Google Scholar] [CrossRef]
- Lin, H.; Shen, Q.; Ma, M.; Ji, R.; Guo, H.; Qi, H.; Xing, W.; Tang, H. 3D Printing of Porous Ceramics for Enhanced Thermal Insulation Properties. Adv. Sci. 2025, 12, 2412554. [Google Scholar] [CrossRef]
- Chen, Z.; Li, Z.; Li, J.; Liu, C.; Lao, C.; Fu, Y.; Liu, C.; Li, Y.; Wang, P.; He, Y. 3D Printing of Ceramics: A Review. J. Eur. Ceram. Soc. 2019, 39, 661–687. [Google Scholar] [CrossRef]
- Xiong, D.Y.; Qu Piao, Z.Q.; Zhu, Z.Y.; Gong, C.Y.; Liu, C.Y.; Wang, P.; Lao, C.S.; Yuan, J.K.; Cao, J.W.; Chen, Z.W. Research Progress on Extrusion and Jetting-based Ceramic Additive Manufacturing Technologies. J. Mech. Eng. 2021, 57, 253. [Google Scholar]
- Bogy, D.B.; Talke, F.E. Experimental and Theoretical Study of Wave Propagation Phenomena in Drop-on-Demand Ink Jet Devices. IBM J. Res. Dev. 1984, 28, 314–321. [Google Scholar] [CrossRef]
- Fromm, J.E. Numerical Calculation of the Fluid Dynamics of Drop-on-Demand Jets. IBM J. Res. Dev. 1984, 28, 322–333. [Google Scholar] [CrossRef]
- Reis, N.; Derby, B. Ink Jet Deposition of Ceramic Suspensions: Modeling and Experiments of Droplet Formation. MRS Proc. 2000, 625, 117. [Google Scholar] [CrossRef]
- Derby, B. Inkjet Printing Ceramics: From Drops to Solid. J. Eur. Ceram. Soc. 2011, 31, 2543–2550. [Google Scholar] [CrossRef]
- Richardot, J.M.; Kim, S.; Jung, S. Evaluating Inkjet Printability of Viscoelastic Ink through Deborah Number Analysis. Phys. Fluids 2025, 37, 023135. [Google Scholar] [CrossRef]
- Liu, Y.-F.; Tsai, M.-H.; Pai, Y.-F.; Hwang, W.-S. Control of Droplet Formation by Operating Waveform for Inks with Various Viscosities in Piezoelectric Inkjet Printing. Appl. Phys. A 2013, 111, 509–516. [Google Scholar] [CrossRef]
- Lemarchand, J.; Bridonneau, N.; Battaglini, N.; Carn, F.; Mattana, G.; Piro, B.; Zrig, S.; Noël, V. Challenges, Prospects, and Emerging Applications of Inkjet-Printed Electronics: A Chemist’s Point of View. Angew. Chem. Int. Ed. 2022, 61, e202200166. [Google Scholar] [CrossRef]
- Lyu, S.; Luo, J.; Dou, Y.; Chao, X.; Qi, L. Elimination of Satellite Droplets in Droplet Streams by Superposing Harmonic Perturbations. Int. J. Mech. Sci. 2024, 284, 109723. [Google Scholar] [CrossRef]
- Kim, S.; Choi, J.H.; Sohn, D.K.; Ko, H.S. The Effect of Ink Supply Pressure on Piezoelectric Inkjet. Micromachines 2022, 13, 615. [Google Scholar] [CrossRef] [PubMed]
- Cheng, Y.-L.; Tseng, T.-W. Study on Driving Waveform Design Process for Multi-Nozzle Piezoelectric Printhead in Material-Jetting 3D Printing. Rapid Prototyp. J. 2021, 27, 1172–1180. [Google Scholar] [CrossRef]
- Yang, Z.; Tian, H.; Wang, C.; Li, X.; Chen, X.; Chen, X.; Shao, J. Piezoelectric Drop-on-Demand Inkjet Printing with Ultra-High Droplet Velocity. Research 2023, 6, 0248. [Google Scholar] [CrossRef]
- Wang, J.; Huang, J.; Xiong, C.; Gong, H.; Liang, C.; Zhang, Q.; Zhang, J.; Zhao, P.; Yang, Y.; Zhou, J.; et al. Actuation Waveform Auto-Design of Drop-on-Demand Inkjet for Ejection Droplet without Satellite. J. Manuf. Process. 2023, 102, 910–920. [Google Scholar]
- Yun, J.; He, M.; Zhu, Y.; Liang, X.; Liu, F.; Su, W.; Chen, H. Droplet Property Optimization in Printable Electronics Fabrication Using Root System Growth Algorithm. Comput. Ind. Eng. 2018, 125, 592–603. [Google Scholar] [CrossRef]
- Segura, L.J.; Li, Z.; Zhou, C.; Sun, H. Droplet Evolution Prediction in Material Jetting via Tensor Time Series Analysis. Addit. Manuf. 2023, 66, 103461. [Google Scholar] [CrossRef]
- Brishty, F.P.; Urner, R.; Grau, G. Machine Learning Based Data Driven Inkjet Printed Electronics: Jetting Prediction for Novel Inks. Flex. Print. Electron. 2022, 7, 015009. [Google Scholar] [CrossRef]
- Kim, S.; Cho, M.; Jung, S. The Design of an Inkjet Drive Waveform Using Machine Learning. Sci. Rep. 2022, 12, 4841. [Google Scholar] [CrossRef]
- Huang, J.; Segura, L.J.; Wang, T.; Zhao, G.; Sun, H.; Zhou, C. Unsupervised Learning for the Droplet Evolution Prediction and Process Dynamics Understanding in Inkjet Printing. Addit. Manuf. 2020, 35, 101197. [Google Scholar] [CrossRef]
- Kim, S.; Wenger, R.; Bürgy, O.; Balestra, G.; Jeong, U.; Jung, S. Predicting Inkjet Jetting Behavior for Viscoelastic Inks Using Machine Learning. Flex. Print. Electron. 2023, 8, 035007. [Google Scholar] [CrossRef]
- Carou-Senra, P.; Ong, J.J.; Castro, B.M.; Seoane-Viaño, I.; Rodríguez-Pombo, L.; Cabalar, P.; Alvarez-Lorenzo, C.; Basit, A.W.; Pérez, G.; Goyanes, A. Predicting Pharmaceutical Inkjet Printing Outcomes Using Machine Learning. Int. J. Pharm. X 2023, 5, 100181. [Google Scholar] [CrossRef] [PubMed]
- Ryan, D.; Harris, E.; O’Connor, G.M. Explainable Machine Learning for the Regulatory Environment: A Case Study in Micro-Droplet Printing. Addit. Manuf. 2024, 88, 104237. [Google Scholar] [CrossRef]
- Mondal, B.; Mukherjee, T.; DebRoy, T. Crack Free Metal Printing Using Physics Informed Machine Learning. Acta Mater. 2022, 226, 117612. [Google Scholar] [CrossRef]
- Wang, T.; Kwok, T.-H.; Zhou, C.; Vader, S. In-Situ Droplet Inspection and Closed-Loop Control System Using Machine Learning for Liquid Metal Jet Printing. J. Manuf. Syst. 2018, 47, 83–92. [Google Scholar] [CrossRef]
- Ogunsanya, M.; Isichei, J.; Parupelli, S.K.; Desai, S.; Cai, Y. In-Situ Droplet Monitoring of Inkjet 3D Printing Process Using Image Analysis and Machine Learning Models. Procedia Manuf. 2021, 53, 427–434. [Google Scholar] [CrossRef]
- Dong, Y.; Wang, Y.; Li, P. Predicting Voltage Fluctuation of Photovoltaic Generation System by Deep Learning and Its Control Method. In Proceedings of the International Conference on Physics, Photonics, and Optical Engineering (ICPPOE 2024), Foshan, China, 15–18 November 2024; SPIE: Washington, DC, USA; Volume 13552, pp. 131–138. [Google Scholar]
- Liu, B.; Li, F.; Hou, Y.; Antonio Biancardo, S.; Ma, X. Unveiling Built Environment Impacts on Traffic CO2 Emissions Using Geo-CNN Weighted Regression. Transp. Res. Part Transp. Environ. 2024, 132, 104266. [Google Scholar] [CrossRef]
- Wang, Z.; Shen, Z.; Chew, J.; Wang, Y.; Hu, K. Intelligent Construction of a Supply Chain Finance Decision Support System and Financial Benefit Analysis Based on Deep Reinforcement Learning and Particle Swarm Optimization Algorithm. Int. J. Manag. Sci. Res. 2025, 8, 28–41. [Google Scholar] [CrossRef]
- Almalaisi, T.A.; Wahab, N.I.A.; Zaynal, H.I.; Hassan, M.K.; Majdi, H.S.; Radhi, A.D.; Solke, N.; Sekhar, R. Optimization of Harmonic Elimination in PV-Fed Asymmetric Multilevel Inverters Using Evolutionary Algorithms. Int. J. Robot. Control Syst. 2025, 5, 902–916. [Google Scholar]
- Vadillo, D.C.; Tuladhar, T.R.; Mulji, A.C.; Jung, S.; Hoath, S.D.; Mackley, M.R. Evaluation of the Inkjet Fluid’s Performance Using the “Cambridge Trimaster” Filament Stretch and Break-up Device. J. Rheol. 2010, 54, 261–282. [Google Scholar] [CrossRef]
- Dongbin, Z.; Minqiang, W.; Zhuxian, W.; Weidong, Y. Research on Stable Jetting of Nanoparticle Suspension Ink for Inkjet 3D Printing. J. Mech. Eng. 2020, 56, 243. [Google Scholar] [CrossRef]
- Olsson, E.; Kreiss, G. A Conservative Level Set Method for Two Phase Flow. J. Comput. Phys. 2005, 210, 225–246. [Google Scholar] [CrossRef]
- Brackbill, J.U.; Kothe, D.B.; Zemach, C. A Continuum Method for Modeling Surface Tension. J. Comput. Phys. 1992, 100, 335–354. [Google Scholar] [CrossRef]
- Guazzelli, É.; Pouliquen, O. Rheology of Dense Granular Suspensions. J. Fluid Mech. 2018, 852, P1. [Google Scholar] [CrossRef]
- Jun, M.-J.; Kang, J.-H.; Sakthiabirami, K.; Hosseini Toopghara, S.A.; Kim, Y.-S.; Yun, K.-D.; Park, S.-W. The Impact of Particle Size and Surface Treatment of Zirconia Suspension for Photocuring Additive Manufacturing. Materials 2023, 16, 1670. [Google Scholar] [CrossRef]


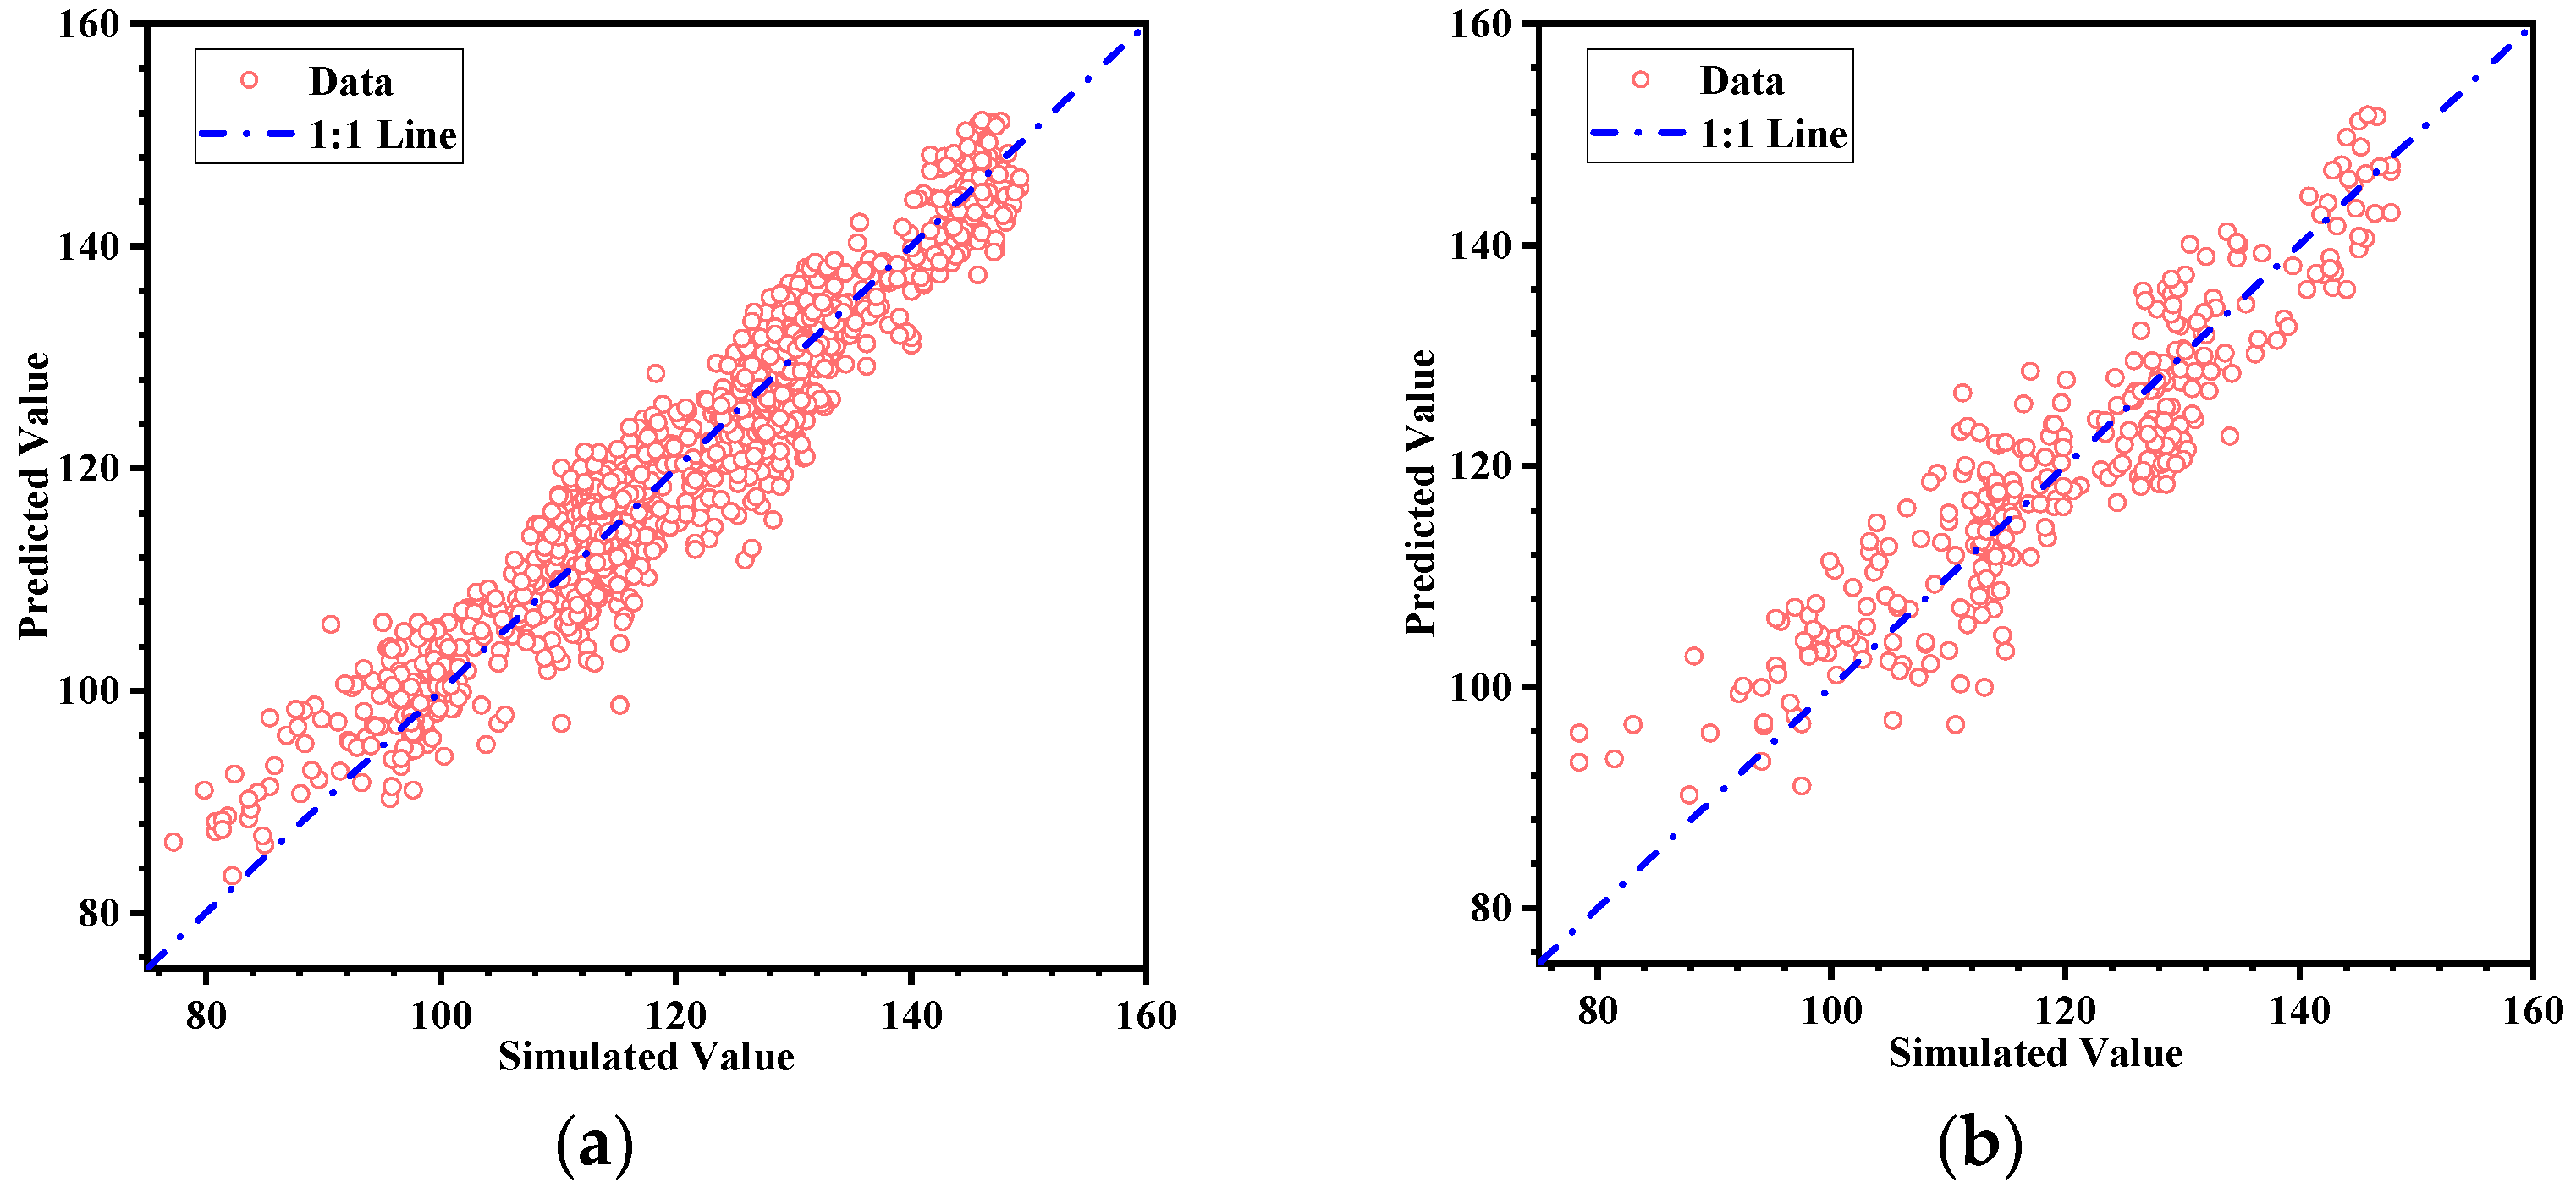
| Sample | R2 | MAE | RMSE |
|---|---|---|---|
| Training set | 0.92012 | 3.1644 | 4.0159 |
| Test set | 0.84278 | 4.6300 | 5.7168 |
| Parameter | ||||
|---|---|---|---|---|
| Limit | [7 μs, 17 μs] | [0 μs, 10 μs] | [0 μs, 10 μs] | [0 V, 20 V] |
Disclaimer/Publisher’s Note: The statements, opinions and data contained in all publications are solely those of the individual author(s) and contributor(s) and not of MDPI and/or the editor(s). MDPI and/or the editor(s) disclaim responsibility for any injury to people or property resulting from any ideas, methods, instructions or products referred to in the content. |
© 2025 by the authors. Licensee MDPI, Basel, Switzerland. This article is an open access article distributed under the terms and conditions of the Creative Commons Attribution (CC BY) license (https://creativecommons.org/licenses/by/4.0/).
Share and Cite
Shen, Q.; Zhang, L.; Ji, R.; Saetang, V.; Qi, H. Nonlinear Waveform Optimization for Enhanced Ink Droplet Formation in Material Jetting. Micromachines 2025, 16, 445. https://doi.org/10.3390/mi16040445
Shen Q, Zhang L, Ji R, Saetang V, Qi H. Nonlinear Waveform Optimization for Enhanced Ink Droplet Formation in Material Jetting. Micromachines. 2025; 16(4):445. https://doi.org/10.3390/mi16040445
Chicago/Turabian StyleShen, Qintao, Li Zhang, Renquan Ji, Viboon Saetang, and Huan Qi. 2025. "Nonlinear Waveform Optimization for Enhanced Ink Droplet Formation in Material Jetting" Micromachines 16, no. 4: 445. https://doi.org/10.3390/mi16040445
APA StyleShen, Q., Zhang, L., Ji, R., Saetang, V., & Qi, H. (2025). Nonlinear Waveform Optimization for Enhanced Ink Droplet Formation in Material Jetting. Micromachines, 16(4), 445. https://doi.org/10.3390/mi16040445