
Investigation into the Influence of Polishing Depth and Speed on the Nano-Polishing Process of Nickel–Phosphorus Alloys via Molecular Dynamics

 ,
, 
Abstract
:1. Introduction
2. Methods
3. Results and Discussion
4. Conclusions
- 1.
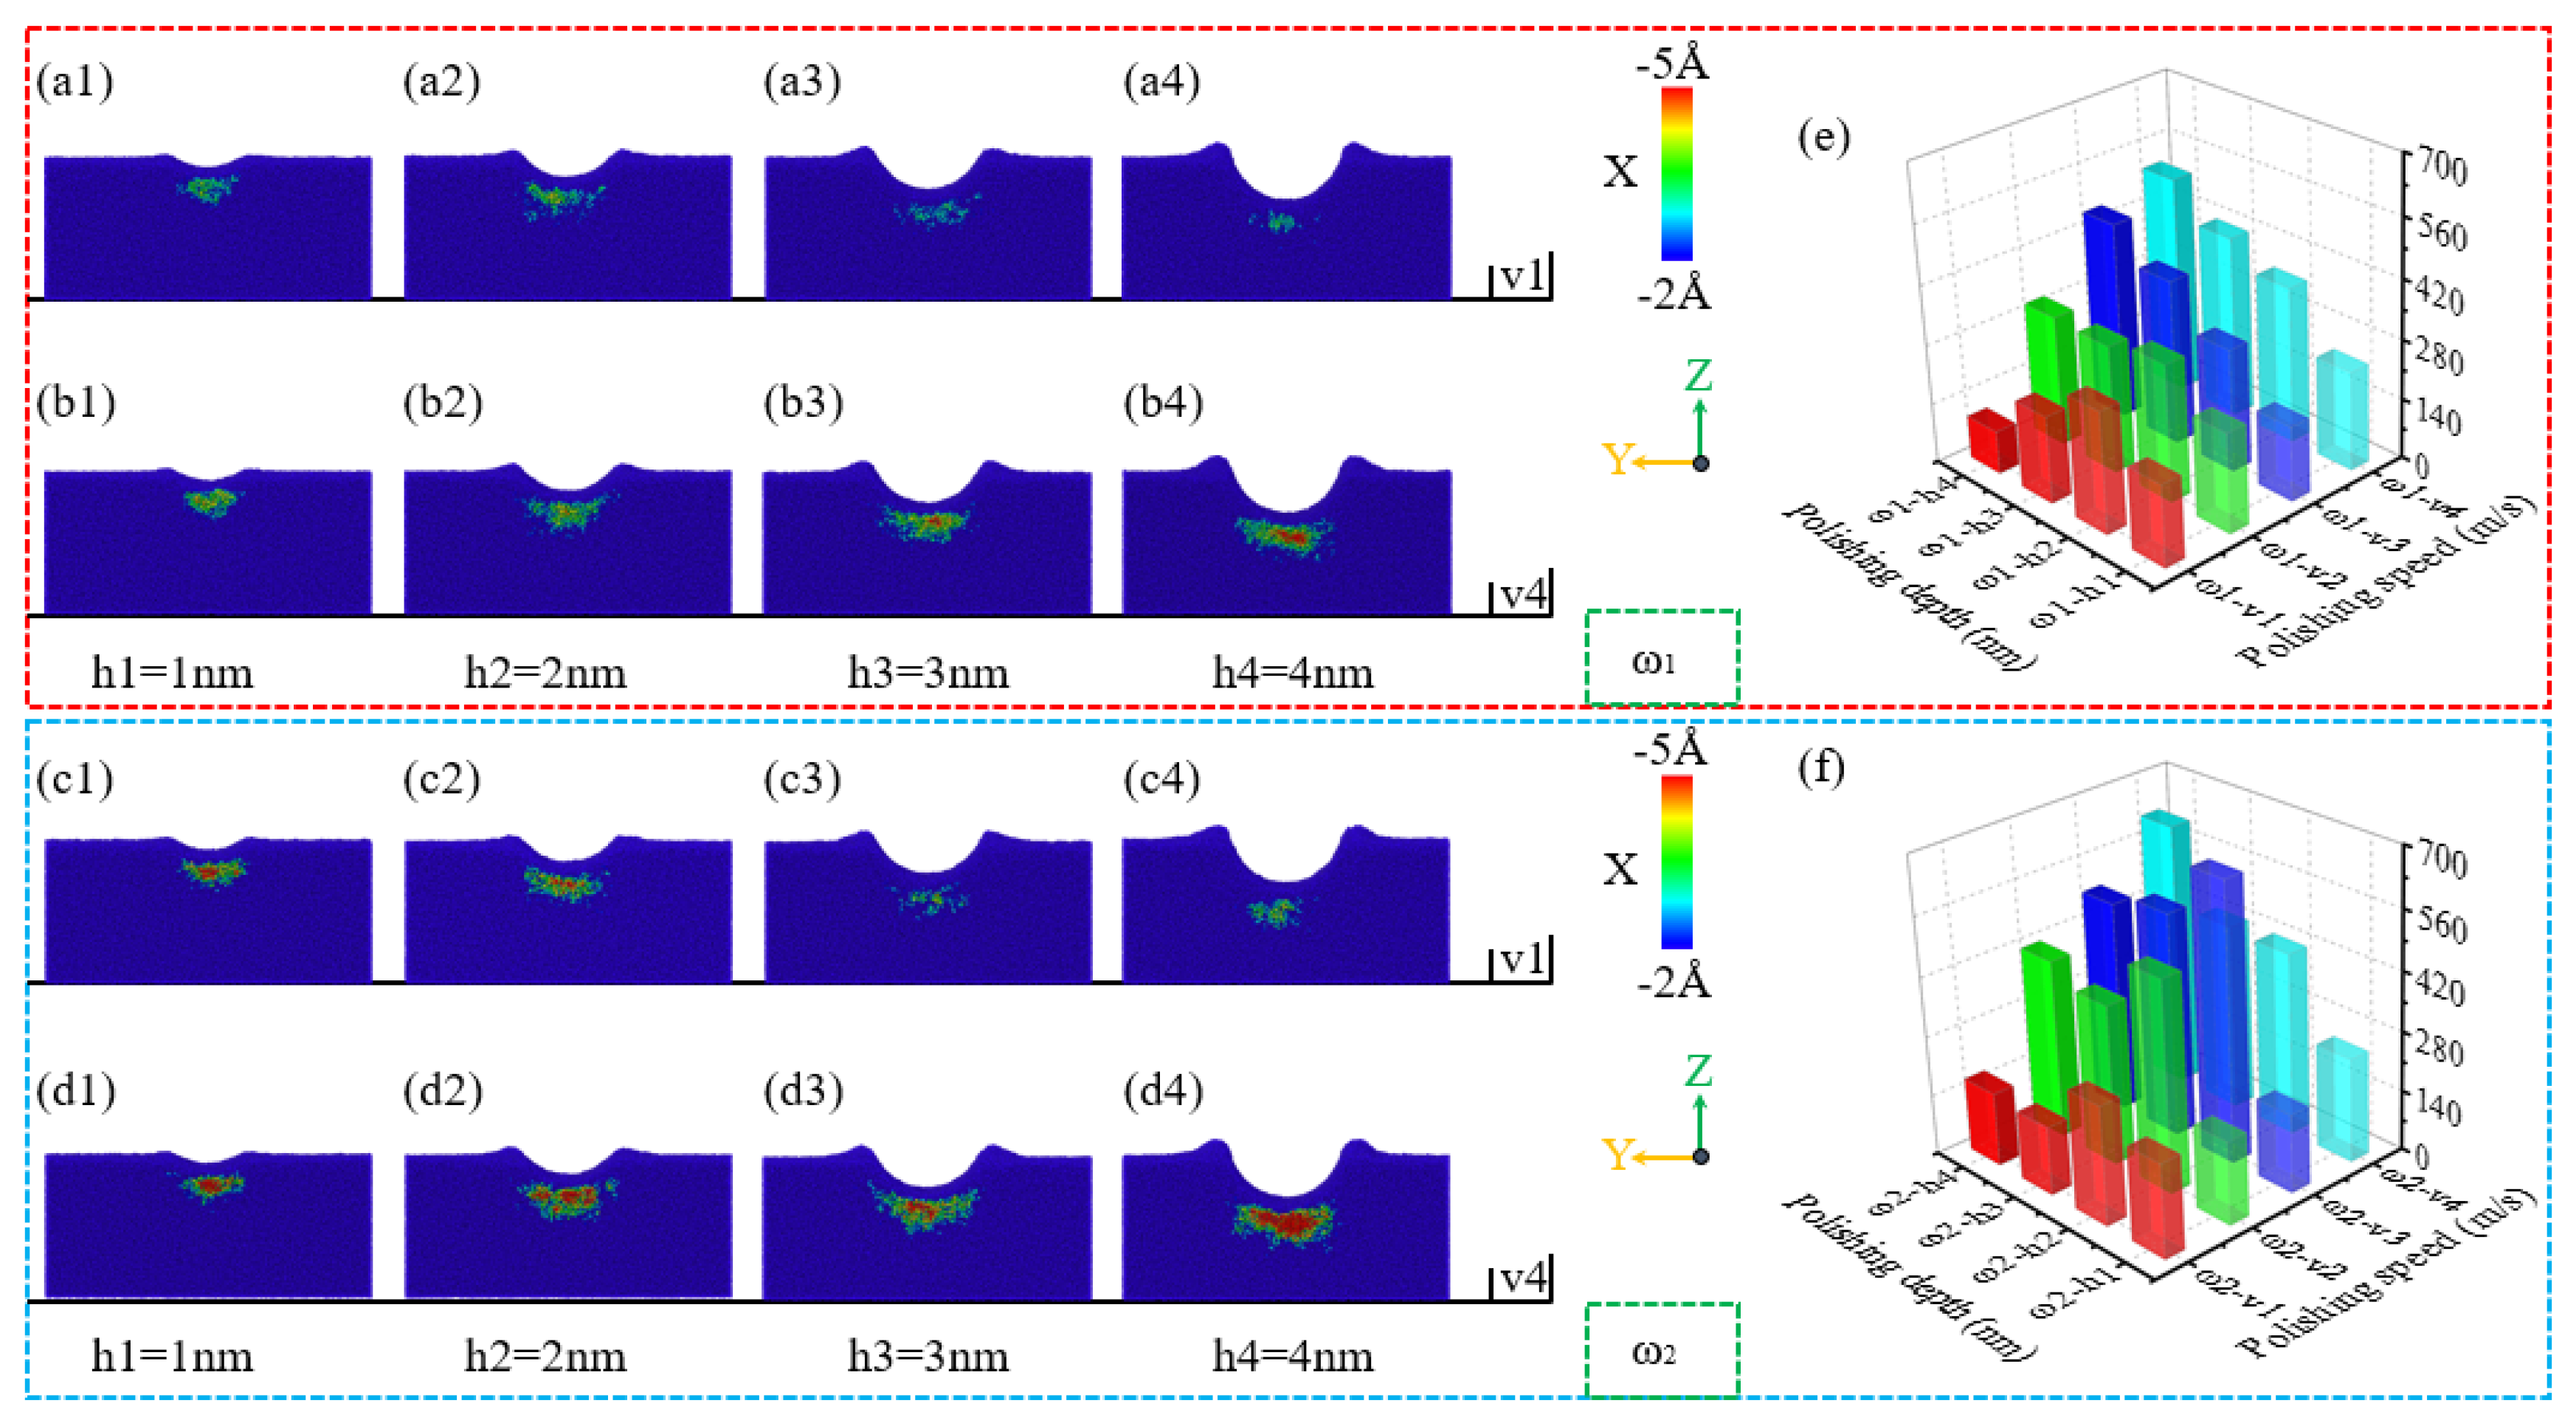
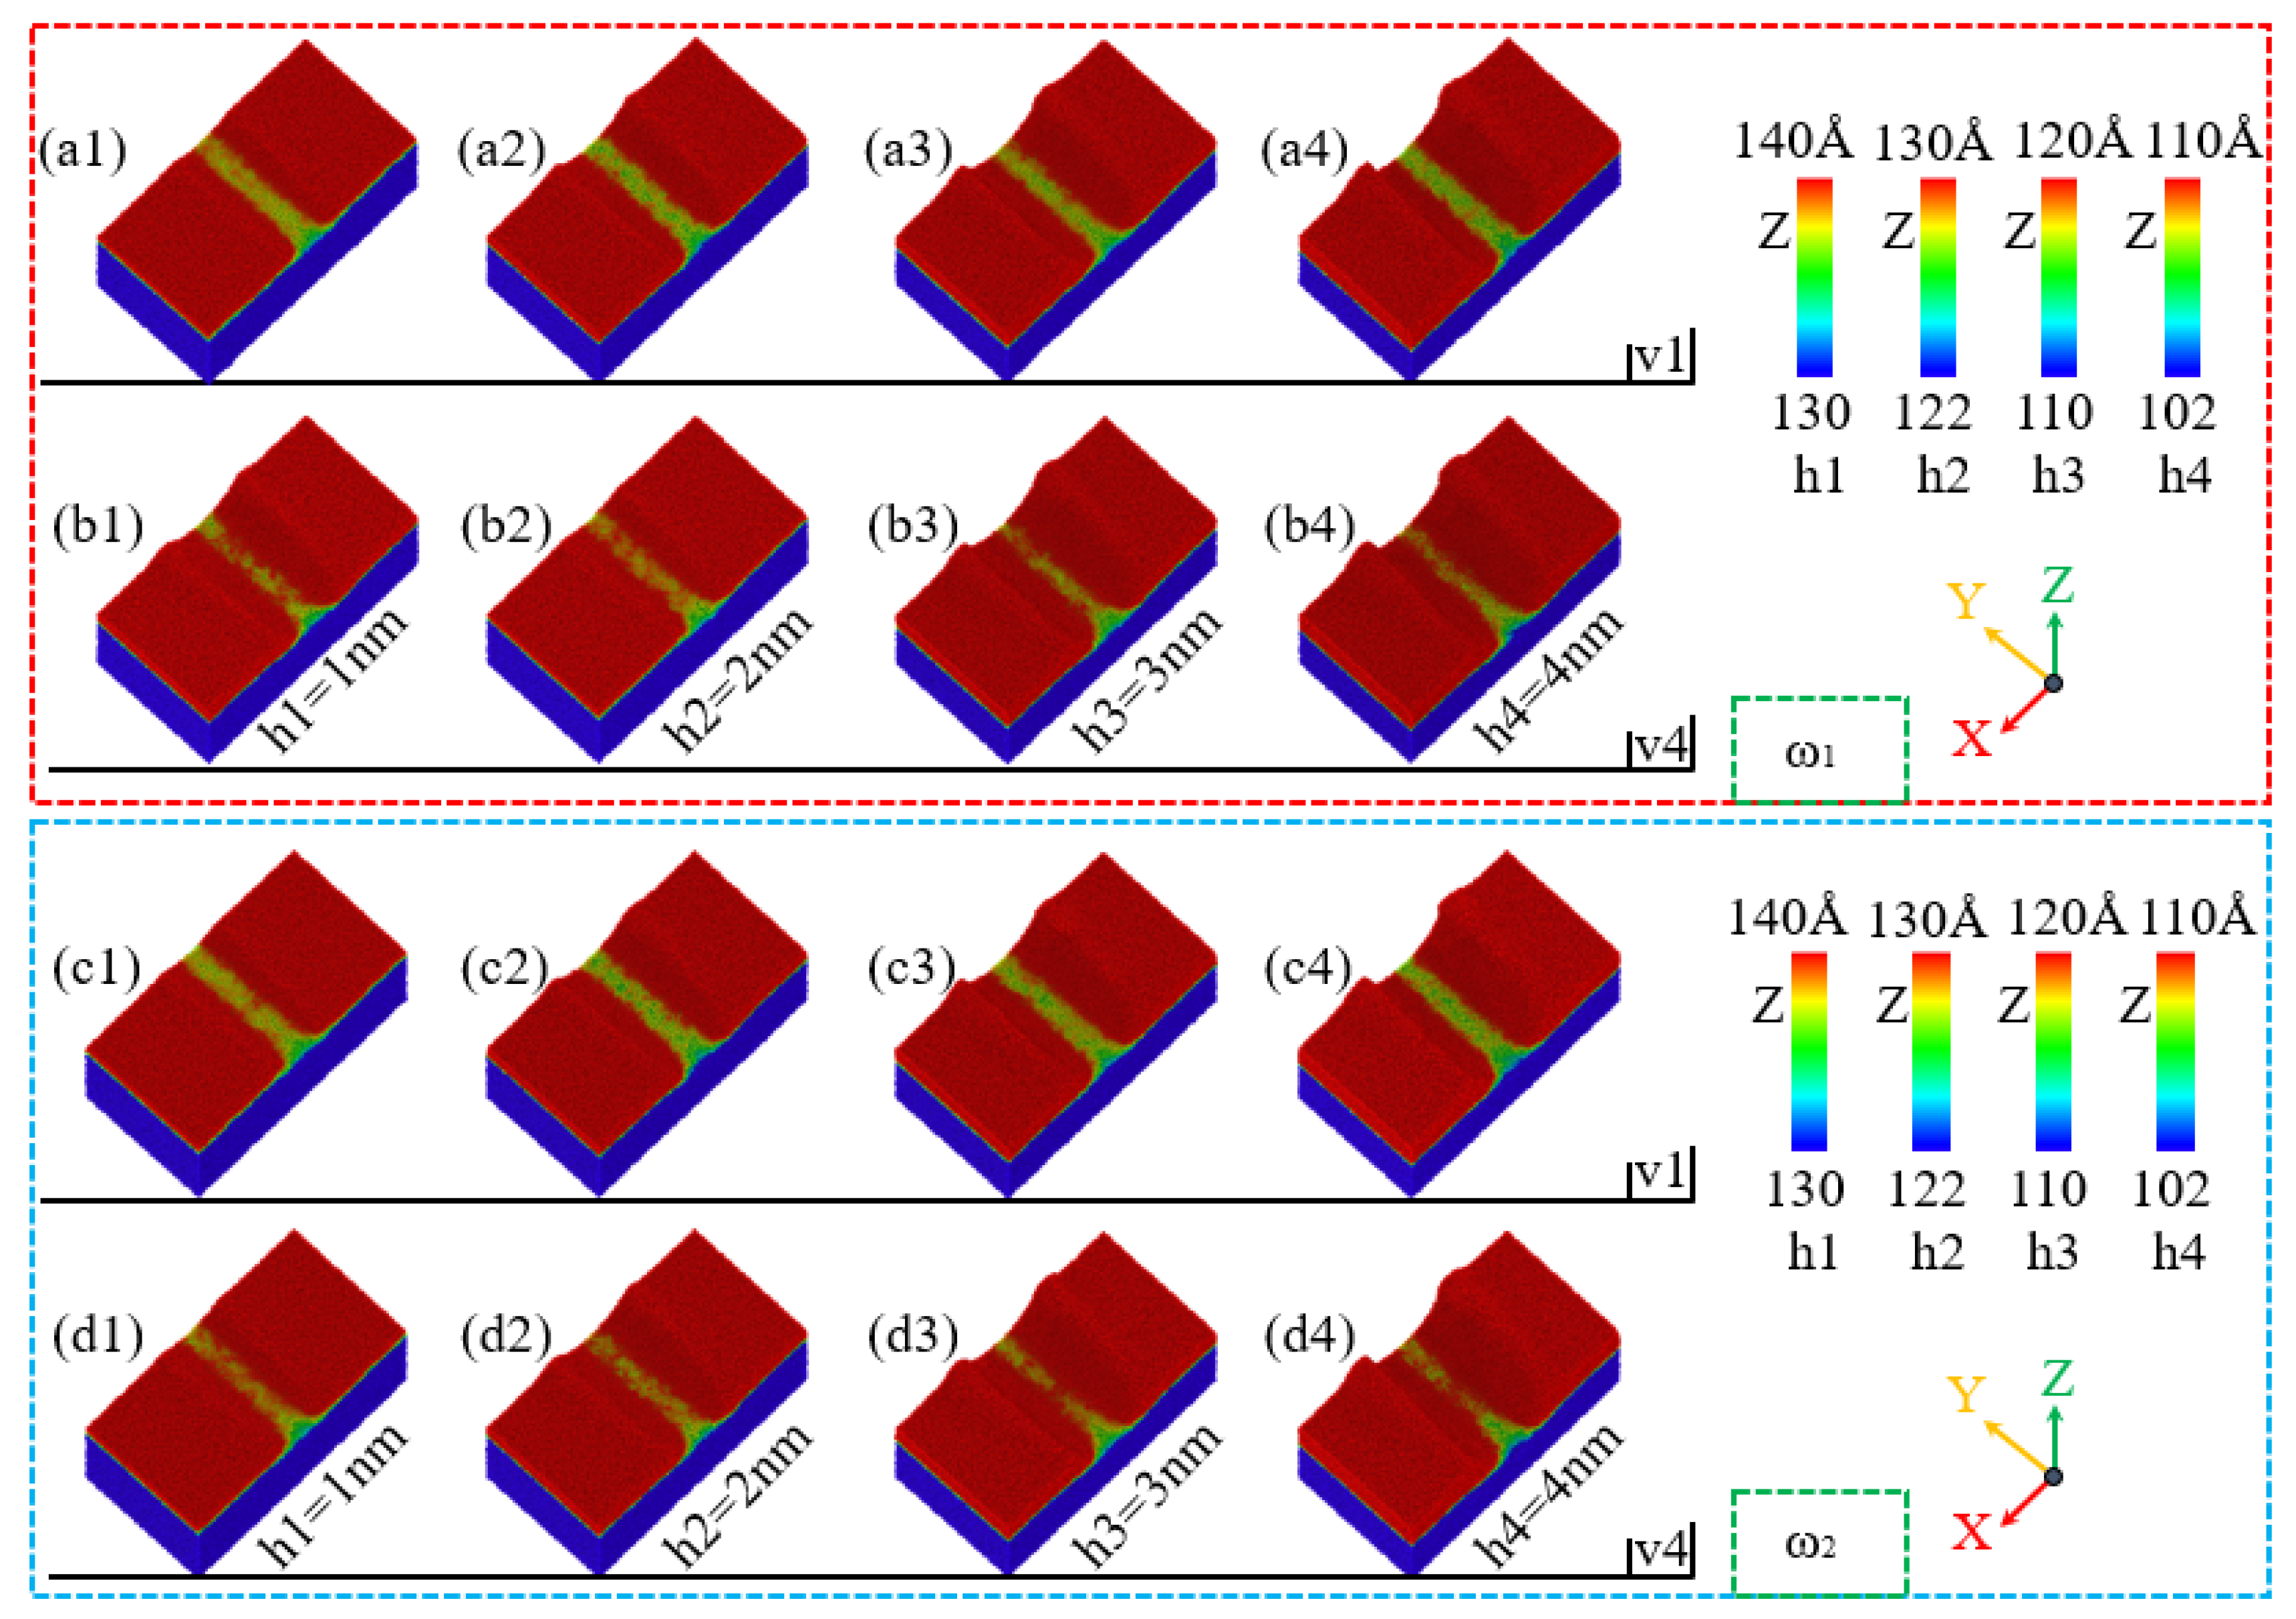
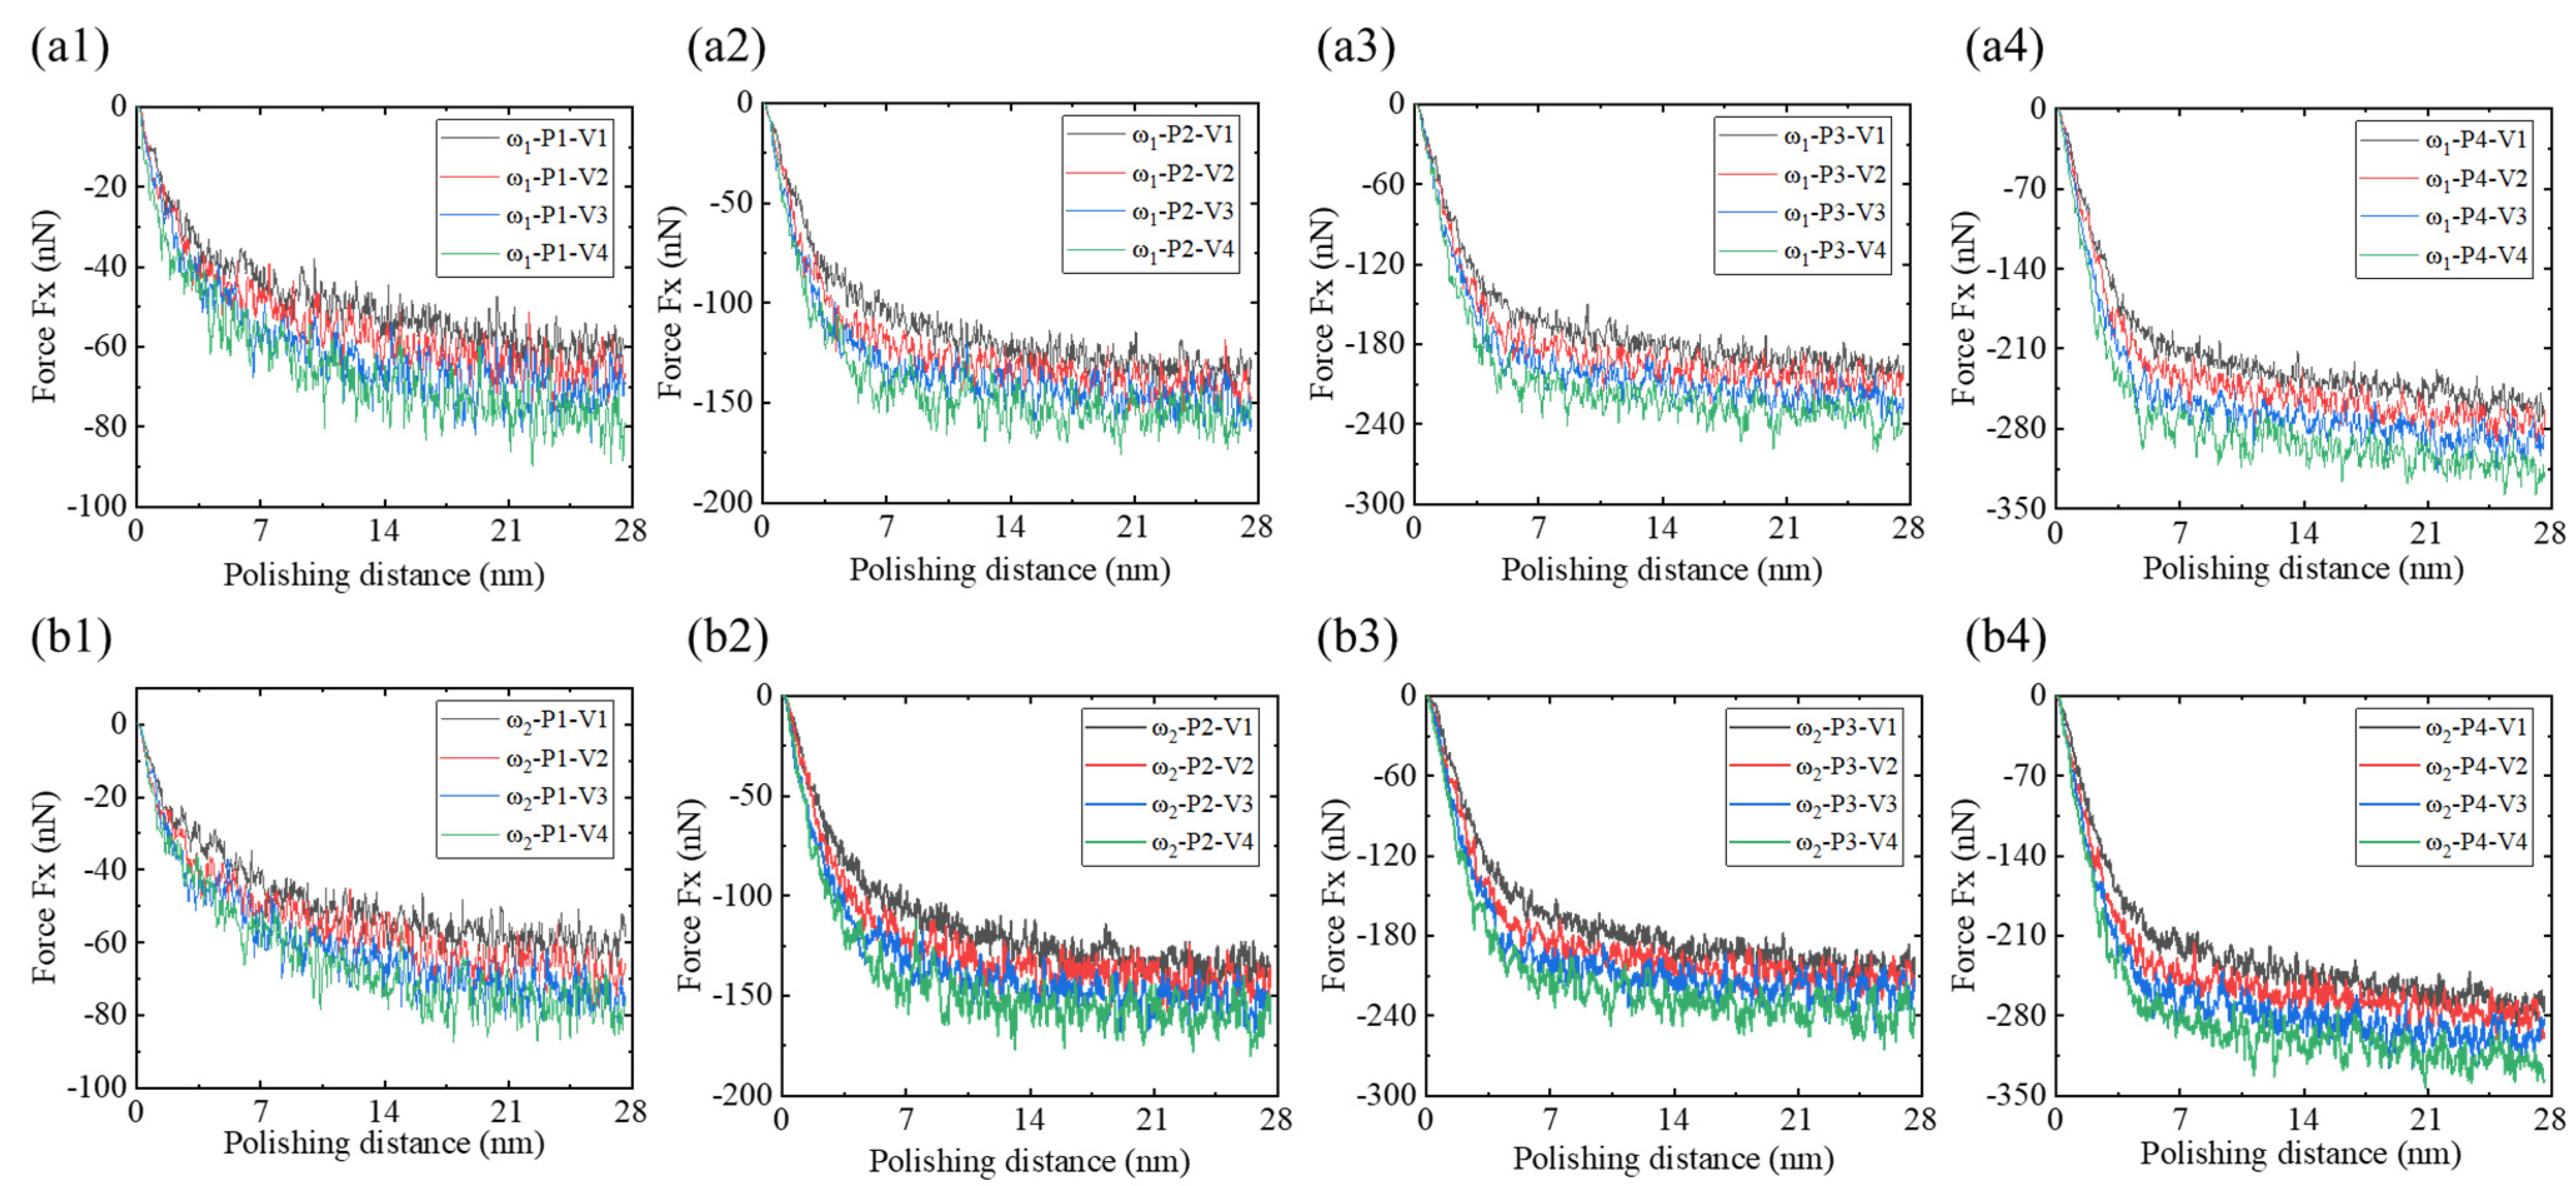
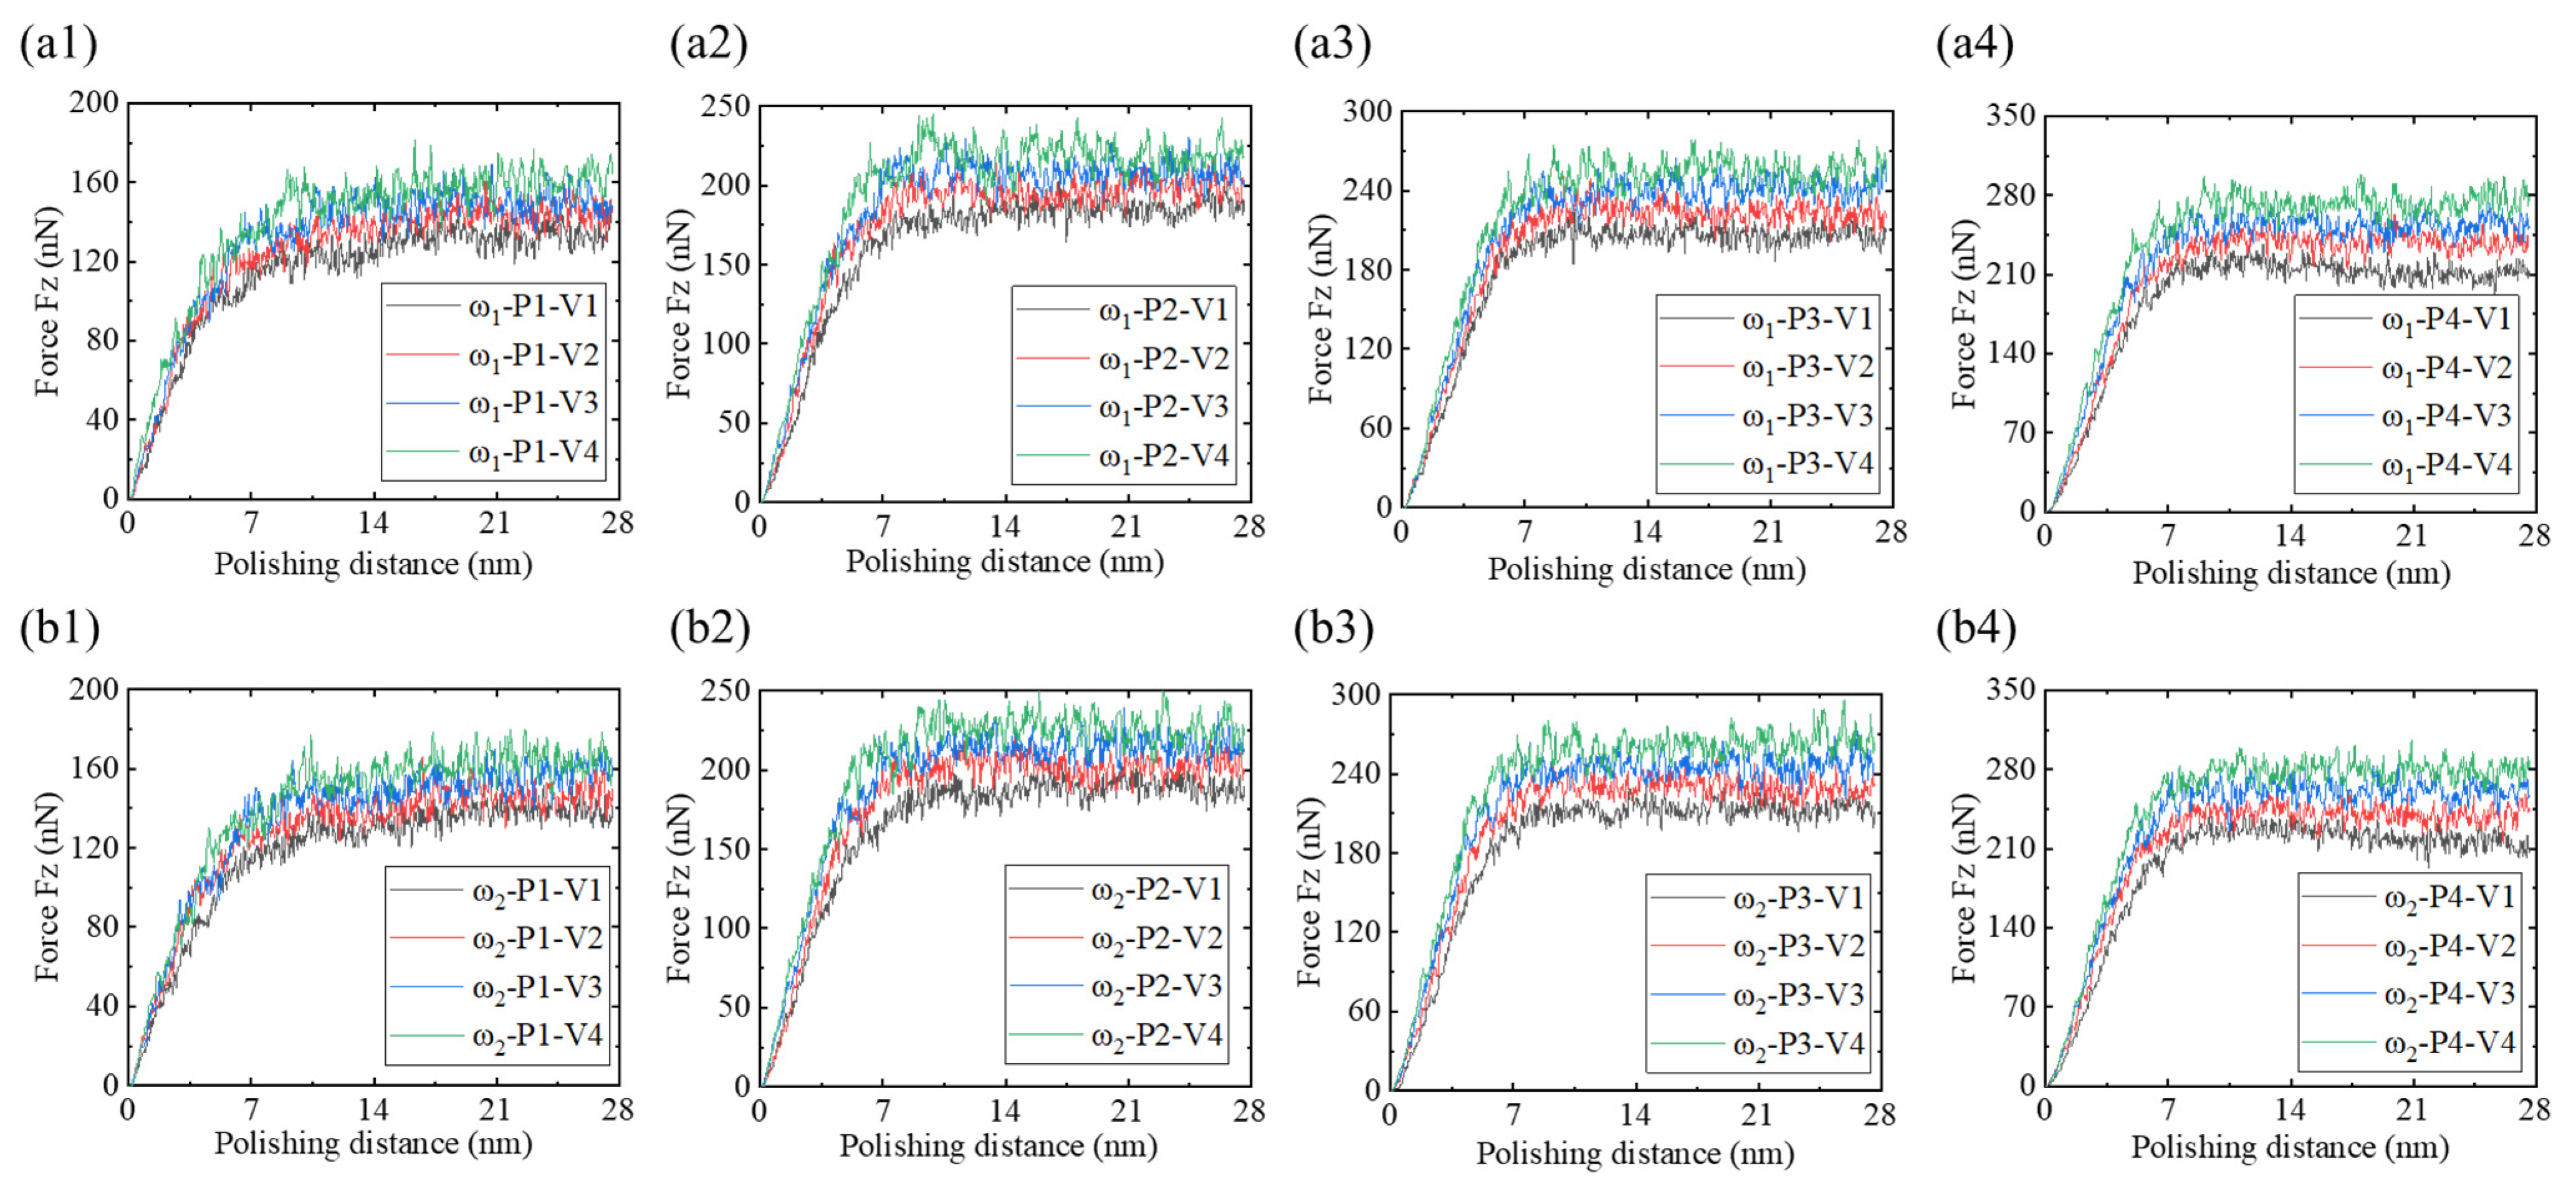
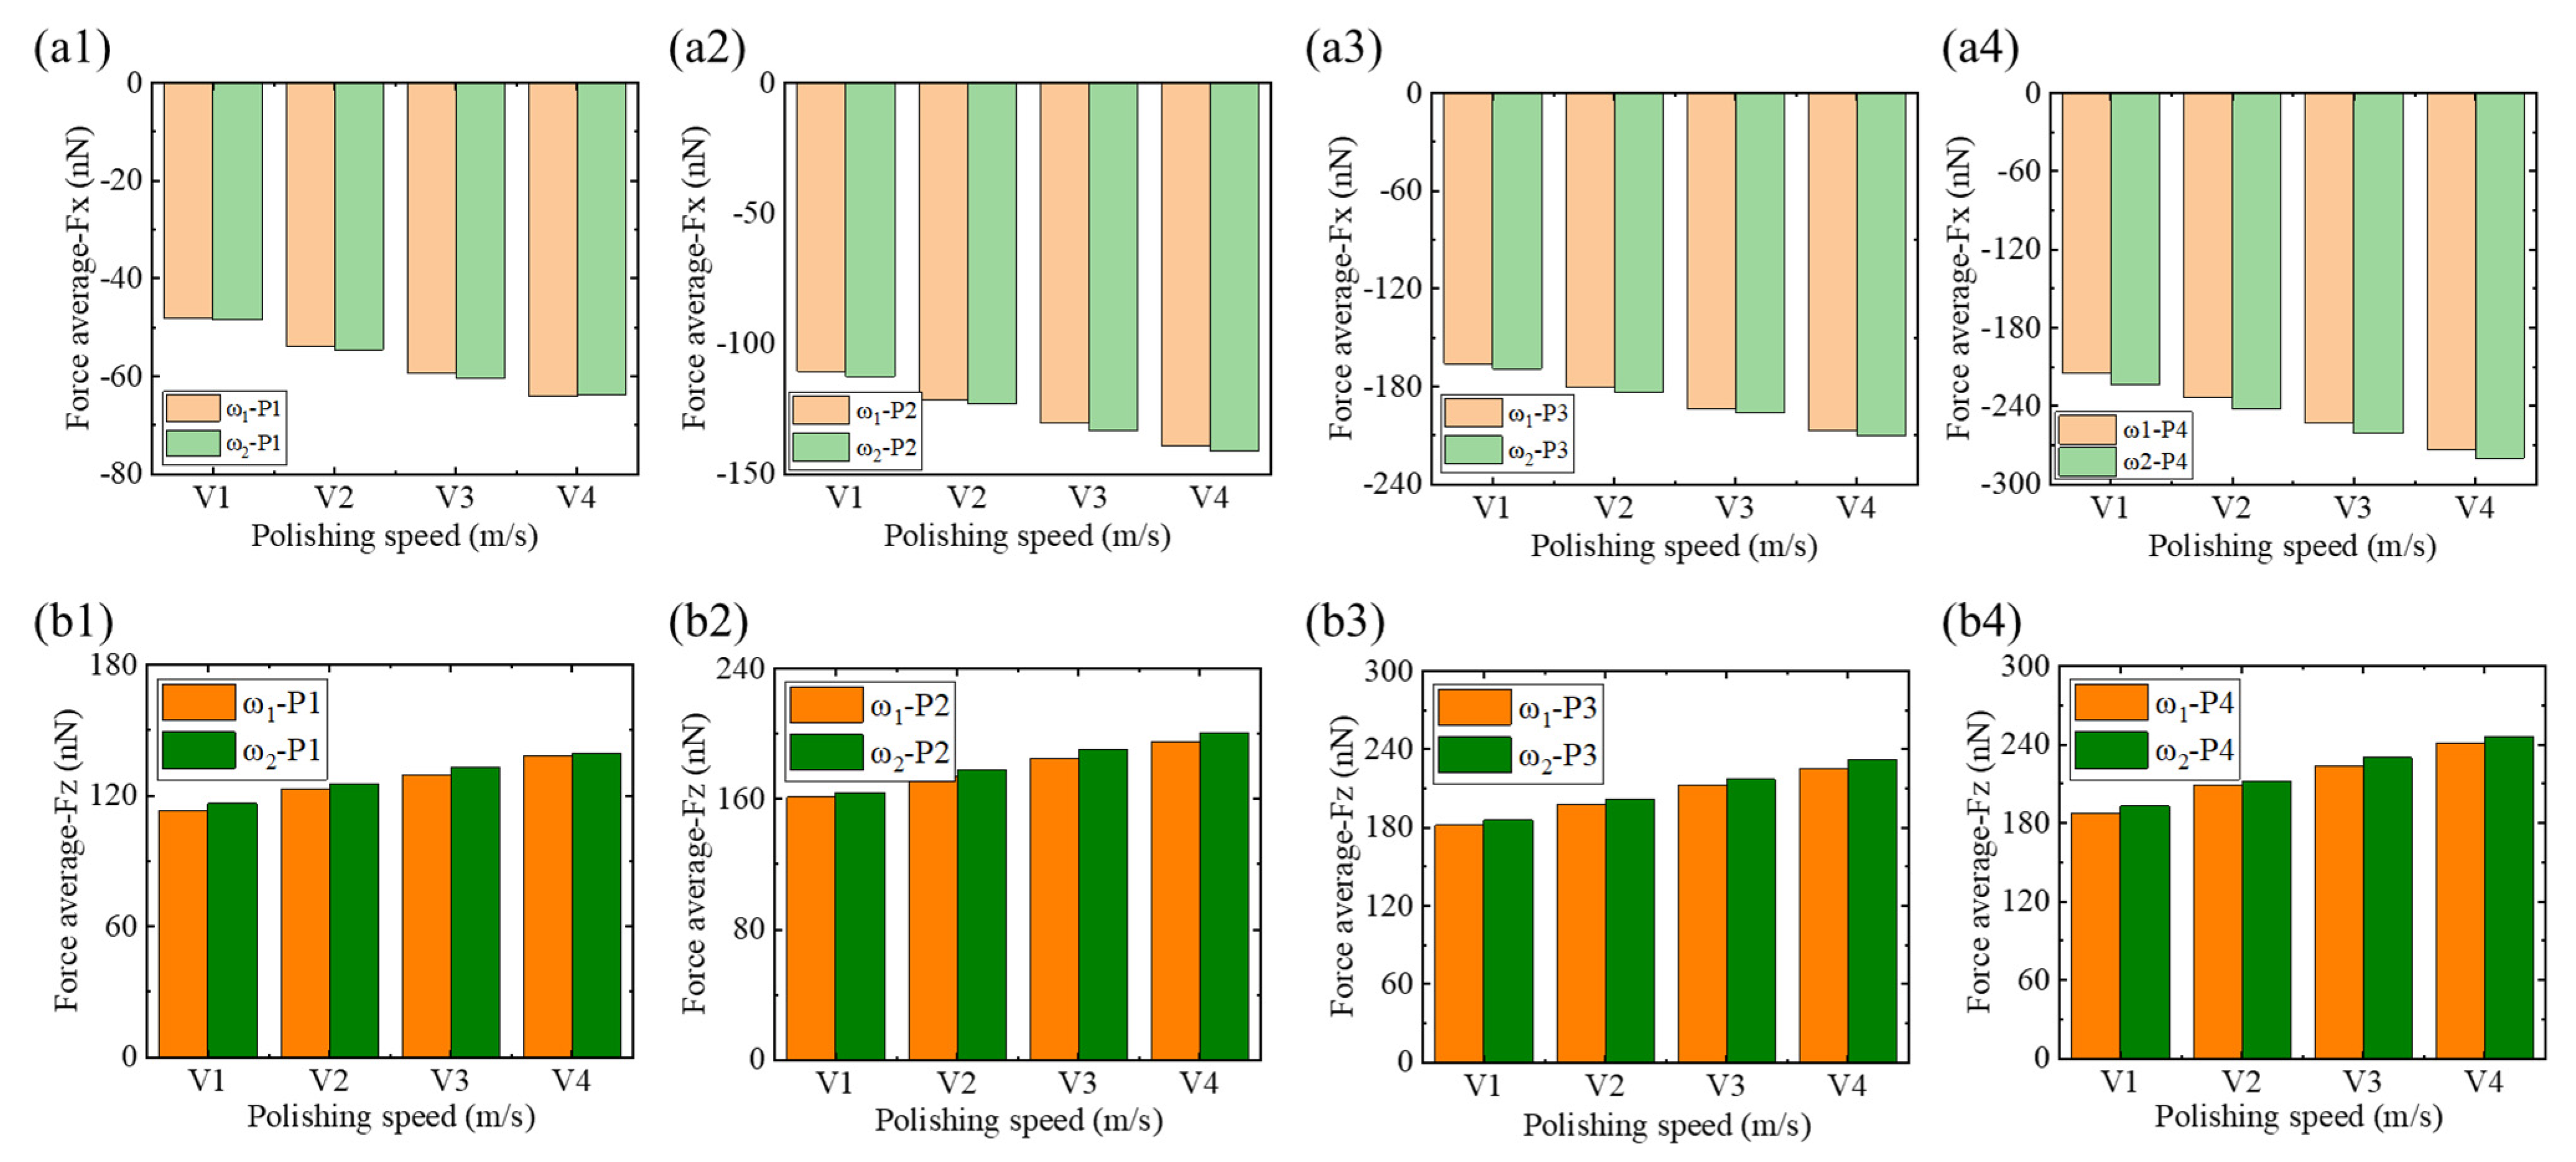
- Low-phosphorus alloys exhibit larger material accumulation areas and larger heights at the abrasive entry point, and their surface morphology is more sensitive to the polishing depth and speed, with greater susceptibility to surface collapse. As the polishing depth and speed increase, tangential and normal forces also rise, with low-phosphorus alloys showing slightly higher mechanical responses compared to high-phosphorus alloys.
- 2.
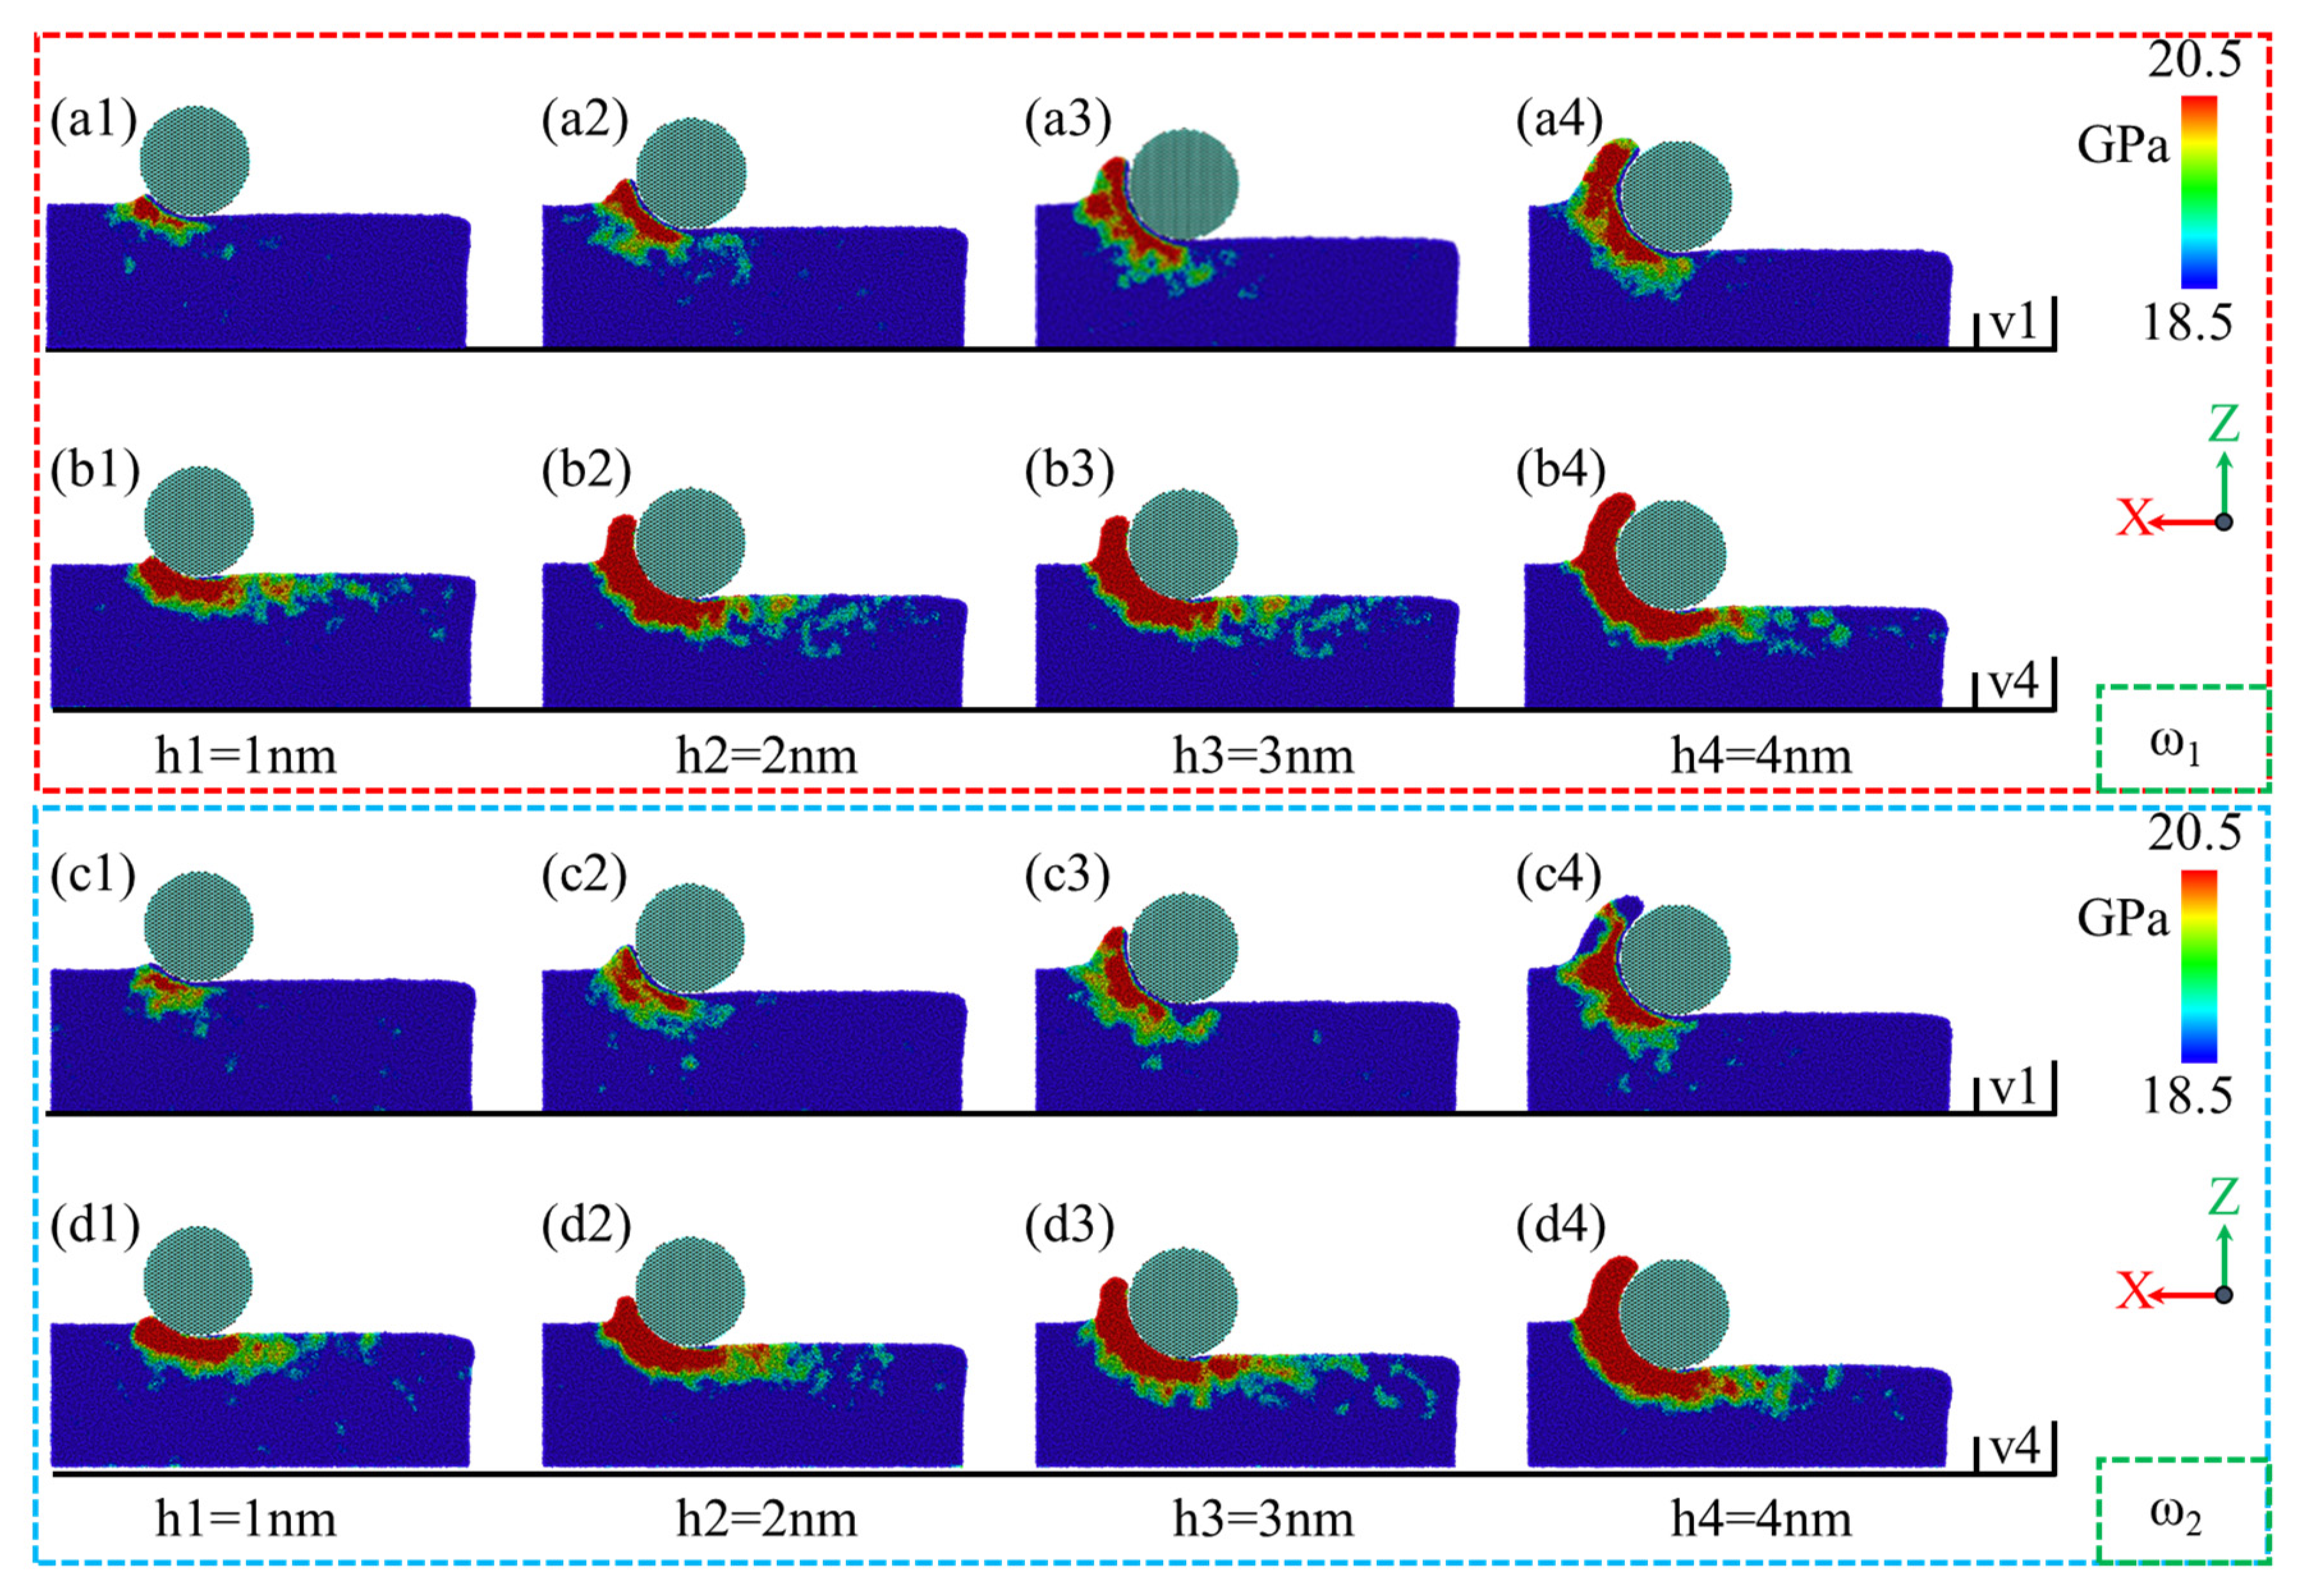
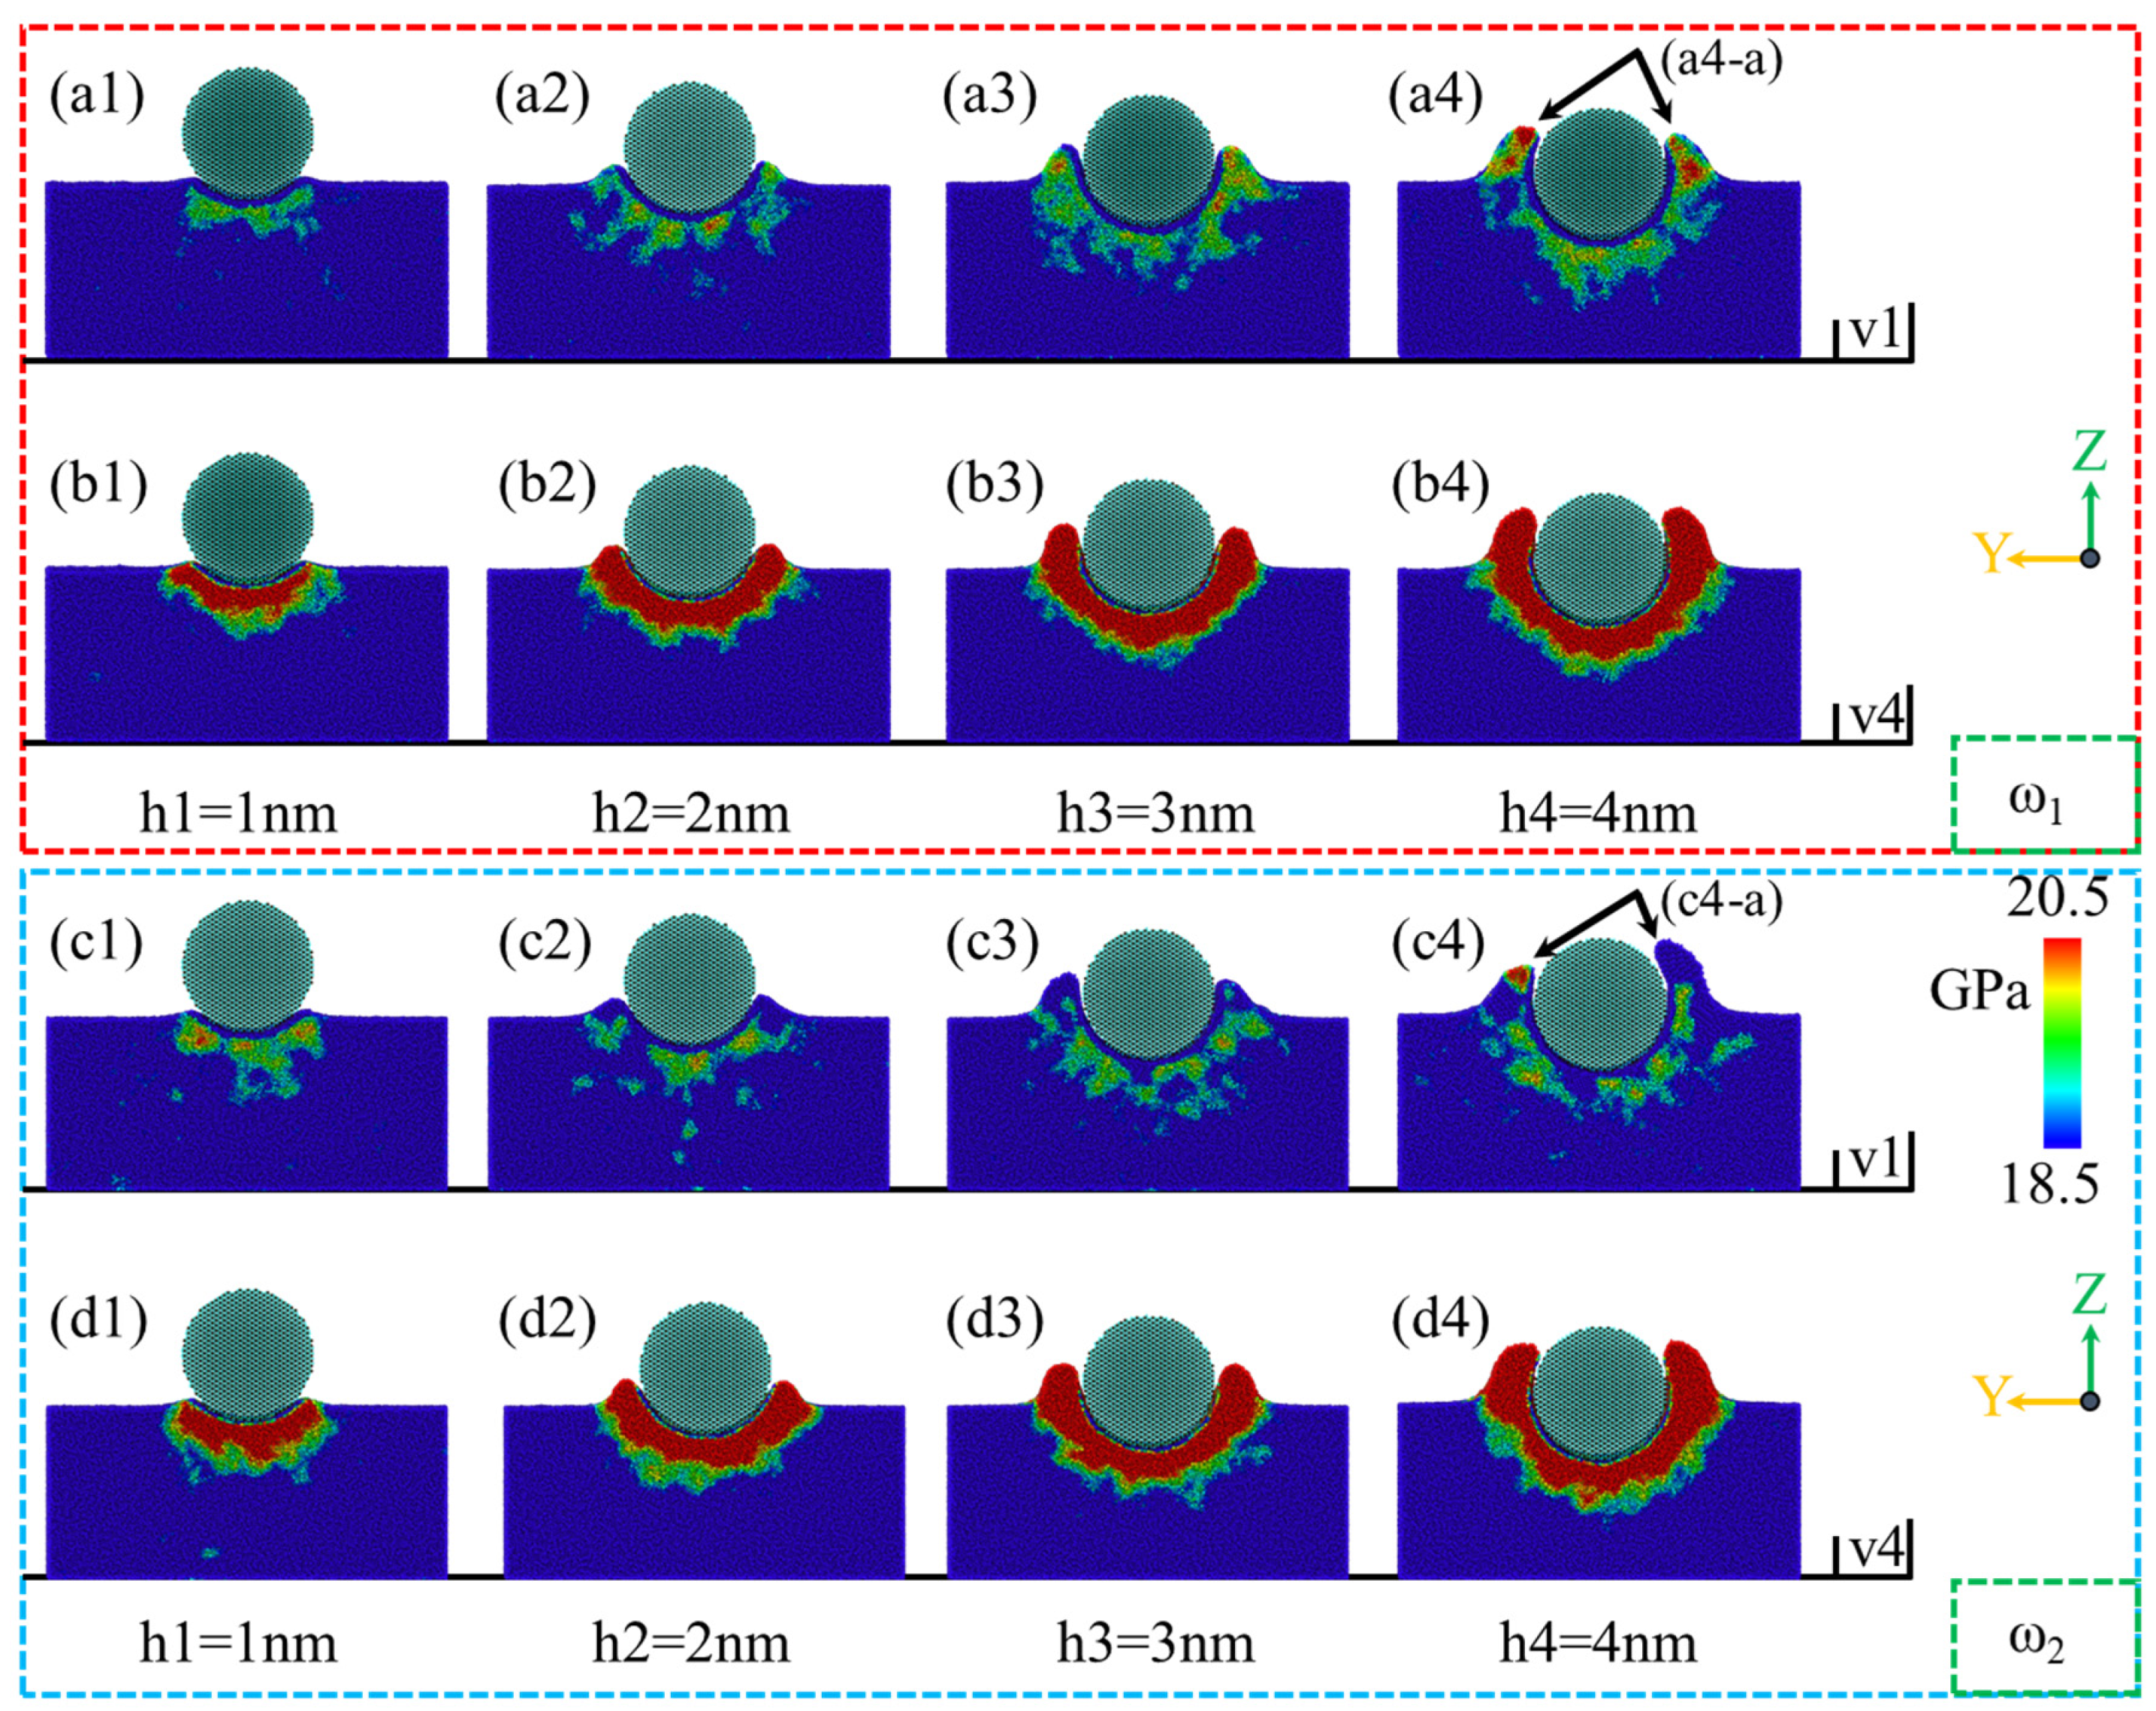
- Residual stress, primarily located beneath and in front of the abrasives, expands in range and depth at higher polishing speeds, with low-phosphorus alloys exhibiting a wider and deeper stress distribution.
- 3.
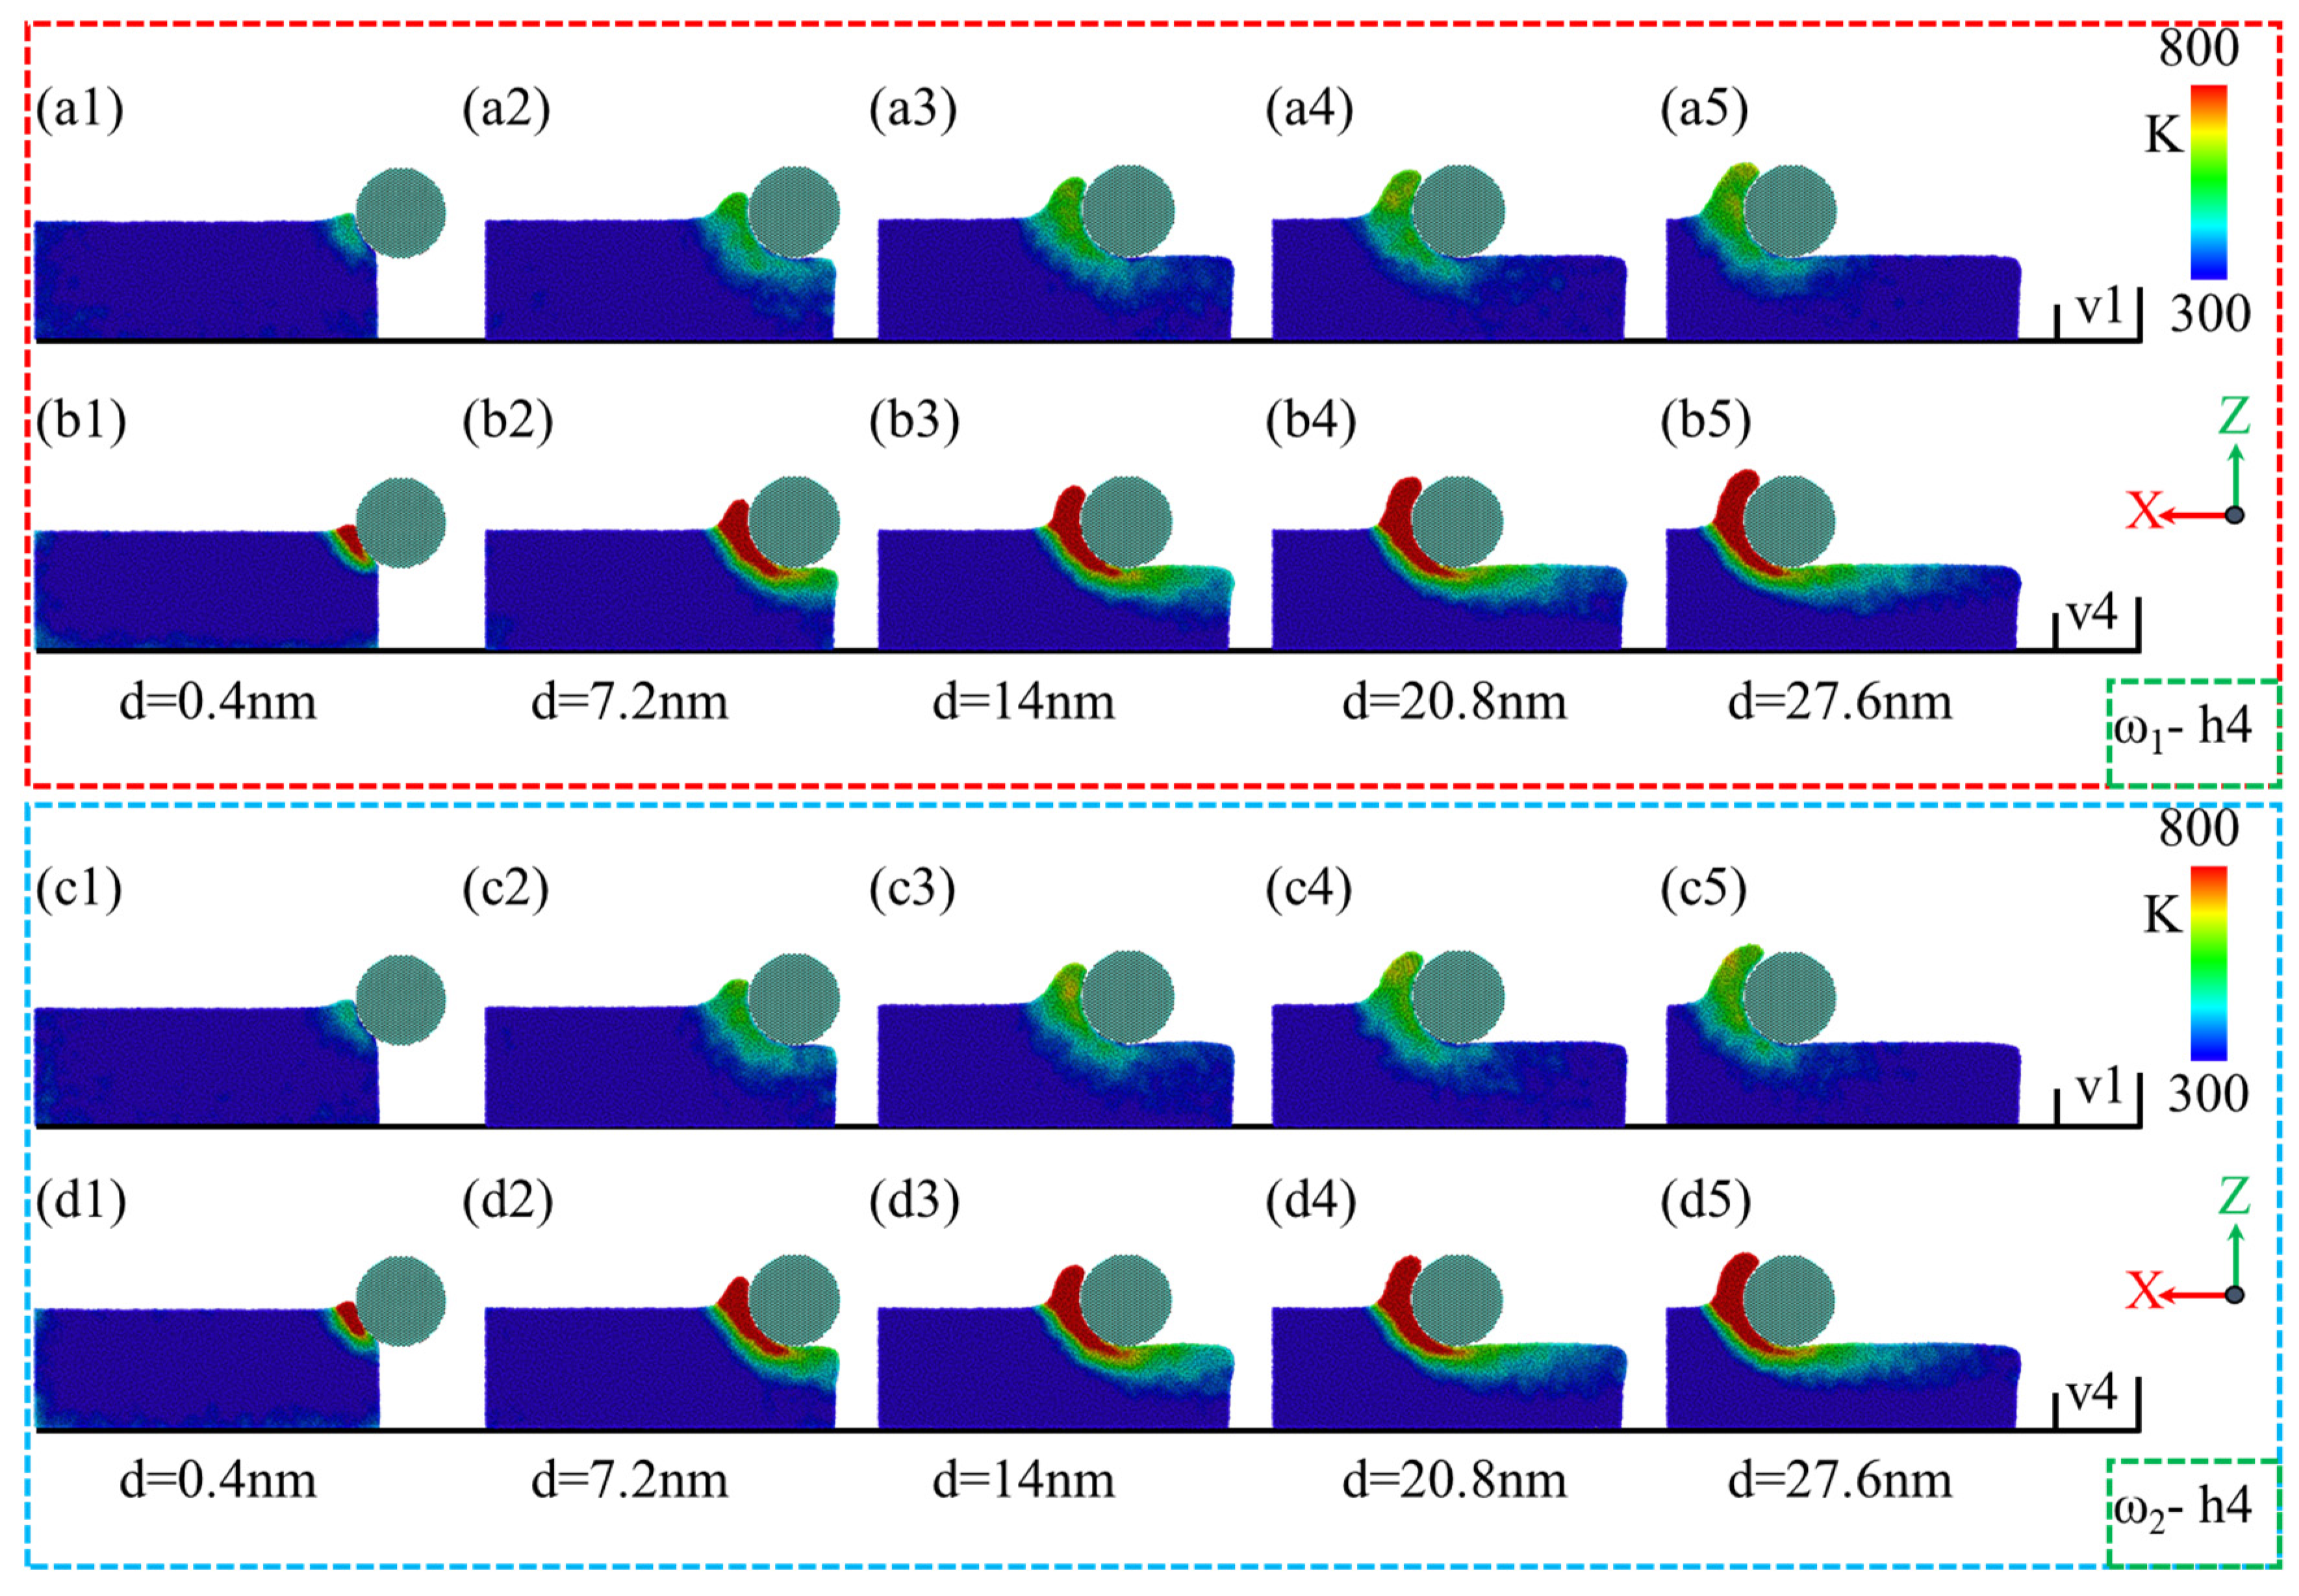
- In terms of temperature, the intense interaction between abrasives and alloys results in an increase in the temperature in the contact region. Higher polishing speeds result in more significant temperature increases, with low-phosphorus alloys showing a greater rise.
Author Contributions
Funding
Data Availability Statement
Acknowledgments
Conflicts of Interest
References
- Lee, C.K. Structure, electrochemical and wear-corrosion properties of electroless nickel-phosphorus deposition on CFRP composites. Mater. Chem. Phys. 2009, 114, 125–133. [Google Scholar] [CrossRef]
- Yang, Q.; Peng, X.; Hu, H. Study on optimization of a NiP layer polishing process on magnetorheological finishing for metal substrate. In Proceedings of the 7th Asia Pacific Conference on Optics Manufacture, Shanghai, China, 28–31 October 2021; SPIE-International Society for Optical Engineering: Washington, WA, USA, 2022; p. 4. [Google Scholar] [CrossRef]
- Kobayashi, R.; Xu, S.; Shimada, K.; Mizutani, M.; Kuriyagawa, T. Defining the effects of cutting parameters on burr formation and minimization in ultra-precision grooving of amorphous alloy. Precis. Eng. 2017, 49, 115–121. [Google Scholar] [CrossRef]
- Wang, G.; Zhou, T.; Guo, W.; Yao, X.; Yu, Q. Surface modification of nickel-phosphorus plating by Ti ion implantation for chalcogenide glass lens molding. Surf. Interfaces 2024, 48, 104375. [Google Scholar] [CrossRef]
- Zhou, T.; Yan, J.; Liang, Z.; Wang, X.; Kobayashi, R.; Kuriyagawa, T. Development of polycrystalline Ni-P mold by heat treatment for glass microgroove forming. Precis. Eng. 2015, 39, 25–30. [Google Scholar] [CrossRef]
- Schuh, C.A.; Hufnagel, T.C.; Ramamurty, U. Mechanical behavior of amorphous alloys. Acta Mater. 2007, 55, 4067–4109. [Google Scholar] [CrossRef]
- Inoue, A. Stabilization of Metallic Supercooled Liquid and Bulk Amorphous Alloys. Acta Mater. 2000, 48, 279–306. [Google Scholar] [CrossRef]
- Yan, J.; Oowada, T.; Zhou, T.; Kuriyagawa, T. Precision machining of microstructures on electroless-plated NiP surface for molding glass components. J. Mater. Process Technol. 2009, 209, 4802–4808. [Google Scholar] [CrossRef]
- Wang, W.H. Roles of minor additions in formation and properties of bulk metallic glasses. Prog. Mater. Sci. 2007, 52, 540–596. [Google Scholar] [CrossRef]
- Xu, C.; Peng, X.; Hu, H.; Liu, J.; Li, H.; Luo, T.; Lai, T. Nano-Precision Processing of NiP Coating by Magnetorheological Finishing. Nanomaterials 2023, 13, 2118. [Google Scholar] [CrossRef]
- Mainier, F.B.; Fonseca, M.P.C.; Tavares, S.S.M.; Pardal, J.M. Quality of Electroless Ni-P (Nickel-Phosphorus) Coatings Applied in Oil Production Equipment with Salinity. J. Mater. Sci. Chem. Eng. 2013, 1, 39488. [Google Scholar] [CrossRef]
- Kocabaş, M.; Örnek, C.; Curioni, M.; Cansever, N. Nickel fluoride as a surface activation agent for electroless nickel coating of anodized AA1050 aluminum alloy. Surf. Coat. Technol. 2019, 364, 231–238. [Google Scholar] [CrossRef]
- Xu, Z.; Su, Y.; Yang, H.; Guo, R.; Liu, X.; Zhang, F.; Liu, X.; Ji, T.; Zhang, Y.; Yuan, Y. Optical processing on the φ150mm SiCp/Al coating nickel phosphorus alloy plane mirror. In Proceedings of the Ninth International Symposium on Advanced Optical Manufacturing and Testing Technologies, Chengdu, China, 26–29 June 2018; SPIE-International Society for Optical Engineering: Bellingham, WA, USA, 2019; p. 106. [Google Scholar] [CrossRef]
- Jain, V.K.; Sidpara, A.; Sankar, M.R.; Das, M. Nano-finishing techniques: A review. Proc. Inst. Mech. Eng. Part C J. Mech. Eng. Sci. 2012, 226, 327–346. [Google Scholar] [CrossRef]
- Kinast, J.; Beier, M.; Gebhardt, A.; Risse, S.; Tünnermann, A. Polishability of thin electrolytic and electroless NiP layers. In Proceedings of the Conference Optifab 2015, New York, NY, USA, 11 October 2015; SPIE: Bellingham, WA, USA, 2015; p. 963311. [Google Scholar] [CrossRef]
- Wu, B.; Zong, W. A modified diamond micro chiseling method for machining large scale retroreflective microstructure on nickel phosphorus alloy. J. Mater. Process. Technol. 2022, 307, 117676. [Google Scholar] [CrossRef]
- Bao, X.; Yao, P.; Xu, J.; Mei, Z.; Li, Y.; Yang, J.; Wang, Q.; Chen, Z.; Qu, S.; Huang, C. Effect of tool geometry and cutting parameters on surface quality and chip morphology of amorphous electroless nickel-phosphorus alloy in ultra-precision turning. Int. J. Adv. Manuf. Technol. 2023, 126, 2461–2478. [Google Scholar] [CrossRef]
- Pramanik, A.; Neo, K.S.; Rahman, M.; Li, X.P.; Sawa, M.; Maeda, Y. Cutting performance of diamond tools during ultra-precision turning of electroless-nickel plated die materials. J. Mater. Process. Technol. 2003, 140, 308–313. [Google Scholar] [CrossRef]
- Xu, C.; Peng, X.; Liu, J.; Hu, H.; Lai, T.; Yang, Q.; Xiong, Y. A High Efficiency and Precision Smoothing Polishing Method for NiP Coating of Metal Mirror. Micromachines 2022, 13, 1171. [Google Scholar] [CrossRef] [PubMed]
- Dong, X.; Zhou, T.; Pang, S.; Liang, Z.; Yu, Q.; Ruan, B.; Wang, X. Comparison of fly cutting and transverse planing for micropyramid array machining on nickel phosphorus plating. Int. J. Adv. Manuf. Technol. 2019, 102, 2481–2489. [Google Scholar] [CrossRef]
- Yang, J.; Ye, J.; Liu, G.; Ye, Z.; Cui, W.; Zhang, X.; Deng, H. High efficiency polishing of micro-structured NiP alloy using isotropic electrochemical etching for achieving sub-nanometer roughness. J. Manuf. Process. 2024, 121, 20–34. [Google Scholar] [CrossRef]
- Xu, Y.; Wang, M.; Zhu, F.; Liu, X.; Chen, Q.; Hu, J.; Lu, Z.; Zeng, P.; Liu, Y. A molecular dynamic study of nano-grinding of a monocrystalline copper-silicon substrate. Appl. Surf. Sci. 2019, 493, 933–947. [Google Scholar] [CrossRef]
- Goel, S.; Luo, X.; Agrawal, A.; Reuben, R.L. Diamond machining of silicon: A review of advances in molecular dynamics simulation. Int. J. Mach. Tools Manuf. 2015, 88, 131–164. [Google Scholar] [CrossRef]
- Feichtinger, D.; Derlet, P.M.; Van Swygenhoven, H. Atomistic simulations of spherical indentations in nanocrystalline gold. Phys. Rev. B 2003, 67, 024113. [Google Scholar] [CrossRef]
- Tranchida, D.; Piccarolo, S.; Deblieck, R.A.C. Some experimental issues of AFM tip blind estimation: The effect of noise and resolution. In Meas Science and Technology; Institute of Physics Publishing: Bristol, UK, 2006; pp. 2630–2636. [Google Scholar] [CrossRef]
- Sharma, A.; Datta, D.; Balasubramaniam, R. Molecular dynamics simulation to investigate the orientation effects on nanoscale cutting of single crystal copper. Comput. Mater. Sci. 2018, 153, 241–250. [Google Scholar] [CrossRef]
- Kim, D.E.; Oh, S.I. Atomistic simulation of structural phase transformations in monocrystalline silicon induced by nanoindentation. Nanotechnology 2006, 17, 2259–2265. [Google Scholar] [CrossRef]
- Zhang, J.; Zhang, J.; Wang, Z.; Hartmaier, A.; Yan, Y.; Sun, T. Interaction between phase transformations and dislocations at incipient plasticity of monocrystalline silicon under nanoindentation. Comput. Mater. Sci. 2017, 131, 55–61. [Google Scholar] [CrossRef]
- Yin, Z.; Zhu, P.; Li, B.; Xu, Y.; Li, R. Atomic Simulations of Deformation Mechanism of 3C-SiC Polishing Process with a Rolling Abrasive. Tribol. Lett. 2021, 69, 1–18. [Google Scholar] [CrossRef]
- Liu, H.; Zhao, P.; Wu, D.; Li, D.; Wang, S.; Gao, X.; Wang, D.; Wu, X.; Huang, S.; Tan, J. Investigate on material removal of 3C-SiC crystals in nano-polishing via molecular dynamics. J. Manuf. Process. 2024, 120, 467–477. [Google Scholar] [CrossRef]
- Hadipour, A.; Daneshmand, H.; Monirvaghefi, S.M. Wear behavior of graded nickel-phosphorus coatings with a medium phosphorus top layer: An experimental and molecular dynamics simulation study. Colloids Surf. A Physicochem. Eng. Asp. 2024, 684, 133071. [Google Scholar] [CrossRef]
- Li, H.; Peng, X.; Guan, C.; Hu, H. Molecular dynamics simulation of the nano-cutting mechanism of a high-phosphorus NiP coating. J. Mater. Res. Technol. 2023, 24, 8109–8120. [Google Scholar] [CrossRef]
- Wang, Y.; Tang, S.; Guo, J. Molecular dynamics study on deformation behaviour of monocrystalline GaN during nano abrasive machining. Appl. Surf. Sci. 2020, 510, 145492. [Google Scholar] [CrossRef]
- Chen, M.; Dai, H. Molecular dynamics study on grinding mechanism of polycrystalline silicon carbide. Diam. Relat. Mater. 2022, 130, 109541. [Google Scholar] [CrossRef]
- Khan, H.M.; Kim, S.G. On the wear mechanism of thin nickel film during AFM-based scratching process using molecular dynamics. J. Mech. Sci. Technol. 2011, 25, 2111–2120. [Google Scholar] [CrossRef]
- Plimpton, S. Fast Parallel Algorithms for Short-Range Molecular Dynamics. J. Comput. Phys. 1995, 117, 1–19. [Google Scholar] [CrossRef]
- Sadeghilaridjani, M.; Yang, Y.C.; Hasannaeimi, V.; Mahajan, C.; Jha, S.; Pole, M.; Xia, Z.; Mukherjee, S. Multiscale manufacturing of amorphous alloys by a facile electrodeposition approach and their property dependence on the local atomic order. ACS Appl. Mater. Interfaces 2021, 13, 9260–9271. [Google Scholar] [CrossRef]
- Stukowski, A. Visualization and analysis of atomistic simulation data with OVITO-the Open Visualization Tool. Model. Simul. Mater. Sci. Eng. 2010, 18, 015012. [Google Scholar] [CrossRef]
- Sheng, H.W.; Ma, E.; Kramer, M.J. Relating dynamic properties to atomic structure in metallic glasses. JOM 2012, 64, 856–881. [Google Scholar] [CrossRef]
- Zhang, Z.; Xu, H.; Zhou, X.; Guo, T.; Pang, X.; Volinsky, A.A. Deformation Mechanisms of NiP/Ni Composite Coatings on Ductile Substrates. Coatings 2021, 11, 834. [Google Scholar] [CrossRef]
- Li, C.; Piao, Y.; Meng, B.; Zhang, Y.; Li, L.; Zhang, F. Anisotropy Dependence of Material Removal and Deformation Mechanisms during Nanoscratch of Gallium Nitride Single Crystals on (0001) Plane. Appl. Surf. Sci. 2022, 578, 152028. [Google Scholar] [CrossRef]
- Li, Z.; Kang, S.; Liu, H.; Liu, Y.; Ren, M.; Zhang, X.; Zhu, L.; Li, D. Molecular Dynamics Study on Burr Formation Mechanism during Monocrystalline Silicon Nano-Grinding Process. J. Manuf. Process. 2024, 131, 2505–2513. [Google Scholar] [CrossRef]
- Komanduri, R.; Chandrasekaran, N.; Raff, L.M. MD Simulation of Exit Failure in Nanometric Cutting. Mater. Sci. Eng. A 2001, 311, 1–12. [Google Scholar] [CrossRef]
- Li, C.; Zhang, F.; Meng, B.; Liu, L.; Rao, X. Material removal mechanism and grinding force modelling of ultrasonic vibration assisted grinding for SiC ceramics. Ceram. Int. 2017, 43, 2981–2993. [Google Scholar] [CrossRef]


| Parameter | Value |
|---|---|
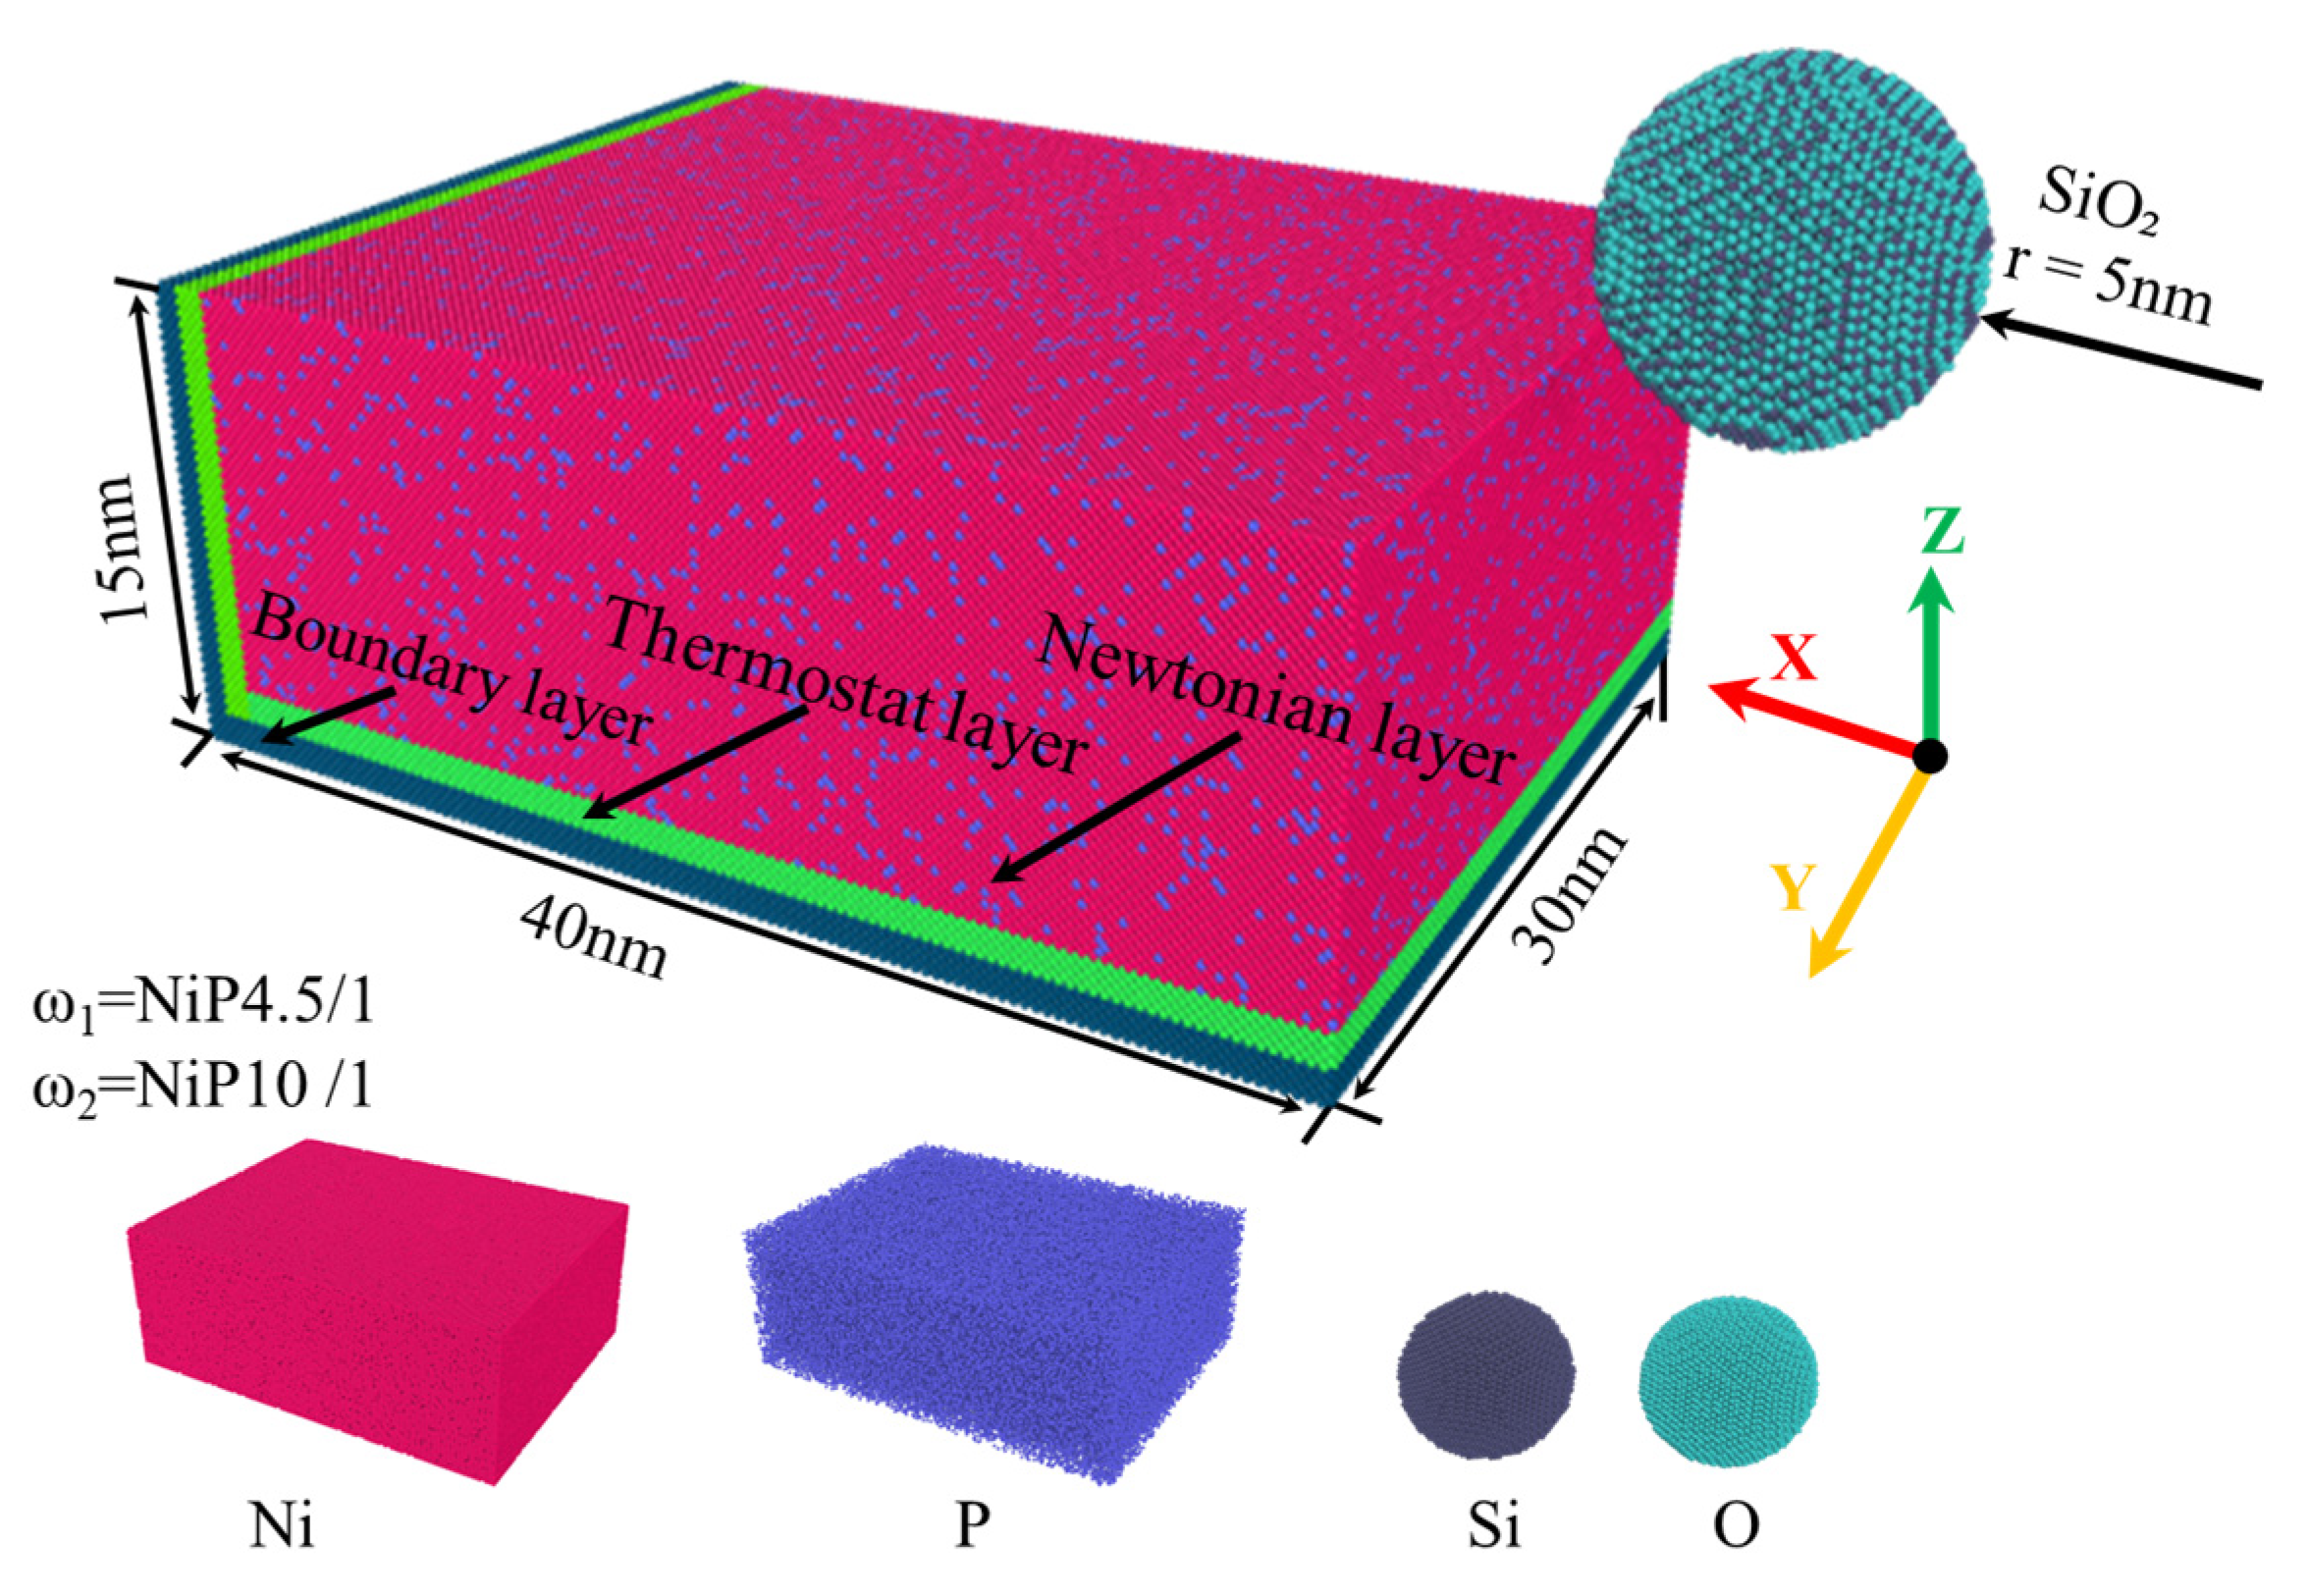
| Workpiece Material | ω1 = NiP4.5/1 and ω2 = NiP10/1 |
| Tool Material | Silica |
| Atomic Number | ω1: Ni = 1,341,880 p = 298,195; ω2: Ni = 1,490,993 p = 149,082; Tool: 47,239 |
| Workpiece Dimensions | 400 Å × 300 Å × 150 Å |
| Tool Shape | Spherical, radius 50 Å |
| Boundary Conditions | pps (periodic boundary condition in the Y direction; free boundary conditions in the X and Z directions) |
| Simulation Software | LAMMPS 64-bit 15Jun2023-MPI |
| Potential Function | Eam/alloy Tersoff |
| Timestep | 1 fs (0.001 ps) |
| Polishing Temperature | 293 K |
| Polishing Distance | 27.6 nm |
| Polishing Depth | 1, 2, 3, and 4 nm |
| Polishing Speed | 1, 2, 3, and 4 m/s |
Disclaimer/Publisher’s Note: The statements, opinions and data contained in all publications are solely those of the individual author(s) and contributor(s) and not of MDPI and/or the editor(s). MDPI and/or the editor(s) disclaim responsibility for any injury to people or property resulting from any ideas, methods, instructions or products referred to in the content. |
© 2025 by the authors. Licensee MDPI, Basel, Switzerland. This article is an open access article distributed under the terms and conditions of the Creative Commons Attribution (CC BY) license (https://creativecommons.org/licenses/by/4.0/).
Share and Cite
Xue, J.; Liu, Y.; Liao, Q.; Li, Z.; Ding, F.; Jin, Y.; Li, D.; Liu, Y.; Zhu, C.; Wu, Y.; et al. Investigation into the Influence of Polishing Depth and Speed on the Nano-Polishing Process of Nickel–Phosphorus Alloys via Molecular Dynamics. Micromachines 2025, 16, 444. https://doi.org/10.3390/mi16040444
Xue J, Liu Y, Liao Q, Li Z, Ding F, Jin Y, Li D, Liu Y, Zhu C, Wu Y, et al. Investigation into the Influence of Polishing Depth and Speed on the Nano-Polishing Process of Nickel–Phosphorus Alloys via Molecular Dynamics. Micromachines. 2025; 16(4):444. https://doi.org/10.3390/mi16040444
Chicago/Turabian StyleXue, Jiadai, Yutao Liu, Qiuyan Liao, Ziteng Li, Fei Ding, Yuan Jin, Duo Li, Yanwen Liu, Chuanrui Zhu, Yangong Wu, and et al. 2025. "Investigation into the Influence of Polishing Depth and Speed on the Nano-Polishing Process of Nickel–Phosphorus Alloys via Molecular Dynamics" Micromachines 16, no. 4: 444. https://doi.org/10.3390/mi16040444
APA StyleXue, J., Liu, Y., Liao, Q., Li, Z., Ding, F., Jin, Y., Li, D., Liu, Y., Zhu, C., Wu, Y., & Wang, B. (2025). Investigation into the Influence of Polishing Depth and Speed on the Nano-Polishing Process of Nickel–Phosphorus Alloys via Molecular Dynamics. Micromachines, 16(4), 444. https://doi.org/10.3390/mi16040444