Article

Channel Intensity and Edge-Based Estimation of Heart Rate via Smartphone Recordings

by
Anusha Krishnamoorthy
1,
G. Muralidhar Bairy
1,*,
Nandish Siddeshappa
2,
Hilda Mayrose
1,
Niranjana Sampathila
1 and
Krishnaraj Chadaga
3
1
Department of Biomedical Engineering, Manipal Institute of Technology, Manipal Academy of Higher Education, Manipal 576104, Karnataka, India
2
Manipal School of Information Science, Manipal Academy of Higher Education, Manipal 576104, Karnataka, India
3
Department of Computer Science and Engineering, Manipal Institute of Technology, Manipal Academy of Higher Education, Manipal 576104, Karnataka, India
*
Author to whom correspondence should be addressed.
Computers 2023, 12(2), 43; https://doi.org/10.3390/computers12020043
Submission received: 9 December 2022 / Revised: 2 February 2023 / Accepted: 14 February 2023 / Published: 17 February 2023
(This article belongs to the Special Issue Machine and Deep Learning in the Health Domain)

Abstract

:
Smartphones, today, come equipped with a wide variety of sensors and high-speed processors that can capture, process, store, and communicate different types of data. Coupled with their ubiquity in recent years, these devices show potential as practical and portable healthcare monitors that are both cost-effective and accessible. To this end, this study focuses on examining the feasibility of smartphones in estimating the heart rate (HR), using video recordings of the users’ fingerprints. The proposed methodology involves two-stage processing that combines channel-intensity-based approaches (Channel-Intensity mode/Counter method) and a novel technique that relies on the spatial and temporal position of the recorded fingerprint edges (Edge-Detection mode). The dataset used here included 32 fingerprint video recordings taken from 6 subjects, using the rear camera of 2 smartphone models. Each video clip was first validated to determine whether it was suitable for Channel-Intensity mode or Edge-Detection mode, followed by further processing and heart rate estimation in the selected mode. The relative accuracy for recordings via the Edge-Detection mode was 93.04%, with a standard error of estimates (SEE) of 6.55 and Pearson’s correlation r > 0.91, while the Channel-Intensity mode showed a relative accuracy of 92.75%, with an SEE of 5.95 and a Pearson’s correlation r > 0.95. Further statistical analysis was also carried out using Pearson’s correlation test and the Bland–Altman method to verify the statistical significance of the results. The results thus show that the proposed methodology, through smartphones, is a potential alternative to existing technologies for monitoring a person’s heart rate.

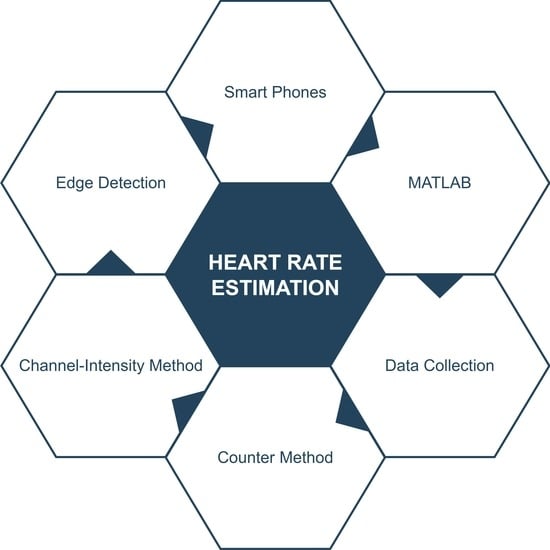
Graphical Abstract

1. Introduction

Cardiovascular diseases (CVDs) remain one of the most frequent causes of early mortality and loss of disability-adjusted life years (DALYs) globally [1]. This class of heart-related disorders includes but is not limited to stroke, coronary artery disease, and peripheral vascular disease and is seen as a public health issue in several countries with heavy economic reparations [2]. In India alone, CVD made up about 27% (as of 2015) of all deaths in the country, with such numbers only increasing in crisis-level proportions in older demographics [3]. The significance of this issue is further underlined by the fact that official figures such as these are often underreported in developing countries, particularly rural regions, due to discrepancies in data collection and misclassification of asymptomatic CVD-related deaths. Furthermore, inadequate evidence-based treatment is seen here, leading to treatment delays that further exacerbate CVD symptoms [4]. Current practices also necessitate regular visits or lengthy stays at costly medical institutions. All of this, compounded by a scarcity of qualified healthcare workers, limited financial capabilities, and rising healthcare expenses, contributes to the hindrances in establishing good long-term health monitoring [5]. Hence, there is a dire need for changes in the current healthcare system. One way to strengthen the diagnostic pipeline for such diseases would be to encourage patients to proactively keep track of their vital parameters. Contact sensors such as electrodes in the form of chest straps or finger clips can be used to sense physiological changes and offer a baseline insight into the functioning of our bodies. They can also reflect symptoms of ongoing problems within. In fact, monitoring vitals has the potential to aid in the early detection of patient deterioration, which in turn could improve rapid response timeliness [6]. Hence, they can be used as the first line of basic diagnosis and follow-up [7].
The heart rate (HR) is one such vital sign, and it provides essential diagnostic information about existing cardiovascular diseases. It can be measured acoustically by listening to the heartbeats as amplified by the stethoscope. The number of beats is typically observed for a small period and then multiplied by a factor to estimate the total beats per minute. These observations can also be made via the pulse felt at the wrist or neck. For more precise measurements, however, acquisition based on the electrical nature of the cardiac activity, namely electrocardiography (ECG), is used. Here, changes in electrical potentials from the membranes of the cardiac cells are observed via a number of strategically placed electrodes, which, when interpreted together, produce the electrocardiogram [8]. This technique is the gold standard for detecting and monitoring a host of cardiac conditions. However, its measurement requires continuous sensor attachment to the chest, which can be a source of discomfort and inconvenience in situations that require long-term monitoring. Furthermore, it hinders patient mobility and flexibility [9].
Photoplethysmography (PPG) is another technique to measure the HR wherein an optical waveform, the photoplethysmogram, is generated by measuring changes in light absorbed or reflected by tissues due to changes in local blood volume during the cardiac cycle. The heartbeat determines the duration of each pulse generated, while the concentration of various constituent parts of arterial blood and the path length of the light traveling through the arteries determine the amplitude [10]. PPG acquisition systems are more straightforward, cost-effective, and relatively comfortable to use and can thus be an excellent substitute for traditional ECGs. However, they are still inconvenient to use on a day-to-day basis and require the carrying around of extra hardware. Despite this, a major pro of this technique would be its ability to acquire cardiac data from multiple points in the patient’s body, such as the earlobe, wrist, forehead, ankle, torso, and fingertip [11]. Exploiting this, smart devices, such as smartwatches, today come equipped with sensors to monitor vitals, specifically at the wrist. This is an ideal area for measurement since cardiac activity can be detected here at minimal discomfort to the wearer in the long term. Current models in the market, such as those by Fitbit® (San Francisco, CA, USA) and Jawbone® (San Francisco, CA, USA), track a variety of physiological parameters in this manner. However, physiological signals at the wrist have very low amplitude, thus smartwatches require highly sensitive transducers to properly pick them up. Moreover, the wrist region is also susceptible to motion artifacts due to hand movements and other everyday activities. External environmental noise can also potentially hamper the collection of PPG signals, thus lowering the accuracy of the estimated HR [8]. As a result, PPG’s practical implementation and reliability in real-time monitoring use cases become limited. Moreover, smartwatches come with an added purchase cost and may not be widely available and accessible to everyone.
However, there is one other smart device that is not only ubiquitously used today but can also be exploited for patient monitoring at no added cost to the user: the smartphone. There are currently 3.8 billion smartphone users worldwide, with these figures only projected to increase in the coming years [12]. Incremental developments in sensor, battery, and display technologies have paved the way for modern mobile devices to become an essential part of our entertainment, health and fitness, productivity, and social lives today. Smartphones today are also embedded with a wide variety of sensors such as cameras, ambient light sensors, global positioning system (GPS) sensors, accelerometers, and microphones [13]. These sensors can continuously monitor several health parameters, thus making the smartphone a practical, portable healthcare system alternative for recurrent daily usage [14]. This study focuses on developing a PPG-like measurement system to calculate HR via existing smartphone hardware. As described earlier, the key motivation for utilizing smartphone PPG over other wearable sensors is that it requires minimal hardware. Given the widespread availability of smartphones with built-in cameras, utilizing them to acquire health data is an excellent option when ECGs or other medical devices are unavailable [15]. Most of today’s cellular phones include high-resolution cameras, processors, and light-emitting diode (LED) flashes. This hardware is similar to PPG imaging technology. Instead of utilizing a smartphone only to store and display data, it can also directly be used to capture information and measure readings. Moreover, as per studies conducted in [16,17,18], the average HR obtained using smartphone PPG is comparable to those obtained using gold standard ECGs. In this manner, heart rate observations can be made in a robust, low-cost manner that is easily accessible to users worldwide and comes at minimal cost and discomfort to them.
However, the studies previously cited are based solely on changes in mean channel intensity and produce varying results depending on the RGB channel chosen. The distribution of green and blue channel pixels also varies vastly from smartphone model to smartphone model [19]. The works [20,21,22] also involve cropping of the central portion of the recorded video to decrease the added computational complexity that comes with full frame processing. This could potentially lead to a loss in signal information and thus potentially hinder robust results. As a result, we choose to modify these existing methodologies with the addition of a novel fingerprint edge-based HR calculation technique. This edge-based technique is less susceptible to issues due to color differences between different smartphone models.
Thus, the study conducted introduces a two-stage mechanism to estimate a person’s heart rate using the back camera of a smartphone. A novel method for heart rate calculation based on the change in the spatial position of the fingerprint ridges is described here. This technique is coupled with a channel-intensity-based technique that offers an alternative to the former method in situations with incompatible hardware. Validation techniques have also been included in the overall heart rate calculation architecture in order to select the appropriate method based on the data recorded. The contributions of this study are summarized as follows:
  • Developing of a novel two-stage mechanism to calculate user’s heart rate via their smartphone.
  • Providing a detailed analysis of the results so obtained via relative performance accuracy and standard error of estimates (SEE).
  • Performing agreement analysis between actual and calculated heart rates using Pearson’s correlation and the Bland–Altman method, to validate results.
This paper is organized as follows: Section 2 presents a survey of recent work in the area of this study. Section 3 provides a detailed explanation of the proposed methodology, including dataset acquisition and preparation. The experimental results and comparative performance of both stages of the proposed methodology are enumerated in Section 4. Discussion involving the statistical analysis of the results is given in Section 5. Finally, Section 6 concludes the paper and discusses the future scope of the work.

2. Related Works

It has been shown that continuous heart rate signals can be extracted from video cameras and then be processed to monitor additional vital indicators such as breathing rate and heart rate variability.
Pelegris et al. [23] suggested a novel approach for detecting heart rate using a Nokia N95 smartphone. This paper recommended analyzing the brightness information of the grayscale component of each video frame recorded while the user’s finger remained on the lens. To guarantee acquisition reliability, the input signal was matched to a rudimentary heartbeat pattern. The proposed algorithm was able to estimate the user’s heart rate with an average error of 4.67% for their dataset. Jonathan and Leahy [20] measured pulse rates with a Nokia E63 smartphone and concluded that the green channel delivers a more significant PPG signal than the red channel. A central region of interest measuring 10 × 10 pixels was chosen to compute the mean intensity value, and a Fourier transform spectral analysis was used to determine the heart rate. An Android application was created by Gregoski et al. [24], and exploratory testing was carried out on a Motorola Droid smartphone to compare the performance to a Nonin Onyx II model 9560BT ambulatory finger pulse oximeter under different conditions of monitoring: sitting, reading, and playing video games. It was found that the smartphone heart rates were highly correlated with those from the pulse oximeter under all conditions (rs ≥ 0.99, SEE ≤ 2.09 bpm). Scully et al. [25] created a method for monitoring physiological parameters using optical recordings from a smartphone. A Motorola Droid smartphone was used to capture the movies, and the PPG value was calculated at each frame as the 50 × 50 pixel average of the green channel region. A heart rate signal was generated from the recordings and peak detection was carried out. The mean ± SD was 92.3 ± 5.9 bpm. An Android smartphone was used to check a proposed algorithm’s robustness by Hoan et al. [22]. Researchers collected 400 recorded samples to test the system, and a medical device called the Beurer BC08 was simultaneously used as a reference to validate the accuracy of the results. The proposed algorithm gave an r value of 0.9525 and an SEE of 2.448.

3. Methods and Materials

The proposed work consists of two modes for HR calculation, namely the Edge-Detection mode and the Channel-Intensity mode. Depending on the type of video data acquired and the smartphone model used to acquire them, processing is carried out in either one of these modes. Initially, the video is validated to see if the Edge-Detection mode is enough to produce the HR readings. It involves frame-wise pre-processing and Canny edge detection, followed by a reference frame selection which is used to determine count value for HR measurement. If the edge-detection technique cannot be employed, a measurement based on mean channel intensity is performed. Here, the mean red channel intensity of each frame is used to produce a raw PPG-like signal, to which peak detection is applied after pre-processing. The heart rate is then calculated by finding the mean distance between the identified peaks. The Edge-Detection mode algorithm was developed to demonstrate a proof of concept for heart rate estimation using image processing techniques. The working of this mode is then compared and contrasted with the Channel-Intensity mode, which makes use of traditional signal processing methods. Both methods are described in detail in Section 3.2 and Section 3.3, respectively. All processing in the proposed work was carried out in MATLAB, version r2021a. Block diagram of the entire study is depicted in Figure 1.

3.1. Dataset Collection and Description

This section presents the data acquisition method that is subsequently used for developing the HR measurement system. Mimicking the functioning of traditional PPG acquisition systems, our design utilizes the camera sensor of the smartphone as a photodiode and the camera flash of the smartphone as the LED light source, to produce a set of video recordings.
The data were collected using the camera application on 2 consumer-grade smartphone models: One plus 7 and Xiaomi Redmi 7A. Their specifications are detailed in Table 1. It was experimentally determined that, for good fingerprint edge detection in later stages, the camera flash of the smartphone needed to be located below the back camera and not next to it on the side. It was also important that in newer smartphone models with multiple different types of back camera lenses, the macro lens was not located immediately above the flash. This is because, in both these cases, it was difficult to observe the spatial movement of the fingerprint ridges with time and estimate the HR. As a result, recordings from iPhone models have not been included in this dataset. However, users with such smartphone models can still make use of the methodology proposed in this work by opting to use the second stage of processing, as described in Section 3.3.
During the data acquisition stage, subjects were instructed to place their right index finger lightly over both the back camera of the smartphone and camera flash, in such a manner that the upper tip of the finger fully covered the camera lens, while the central portion of the finger rested on the flash. With the camera application opened, and the flash turned on, the illuminated finger was then recorded. These recordings were carried out with the subjects sitting down to ensure minimal movement during the acquisition process.
Simultaneously, a commercial pulse oximeter (Vandelay C101H1) was attached to the subject’s left hand to measure the heart rate of the subject during the acquisition process. This was carried out to validate the calculated measurements later on. The camera settings, as described in Table 1, and ambient lighting remained fixed to ensure consistency between recording sessions among the subjects. The video data used here were collected for 6 participants, with ages ranging from 21 to 52. Of the 2 male and 4 female participants, each provided 2 to 7 recordings, as described in Table 2. Each video recorded was resized to have a resolution of 720 × 1440 with a sampling rate of 30 fps, for a duration of 3–5 s. It was also ensured that acquisition sessions were spaced out (from 10–15 min) to obtain different ranges of heart rates. A total of 32 video files were recorded and saved as an .mp4 file.

3.2. Edge-Detection Mode

This initial stage of the proposed methodology calculates the HR from the video recordings based on an edge-detection mechanism. This mechanism is independent of channel-intensity processing, and involves a pre-processing stage where the fingerprint ridges are detected followed by a counter mechanism based on the RMSE value between the video frames.
The working of the Edge-Detection mode can be summarized as follows (see Figure 2): each video sample is first broken down into its respective frames which are then cropped. Next, the video sample is assessed to see if it meets the requirements to be analyzed by this mode. To do this, each frame is first converted to grayscale and then contrast-adjusted and sharpened. After this, the Canny edge-detection algorithm is employed to detect fingerprint ridges on each frame. If we are able to clearly observe the ridges on each frame, we use this algorithm for heart rate calculation. If not, the video is then processed using the Channel-Intensity mode algorithm (Section 3.3).

3.2.1. Pre-Processing and Edge Detection

A copy of each recorded video was first made and then broken down into its individual frames using the VideoReader function in MATLAB. The frame rate was then reduced to 20 fps via the same function and the extra frames were discarded. This was carried out to maintain uniformity in HR calculation. Block diagram for Edge-Detection mode is described in Figure 2.
All videos were cropped to dimensions of 720 × 1440 so that they could be processed independently of the smartphone model. Each of these frames was saved as a numbered .PNG file, in order of their temporal occurrence. To determine whether these recordings were made in accordance with the requirements of this algorithm, the pre-processing and filtering stages were carried out as follows:
The frames were first converted to grayscale by retaining only the luminance information and eliminating saturation and hue. This was carried out using the standard formula to convert from the RGB to NTSC format [26]. Through this, a weighted sum of the R, G, and B channel components was produced as per Equation (1):
0.2989 R ( x , y ) + 0.5870 G ( x , y ) + 0.1140 B ( x , y ) = P ( x , y )
Here, R ( x , y ) , G ( x , y ) , and B ( x , y )   refer to the red, green, and blue channel intensities, respectively, for a pixel with position ( x , y ) and intensity P ( x , y )   in a frame.
Following this, frame-wise contrast adjustment was carried out such that the bottom 1% and top 1% pixel intensity values were rescaled, as per Equation (2):
P ( x , y ) = { 0 , 255 ,     i f   P ( x , y ) < 200   i f   P ( x , y ) > 225
In this particular use-case, it was found that the majority of the pixels (98%) had an intensity range from 210–215. The 1% of pixels having intensity values below this were assigned black, while the top 1% pixels with a range above this were assigned white. Finally, the pixels falling within the majority range were rescaled from 0 to 255. The contrast of the resulting image was increased in this manner.
These frames were then sharpened using an unsharp marking operator, as described in [27]. This operator enhances the fingerprint ridges in the frame by first subtracting a blurry (unsharp) version of the frame from the original frame, I ( x , y ) ,   to produce the edge-description frame, I e ( x , y ) . The blurry frame, I b l u r r e d   ( x , y ) , is obtained by passing the original frame through a Gaussian low-pass filter to introduce a smoothening effect, as shown in Equation (3).
I e ( x , y ) = I ( x , y ) I b l u r r e d   ( x , y )
I s h a r p ( x , y ) = I ( x , y ) + k I e   ( x , y )
To produce the final sharpened image, I s h a r p ( x , y ) , the original frame was added to a scaled version of the edge-description frame, as in Equation (4). Here, k is the scaling constant, which ranges from 0–2. It is set as 1.2 (default value).
At this stage, edge detection was carried out on each of the processed frames to visualize the fingerprint ridges in the recorded video. Five different edge-detection methods, namely Sobel, Prewitt, Roberts, Laplacian of Gaussian (LoG), and Canny, were compared to determine the best performing one. During this process, the grayscale frames were automatically binarized as result of the filter, and each pixel was classified as an ‘edge pixel’ or a ‘non-edge pixel’. Frame-wise fingerprint pre-processing is described in Figure 3.
Ultimately, the Canny method was chosen to perform frame-wise detection of the fingerprint ridges. A visual comparison of their performance and further discussion regarding the selection of the edge operator can be seen in Section 5.
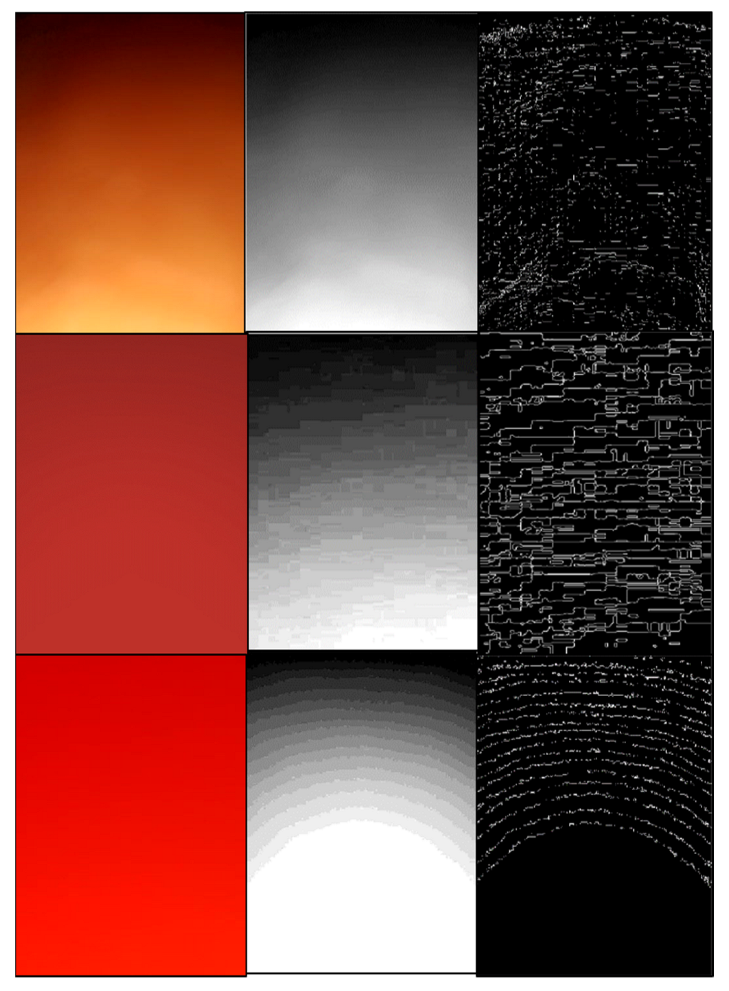
Despite this, if the angle in which the finger is placed is not proper or if the pressure exerted on the lens and flash is too much or too little, the edges may not be properly detected. This can be seen in Figure 4. Hence, it is important to ensure that users record the video clips only after proper finger placement to obtain accurate results. However, in cases where such recordings are produced, they are not immediately discarded. Instead of further processing in the Edge-Detection stage, the video frames are passed on to the second stage of the processing architecture, the Channel-Intensity stage, as described in Section 3.3, wherein another round of validation is performed to see if the recorded data are still usable.

3.2.2. Heart Rate Calculation

Once pre-processing within this stage was carried out, frames that had the fingerprint edges labeled on them were generated. Since these frames follow a temporal order, when played back it is possible to see the spatial movements of the ridges with respect to time. The spatial locations of the ridges follow an approximately cyclical pattern, wherein the ridges move up and down periodically. It is through the monitoring of this cyclical motion that the HR of the subject is calculated.
Firstly, a reference frame is selected within the first observed full cycle, i.e., within the first 20 recorded frames. Given a cycle, a frame is considered to be the reference frame if its lower-most detected ridge is located closest to the base of the frame, compared to other frames in that cycle. This type of frame marks the beginning of a new cycle. This is shown for the sample video recording in Figure 5, wherein the difference in bottom-most ridge distance between the selected reference frame and another frame for a particular cycle can be seen. Hence, edge detection is carried out primarily as a means to visually identify the reference frame.
Once a reference frame was selected, the root mean squared error (RMSE) between the grayscale version of this frame and all other grayscale frames temporally located after the reference frame was tabulated. Comparison of finger placement styles is described in Figure 4.
The RMSE value tells us the difference in spatial positions of the ridges between the reference frame and all other frames in a recording. The smaller the RMSE value, the more similar the given frame is to the reference frame. This can be calculated as shown in Equation (5):
R M S E r j = j = 1 N ( I r ( x , y ) I j ( x , y ) ) 2 N
Here, I r ( x , y ) and I j ( x , y ) refer to the intensity distribution of the reference frame and the remaining frames, respectively, while N refers to the total number of pixels per frame.
Using this technique, we can determine the ongoing stage of the cycle in each frame. As a result of these calculations, we observe a contiguous and cyclical pattern of zero and non-zero error scores corresponding to each video frame. A counter was set such that the number of times this error value switched to and from the zero baseline could be counted. This count value is analogous to the mean distance calculation in PPG-based HR measurements after systolic peak detection. Figure 5 describes the reference frame selection.
Finally, the HR of the subject is calculated using Equation (6):
H e a r t   R a t e = 60 × C o u n t e r   V a l u e V i d e o   D u r a t i o n
As mentioned earlier, if there is an issue with edge detection or reference frame selection because of finger placement or the smartphone model used, due to which HR calculation via the Edge-Detection stage cannot be carried out, the recorded video is sent to the Channel-Intensity stage, as described in the following section, for further validation. Edge-detected frames generated for one cycle for a sample video in the dataset are shown in Figure 6.

3.3. Channel-Intensity Mode

This stage involves processing of the video frames based on variations in recorded channel intensity, as summarized in Figure 7, and is thus used in case processing is not possible in the previous stage. A different type of pre-processing scheme is used here followed by a peak-detection mechanism and HR measurement. The functioning of the Channel-Intensity stage is explained in detail in the following sections.

3.3.1. Pre-Processing

Here, the copy of the video recording created for the Edge-Detection stage is discarded and the original video, with its initial frame rate, is used for further processing.
However, before using the video recording for the generation of a PPG-like signal, its frames are first validated to see if the finger placement on the camera and illumination condition provided by the flash are sufficient. This is carried out by comparing the mean red channel intensity against a threshold range. The frame validation criterion is as described in Equation (8):
μ R = x , y R ( x , y ) N
f r a m e i = { A c c e p t e d ,         i f     R e j e c t e d ,       i f     220 > μ R   180 o t h e r w i s e   }
Here, R ( x , y ) refers to the red channel intensity of a pixel with position ( x , y ) for a given f r a m e i   while N refers to the total number of pixels in the frame. The threshold range for comparison was experimentally determined to be 180–220. If more than 10% of the frames in the recording fell below this threshold, the recording was discarded and the subject was prompted to re-record the video. Poor video quality could be a result of a gap between camera lens and finger or unintentional finger movement, thus creating artifacts. The red channel was particularly selected for processing in this stage as recordings in this channel tend to have uniformity across a wide variety of smartphone brands, thus ensuring minimal variation in HR calculation [19].
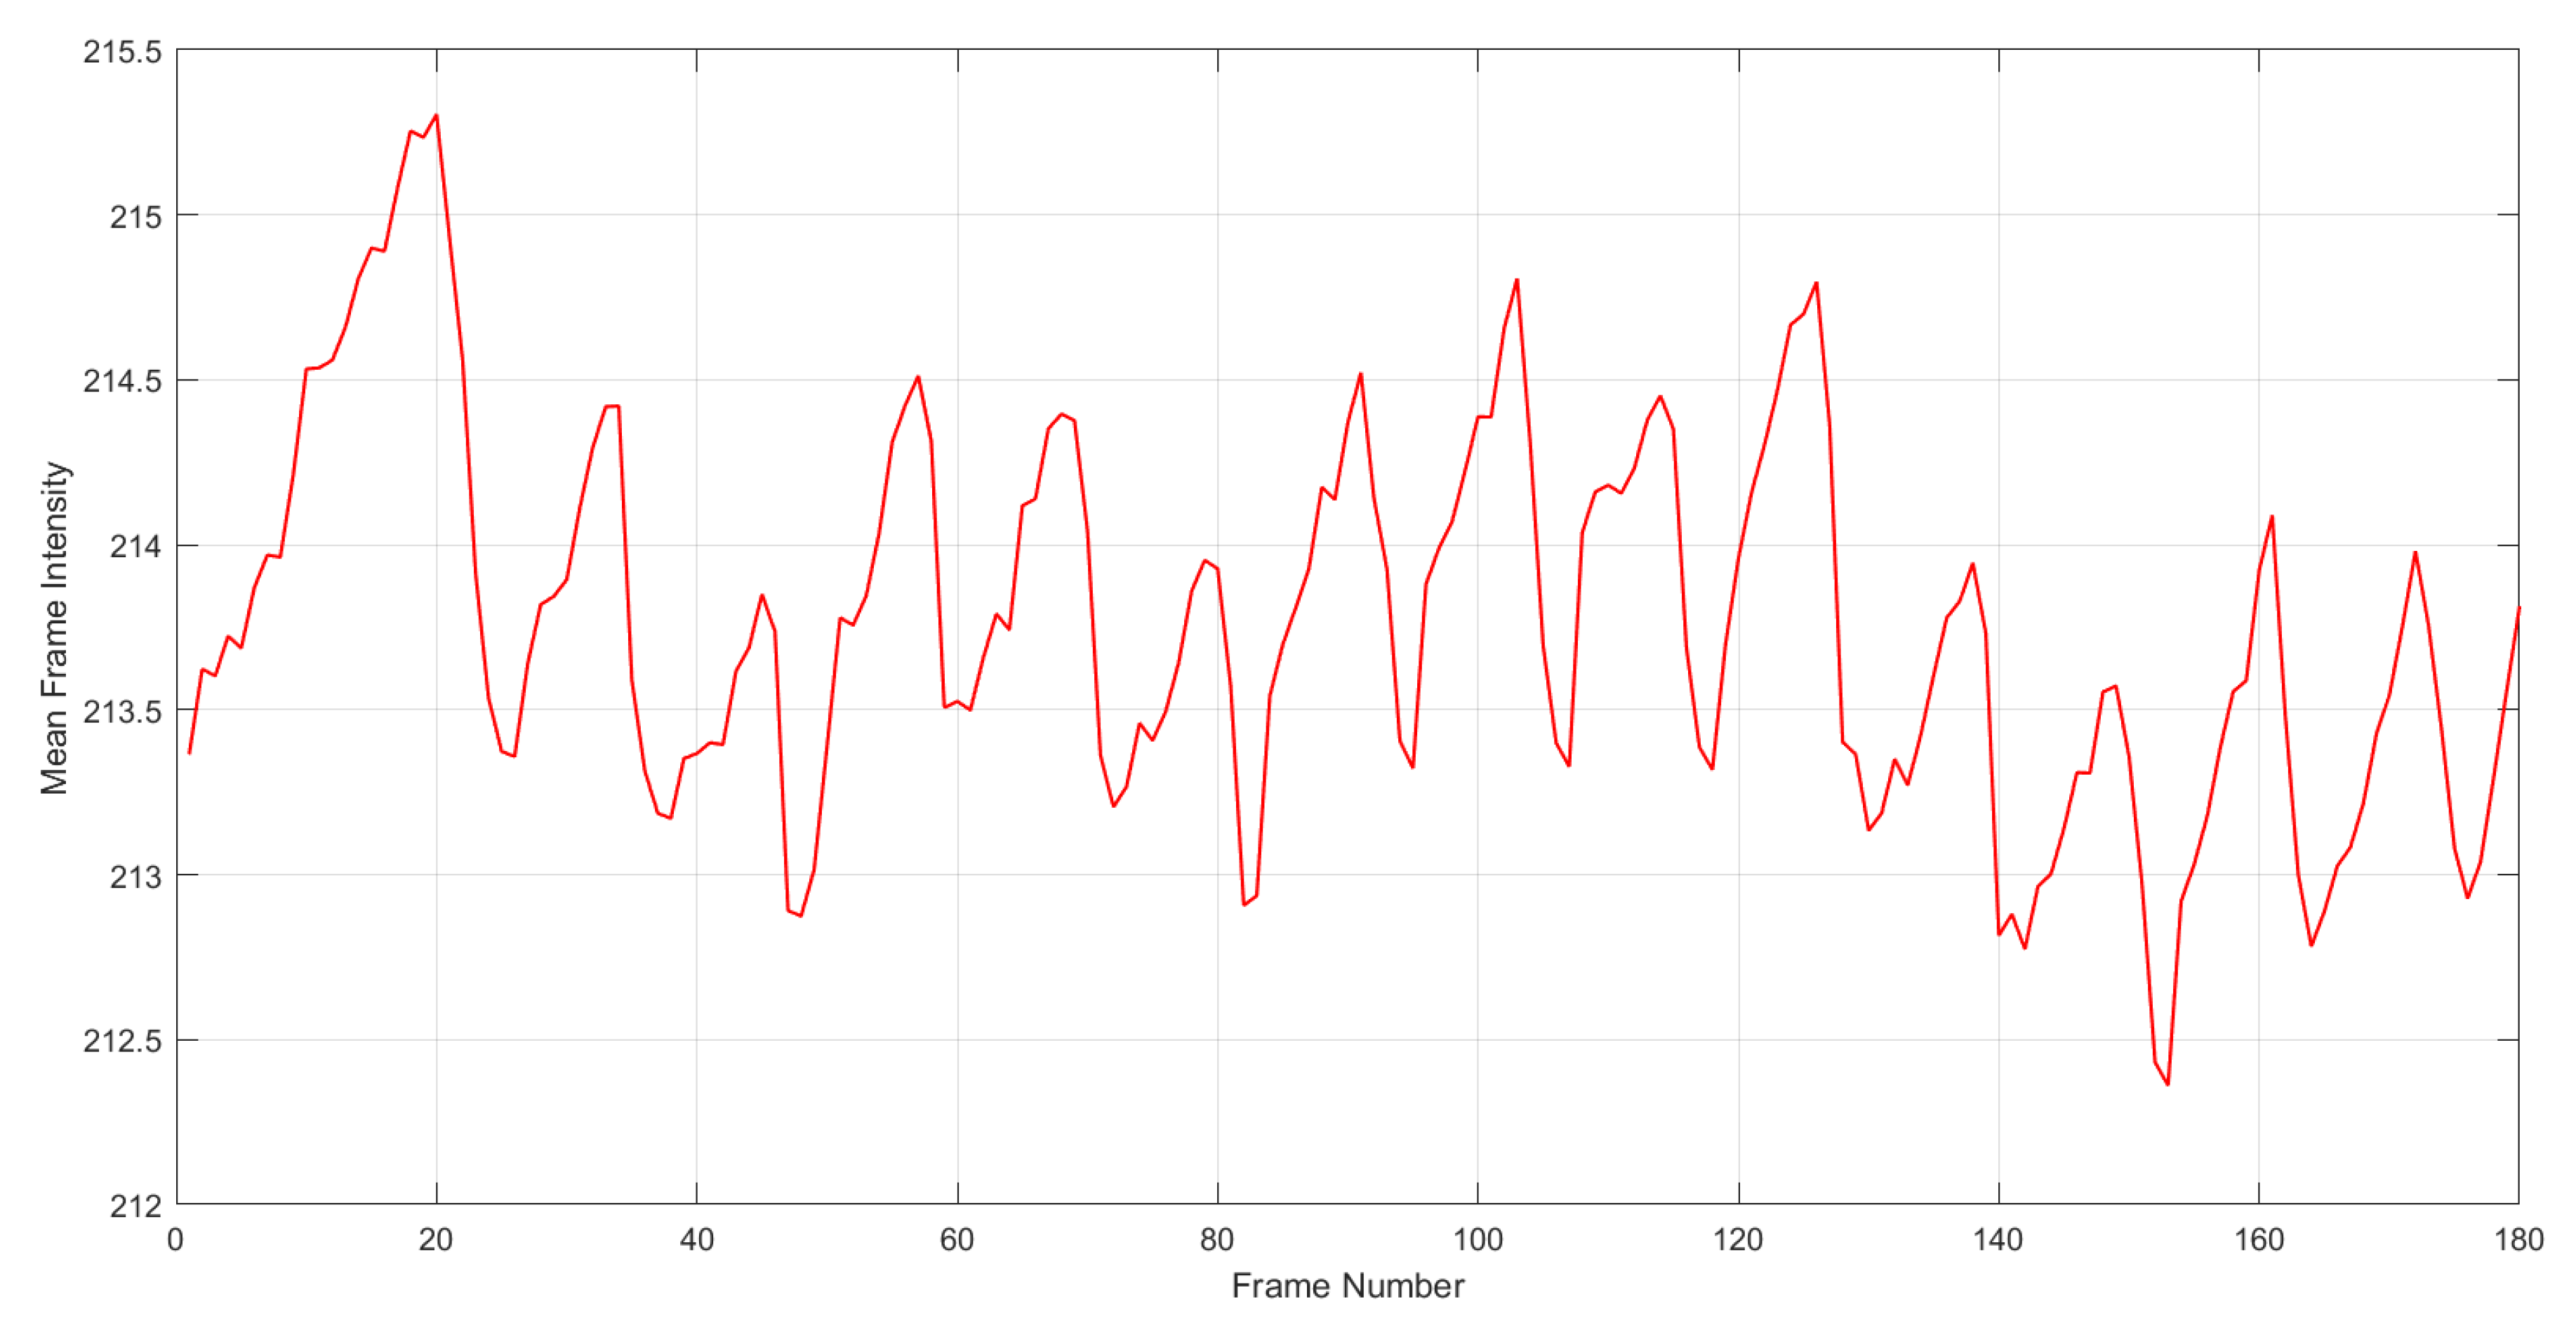
Once a suitable number of video frames met the threshold criteria, the mean red channel intensities calculated as per Equation (7) were plotted as a function of frame number to generate a PPG-like signal. This is demonstrated for a sample recording in Figure 8. Reflection mode PPG devices commonly make use of a green LED light source, as its wavelength has ideal tissue penetration capabilities. The camera flash on smartphones, however, produces white light and thus leads to noisier measurements [28]. As a result, the pre-processing stage is vital to generate an accurate PPG-like signal for accurate processing in later stages. Raw PPG-like signal generated from the frame-wise mean red channel intensity for sample video is described in Figure 8.
To this end, the amplitude of the raw signal, s ( n ) , was first normalized to range between [–1,1] to ensure more accurate peak detection during the following stages of processing. This was carried out as described in Equation (9):
s n o r m ( n ) = 2 ( s ( n ) min ( s ( n ) ) max ( s ( n ) ) min ( s ( n ) ) ) 1
This normalized signal, s n o r m ( n ) ,   is then detrended using a detrending filter to remove background noise and stationary components in the raw signal [29]. The ‘trend’, which is the line of best fit for the signal, is subtracted from the elements of the original signal as in Equations (10) and (11). Detrending forces the signal mean to zero, thus decreasing the overall variation.
y t r e n d ( n ) = m n + c  
s d e t r e n d e d   ( n ) = s n o r m ( n ) y t r e n d ( n )
Here, the trend line, y t r e n d ( n ) , is defined by its slope m and its y-intercept c. To the detrended signal, s d e t r e n d e d   ( n ) ,   a 5-point moving average filter is applied to suppress existing motion artifacts. This filter not only smoothens the signal by averaging out unnecessary fluctuations in the data but also retains the sharp step response, thus highlighting the peaks in the signal [30].
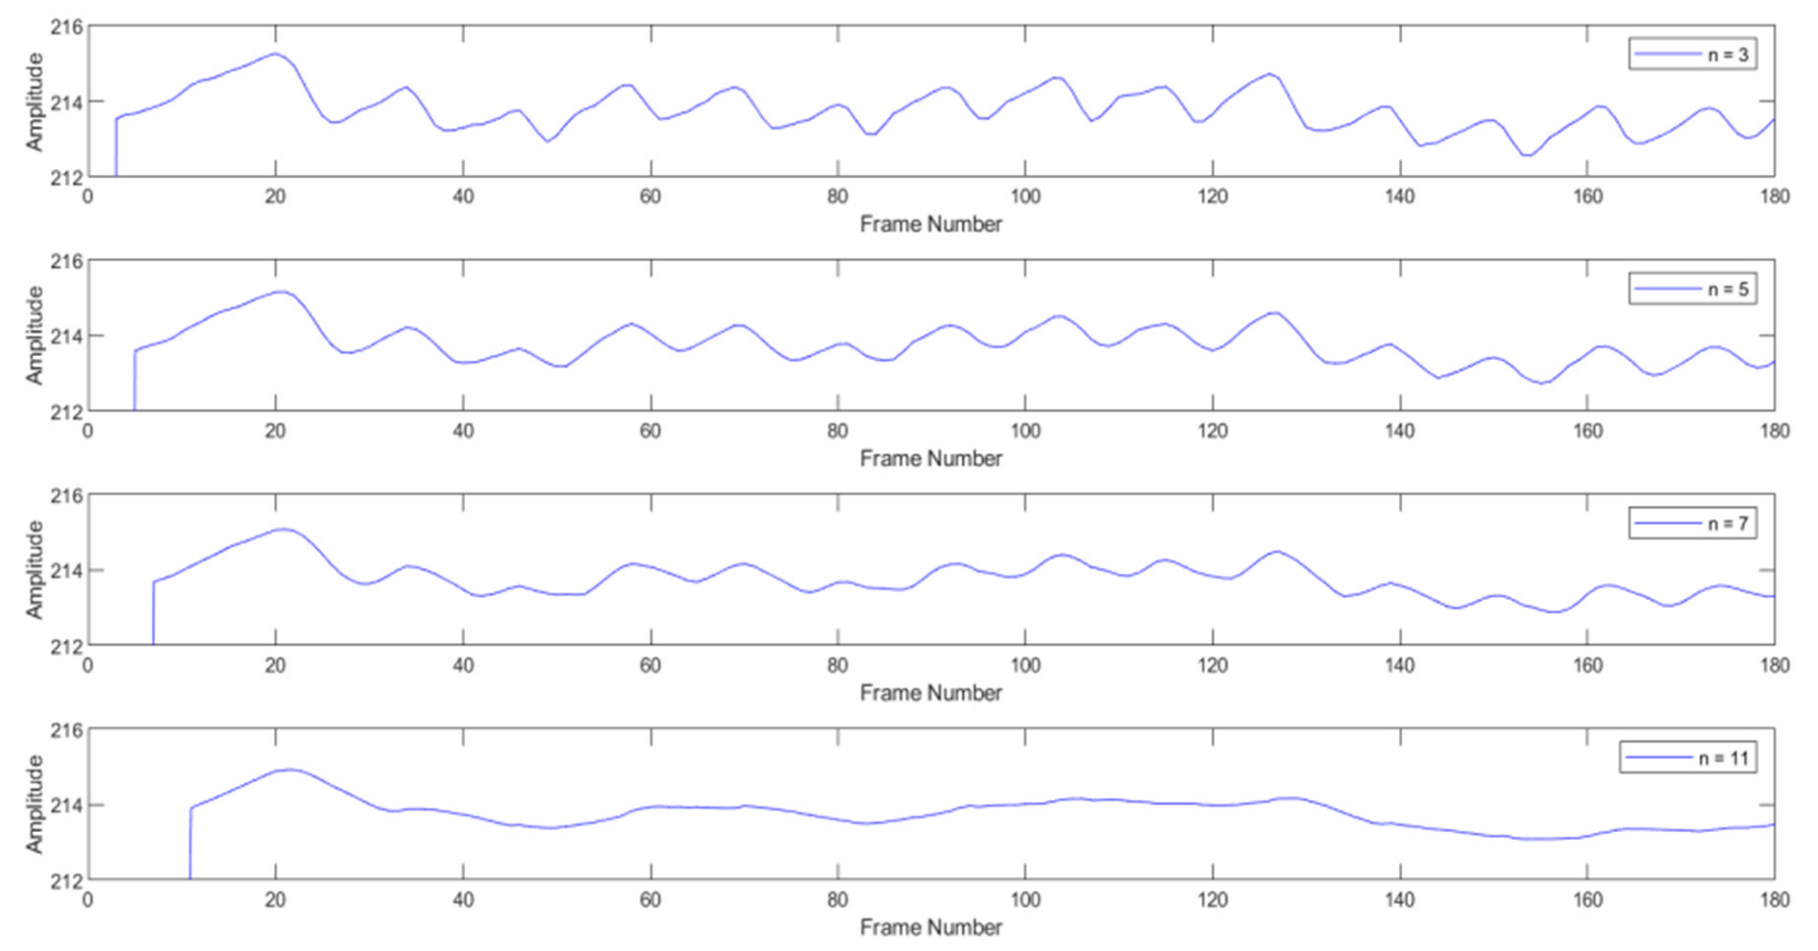
Different window sizes were compared to empirically determine the best fit for this application. It was found that a 3-point window did not offer enough signal smoothening, while anything above a 7-point window size appeared to completely suppress the peaks in the raw PPG-like signal, thus making it unusable for further processing. Hence, a window size of 5 was found to be most suitable for our use-case. Note, odd window sizes were chosen for comparison to create a symmetric window for calculation. The output of the moving average filter is given as Equation (12):
s M A ( n ) = 1 5 i = 0 4 s d e t r e n d e d ( n i )
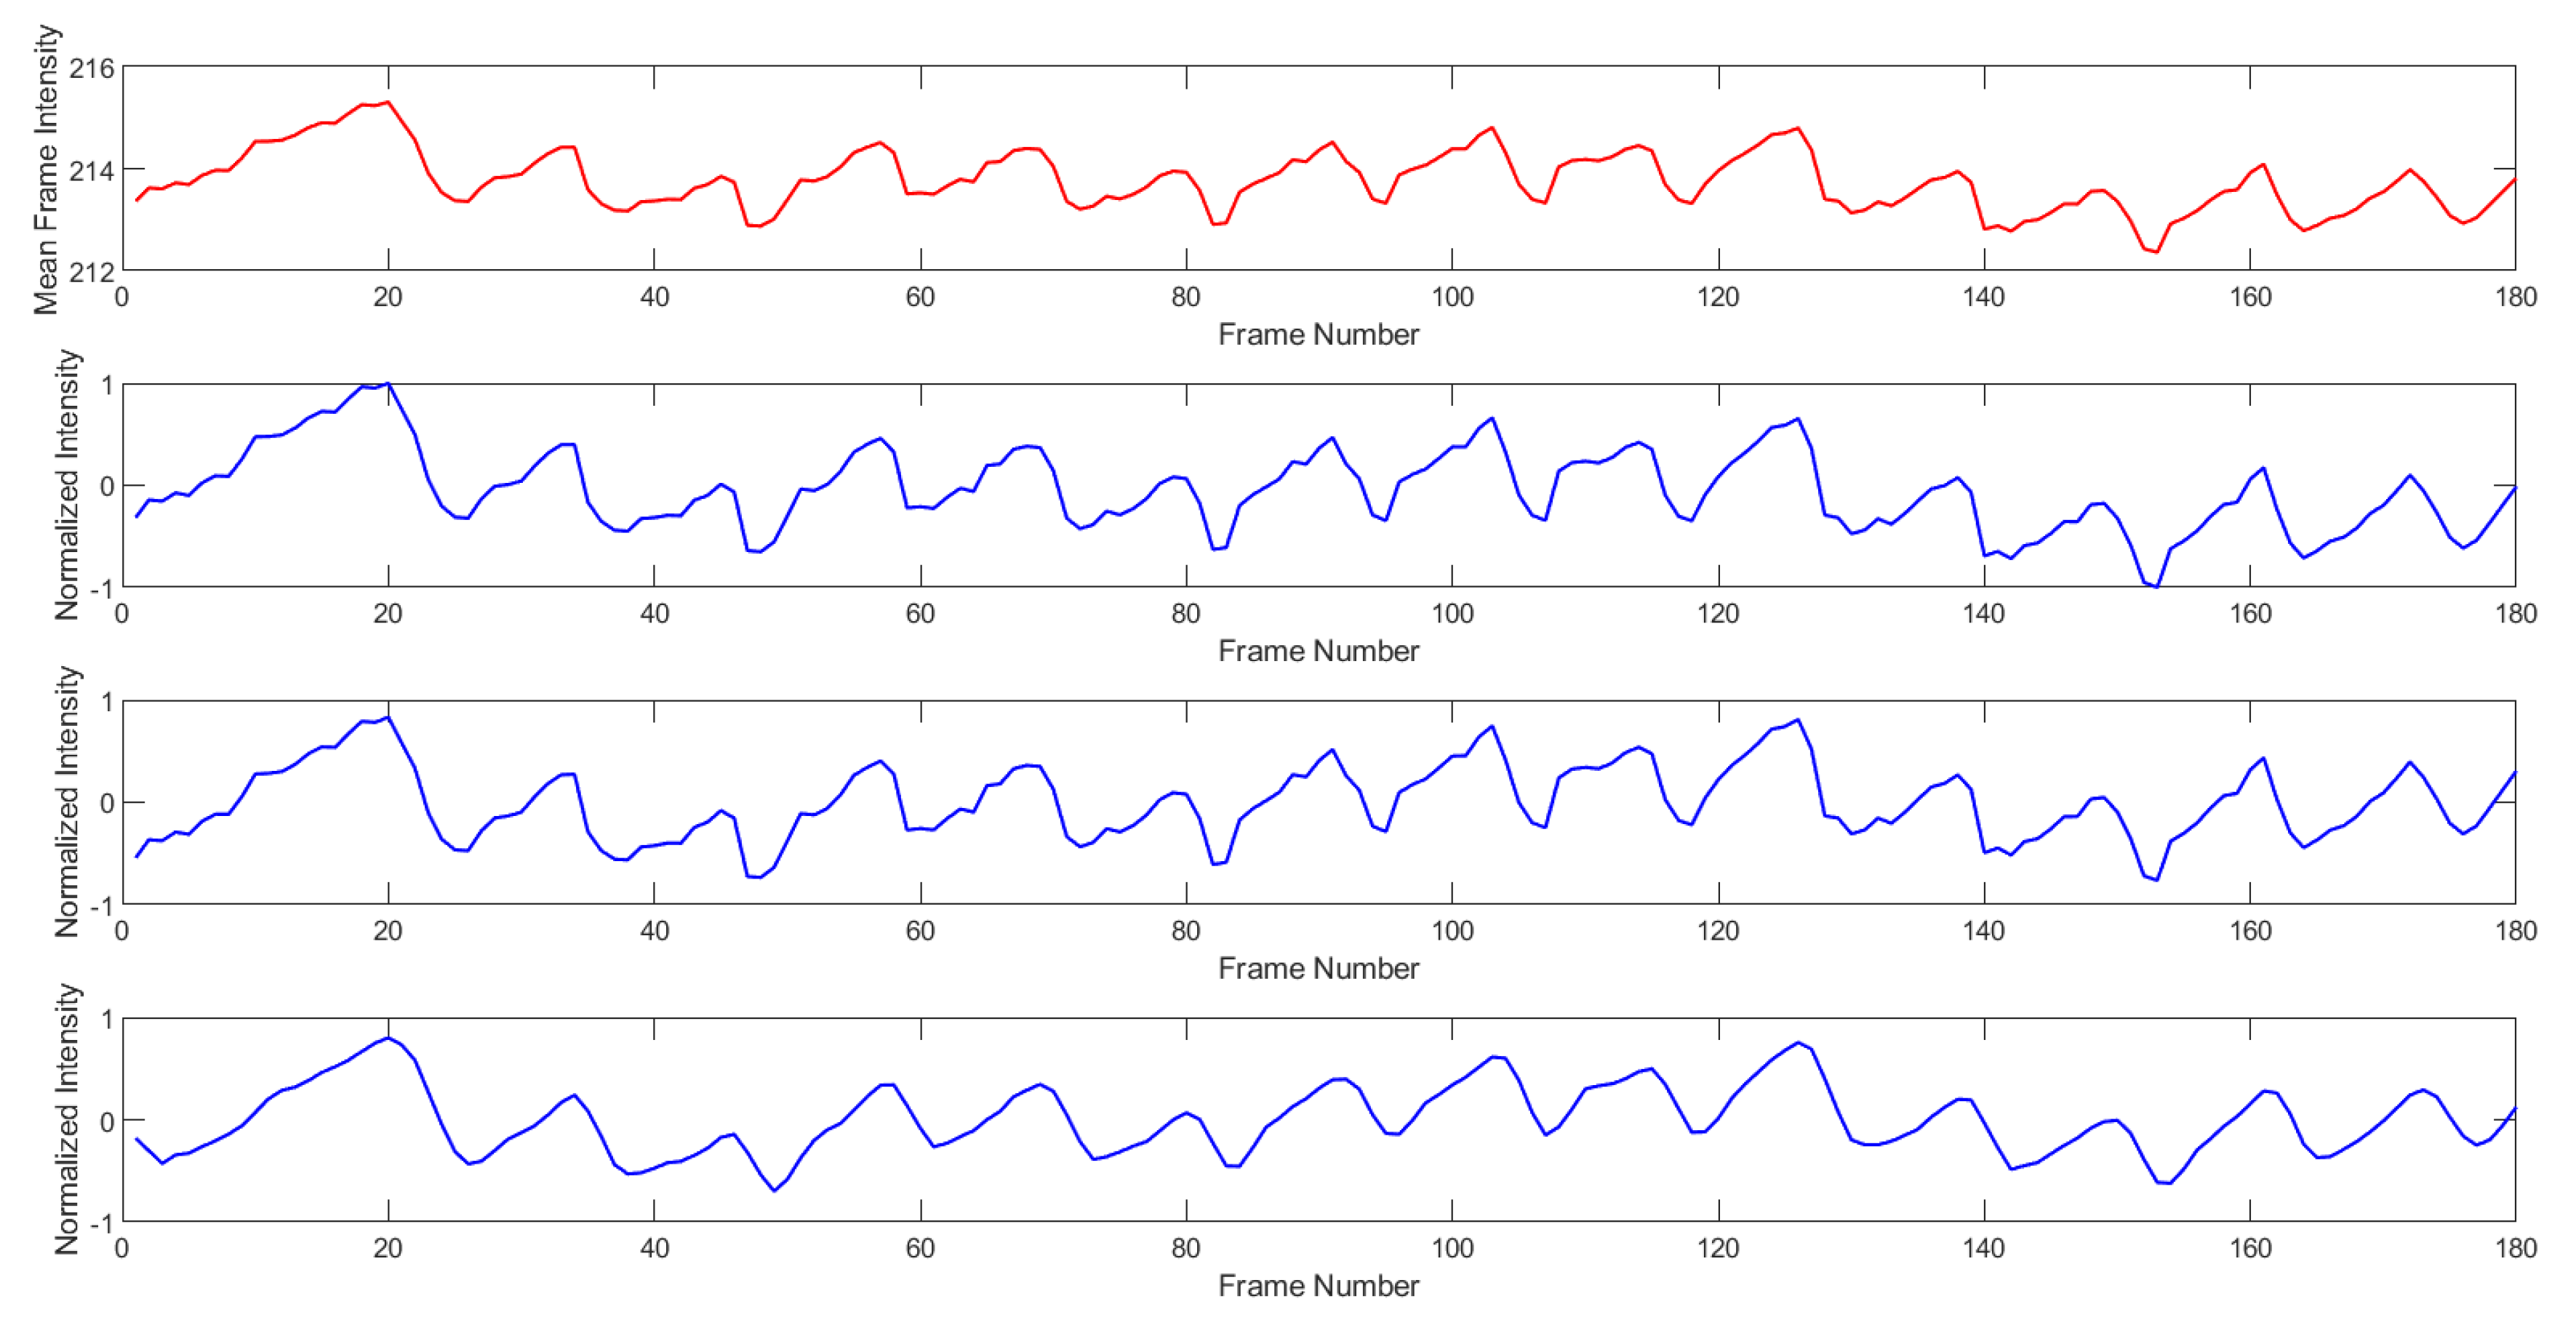
These steps produce a signal that can be used for peak detection and HR measurement. Effect of ‘N’-point moving average filter on the signal for different values of ‘N’ is described in Figure 9. The effect of pre-processing on the raw signal can be seen in Figure 10.

3.3.2. Heart Rate Calculation

In this step, a peak-detection algorithm is first utilized to determine the local maxima in the pre-processed signal as in [22]. These peaks are analogous to the systolic peaks observed in PPG signals. A peak is considered to be a local maximum if its amplitude is larger than or equal to 5 data samples before and after it. This was implemented using the findpeaks() function.
This selection scheme is described in Equation (13).
p e a k = { s M A ( n ) > [ s M A ( n 5 ) ,   s M A ( n 4 ) ,   s M A ( n 3 ) ,   s M A ( n 2 ) ,   s M A ( n 1 ) ,                                                         s M A ( n + 5 ) ,   s M A ( n + 4 ) ,   s M A ( n + 3 ) ,   s M A ( n + 2 ) ,   s M A ( n + 1 ) ] }  
However, at this stage there is still a chance of detecting false peaks. To avoid this, candidate peaks are further selected from this collection of local maxima by using an exclusion criterion that is based on peak-to-peak distance, as described in Equations (14) and (15):
d m i n   = 60 × F r a m e r a t e H R m a x  
d m a x   = 60 × F r a m e r a t e H R m i n
Here, H R m i n   and H R m a x     refer to the lowest and highest value of heart rate that is expected to be measured, respectively. The lower cap was set as 50 beats per minute while the upper cap was set as 200 beats per minute. Initially, the distances between all successive detected peaks were calculated. Following this, certain peaks were discarded if the distance between them and successive peaks was lower than d m i n   or greater than d m a x   . After this, the successive distances between the leftover peaks within the d m i n   d m a x   range were determined and averaged to obtain the mean peak distance value, d m e a n . The final output of the peak detection on a sample video recording is shown in Figure 11.
Finally, the HR through this stage is calculated using Equation (16):
H e a r t   R a t e = 60 × F r a m e   R a t e d m e a n
In this manner, the HR of a subject can be calculated through fingerprint recordings via a smartphone. The pseudocode for the full methodology is provided in Algorithm 1.
Algorithm 1: Overview of Data Acquisition, Processing, and Measurement of Heart Rate
Input: Path to main folder with ‘N’ number of video recordings
Output: ‘N’ heart Rate measurements corresponding to ‘N’ recordings
//Save all recordings in main folder for processing
1 for i = 1-->N do
2 Extract all frames from video i
3 if smartphone model compatible == True then
//EDGE-DETECTION METHOD
4 frames_copy = duplicates of video i frames
5 Discard frames from frames_copy to reduce frame rate to 20 fps
6 for j = 1→ __ (num_frames_duplicate) do//Do for all frames in frames_copy
//Generation of edge-detected frames
7 Crop frame j to be of dimension 720 x 1440
8 //Processing before mode validation
9 Convert RGB frame j to grayscale
10 Adjust contrast of frame j
11 Sharpen frame j
12 Perform edge detection on frame j using Canny method
13 End
14 if edges clear AND spatial movement of edges visible == True then
//Heart Rate Measurement
15 Select Reference Frame
16 for j = 1 → num_frames do//Do for all edge-detected frames
17 Calculate RMSE between grayscales of reference frames and frames with temporal position after reference frame
18 End
19 counter = number of times RMSE value switches between zero and non-zero values
20 HR = (60 × counter)/vid_length / /Video length in seconds
21 return HR
22 continue/ /Begin next iteration, i.e., calculate HR for next video
23 else/ /Validate mean red channel frame intensities
24 bad_count = 0
25 for k = 1 → num_frames_orginal do//Do for original full set of frames in video
26if 180 <mean red channel intensity of frame k <220 then
27 bad_count = bad_count + 1
28 End
29 if bad_count < 0.1(num_frames_original) then
//CHANNEL-INTENSITY METHOD
30 Generate raw PPG-like signal
31 Normalize signal
32 Detrend signal
33 Apply 5pt. moving average filter to signal
34 Find local maxima in signal//based on amplitudes of 5 samples before and after current sample
35 dmin = (60 × Frame rate)/50
36 dmax = (60 × Framerate)/200
37 for peak = 1→ num_local_maxima do//Candidate peak selection
39Calculate distance between successive peaks
40 if dmin < peak_distance < dmaxthen
41 candidate_peak = peak
42 else discard peak
43 End
44 mean_distance = average distance between candidate peaks
45 HR = (60 × Framerate)/mean_distance
46 return HR
47 else discard video
48 End

4. Experimental Results

The proposed algorithm was evaluated for the acquired dataset, and the performance for each recording is summarized in Table 3. Recordings wherein the users had provided improper finger placement were discarded. The proposed algorithm also filtered out unreliable recordings as described in the previous section.
Thirteen videos from the total dataset were processed via the Edge-Detection method while the remaining nineteen videos made use of the Channel-Intensity method. The average relative accuracy for videos classified via the Edge-Detection method was 93.04%, while the average relative error was 6.54%. In the case of the Channel-Intensity method, HR measurements had an average relative accuracy of 92.75% and an average relative error % in this mode was 7.24%.
To describe the overall accuracy of the predictions using both modes of measurement, the standard error of estimates (SEE) was calculated, as in Equation (17). Table 4 displays the correlation coefficients and standard errors of estimates (SEE) for the different conditions.
S E E = i = 1 N ( y i y i   ^ ) 2 N
Here, y i and y i   ^ refer to the actual and predicted HR measurements for a recording I, respectively. N is the total number of recordings.

Agreement Analysis

In order to examine whether the predicted HR values from the proposed methodology and the actual recorded HR values are in agreement, Pearson’s correlation coefficient (r) and the Bland–Altman ratio (BAR) were determined. While the correlation plots provide insight about the strength, direction, and form of the relationship between two continuous variables, the Bland–Altman plot is used to determine actual differences in measurements between the two methods used [31,32].
Pearson’s correlation coefficient was calculated as per Equation (18), and describes the magnitude or strength of linear correlation between the actual and predicted HR measurements [17].
r = i = 1 N ( y i y ¯ ) ( y i ^ y ^ ¯ ) i = 1 N ( y i y ¯ ) 2 i = 1 N ( y i ^ y ^ ¯ ) 2
In order to determine the corresponding p value, a Student’s t-test was performed as in Equation (19):
t = r n 2 1 r 2
Here, n refers to the number of degrees of freedom which is N-2. For the Pearson correlation coefficients calculated, a p value < 0.05 was considered statistically significant.
The predicted HR was considered to be within an acceptable range if the Pearson correlation (r) between the actual recorded HR and the predicted HR was more than 0.9.
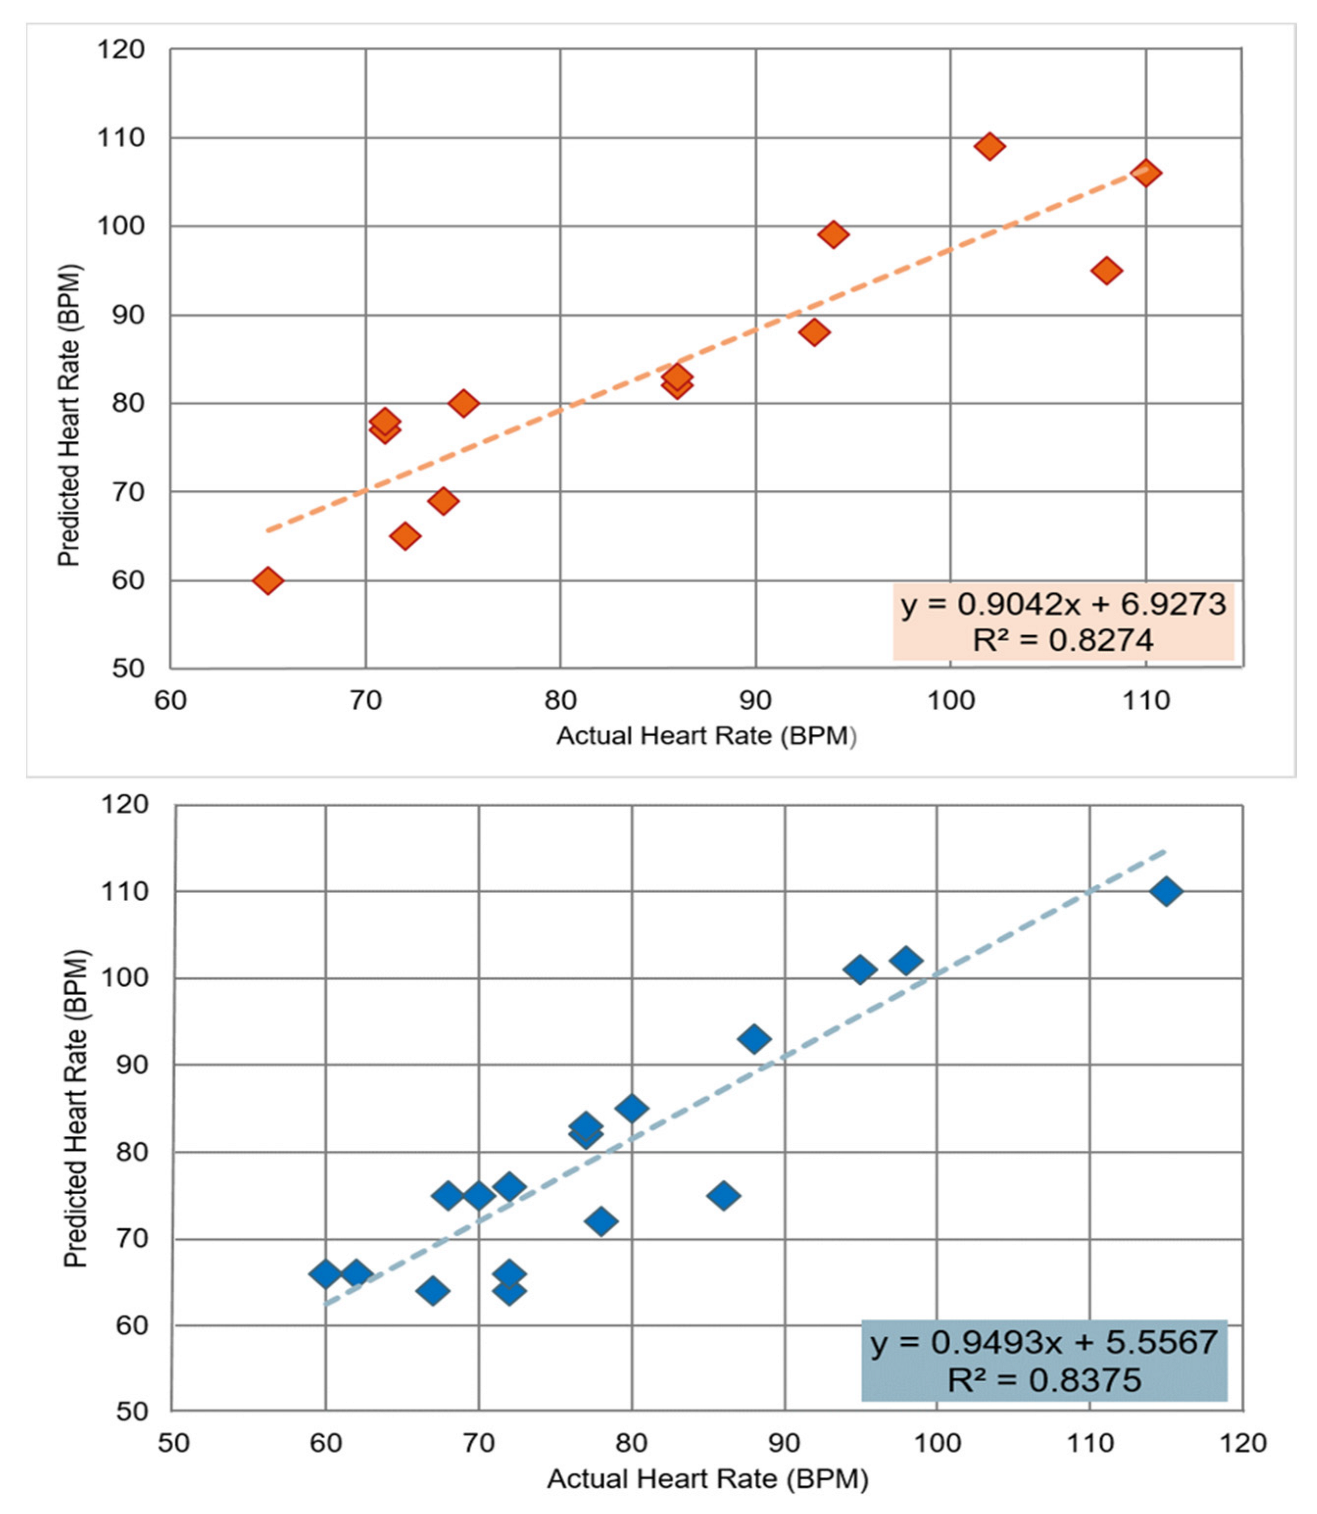
From Figure 11, it can be seen that in both Edge-Detection and Channel-Intensity methods, there is an approximately linear relationship between actual and predicted values, as shown by the positive regression lines. The strength of this linear association is given by the r 2   value (square of the Pearson correlation), and was found to be moderately strong in both methods. This tells us that the trend line fits the data well [33], and that approximately 83% of the variability in the data can be explained by the relationship between the actual and predicted HR measurements. The HRs from the Edge-Detection mode were highly correlated with the pulse oximeter readings (r ≥ 0.91). Similarly, the Channel-Intensity mode measurements also showed high correlation with the actual HR readings (r ≥ 0.95). Hence, the null hypothesis that there is no correlation between the predicted and measured HR can be rejected. However, the Edge-Detection method appeared to have a slightly strong association between the actual and predicted HR measurements compared to the Channel-Intensity method. Nonetheless, high correlations between these two modes of measurement do not necessarily confirm the agreement between the actual and calculated values. They simply show that these readings happen to align on a linear plane.
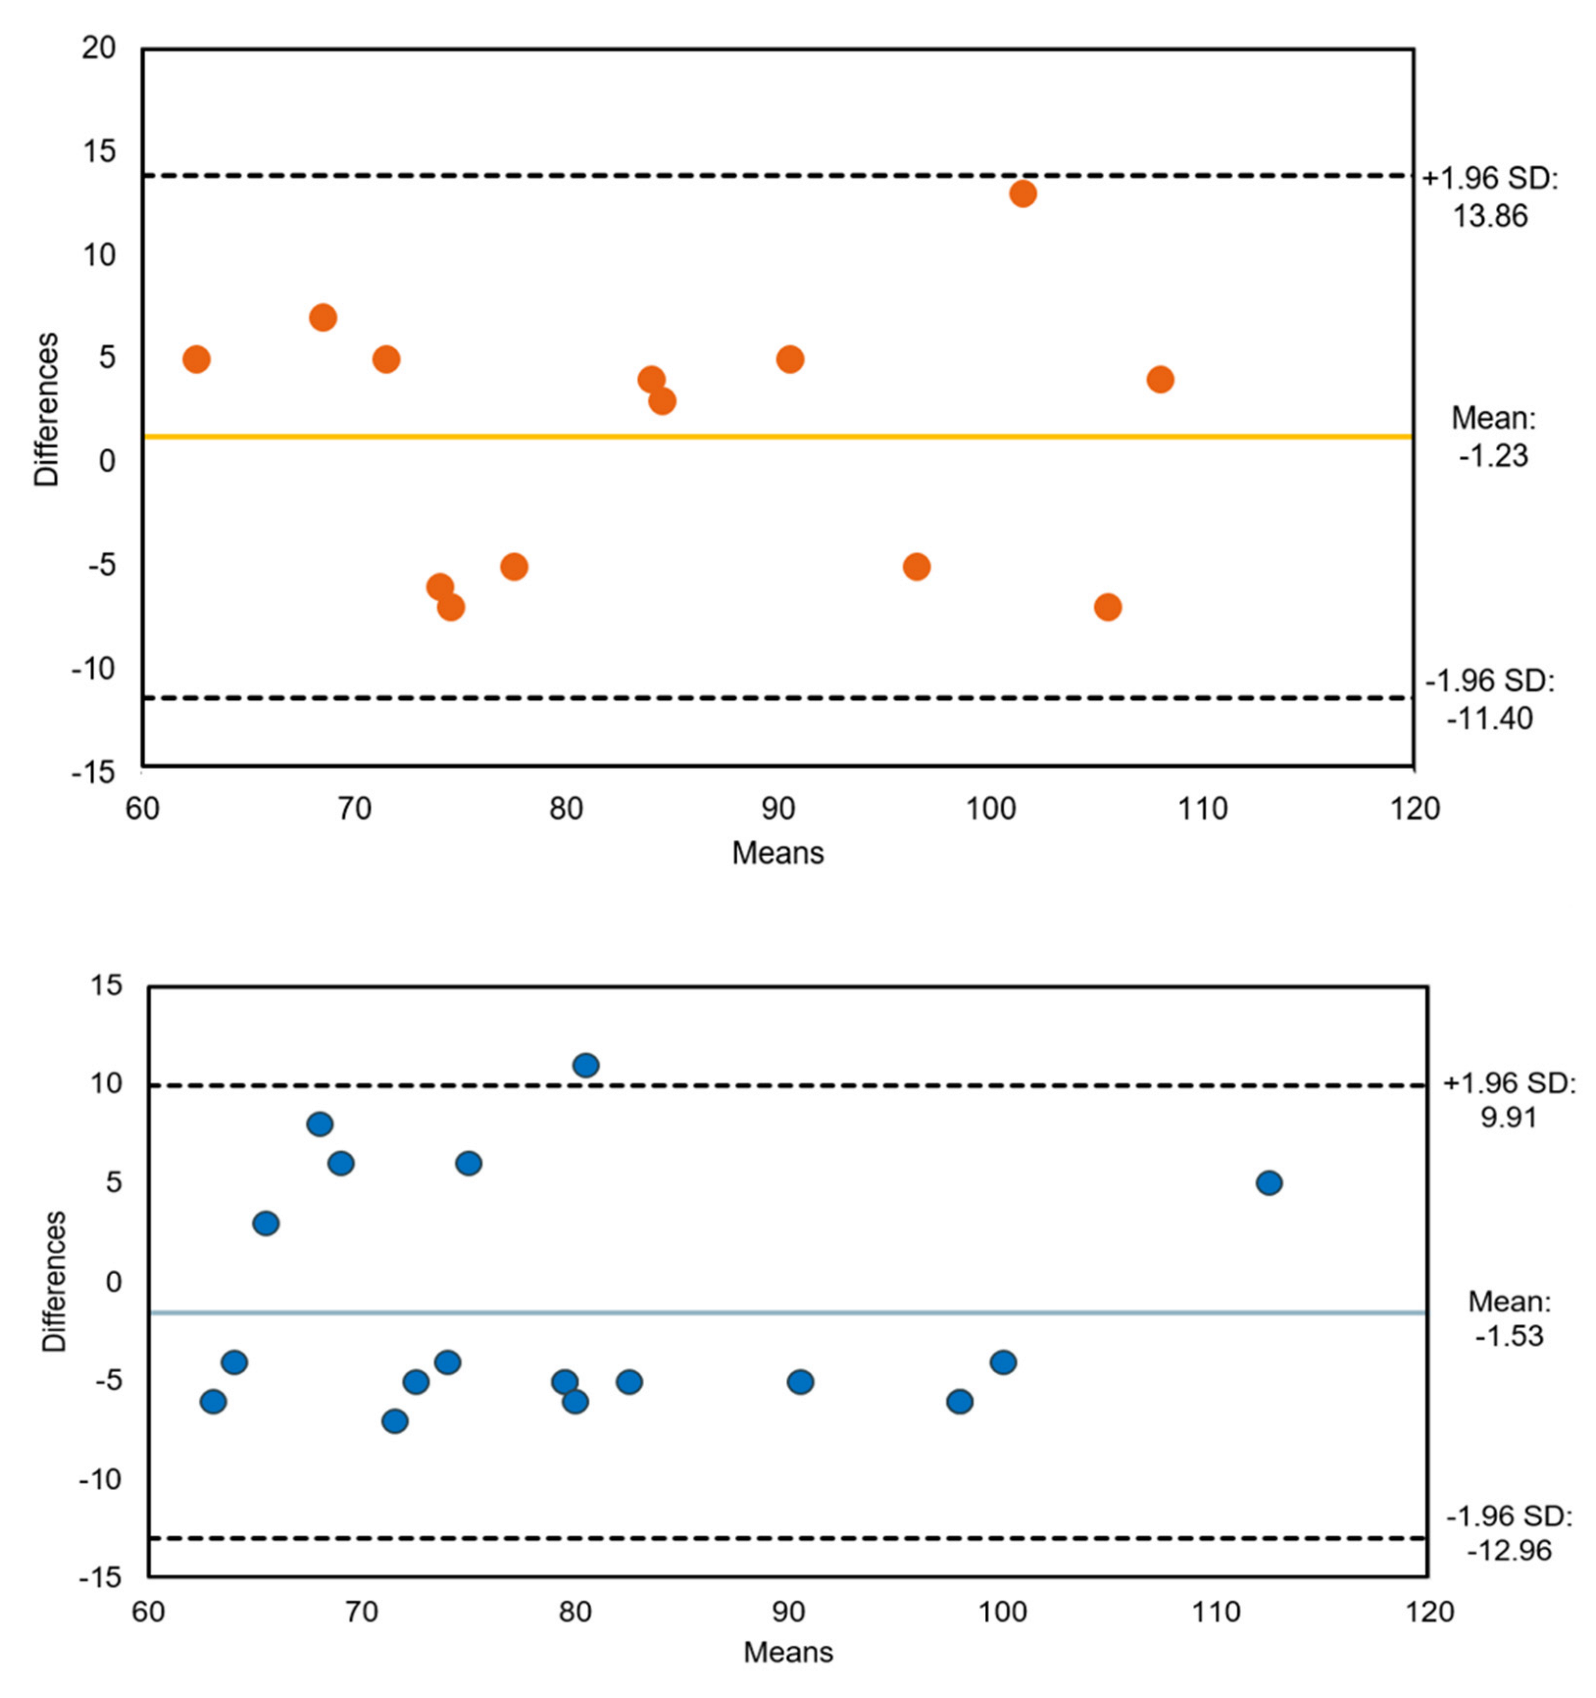
To determine if adequate agreement exists between the two-stage mechanism and the commercial-grade monitor, the Bland–Altman method, described by BAR, is also implemented as per Equation (23). It finds the bias or the mean difference between the two methods and considers 95% or 1.96 standard deviations from the mean as the mean difference. In other words, 95% of the difference in measurements between the two models will be included within 95% limits.
b = 1 N i = 1 N ( y i ^ y i )
S D = 1 N i = 1 N ( y i   ^ y i b ) 2
M P M = 1 N i = 1 N 1 2 ( y i ^ + y i )
B A R = 0.5 [ ( b + 1.96   S D ) ( b 1.96 S D ) ] M P M
Here, b ± 1.96   S D refers to the upper and lower limits of agreement, where b is bias, SD is standard deviation, and N is the total number of recordings. MPM refers to the pair-wise means. For this use-case, the limits of agreement were taken as 20% of MPM and two measurements were said to agree if BAR was less than 20%. The agreement via this method for both modes of measurement can be seen in the Bland–Altman plots in Figure 12.
As per the Bland–Altman plot, data points closer to the mean line show a good agreement between actual and predicted values. In both methods of measurement, it can be seen that ≥95% of the data points lie within the upper and lower limits of agreement, thus indicating that both methods are comparable to commercial means of HR determination. The width of the limits of agreement was 25.26 bpm in the case of the Edge-Detection mode, while it was 22.87 bpm for the Channel-Intensity mode. Bland–Altman plots between actual and predicted HR values are described in Figure 13.

5. Discussion

Smartphones make for cheap and accessible self-monitors, which without the need for or added cost of external hardware can track vital parameters such as HR. The results shown have established that it is possible to make use of a smartphone camera for this very purpose, via this two-stage methodology.
Of these two methods, the Edge-Detection mode involved the use of an edge operator to highlight the fingerprint ridges in each frame of the recording. As described in Section 3.2, five edge operators were compared to this end in terms of their performance. Figure 14 shows a visual comparison of the performance of the different edge-detection techniques.
Among the five edge operators, Sobel, Prewitt, and Roberts show poor performances due to their sensitivity to noise. This is in line with findings from [34] for classical operators wherein noise was erroneously detected as a real edge. Although the LoG and Canny method performances look similar visually, [34] shows that that LoG has a tendency to generate false edges, with more severe errors for edges with curvature. The study [35] also shows poor performance of the LoG operator wherein the input image has abrupt changes in gray-level intensities as opposed to gradual changes. Since this use-case explicitly deals with grayscale images having curved edges and non-uniform pixel intensity, it was not chosen. The Canny method eliminates these aforementioned issues, by (1) performing noise suppression with the initial Gaussian filter stage and (2) ensuring that there is only one response to each edge in the image and that there are no responses to non-edges. This effectively minimizes the error rate and ensures that the edges are localized properly. As a result, the Canny technique was ultimately selected to be used in the edge-detection section of the proposed methodology work. Visual comparison of the performance of 5 edge-detection methods is described in Figure 14.
According to prior studies, HR monitors are believed to be reliable if the correlation coefficients are ≥0.90 and the SEEs are ≤5 beats per minute (bpm) [36]. However, Ref. [37] allows for a higher SEE limit of ±6 bpm for 95% of the data, for the proposed methodology to be valid, while [38] considers the monitor to be ‘excellent’ if r > 0.93. Although the proposed methodology is reliable as per [37,38], the two-stage methodology in this work overshoots this limit slightly, with the Edge-Detection mode having an SEE of 6.55 bpm and the Channel-Intensity mode having an SEE of 5.95 bpm, as per [36]. Reduced error percentages can also be seen in [39] and [40], thus indicating the need for further work in the acquisition as well as pre-processing stages of this methodology to ensure improved results. Table 5 compares the proposed methodology with existing work in terms of root mean squared error (RMSE) and mean absolute error (MAE) in bpm.
Although [41,42] have relatively better MAE values, both modes of the proposed methodology outperform the cited papers in terms of RMSE. The studies [41,42] employ a different non-contact mode of data acquisition for heart rate estimation that potentially affects the calculated error values. The study [43] makes use of similar video recording acquisition techniques as in our paper, and we can show a reasonable improvement in MAE. Despite this, for this particular use-case, the RMSE appears to be the more appropriate metric as it is an indication of the reduced occurrence of large outliers in the estimations. This speaks to the merits of the proposed methodology.

6. Conclusions

Smartphones, today, offer a cheap, accessible, and portable alternative to current medical monitoring devices. A wide variety of physiological signals can be tracked through them, thus making them suitable for remote telemedicine applications. The work proposed in this report describes a way of determining the HR of a subject using data acquired from a smartphone. A novel technique that makes use of the spatial and temporal location of the fingerprint was also proposed here, which is used alongside channel-intensity techniques. Data are acquired by making the subject record a video of their finger covering the back camera and flash. The recording is then broken down into frames, validated, pre-processed, and put through the Canny edge operator for ridge detection. A reference frame is then selected and used to calculate the counter value, which in turn is used to determine the HR. If, during the frame validation process, it is found that the Edge-Detection method cannot be used, measurement based on mean channel intensity is carried out. Here, a raw PPG-like signal is generated from the red channel of each frame, followed by pre-processing and peak detection based on fixed constraints. The mean distances between the detected peaks are then used to calculate the HR. The average relative accuracy for recordings via the Edge-Detection mode was 93.04%, with a standard error of estimates (SEE) of 6.55, while the Channel-Intensity mode showed an average relative accuracy of 92.75%, with an SEE of 5.95. Both modes of HR calculation show statistically significant results and can be considered as viable alternatives to current HR monitoring technologies.

Future Scope

The future scope for this proposed methodology involves developing a smartphone-based application that performs a real-time reading of the subject’s HR with lowered error rates. The application should be made to be suitable for all existing operating systems, regardless of the model’s hardware and software specifications. Future work can include analysis on the effect of a varying environment during the acquisition stage and its impact on processing as well as error rates, on a larger dataset. Moreover, clinical physiological signals are generally recorded at much higher sampling rates than standard recordings produced by smartphones. In order to counter this, future work will look into the effect of the acquisition environment as well as the usage the ‘slow-mo’ capture mode available in current smartphone models in the market. This mode of video recording captures videos at higher sampling rates, thus providing more context for processing. Further work will also be carried out to standardize acquisition techniques to be suitable specifically for the Edge-Detection method. Currently, the method only works for Android-based smartphones that have their flash located below the back camera lens. Developing acquisition protocols for a broader range of smartphone models will not only improve accessibility for users, but will also ensure reliability of the results.

Author Contributions

Conceptualization, A.K. and G.M.B.; methodology, N.S. (Niranjana Sampathila); software, H.M.; validation, N.S. (Nandish Siddeshappa) and G.M.B.; formal analysis, N.S. (Niranjana Sampathila); investigation, K.C.; resources, A.K.; data curation, A.K.; writing—original draft preparation, A.K.; writing—review and editing, G.M.B.; visualization, H.M.; supervision, G.M.B.; project administration, N.S. (Nandish Siddeshappa); funding acquisition, K.C., G.M.B. and H.M. All authors have read and agreed to the published version of the manuscript.

Funding

This research received no external funding.

Informed Consent Statement

Informed consent was obtained from all subjects involved in the study.

Data Availability Statement

Data will be made available on request.

Acknowledgments

The authors would like to thank Manipal School of Information Sciences, MAHE and the Biomedical Engineering Department at Manipal Institute of Technology, Manipal for facilitating this work.

Conflicts of Interest

The authors declare that they have no competing interests that could have influenced the work reported in this paper.

References

  1. Ralapanawa, U.; Sivakanesan, R. Epidemiology and the Magnitude of Coronary Artery Disease and Acute Coronary Syndrome: A Narrative Review. J. Epidemiol. Glob. Health 2021, 11, 169–177. [Google Scholar] [CrossRef]
  2. Tsao, C.W.; Aday, A.W.; Almarzooq, Z.I.; Alonso, A.; Beaton, A.Z.; Bittencourt, M.S.; Boehme, A.K.; Buxton, A.E.; Carson, A.P.; Commodore-Mensah, Y.; et al. Heart Disease and Stroke Statistics—2022 Update: A Report From the American Heart Association. Circulation 2022, 145, e153–e639. [Google Scholar] [CrossRef]
  3. Bodkhe, S.; Jajoo, S.U.; Jajoo, U.N.; Ingle, S.; Gupta, S.S.; Taksande, B.A. Epidemiology of confirmed coronary heart disease among population older than 60 years in rural central India—A community-based cross-sectional study. Indian Heart J. 2019, 71, 39–44. [Google Scholar] [CrossRef]
  4. Rao, M.; Xavier, D.; Devi, P.; Sigamani, A.; Faruqui, A.; Gupta, R.; Kerkar, P.; Jain, R.K.; Joshi, R.; Chidambaram, N.; et al. Prevalence, treatments and outcomes of coronary artery disease in Indians: A systematic review. Indian Heart J. 2015, 67, 302–310. [Google Scholar] [CrossRef] [Green Version]
  5. Takei, K.; Honda, W.; Harada, S.; Arie, T.; Akita, S. Toward Flexible and Wearable Human-Interactive Health-Monitoring Devices. Adv. Health Mater. 2014, 4, 487–500. [Google Scholar] [CrossRef]
  6. Cardona-Morrell, M.; Prgomet, M.; Turner, R.M.; Nicholson, M.; Hillman, K. Effectiveness of continuous or intermittent vital signs monitoring in preventing adverse events on general wards: A systematic review and meta-analysis. Int. J. Clin. Pract. 2016, 70, 806–824. [Google Scholar] [CrossRef]
  7. Mayoral, C.P.; Gutiérrez, J.G.; Pérez, J.L.C.; Treviño, M.V.; Velasco, I.B.G.; Cruz, P.A.H.; Rosas, R.T.; Carrillo, L.T.; Ríos, J.A.; Apreza, E.L.; et al. Fiber Optic Sensors for Vital Signs Monitoring. A Review of Its Practicality in the Health Field. Biosensors 2021, 11, 58. [Google Scholar] [CrossRef]
  8. Ferreira, N.D.P.; Gehin, C.; Massot, B. A Review of Methods for Non-Invasive Heart Rate Measurement on Wrist. Irbm 2020, 42, 4–18. [Google Scholar] [CrossRef]
  9. Yu, Z.; Li, X.; Niu, X.; Shi, J.; Zhao, G. AutoHR: A Strong End-to-End Baseline for Remote Heart Rate Measurement With Neural Searching. IEEE Signal Process. Lett. 2020, 27, 1245–1249. [Google Scholar] [CrossRef]
  10. Bagha, S.; Shaw, L. A real time analysis of PPG signal for measurement of SpO2 and pulse rate. Int. J. Comput. Appl. 2011, 36, 45–50. [Google Scholar] [CrossRef]
  11. Castaneda, D.; Esparza, A.; Ghamari, M.; Soltanpur, C.; Nazeran, H. A review on wearable photoplethysmography sensors and their potential future applications in health care. Int. J. Biosens. Bioelectron. 2018, 4, 195. [Google Scholar]
  12. Newzoo’s, K.J. Global Mobile Market Report: Insights into the World’s 3 Billion Smartphone Users. 2018. Available online: https://newzoo.com/insights/articles/newzoos-2018-global-mobile-market-report-insights-into-the-worlds-3-billion-smartphone-users (accessed on 25 May 2022).
  13. Majumder, S.; Deen, M.J. Smartphone Sensors for Health Monitoring and Diagnosis. Sensors 2019, 19, 2164. [Google Scholar] [CrossRef] [Green Version]
  14. Pantelopoulos, A.; Bourbakis, N.G. A Survey on Wearable Sensor-Based Systems for Health Monitoring and Prognosis. IEEE Trans. Syst. Man Cybern. Part C Appl. Rev. 2010, 40, 1–12. [Google Scholar] [CrossRef] [Green Version]
  15. Garcia-Agundez, A.; Dutz, T.; Goebel, S. Adapting smartphone-based photoplethysmograpy to suboptimal scenarios. Physiol. Meas. 2017, 38, 219–232. [Google Scholar] [CrossRef]
  16. Huang, R.-Y.; Dung, L.-R. Measurement of heart rate variability using off-the-shelf smart phones. Biomed. Eng. Online 2016, 15, 1–16. [Google Scholar] [CrossRef] [Green Version]
  17. Peng, R.-C.; Zhou, X.-L.; Lin, W.-H.; Zhang, Y.-T. Extraction of Heart Rate Variability from Smartphone Photoplethysmograms. Comput. Math. Methods Med. 2015, 2015, 516826. [Google Scholar] [CrossRef] [Green Version]
  18. De Ridder, B.; Van Rompaey, B.; Kampen, J.K.; Haine, S.; Dilles, T. Smartphone Apps Using Photoplethysmography for Heart Rate Monitoring: Meta-Analysis. JMIR Cardio 2018, 2, e4. [Google Scholar] [CrossRef]
  19. Grimaldi, D.; Kurylyak, Y.; Lamonaca, F.; Nastro, A. Photoplethysmography detection by smartphone’s videocamera. In Proceedings of the 6th IEEE International Conference on Intelligent Data Acquisition and Advanced Computing Systems, Prague, Czech Republic, 15–17 September 2011; IEEE: Piscataway, NJ, USA, 2011; Volume 1, pp. 488–491. [Google Scholar] [CrossRef]
  20. Jonathan, E.; Leahy, M.J. Cellular phone-based photoplethysmographic imaging. J. Biophotonics 2010, 4, 293–296. [Google Scholar] [CrossRef]
  21. Pereira, T.; Gadhoumi, K.; Ma, M.; Liu, X.; Xiao, R.; Colorado, R.A.; Keenan, K.J.; Meisel, K.; Hu, X. A Supervised Approach to Robust Photoplethysmography Quality Assessment. IEEE J. Biomed. Health Inform. 2019, 24, 649–657. [Google Scholar] [CrossRef]
  22. Hoan, N.V.; Park, J.-H.; Lee, S.-H.; Kwon, K.-R. Real-time Heart Rate Measurement based on Photoplethysmography using Android Smartphone Camera. J. Korea Multimedia Soc. 2017, 20, 234–243. [Google Scholar] [CrossRef] [Green Version]
  23. Pelegris, P.; Banitsas, K.; Orbach, T.; Marias, K. A novel method to detect heart beat rate using a mobile phone. In Proceedings of the 2010 Annual International Conference of the IEEE Engineering in Medicine and Biology, Buenos Aires, Argentina, 31 August 2010–4 September 2010; IEEE: Piscataway, NJ, USA, 2010; pp. 5488–5491. [Google Scholar] [CrossRef]
  24. Gregoski, M.J.; Mueller, M.; Vertegel, A.; Shaporev, A.; Jackson, B.B.; Frenzel, R.M.; Sprehn, S.M.; Treiber, F.A. Development and Validation of a Smartphone Heart Rate Acquisition Application for Health Promotion and Wellness Telehealth Applications. Int. J. Telemed. Appl. 2012, 2012, 1–7. [Google Scholar] [CrossRef] [PubMed] [Green Version]
  25. Scully, C.G.; Lee, J.; Meyer, J.; Gorbach, A.M.; Granquist-Fraser, D.; Mendelson, Y.; Chon, K.H. Physiological parameter monitoring from optical recordings with a mobile phone. IEEE Trans. Biomed. Eng. 2011, 59, 303–306. [Google Scholar] [CrossRef] [PubMed] [Green Version]
  26. Srivastava, R.; Gupta, J.R.P.; Parthasarthy, H.; Srivastava, S. PDE Based Unsharp Masking, Crispening and High Boost Filtering of Digital Images. In Computing. IC3 2009; Communications in Computer and Information Science; Springer: Berlin/Heidelberg, Germany, 2009; Volume 40. [Google Scholar] [CrossRef]
  27. Diklic, D.; Petkovic, D.; Danielson, R. Automatic extraction of representative keyframes based on scene content. In Proceedings of the Conference Record of Thirty-Second Asilomar Conference on Signals, Systems and Computers (Cat. No. 98CH36284), Pacific Grove, CA, USA, 1–4 November 1998; IEEE: Piscataway, NJ, USA, 1998; Volume 1. [Google Scholar]
  28. Maeda, Y.; Sekine, M.; Tamura, T.; Moriya, A.; Suzuki, T.; Kameyama, K. Comparison of reflected green light and infrared photoplethysmography. In Proceedings of the 2008 30th Annual International Conference of the IEEE Engineering in Medicine and Biology Society, Vancouver, BC, Canada, 20–25 August 2008; IEEE: Piscataway, NJ, USA, 2008; pp. 2270–2272. [Google Scholar] [CrossRef]
  29. Tarvainen, M.; Ranta-Aho, P.; Karjalainen, P. An advanced detrending method with application to HRV analysis. IEEE Trans. Biomed. Eng. 2002, 49, 172–175. [Google Scholar] [CrossRef]
  30. Chen, Y.; Li, D.; Li, Y.; Ma, X.; Wei, J. Use moving average filter to reduce noises in wearable PPG during continuous monitoring. In eHealth 360; Springer: Cham, Switzerland, 2017; pp. 193–203. [Google Scholar] [CrossRef]
  31. Schäfer, A.; Vagedes, J. How accurate is pulse rate variability as an estimate of heart rate variability? Int. J. Cardiol. 2013, 166, 15–29. [Google Scholar] [CrossRef]
  32. Myles, P.; Cui, J.I. Using the Bland–Altman method to measure agreement with repeated measures. Br. J. Anaesth. 2007, 99, 309–311. [Google Scholar] [CrossRef] [Green Version]
  33. Casella, G.; Berger, R.L. Statistical Inference, Duxbury/Thomson Learning; Cengage Learning: Boston, MA, USA, 2002. [Google Scholar]
  34. Amer, G.M.H.; Abushaala, A.M. Edge detection methods. In Proceedings of the 2015 2nd World Symposium on Web Applications and Networking (WSWAN), Sousse, Tunisi, 21–23 March 2015; pp. 1–7. [Google Scholar] [CrossRef]
  35. Ansari, M.A.; Kurchaniya, D.; Dixit, M. A comprehensive analysis of image edge detection techniques. Int. J. Multimed. Ubiquitous Eng. 2017, 12, 1–12. [Google Scholar] [CrossRef]
  36. Terbizan, D.J.; Dolezal, B.A.; Albano, C. Validity of Seven Commercially Available Heart Rate Monitors. Meas. Phys. Educ. Exerc. Sci. 2002, 6, 243–247. [Google Scholar] [CrossRef]
  37. Godsen, R.; Carroll, T.; Stone, S. How well does the Polar Vantage XL heart rate monitor estimate actual heart rate. Med Sci Sports Exerc 1991, 23 (Suppl. S4), 14. [Google Scholar]
  38. Léger, L.; Thivierge, M. Heart Rate Monitors: Validity, Stability, and Functionality. Physician Sportsmed. 1988, 16, 143–151. [Google Scholar] [CrossRef]
  39. Maestre-Rendon, J.R.; Rivera-Roman, T.A.; Fernandez-Jaramillo, A.A.; Paredes, N.E.G.; Olmedo, J.J.S. A Non-Contact Photoplethysmography Technique for the Estimation of Heart Rate via Smartphone. Appl. Sci. 2019, 10, 154. [Google Scholar] [CrossRef] [Green Version]
  40. Neshitov, A.; Tyapochkin, K.; Smorodnikova, E.; Pravdin, P. Wavelet Analysis and Self-Similarity of Photoplethysmography Signals for HRV Estimation and Quality Assessment. Sensors 2021, 21, 6798. [Google Scholar] [CrossRef] [PubMed]
  41. Niu, X.; Shan, S.; Han, H.; Chen, X. RhythmNet: End-to-End Heart Rate Estimation From Face via Spatial-Temporal Representation. IEEE Trans. Image Process. 2019, 29, 2409–2423. [Google Scholar] [CrossRef] [PubMed] [Green Version]
  42. Jaiswal, K.B.; Meenpal, T. Heart rate estimation network from facial videos using spatiotemporal feature image. Comput. Biol. Med. 2022, 151, 106307. [Google Scholar] [CrossRef] [PubMed]
  43. Ayesha, A.H.; Qiao, D.; Zulkernine, F. Heart Rate Monitoring Using PPG With Smartphone Camera. In Proceedings of the 2021 IEEE International Conference on Bioinformatics and Biomedicine (BIBM), Houston, TX, USA, 9–12 December 2021; IEEE: Piscataway, NJ, USA, 2021. [Google Scholar]
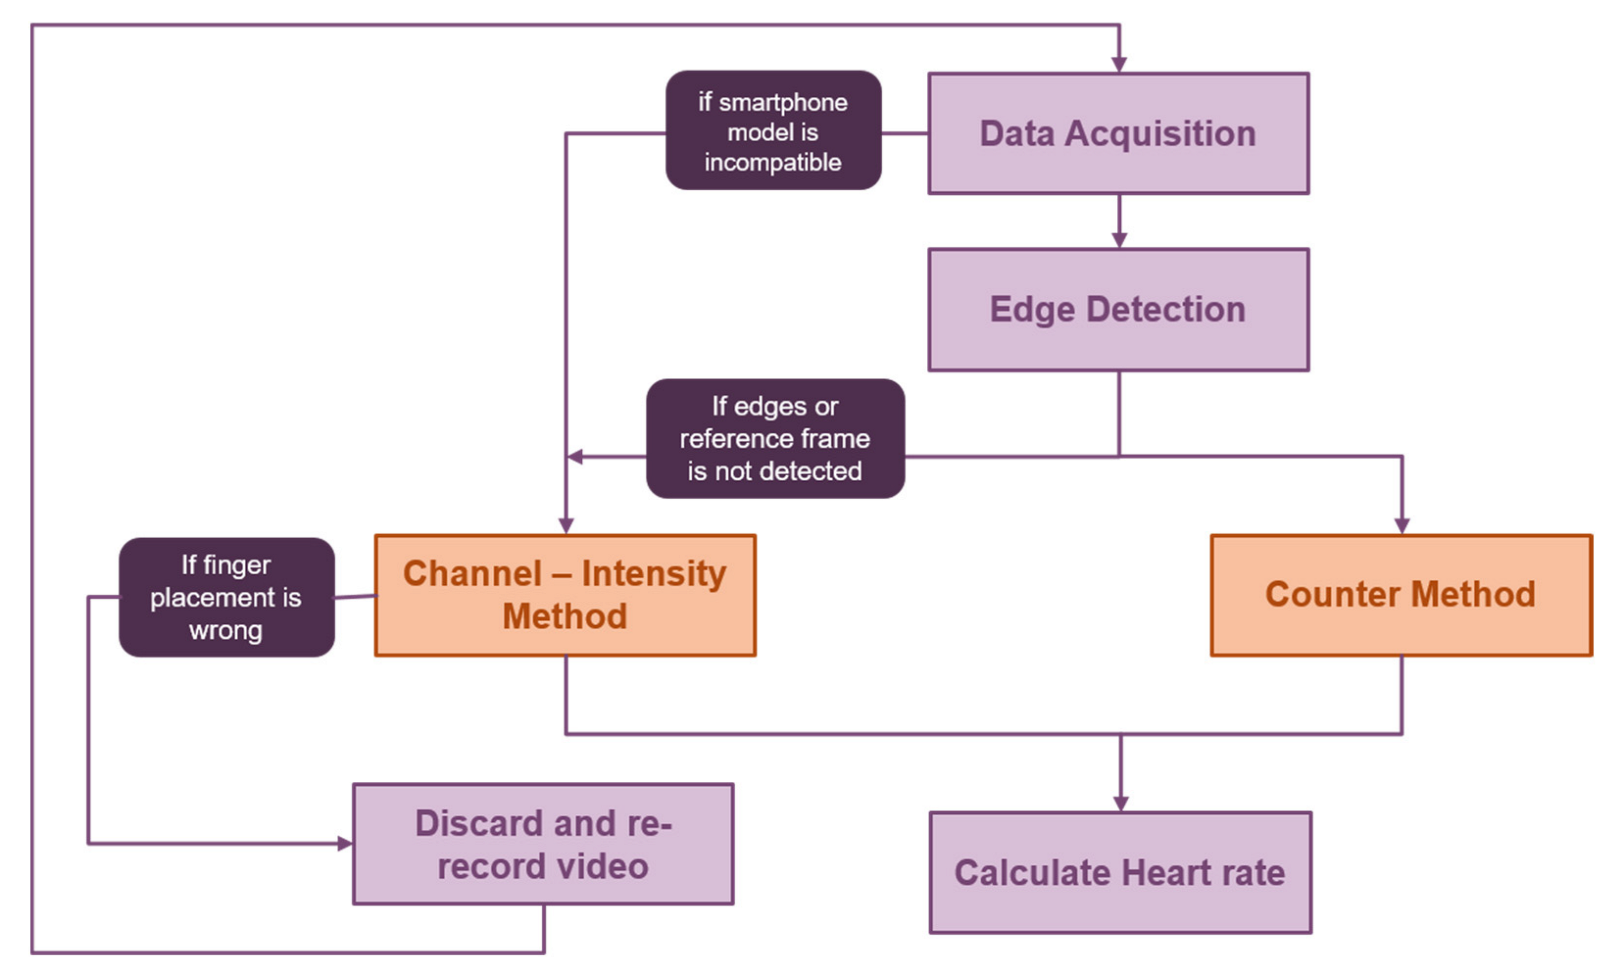
Figure 1. The block diagram shows an overview of the validation, processing, and HR calculation stages for the entire model. The Edge-Detection mode and the Channel-Intensity mode are the two HR calculation methods proposed in the study. Processing is carried out in one of these modes depending on the kind of video data that were recorded and the smartphone model that was used to acquire them. In the Edge-Detection mode, if the edges, and hence the reference frame, cannot be detected, processing is switched to the Channel-Intensity method. If neither method can validate the video for heart rate calculation, the video is discarded. In this manner, the proposed algorithm helps circumvent processing issues caused due to subject gestures and finger orientations.
Computers 12 00043 g001
Figure 2. Block Diagram for Edge-Detection Mode.
Computers 12 00043 g002
Figure 3. Frame-wise fingerprint pre-processing; going from left to right: sample raw video frame; grayscaled version of raw frame; contrast-adjusted frame; sharpened frame.
Computers 12 00043 g003
Figure 4. Comparison of finger placement styles; top row: finger is not placed with enough pressure on the back camera and flash leading to poor visualization of edges; middle row: finger is pressed too firmly on the back camera and flash resulting in an extremely close-up visualization of fingerprint ridges, making it difficult to select the reference frame in the next step of this method; bottom row: correct placement of finger resulting in proper edge detection.
Computers 12 00043 g004
Figure 5. Reference frame selection; left: here, the distance between the lowest edge and the base of the frame is not minimal, hence this is not selected as the reference frame; right: the distance between the lowest edge and the frame’s base is (relatively) minimal, hence this is taken as the reference frame.
Computers 12 00043 g005
Figure 6. Edge-detected frames generated for one cycle for a sample video in the dataset are shown here. Frame 6 is selected here as the reference frame. A frame is regarded as the reference frame for a cycle if, in comparison to other frames in that cycle, its bottom-most detected ridge is situated closest to the base of the frame. The start of a new cycle is signaled by this style of frame. This figure shows reference frame selection in context of other frames for a given video sample.
Computers 12 00043 g006
Figure 7. Block Diagram of Channel-Intensity Mode.
Computers 12 00043 g007
Figure 8. Raw PPG-like signal generated from the frame-wise mean red channel intensity for sample video data. The mean red channel intensity value, taken over all pixels in a frame, for each frame for each sample was plotted as a function of the temporal frame number.
Computers 12 00043 g008
Figure 9. Effect of ‘N’-point moving average filter on the signal for different values of ‘N’. Here, N = 3, 5, 7, and 11 have been plotted for comparing the effect of window width on signal smoothing.
Computers 12 00043 g009
Figure 10. Pre-processing for the Channel-Intensity mode; 1st row: raw PPG-like signal—this is generated by plotting the average red channel intensity per frame as a function of frame number; 2nd row: normalized PPG-like signal—this is carried out by detrending the signal to decrease overall variation in the signal; 3rd row: detrended PPG-like signal; 4th row: PPG-like signal after applying 5 pt. MA filter—this smoothens the signal by averaging out unnecessary fluctuations in the data while retaining the sharp step response, thus highlighting the peaks in the signal.
Computers 12 00043 g010
Figure 11. Peak detection on processed PPG-like signal for sample video data—this is carried out as per the selection scheme described in Equation (13), followed by removal of false peaks by thresholding the local maxima as per the peak-to-peak distances as per Equation (14).
Computers 12 00043 g011
Figure 12. Correlation plots between actual and predicted HR values; top: correlation plot for Edge-Detection mode; bottom: correlation plot for Channel-Intensity mode.
Computers 12 00043 g012
Figure 13. Bland–Altman plots between actual and predicted HR values; top: Bland–Altman plot for Edge-Detection mode; bottom: Bland–Altman plot for Channel-Intensity mode.
Computers 12 00043 g013
Figure 14. Visual comparison of the performance of 5 edge-detection methods; top left: pre-processed frame; top middle: Sobel’s method; top right: Prewitt’s method; bottom left: Roberts’s method; bottom middle: LoG method; bottom right: Canny method.
Computers 12 00043 g014
Table 1. Smartphone Model Specifications.
Smartphone ModelFrame RateColor FormatVideo ResolutionCamera SpecificationFile Format
One plus 730 fpssRGB1080 × 23405 MP.mp4
Xiaomi Redmi 7A30 fpssRGB720 × 144012 MP.mp4
Table 2. Subject-wise data acquisition details.
Subject NumberNumber of Recordings ProvidedAverage Heart Rate during Recording (bpm)
Subject—1290 bpm
Subject—2672 bpm
Subject—3681 bpm
Subject—4587 bpm
Subject—5798 bpm
Subject—6676 bpm
Table 3. Sample-wise performance summary.
Video IDPredicted Heart RateActual Heart RateRelative Error (%)Relative Accuracy (%)Method Used
166626.4593.55Channel-Intensity
280756.6793.33Edge-Detection
3666010.090.0Channel-Intensity
493885.6894.32Channel-Intensity
564674.4795.53Channel-Intensity
6647211.1188.89Channel-Intensity
71061103.6496.36Edge-Detection
865729.7290.28Edge-Detection
982776.5093.50Channel-Intensity
1078719.8690.14Edge-Detection
111101154.3595.65Channel-Intensity
1299945.3294.68Edge-Detection
1382864.6595.35Edge-Detection
1472787.6992.31Channel-Intensity
1588935.3794.63Edge-Detection
1685806.2593.75Channel-Intensity
1760657.6992.31Edge-Detection
18102984.0895.92Channel-Intensity
1966728.3391.66Channel-Intensity
20758612.7987.21Channel-Intensity
211091026.8693.14Edge-Detection
2269746.7593.25Edge-Detection
23756810.2989.71Channel-Intensity
24101956.3193.69Channel-Intensity
2583863.4896.52Edge-Detection
2677718.4591.55Edge-Detection
2782776.4993.51Channel-Intensity
2875707.1492.86Channel-Intensity
2976725.5594.45Channel-Intensity
309510812.0387.94Edge-Detection
3183777.7992.21Channel-Intensity
32101956.3193.69Channel-Intensity
Table 4. Statistical analysis of results from both modes of HR calculation.
MethodSEEPearson’s CorrelationDegree of Freedomp Value
Edge-Detection6.550.91114.52 × 10−8
Channel-Intensity5.950.95175.34 × 10−10
Table 5. HR Calculation via Smartphone: Performance Comparison.
AuthorRMSE (bpm)MAE (bpm)
Ayesha et al. (2021) [43]-7.01
Niu et al. (2019) [41]8.145.3
Jaiswal and Meenpal (2022) [42]7.215.23
Current work6.31 (Edge-Detection mode)
5.88 (Channel-Intensity mode)
5.84 (Edge-Detection mode)
5.63 (Channel-Intensity mode)
Disclaimer/Publisher’s Note: The statements, opinions and data contained in all publications are solely those of the individual author(s) and contributor(s) and not of MDPI and/or the editor(s). MDPI and/or the editor(s) disclaim responsibility for any injury to people or property resulting from any ideas, methods, instructions or products referred to in the content.