Exploring Clustering Techniques for Analyzing User Engagement Patterns in Twitter Data
Abstract
:1. Introduction
- Hashtags are identifiers that begin with the “#” symbol, followed by a word or phrase without spaces. They serve as a way to categorize and organize tweets around specific topics. Users can search for posts related to desired topics by using hashtags.
- Mentions are indicated by the “@” symbol and allow users to refer to other users within a tweet. When a user mentions another user, it notifies and directs the mentioned user’s attention to the tweet. This can lead to various forms of engagement, including likes, retweets, and replies, as the mentioned user interacts with the tweet.
- Retweeting enables users to repost someone else’s tweet, often accompanied by their own comment or endorsement. Retweets serve as a means to share and amplify content, indicating a strong interaction and endorsement between the users involved.
- Replies: Users can engage with tweets by posting additional comments or making remarks in reply to a specific tweet. Replies are initiated with the “@” symbol followed by the screen name of the user writing the reply. This fosters discussions and conversations around a particular tweet.
- Follow: The follow feature allows users to choose and “follow” other profiles on the social network. By following a specific user, their tweets appear on the follower’s timeline, enabling them to stay updated with the user’s activity and content.
- Friendship represents a social relationship between two users on Twitter. Unlike the one-way nature of following, a friendship connection indicates a reciprocal relationship. When a user follows another profile, they appear on the follower’s friends’ list, while they themselves are listed as followers on the profile they follow.
2. Related Work
3. Preliminaries
3.1. Word2Vec
3.2. Clustering Algorithms
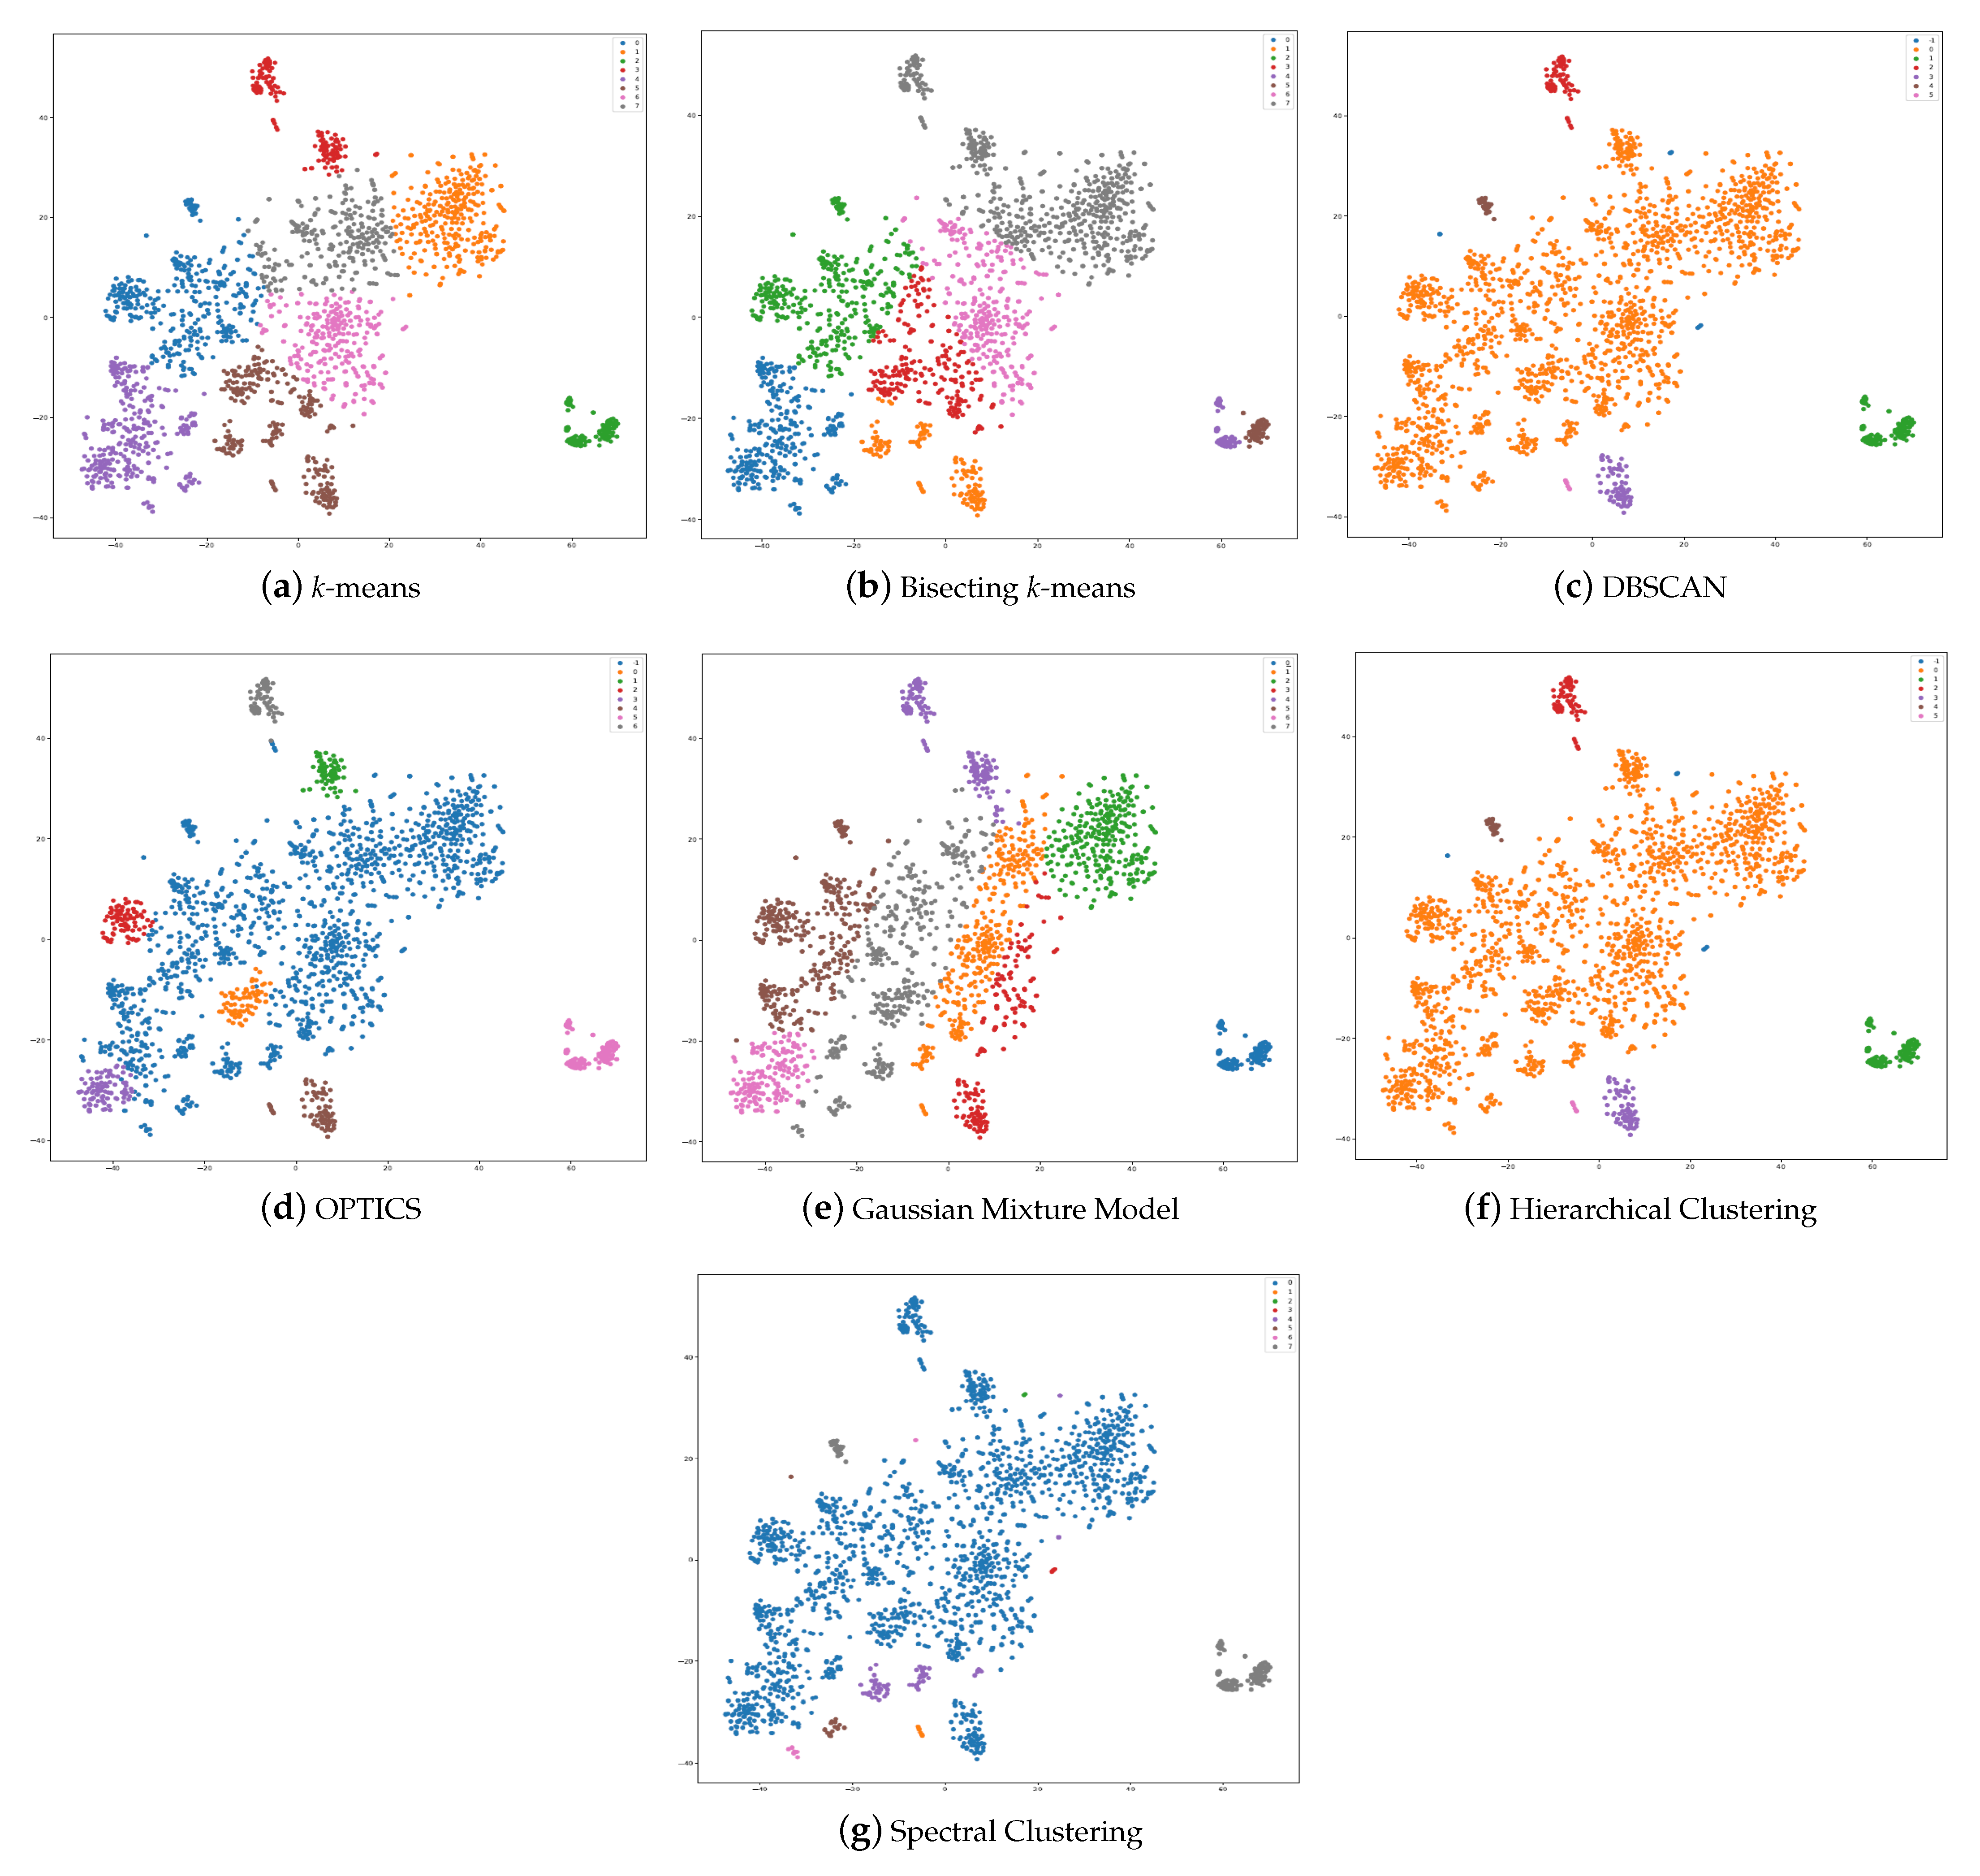
3.2.1. k-means
3.2.2. Bisecting k-means
- Select a cluster to split: The algorithm selects the cluster with the largest sum of squared errors (SSE) as the candidate for splitting. SSE represents the sum of squared distances between data points and the centroid of the cluster.
- Split the selected cluster: The selected cluster is split into two child clusters using the regular k-means algorithm. The k-means algorithm is applied with to divide the data points into two sub-clusters.
- Update the cluster hierarchy: The hierarchy of clusters is updated to include the newly created child clusters, and the SSE values for all clusters are recalculated.
- Repeat until the desired number of clusters is reached: Steps 1 to 3 are repeated until the desired number of clusters (k) is obtained. At each iteration, the cluster with the largest SSE is selected for splitting.
3.2.3. Density-Based Spatial Clustering of Applications with Noise (DBSCAN)
- Epsilon (): It defines the radius within which neighboring points are considered to be part of the same cluster. Points within this distance are considered “density-reachable” from each other.
- MinPts: It specifies the minimum number of points required to form a dense region. Points that have at least MinPts neighbors within the radius of are considered “core points”. These core points play a crucial role in defining clusters.
- Randomly select a data point that has not been visited.
- Retrieve all the neighboring points within the radius of .
- If the number of neighboring points is less than MinPts, mark the point as noise.
- If the number of neighboring points is greater than or equal to MinPts, create a new cluster and expand it by adding all the reachable points (density-reachable) from the current point.
- Repeat the process for all unvisited points until all points have been processed.
3.2.4. OPTICS
- Select a data point that has not been visited.
- Retrieve its -neighborhood, which consists of all the data points within a specified distance () from the selected point.
- If the number of points in the -neighborhood is greater than or equal to the specified minimum number of points (), mark the point as a core point, and expand the cluster by adding all the reachable points (density-reachable) within the distance.
- For each core point, calculate its reachability distance, which represents the minimum distance needed to reach that point from a previously processed core point. This distance is based on the maximum distance of any point within the -neighborhood of the core point.
- Continue the process for all unvisited points until all points have been processed.
- Construct a reachability plot or dendrogram, which represents the ordering of points based on their reachability distances [29]. This plot provides a visual representation of the density-based clustering structure.
3.2.5. Gaussian Mixture Model (GMM)
3.2.6. Hierarchical Clustering
3.2.7. Spectral Clustering
4. Methodology
4.1. Proposed Method
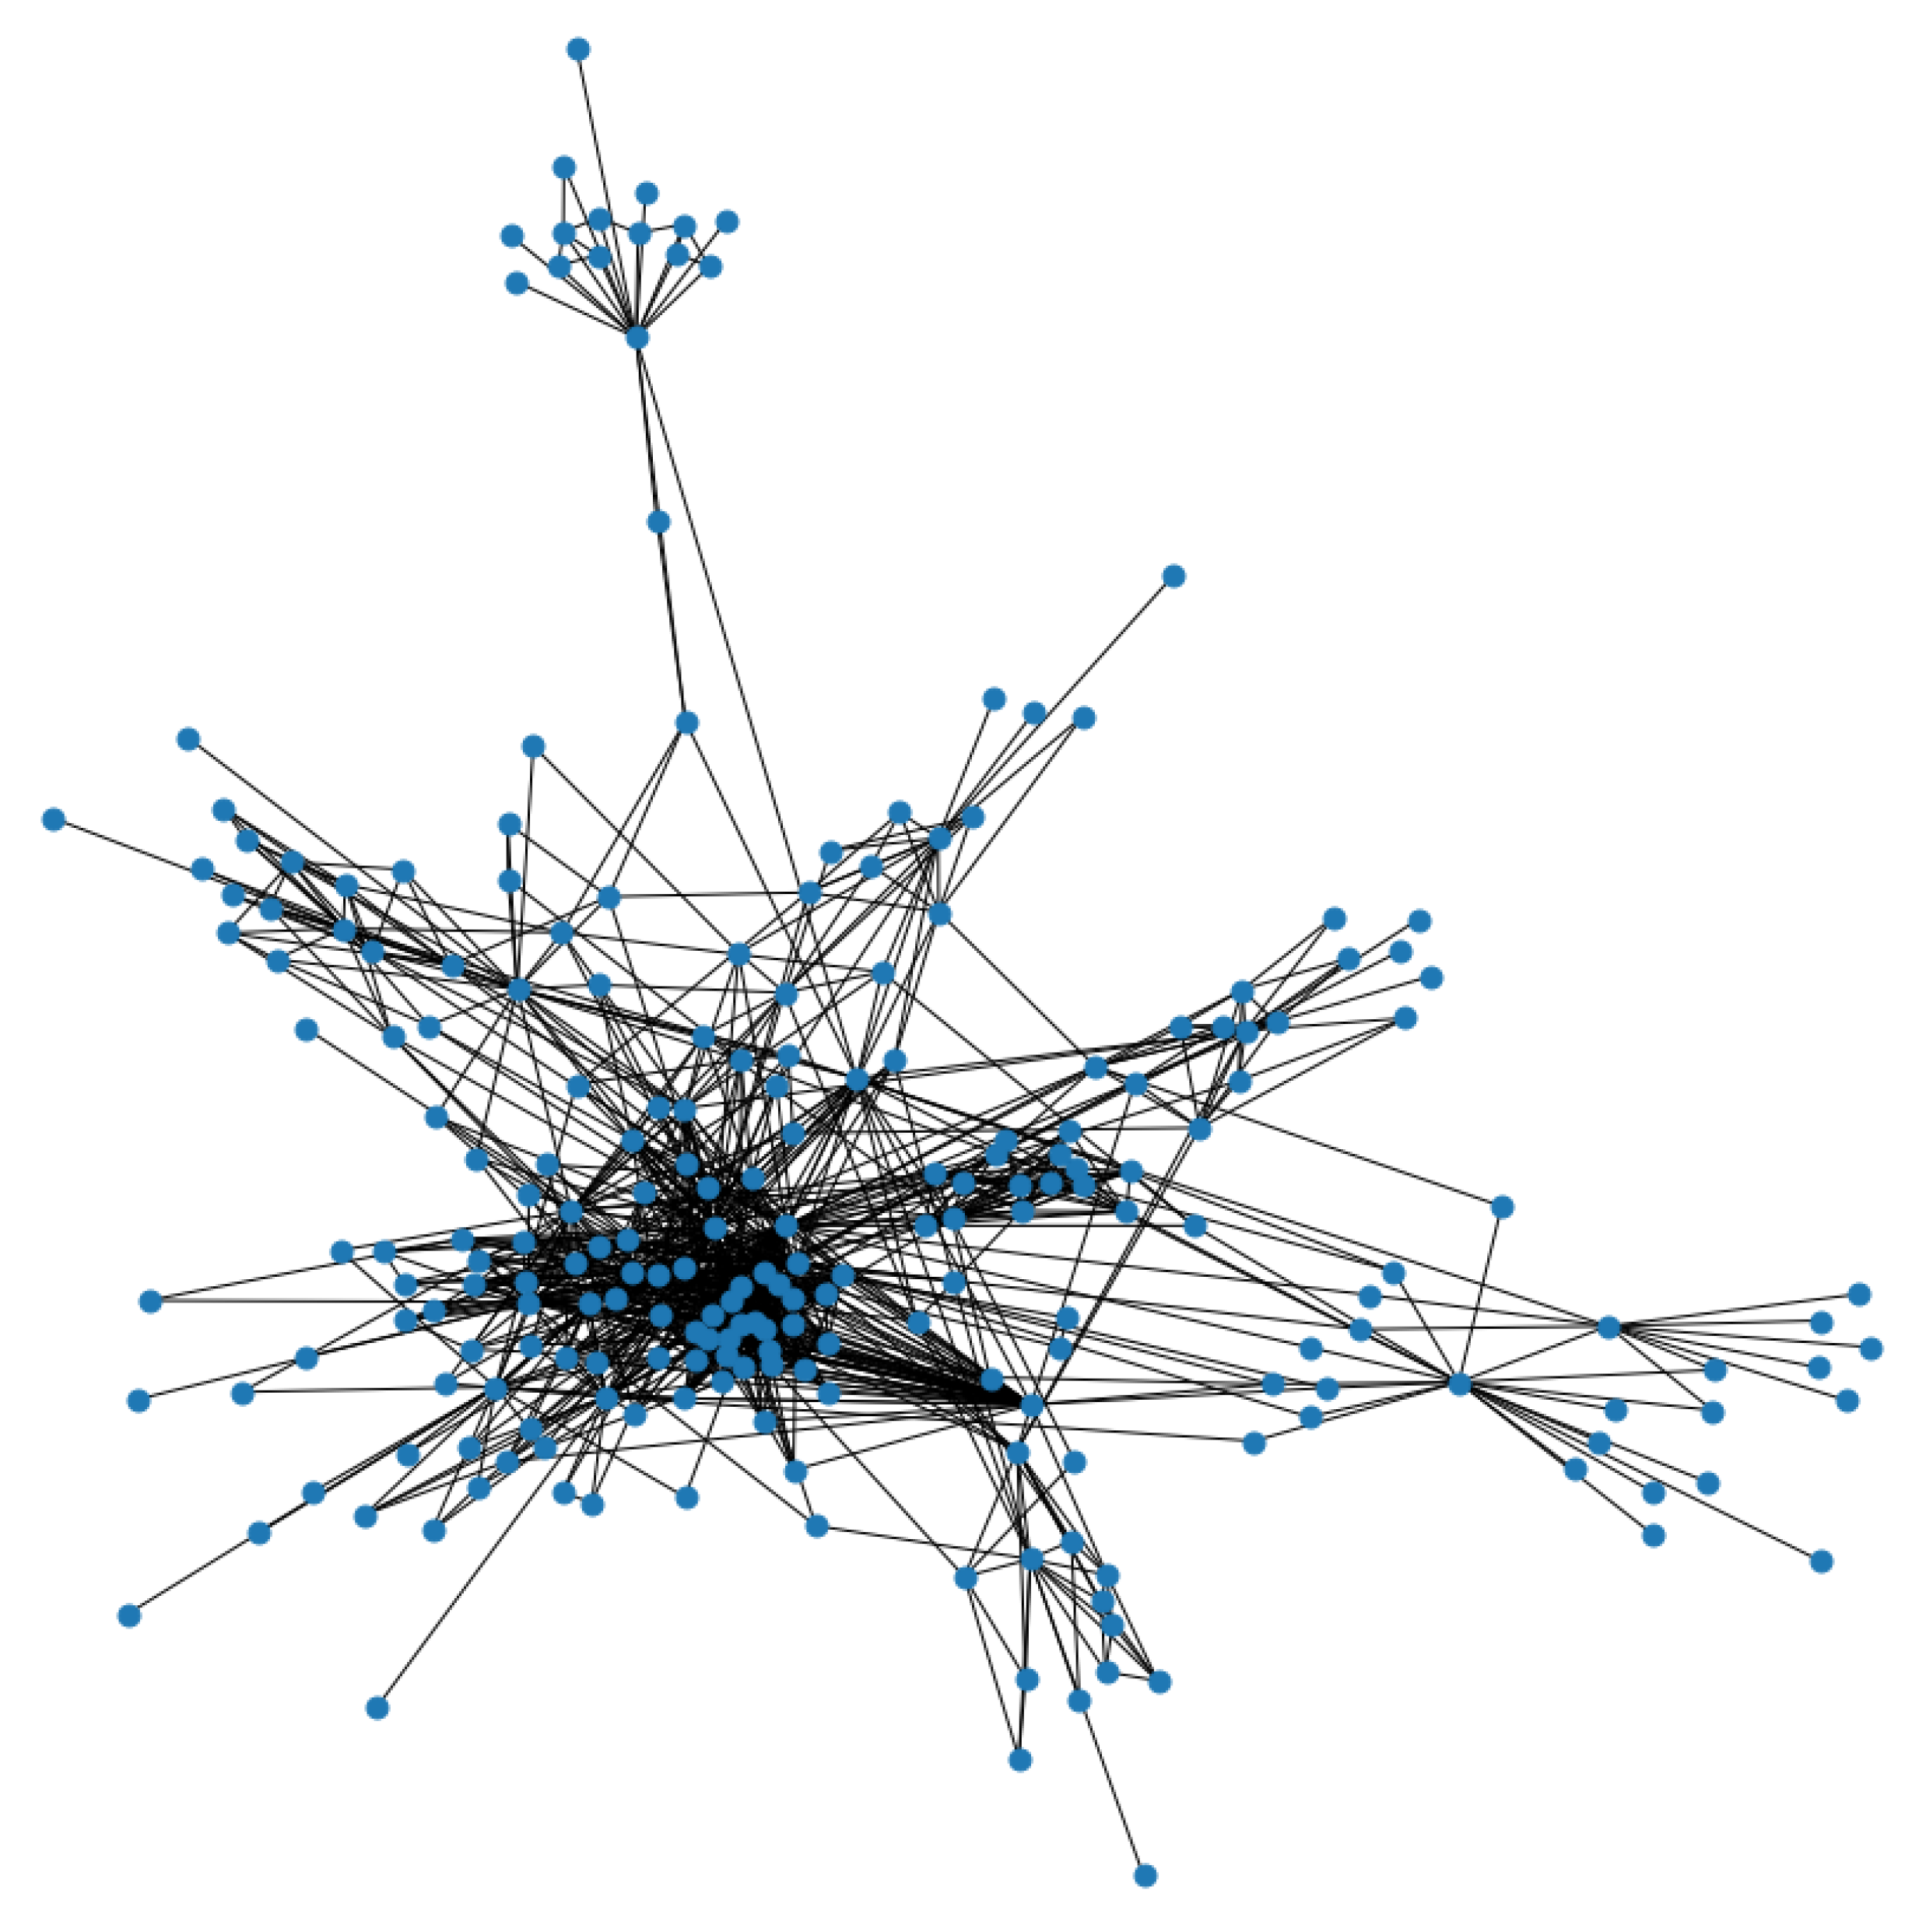
- Data collection and network representation: The process begins by considering user profiles and extracting relevant features. These features are then used to create a graph that represents the social network.
- Evaluation of user profiles: The next step involves evaluating the contribution of user profiles to the overall strength of the relationship. Various metrics and criteria are employed to assess the level of engagement.
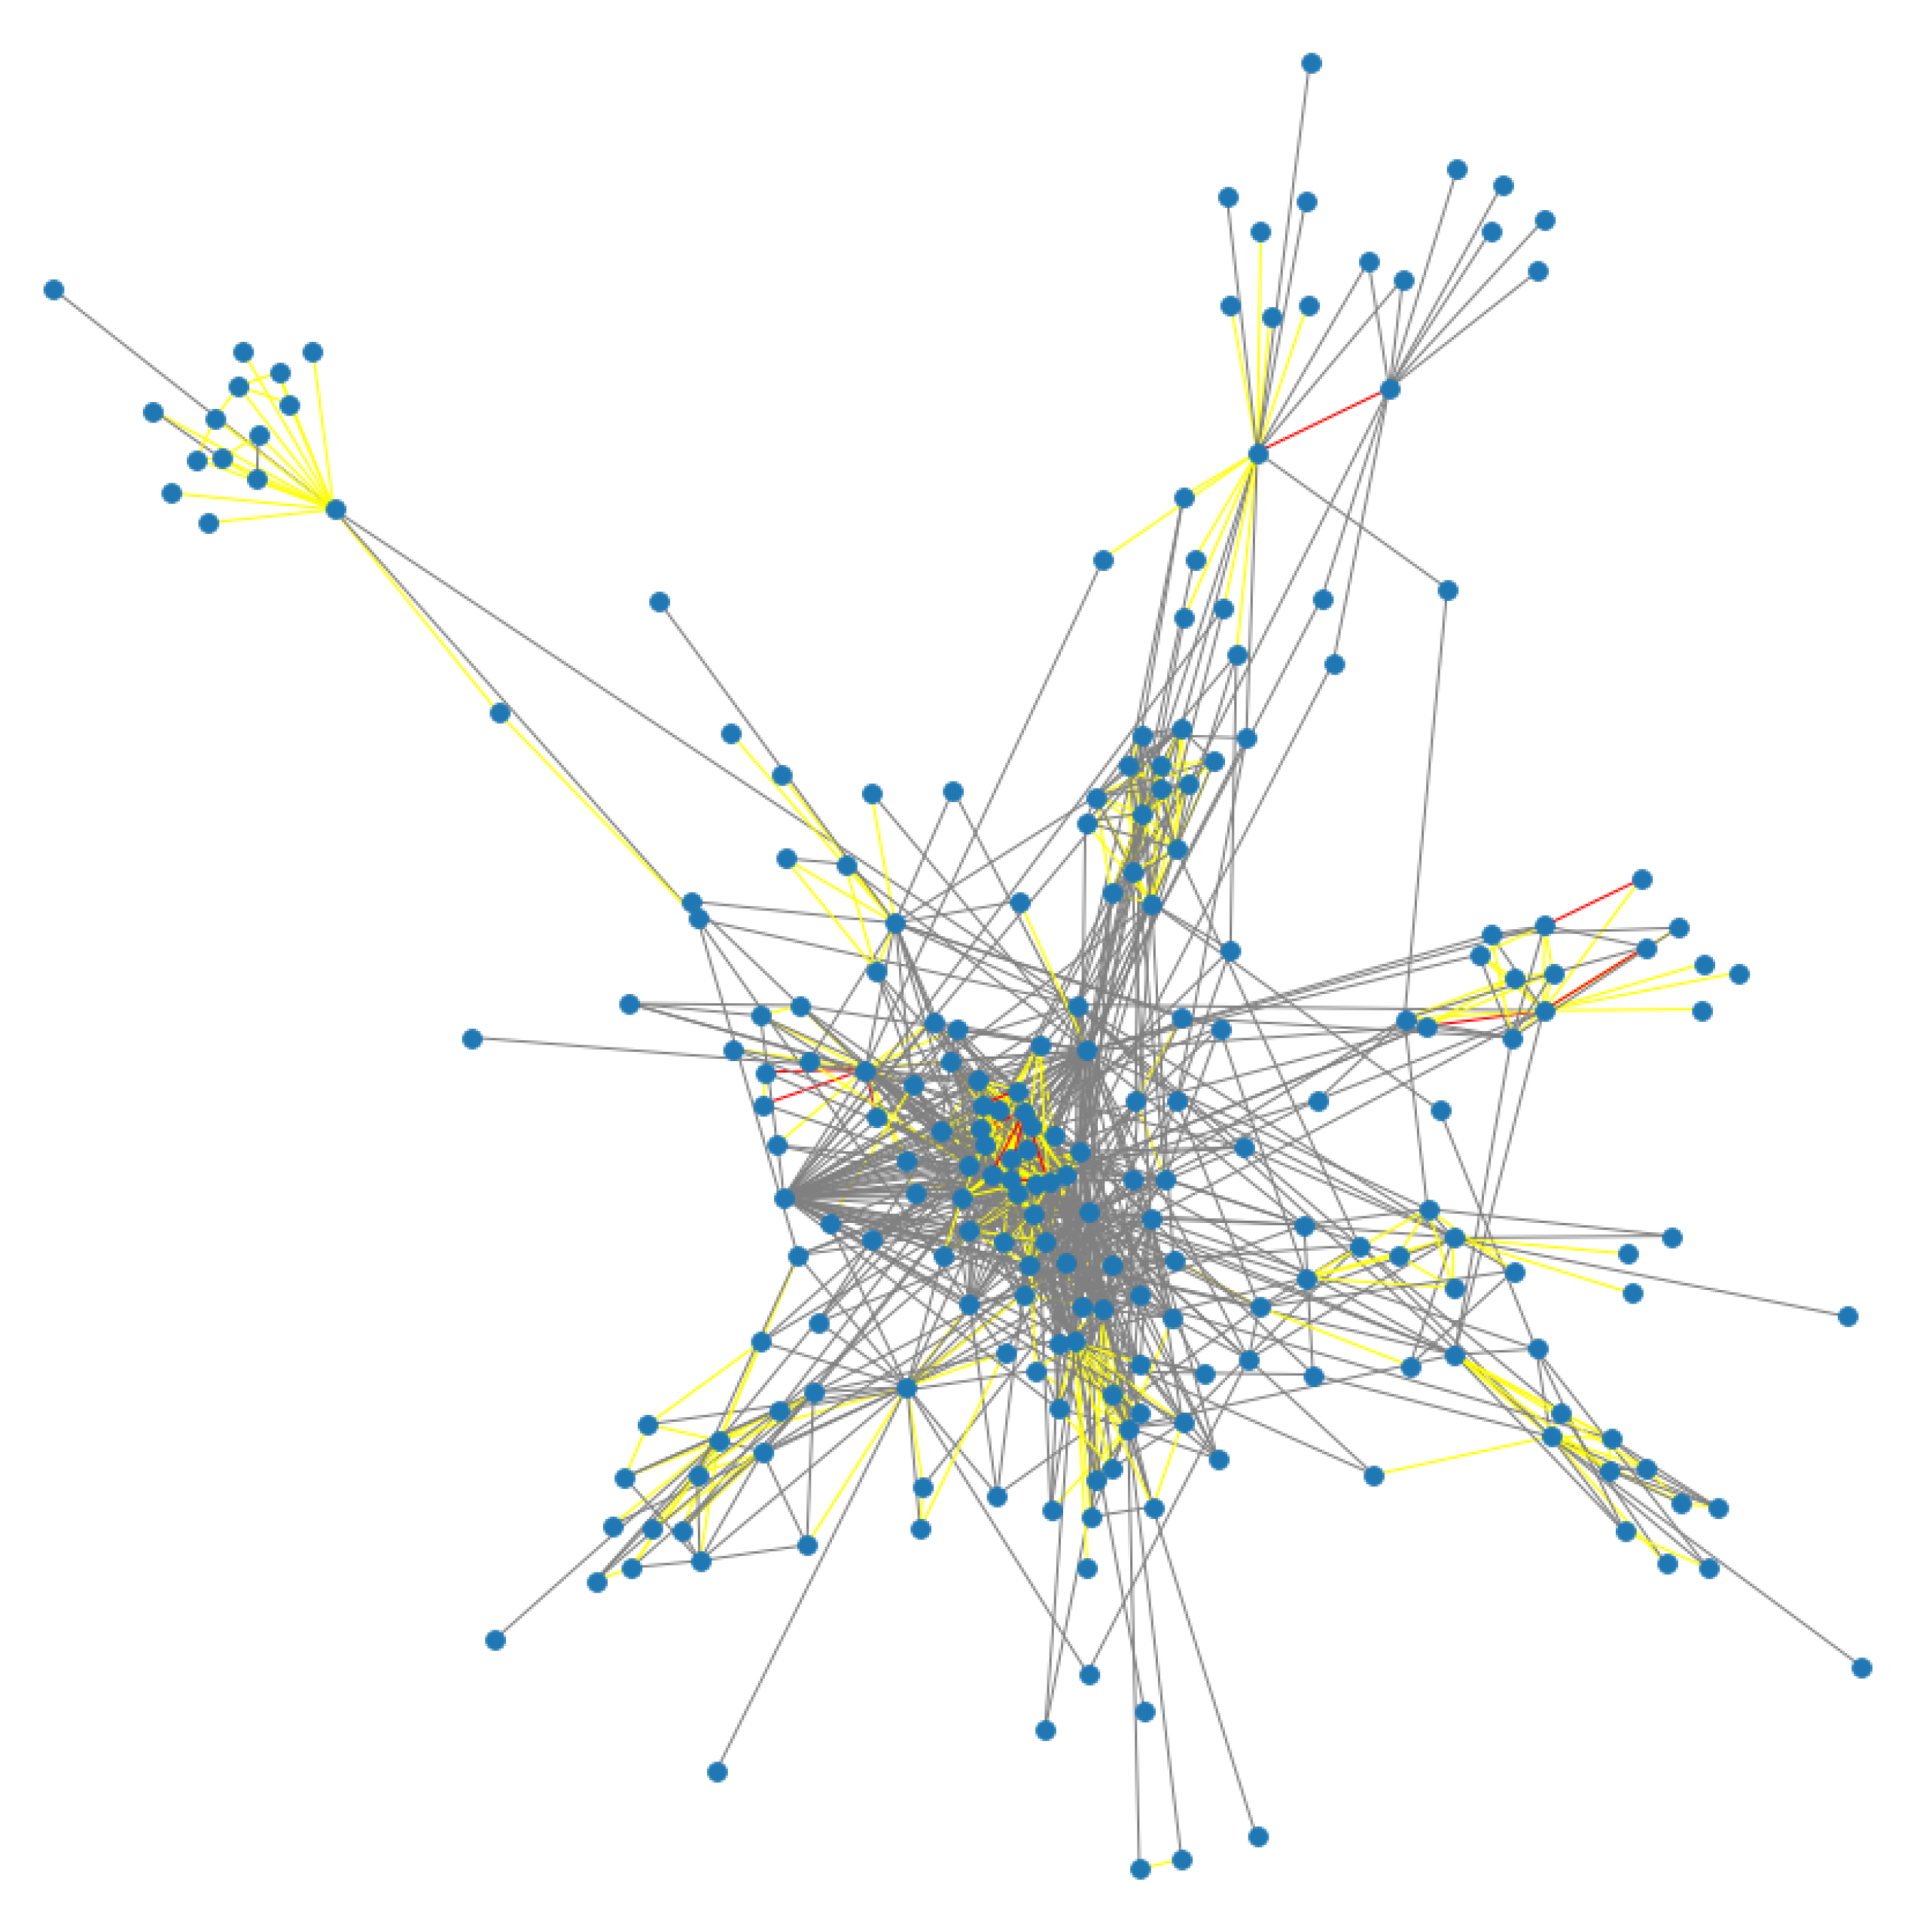
- Categorization of relationships: Based on the evaluated strength, the relationships are categorized into different levels or groups. This categorization provides insights into the varying degrees of engagement among users.
- Presentation of statistical results: The study concludes by presenting statistical results and analyses related to the categorized relationships. These findings contribute to a deeper understanding of user engagement and the dynamics within the social network.
- Common or close locations: The proximity or similarity of the locations associated with the user profiles is taken into account.
- Similar scale in the number of friends: The comparison of the number of friends or connections between two user profiles helps gauge the similarity of their social network size.
- Similar frequency of posts: The frequency at which users post on the platform is examined to identify similarities or patterns in their activity.
- Interaction criteria: Various interaction metrics are considered, including friendship and follow relationships, as well as user mentions and retweets. These interactions indicate the level of engagement and connection between users.
4.2. Metrics
4.3. Calculation of Connection Scores
4.4. Edges Categorization
- Indifferent [0, 2].
- Weak (3, 4].
- Medium (5, 6].
- Strong (7, 8].
- Very strong (9, 10].
5. Implementation
6. Evaluation
6.1. Analysis of User Relationship Strength
6.2. Clustering Algorithms Comparison
7. Discussion
7.1. Insights into User Relationship Dynamics
7.2. Interpretation of Clustering Results
8. Conclusions and Future Work
Author Contributions
Funding
Data Availability Statement
Conflicts of Interest
References
- Kafeza, E.; Kanavos, A.; Makris, C.; Pispirigos, G.; Vikatos, P. T-PCCE: Twitter Personality based Communicative Communities Extraction System for Big Data. IEEE Trans. Knowl. Data Eng. 2020, 32, 1625–1638. [Google Scholar] [CrossRef]
- Kanavos, A.; Drakopoulos, G.; Tsakalidis, A.K. Graph Community Discovery Algorithms in Neo4j with a Regularization-based Evaluation Metric. In Proceedings of the 13th International Conference on Web Information Systems and Technologies (WEBIST), Porto, Portugal, 25–27 April 2017; pp. 403–410. [Google Scholar]
- Noordhuis, P.; Heijkoop, M.; Lazovik, A. Mining Twitter in the Cloud: A Case Study. In Proceedings of the IEEE International Conference on Cloud Computing (CLOUD), Miami, FL, USA, 5–10 July 2010; pp. 107–114. [Google Scholar]
- Lin, M.F.G.; Hoffman, E.S.; Borengasser, C. Is Social Media Too Social for Class? A Case Study of Twitter Use. TechTrends 2013, 57, 39–45. [Google Scholar] [CrossRef]
- Tripathy, B.K.; Mitra, A. An Algorithm to Achieve k-Anonymity and l-Diversity Anonymisation in Social Networks. In Proceedings of the 4th International Conference on Computational Aspects of Social Networks (CASoN), Sao Carlos, Brazil, 21–23 November 2012; pp. 126–131. [Google Scholar]
- Wasserman, S.; Faust, K. Social Network Analysis: Methods and Applications; Cambridge University Press: Cambridge, UK, 1994. [Google Scholar]
- Drakopoulos, G.; Gourgaris, P.; Kanavos, A. Graph Communities in Neo4j. Evol. Syst. 2020, 11, 397–407. [Google Scholar] [CrossRef]
- Candon, P. Twitter: Social Communication in the Twitter Era. New Media Soc. 2019, 21, 146144481983198. [Google Scholar] [CrossRef]
- Quercia, D.; Kosinski, M.; Stillwell, D.; Crowcroft, J. Our Twitter Profiles, Our Selves: Predicting Personality with Twitter. In Proceedings of the 3rd International IEEE Conference on Privacy, Security, Risk and Trust (PASSAT) and 3rd International IEEE Conference on Social Computing (SocialCom), Boston, MA, USA, 9–11 October 2011; pp. 180–185. [Google Scholar]
- Christakis, N.A.; Fowler, J.H. Connected: The Surprising Power of Our Social Networks and How They Shape Our Lives; Little, Brown and Company: Boston, MA, USA, 2009. [Google Scholar]
- Kalogeropoulos, N.R.; Doukas, I.; Makris, C.; Kanavos, A. A Graph-Based Extension for the Set-Based Model Implementing Algorithms Based on Important Nodes. In Proceedings of the 16th International Conference on Artificial Intelligence Applications and Innovations (AIAI), Halkidiki, Greece, 5–7 June 2020; pp. 143–154. [Google Scholar]
- Dhillon, I.S.; Guan, Y.; Kulis, B. A Fast Kernel-based Multilevel Algorithm for Graph Clustering. In Proceedings of the 11th ACM SIGKDD International Conference on Knowledge Discovery and Data Mining, Chicago, IL, USA, 21–24 August 2005; pp. 629–634. [Google Scholar]
- Ozaki, T.; Ohkawa, T. Mining Correlated Subgraphs in Graph Databases. In Proceedings of the 12th Pacific-Asia Conference on Advances in Knowledge Discovery and Data Mining (PAKDD), Osaka, Japan, 20–23 May 2008; pp. 272–283. [Google Scholar]
- Le, T.V.; Kulikowski, C.A.; Muchnik, I.B. Coring Method for Clustering a Graph. In Proceedings of the 19th International Conference on Pattern Recognition (ICPR), Tampa, FL, USA, 8–11 December 2008; pp. 1–4. [Google Scholar]
- Kraus, J.M.; Palm, G.; Kestler, H. On the Robustness of Semi-Supervised Hierarchical Graph Clustering in Functional Genomics. In Proceedings of the 5th International Workshop on Mining and Learning with Graphs, Florence, Italy, 1–3 August 2007; pp. 147–150. [Google Scholar]
- Wilson, C.; Boe, B.; Sala, A.; Puttaswamy, K.P.N.; Zhao, B.Y. User Interactions in Social Networks and their Implications. In Proceedings of the EuroSys, Nuremberg, Germany, 1–3 April 2009; pp. 205–218. [Google Scholar]
- Kim, J.; Lee, E.; Choi, J.; Bae, Y.; Ko, M.; Kim, P. Monitoring Social Relationship among Twitter Users by using NodeXL. In Proceedings of the Research in Adaptive and Convergent Systems (RACS), Montreal, QC, Canada, 1–4 October 2013; pp. 107–110. [Google Scholar]
- Davis, C.A., Jr.; Pappa, G.L.; de Oliveira, D.R.R.; de Lima Arcanjo, F. Inferring the Location of Twitter Messages Based on User Relationships. Trans. GIS 2011, 15, 735–751. [Google Scholar]
- Priedhorsky, R.; Culotta, A.; Valle, S.Y.D. Inferring the Origin Locations of Tweets with Quantitative Confidence. In Proceedings of the Computer Supported Cooperative Work (CSCW), Baltimore, MD, USA, 15–19 February 2014; pp. 1523–1536. [Google Scholar]
- Xiang, R.; Neville, J.; Rogati, M. Modeling Relationship Strength in Online Social Networks. In Proceedings of the 19th International Conference on World Wide Web (WWW), Raleigh, NC, USA, 26–30 April 2010; pp. 981–990. [Google Scholar]
- McPherson, M.; Smith-Lovin, L.; Cook, J.M. Birds of a Feather: Homophily in Social Networks. Annu. Rev. Sociol. 2001, 27, 415–444. [Google Scholar] [CrossRef] [Green Version]
- Dehghani, M.; Johnson, K.; Hoover, J.; Sagi, E.; Garten, J.; Parmar, N.J.; Vaisey, S.; Iliev, R.; Graham, J. Purity Homophily in Social Networks. J. Exp. Psychol. Gen. 2016, 145, 366. [Google Scholar] [CrossRef] [PubMed]
- Liben-Nowell, D.; Kleinberg, J.M. The Link-Prediction Problem for Social Networks. J. Am. Soc. Inf. Sci. Technol. (JASIST) 2007, 58, 1019–1031. [Google Scholar] [CrossRef] [Green Version]
- Dougnon, R.Y.; Fournier-Viger, P.; Nkambou, R. Inferring User Profiles in Online Social Networks Using a Partial Social Graph. In Proceedings of the 28th Canadian Conference on Artificial Intelligence (AI), Halifax, NS, Canada, 2–5 June 2015; Volume 9091, pp. 84–99. [Google Scholar]
- Rong, X. Word2vec Parameter Learning Explained. arXiv 2014, arXiv:1411.2738. [Google Scholar]
- Likas, A.; Vlassis, N.; Verbeek, J.J. The Global k-means Clustering Algorithm. Pattern Recognit. 2003, 36, 451–461. [Google Scholar] [CrossRef] [Green Version]
- Savaresi, S.M.; Boley, D. On the Performance of Bisecting K-means and PDDP. In Proceedings of the 1st SIAM International Conference on Data Mining (SDM), Chicago, IL, USA, 5–7 April 2001; pp. 1–14. [Google Scholar]
- Schubert, E.; Sander, J.; Ester, M.; Kriegel, H.; Xu, X. DBSCAN Revisited, Revisited: Why and How You Should (Still) Use DBSCAN. ACM Trans. Database Syst. 2017, 42, 19:1–19:21. [Google Scholar] [CrossRef]
- Ankerst, M.; Breunig, M.M.; Kriegel, H.; Sander, J. OPTICS: Ordering Points To Identify the Clustering Structure. In Proceedings of the ACM SIGMOD International Conference on Management of Data, Philadelphia, PA, USA, 1–3 June 1999; pp. 49–60. [Google Scholar]
- Reynolds, D.A. Gaussian Mixture Models. In Encyclopedia of Biometrics; Springer: Cham, Switzerland, 2009; pp. 659–663. [Google Scholar]
- Moon, T.K. The Expectation-Maximization Algorithm. IEEE Signal Process. Mag. 1996, 13, 47–60. [Google Scholar] [CrossRef]
- Nielsen, F. Hierarchical Clustering. In Introduction to HPC with MPI for Data Science; Springer: Cham, Switzerland, 2016; pp. 195–211. [Google Scholar]
- Ng, A.Y.; Jordan, M.I.; Weiss, Y. On Spectral Clustering: Analysis and an Algorithm. In Proceedings of the Advances in Neural Information Processing Systems 14 (NIPS), Vancouver, BC, Canada, 3–8 December 2001; pp. 849–856. [Google Scholar]
- Kanavos, A.; Livieris, I.E. Fuzzy Information Diffusion in Twitter by Considering User’s Influence. Int. J. Artif. Intell. Tools 2020, 29, 2040003:1–2040003:22. [Google Scholar] [CrossRef]
- Zamparas, V.; Kanavos, A.; Makris, C. Real Time Analytics for Measuring User Influence on Twitter. In Proceedings of the 27th IEEE International Conference on Tools with Artificial Intelligence (ICTAI), Vietri sul Mare, Italy, 9–11 November 2015; pp. 591–597. [Google Scholar]
- Drakopoulos, G.; Kanavos, A.; Paximadis, K.; Ilias, A.; Makris, C.; Mylonas, P. Computing Massive Trust Analytics for Twitter using Apache Spark with Account Self-assessment. In Proceedings of the 16th International Conference on Web Information Systems and Technologies (WEBIST), Virtual Event, 3–5 November 2020; pp. 403–414. [Google Scholar]
- Drakopoulos, G.; Kanavos, A.; Tsakalidis, A.K. Evaluating Twitter Influence Ranking with System Theory. In Proceedings of the 12th International Conference on Web Information Systems and Technologies (WEBIST), Rome, Italy, 23–25 April 2016; pp. 113–120. [Google Scholar]
- Kyriazidou, I.; Drakopoulos, G.; Kanavos, A.; Makris, C.; Mylonas, P. Towards Predicting Mentions to Verified Twitter Accounts: Building Prediction Models over MongoDB with Keras. In Proceedings of the 15th International Conference on Web Information Systems and Technologies (WEBIST), Vienna, Austria, 18–20 September 2019; pp. 25–33. [Google Scholar]


| Metric Category | Metric | Symbol | Weight |
|---|---|---|---|
| Similarity | Friends Count | 1 | |
| Location | 2 | ||
| Statuses Count | 1 | ||
| Interaction | Direct Message | 1 | |
| Following | 1 | ||
| Mention | 1.5 | ||
| Mutual Friendship | 3 | ||
| Reply | 1.5 |
| Number of Friends | Percentage of Users |
|---|---|
| 0–100 | 22 |
| 101–500 | 35 |
| 501–1000 | 23 |
| 1001–5000 | 11 |
| over 5000 | 9 |
| Number of Followers | Percentage of Users |
|---|---|
| 0–100 | 12 |
| 101–500 | 11 |
| 501–1000 | 9 |
| 1001–5000 | 13 |
| over 5000 | 55 |
| Number of Tweets | Percentage of Users |
|---|---|
| 0–100 | 6 |
| 101–500 | 9 |
| 501–1000 | 10 |
| 1001–5000 | 25 |
| over 5000 | 50 |
| Metric Category | Metric | Overall Score Contribution |
|---|---|---|
| Similarity | Friends Count | 9.5 |
| Location | 9 | |
| Statuses Count | 7.5 | |
| Interaction | Direct Message | 35.5 |
| Following | 1 | |
| Mention | 1.5 | |
| Mutual Friendship | 33 | |
| Reply | 3 |
| Classes | Edges |
|---|---|
| Very Strong | 0.55 |
| Strong | 3.75 |
| Medium | 15.35 |
| Weak | 29.65 |
| Indifferent | 50.7 |
Disclaimer/Publisher’s Note: The statements, opinions and data contained in all publications are solely those of the individual author(s) and contributor(s) and not of MDPI and/or the editor(s). MDPI and/or the editor(s) disclaim responsibility for any injury to people or property resulting from any ideas, methods, instructions or products referred to in the content. |
© 2023 by the authors. Licensee MDPI, Basel, Switzerland. This article is an open access article distributed under the terms and conditions of the Creative Commons Attribution (CC BY) license (https://creativecommons.org/licenses/by/4.0/).
Share and Cite
Kanavos, A.; Karamitsos, I.; Mohasseb, A. Exploring Clustering Techniques for Analyzing User Engagement Patterns in Twitter Data. Computers 2023, 12, 124. https://doi.org/10.3390/computers12060124
Kanavos A, Karamitsos I, Mohasseb A. Exploring Clustering Techniques for Analyzing User Engagement Patterns in Twitter Data. Computers. 2023; 12(6):124. https://doi.org/10.3390/computers12060124
Chicago/Turabian StyleKanavos, Andreas, Ioannis Karamitsos, and Alaa Mohasseb. 2023. "Exploring Clustering Techniques for Analyzing User Engagement Patterns in Twitter Data" Computers 12, no. 6: 124. https://doi.org/10.3390/computers12060124
APA StyleKanavos, A., Karamitsos, I., & Mohasseb, A. (2023). Exploring Clustering Techniques for Analyzing User Engagement Patterns in Twitter Data. Computers, 12(6), 124. https://doi.org/10.3390/computers12060124


_Karamitsos.jpg)


