Abstract
The domain of Multi-Network Latency Prediction for IoT and Wireless Sensor Networks (WSNs) confronts significant challenges. However, continuous research efforts and progress in areas such as machine learning, edge computing, security technologies, and hybrid modelling are actively influencing the closure of identified gaps. Effectively addressing the inherent complexities in this field will play a crucial role in unlocking the full potential of latency prediction systems within the dynamic and diverse landscape of the Internet of Things (IoT). Using linear interpolation and extrapolation algorithms, the study explores the use of multi-network real-time end-to-end latency data for precise prediction. This approach has significantly improved network performance through throughput and response time optimization. The findings indicate prediction accuracy, with the majority of experimental connection pairs achieving over 95% accuracy, and within a 70% to 95% accuracy range. This research provides tangible evidence that data packet and end-to-end latency time predictions for heterogeneous low-rate and low-power WSNs, facilitated by a localized database, can substantially enhance network performance, and minimize latency. Our proposed JosNet model simplifies and streamlines WSN prediction by employing linear interpolation and extrapolation techniques. The research findings also underscore the potential of this approach to revolutionize the management and control of data packets in WSNs, paving the way for more efficient and responsive wireless sensor networks.
1. Introduction
Wireless Sensor Networks (WSNs) confront a substantial challenge arising from the elevated data rate emanating from myriad Internet of Things (IoT) devices, potentially resulting in network congestion and performance degradation. The surge in IoT-connected technology has precipitated a demand for streamlined, compact, high-speed wireless network processing devices [1,2]. To attain heightened prediction accuracy within an IoT infrastructure, it is imperative to accord priority to bespoke research on network traffic, delay, and bandwidth prediction. This prioritization aims to curtail network disruption, downtime, and failure. Although WSNs find application in scenarios where energy efficiency and scalability are paramount, they are prone to congestion, infrastructure constraints, and interoperability issues. In response to these challenges, this research introduces a multi-network data speed prediction algorithm with the potential to enhance WSN performance.
This study proposed a predictive model structured upon real-time data acquired over time within JosNet—a network brokerage application for interoperability and integration of data packets between Bluetooth, Zigbee, and Thread network technologies [3]. Furthermore, JosNet allows the exchange of data packets or commands routed through stations in a complex interpretation and forwarding system to enhance interoperability in heterogenous wireless networks. This methodology facilitates the collection of precise and trustworthy primary data, stored locally within the software application, circumventing potential complexities associated with externally managed network service providers. It is crucial to underscore that the accumulation of data over time ameliorates prediction accuracy. Predictions of data packet size are contingent upon a known time period, while the prediction of packet delivery time hinges upon a known data packet size. This predictive framework holds utility in comprehending the behavior of network base stations or servers, thereby augmenting decision-making processes for network protocols like Ad hoc On-Demand Distance Vector (AODV) and Code-Division Multiple Access (CDMA).
The optimization and planning of networks can be substantially enhanced when structured by Artificial Intelligence (AI) predictions, ensuring security and coherence. The identification of network breaches becomes feasible through the detection of irregular or abnormal delays and diminished throughput within a network, as juxtaposed against predicted outcomes. To mitigate network congestion, enhance throughput, and augment Quality of Service (QoS), this research introduces packet speed prediction within the JosNet network brokerage. This approach is WSN-centric, given that an optimal routing medium extends the battery life of sensors. It is noteworthy that this research does not center on overall network traffic but rather on the speed of data packets. This emphasis involves capturing time and data size from source to destination, providing a comprehensive context to overall network performance and QoS, as utilized by other network protocols.
Distinguishing network traffic data prediction from data packet prediction, this research underscores the urgency, emphasized by Shihao et al. [4], to address challenges associated with autocorrelation characteristics and nonlinear time series data. The multifaceted problem addressed in this research unfolds across several dimensions. First, the study elucidates how high data transmission within a limited bandwidth induces network congestion, potentially owing to multiple factors [5]. Second, it outlines challenges pertaining to WSNs’ energy conservation-focused design and underscores the role of robust network prediction software in addressing trade-offs such as miniature device usage, decreased hardware and software processes, and low-rate communication [6,7]. Third, as the IoT network expands, the pivotal role of WSNs in connection and communication is highlighted, emphasizing the potential for enhanced integration through scalable network gateways and improved routing options with network failure prediction [8,9,10]. Fourth, compatibility issues arising from numerous network protocols and diverse connection media are addressed, with the proposal that JosNet deployment offers a viable solution [3,11]. Additionally, the study identifies a gap in research concerning end-to-end latency prediction for heterogeneous WSNs, exploring how the JosNet brokerage system could bridge this gap.
This study contributes to theoretical and empirical literature by presenting an innovative prediction approach to predict end-to-end latency time and data packet size for low-rate and low-power WSN protocols. Specifically, it realized the objectives:
RO1: Develop a WSN predictive model within JosNet brokerage for end-to-end latency time-based on live data collected within a device (node) over time.
RO2: Develop a WSN predictive model within JosNet brokerage for data packet size-based on live data collected within a device (node) over time.
RO3: Provide insight into data packet behavior and recommend a reliable predictive algorithm for heterogeneous WSN protocols.
RO4: Analyze and evaluate the level of accuracy for existing WSN predictive algorithms and models.
The analysis within the paper substantiates that prediction of end-to-end latency time and data packet size plays a pivotal role in optimizing network performance. This optimization assumes critical importance, particularly in the domain of low-rate and low-power WSN protocols, where operational efficiency is of paramount concern. The precision in predicting end-to-end latency time and data packet size significantly augments the reliability of WSNs. This enhancement holds relevance in applications where timely and dependable data transmission is imperative, such as in real-time monitoring systems or industrial automation. The analysis also underscores that predictions using interpolation and extrapolation will contribute effectively to the allocation of resources within the WSN. By anticipating end-to-end latency and data packet sizes, network resources can be allocated more efficiently, thus preventing bottlenecks, and ensuring a smoother flow of data. The predictive models we have employed (interpolation and extrapolation) demonstrate the capability to dynamically adjust to changes in network conditions, ensuring sustained optimal performance and understanding that network behavior can prove instrumental in decision-making processes related to network protocols and management. Network administrators can make well-informed decisions based on anticipated latency and data packet sizes, leading to more effective and strategic planning.
The study is organized as follows: Section 2 provides the literature review including the state of the predictive model and existing empirical literature. Section 3 shows the development process or approach. Section 4 discusses the implementation and analysis and Section 5 discusses the findings and implications for existing predictive strategy.
2. Literature Review
2.1. Understanding Data Packet
The definition of a data packet is broad due to the composition of packets across a variety of forms, transport media, and context of usage or application platform. For example, in networking, a packet is a segment of a larger message [12]. An IP data packet is loaded with information. Stalling and Case [13] defined a network packet as a group of bits equipped with data and control information. A data packet is a unit of data made into a single package that travels along a given network path. Data packets are used in Internet Protocol (IP) transmissions for data that navigates the web, and in other kinds of networks. A data packet has other parts besides the raw data it contains—often referred to as the payload. Data packets also have headers that carry certain types of metadata, along with routing information. For example, IP data packets have a header containing an IP address of origin and destination IP address [14]. Data packets carry additional information such as the device ID, location, packet source, and destination which is necessary for network communication.
2.2. Data Packet Prediction in Low-Rate and Low-Power Network
It is a long-existing practice in communication networks to determine the position of a node in a large-scale network using “hop count” [15,16], although the “hop count” approach is widely acceptable, it is not precisely accurate because the “hop count” only provides the routing map and quickest path to the destination of data packets. However, some research suggests a combination of more approaches [17], such as the use of historical data and predicting future data. JosNet makes use of “hop count” in the routing design [3] and then combines the prediction model discussed in the paper to accurately enhance network performance.
There has been a recent expansion of Artificial Intelligence, Machine Learning, prediction tools, and generative responses which are crucial and useful for problem-solving. Prediction of end-to-end latency time could hugely transform how WSN operates through planning, configuration, Artificial Intelligence, and Machine Learning. In WSNs, data packet prediction is a technique used to forecast the content or characteristics of data packets that sensors will transmit over the network. This prediction could have several practical applications in improving the efficiency, reliability, and energy conservation of WSNs. The benefits of data packet predictions are enormous and may include:
- Energy Efficiency: WSNs are often deployed in resource-constrained environments, and power efficiency is a critical concern. Predicting data packets’ contents allows sensor nodes to make informed decisions about when and how to transmit data [18]. By transmitting only necessary or relevant information, nodes can conserve energy, thereby extending the network’s operational lifetime [19].
- Data Reduction: In WSNs, data transmission consumes a significant amount of energy. Predicting data packets’ contents can enable data reduction techniques [17]. For instance, if a sensor node can predict that its data will remain relatively constant over a certain period of time, it may send only occasional updates instead of repeatedly transmitting the same data.
- Quality of Service (QoS): Data packet prediction could help maintain or enhance QoS in WSNs. By predicting when important data will arrive and prioritizing its transmission, you can ensure that critical information is delivered with lower latency and higher reliability.
- Routing Optimization: Data packet prediction can also play a role in optimizing routing algorithms within the network. If a node can predict that certain data packets are likely to be forwarded to a particular sink node, it can optimize its routing decisions accordingly, reducing unnecessary hops and improving network efficiency [20,21].
- Context-Aware Applications: WSNs are often used in applications where context-awareness is essential, such as environmental monitoring or healthcare. Data packet prediction can help in providing timely context updates to applications, allowing them to make informed decisions based on the predicted data.
- Data Analytics: Data packet prediction often involves the use of predictive tools or techniques, which can learn patterns and trends in datasets. This can be valuable not only for prediction but also for data analytics and anomaly detection. For example, if a sensor node predicts a certain data pattern but observes an anomaly, alerts can be triggered for further checks and resolution.
- Reduced Network Congestion: By predicting when and where data packets are likely to be generated, WSNs can avoid network congestion, which can occur when multiple nodes simultaneously transmit data. Predictive algorithms can help in scheduling data transmissions to minimize collisions and contention for network resources.
In practice, data packet prediction in WSNs can involve various algorithms and statistical techniques, including time series analysis, regression, and neural networks, all working together to provide solutions and reduce ambiguity in wireless network communication. The choice of prediction approach depends on the specific application and the nature of the sensor data being collected.
2.3. Existing Network Prediction Models
Wang and colleagues [22] propose a traffic arrival prediction using random forest prediction specifically to improve the QoS for Wi-Fi networks. However, they have not explicitly described any real implementation but merely focused on the random forest equation, and some comparative analyses. However, Wang and colleagues further confirm the possibility of arrival time estimation for the next packet based on a known element such as data packet size, packet interval, or packet arrival time. Thus, we could adjust other elements or components accordingly in an organized form with the aim of enhancing the performance and quality of the communication protocol.
The use of an Autoregressive Moving Average (ARMA) prediction model by [5] to intelligently forecast the network status of a production line is another related work. They claim the algorithm can predict the entire network operation in advance of the optimized Back Propagation (BP) neural network which helps to reduce the network behavior fluctuation. However, the research uses simulated network data packets and not actual network data packets or WSN protocols such as Bluetooth, LE, or Zigbee. On the other hand, our research includes JosNet which is implemented within an actual WSN environment. Although the model could be applied to other IoT domains, the key focus is to improve network status in production lines and not necessarily that of WSNs. The prediction model within JosNet brokerage focuses on WSN protocols applications.
Understanding and predicting the network latency of each mobile device is crucial to users, particularly in mobile streaming and gaming applications. A related work which focuses on capturing the latency of personal mobile devices [23] suggests a “Distance-Feature” (D-F) decomposition algorithm with a combination of 3D sampled data to enhance prediction accuracy. To successfully implement this algorithm, the precise GPS location of both devices must be turned on because the static and mean network latency is calculated based on the precise distance of the device. A serious challenge arises when one mobile device’s precise distance is paused or unknown. Again, their research focuses on personal devices such as phones and laptops rather than on WSN protocols.
Cut-through (CT) switching allows packets to be split into small chunks before they are concurrently sent across a network, thereby, reducing network latency as a result of the smaller data size, called flits. Choi and colleagues [24] estimate that the CT switching technique is inadequate and proposes a per-hop queueing delay through M/G/c queueing approximation to predict each delay component for end-to-end latency. The challenge here is that the model passes through a complicated preprocessing which is unrealistic for WSN and is designed with a key focus on energy management. However, the proposed approach may be more adequate for high-speed networks such as the IEEE 802.11 Wi-Fi standard rather than for low-rate networks such as the IEEE 802.15.4.
A very recent and closely related work which focuses on improving the QoS for WSNs using Machine Learning is by Natarajan and Kumar [25]. They propose a strategy for selecting an optimal routing path, which is key in packet arrival time, using regression algorithms to forecast the data packet reception ratio (PRR) and therefore, increasing the QoS. They focus on the best routing path (addressed in our previous research using JosNet [3] while our research takes a different approach by using live data packets to make predictions. Other research work has explored the use of different prediction approaches and algorithms to improve QoS, for example, using the Graph Neural Network (GNN) model to estimate key performance indicators in a network [26,27], combining analytical and simulated estimation for load distribution [28], analyses of bottleneck prediction, and management for multi-class traffic in Data Centre Networks [29].
Shihao and colleagues [4] proposed a long short-term memory (LSTM) for forecasting network traffic which operates as a nonlinear system. They explore how autocorrelation in LSTM and Deep Neural Networks (DNN) could improve the accuracy of network traffic prediction. Although they conclude that dataset size is a requirement for accuracy, they have not considered data packet size as an input feature for the prediction algorithm. On the other hand, JosNet has made use of a linear regression model to predict data packet size.
To improve the accuracy of multi-path routing in WSN, Guo et al., [30] proposed a multi-path routing scheme based on an evaluation algorithm through comparative experiments. One of the methods employed is the expansion method, which involves inserting a sample point between the two discrete sample points and , and then performing interpolation to predict the best routing path in a mesh network. Morales et al., [31] proposed the use of end-to-end deep learning strategies to approach the problem of multivariate time series predictions in WSNs in a dual prediction scheme to reduce the amount of transmitted data and therefore mitigate the consumption of energy. WSN performance can be improved by developing a cluster-based routing protocol, which involves probability calculations for cluster head formation [32]. There are other related publications [33,34] that support a combination of prediction techniques and algorithms for evaluating or enhancing the QoS, network performance in high-speed routing and minimizing latency time in WSNs.
2.4. Understanding Network Prediction Models
Prediction models, also known as predictive models, are algorithms or statistical techniques that are used to make predictions or forecasts about future events or outcomes based on available data and patterns [35]. These models are designed to analyze historical data, identify patterns or relationships, and then use that information to make predictions about future events. To explain prediction and the uniqueness of the approach adopted in this research, it is vital to elaborate on some established prediction models, algorithms, and selection criteria to guide the approach of this research.
- Linear Interpolation Model: is a method used to estimate a value within a range based on the known values at the endpoints of that range. It involves constructing a straight line between two known data points and using that line to approximate the value at an intermediate point. Linear interpolation assumes that the relationship between the data points is linear, meaning that the change in the dependent variable y is constant for each unit change in the independent variable x. It provides a straightforward and relatively accurate approximation when the data points are well-behaved and follow a linear trend [36,37,38].
Mathematically, linear interpolation can be expressed using the equation of a straight line. Suppose we have two points, and , with The equation of the line passing through these two points is given by:
where y is the estimated value at a given point x. This equation represents a linear relationship between the independent variable x and the dependent variable y.
To interpolate a value, we substitute the desired value of x into the equation and solve for y. This calculation involves finding the slope of the line and multiplying it by the difference between the desired x-value and x1. Then, we add this product to y1 to obtain the estimated y-value at the desired x-coordinate.
- B.
- Linear Extrapolation Model: is a mathematical technique used to estimate values beyond the range of observed data points by assuming a linear relationship between the data points. In other words, it extends a straight line or linear trend that fits the observed data points into the future or past [39]. Consider a set of data points ( ), where i = 1, 2, …, n. These data points are assumed to lie along a linear trend, and we want to predict the value of y at some point x beyond the range of our data. The linear extrapolation model can be expressed using the equation of a straight line: , where y is the predicted value, x is the value at which we want to make the prediction, m is the slope of the line, and b is the y-intercept of the line [40,41,42].
To perform linear extrapolation, we first need to calculate the slope (m) and y-intercept (b) of the line that best fits the observed data points (, ). To calculate the slope (m), we can use the following formula:
The value of the slope (m) and y-intercept (b) are then used to predict the value of y for any value of x that lies beyond the range of our observed data. The linear extrapolation formula is: , where is the predicted value of y for the given value of x, and x is the value at which we want to make the prediction.
- C.
- Univariate Linear Regression Model: is a statistical technique used for modelling the relationship between a single independent variable (x), and a dependent variable (y) [43]. The goal is to find a linear equation that best fits the data. A univariate linear regression is represented using the expressions:
2.5. Comparison: Interpolation, Extrapolation and Machine Learning for Predictions
The subject of interpolation, intrapolation and extrapolation are not machine learning models but are fundamental in various fields of machine learning, deep learning, and artificial intelligence. Furthermore, the majority of machine learning prediction models are trained using interpolation, intrapolation and extrapolation statistical analysis to pinpoint values that may not be accurately captured using other techniques such as random forest or support vector machine [48]. A practical application of both approaches to enhance approximation in support vector machine (SVM) by An et al. [49] shows a relationship to machine learning.
In a broader context of data analysis and prediction; interpolation and extrapolation are seen as simpler forms of prediction rather than machine learning itself because machine learning represents a more advanced and versatile approach to prediction but shares some connections to the former in: (i) data prediction (ii) algorithmic approaches (iii) handling complex relationships (iv) data-driven decision making (v) handling noisy data [50]. While interpolation and extrapolation are specific techniques for making predictions based on data, machine learning includes these and many other methods to build models that can learn from data and make predictions or decisions.
JosNet makes use of the recorded dataset captured during communication and analyses the data before utilizing the values to provide the routing table with predictions necessary to enhance network performance and reduce end-to-end latency time. An increase in the scale of data captured results in an increase in the accuracy of the prediction provided—this is a form of training and learning.
3. Development Process
The methodology or development process applied for this research is a mixture of dedicated approaches: experimental, analytical, and network performance analysis, which are all aligned towards specific research objectives to ensure a reliable outcome.
- Experimental Approach: Involves collection of data through experiment [51,52]. The experimental method aligns with RO1 and RO2. At this stage of the research, a rigorous amount of time was spent capturing data (end-to-end latency time and data packet size) from the experimental hardware setup detailed in Section 3.1 below, and the data collected is then used for analysis and training the prediction model discussed in Section 3.4 and Section 4.1. The experimental approach also involves setting up different network connection pairs to ensure a functional routing schedule while maintaining the interoperability of heterogeneous WSNs.
- Analytical Approach: Involves the use of computational or mathematical approaches to analyze data and then the data is used to develop a model [53,54]. The analytical approach aligns with RO3 and RO4 which are designed to provide insight into data packet behavior and to analyze and evaluate the level of accuracy, respectively. The use of interpolation, extrapolation, univariate regression, and statistical models and/or algorithms to evaluate the outcome or performance of JosNet predictions is part of the analytical method of this research.
- Network Performance Analysis: This method cuts across all the research objectives and involves careful analysis of the network performance metrics to identify network drawbacks and provide credible solutions [55].
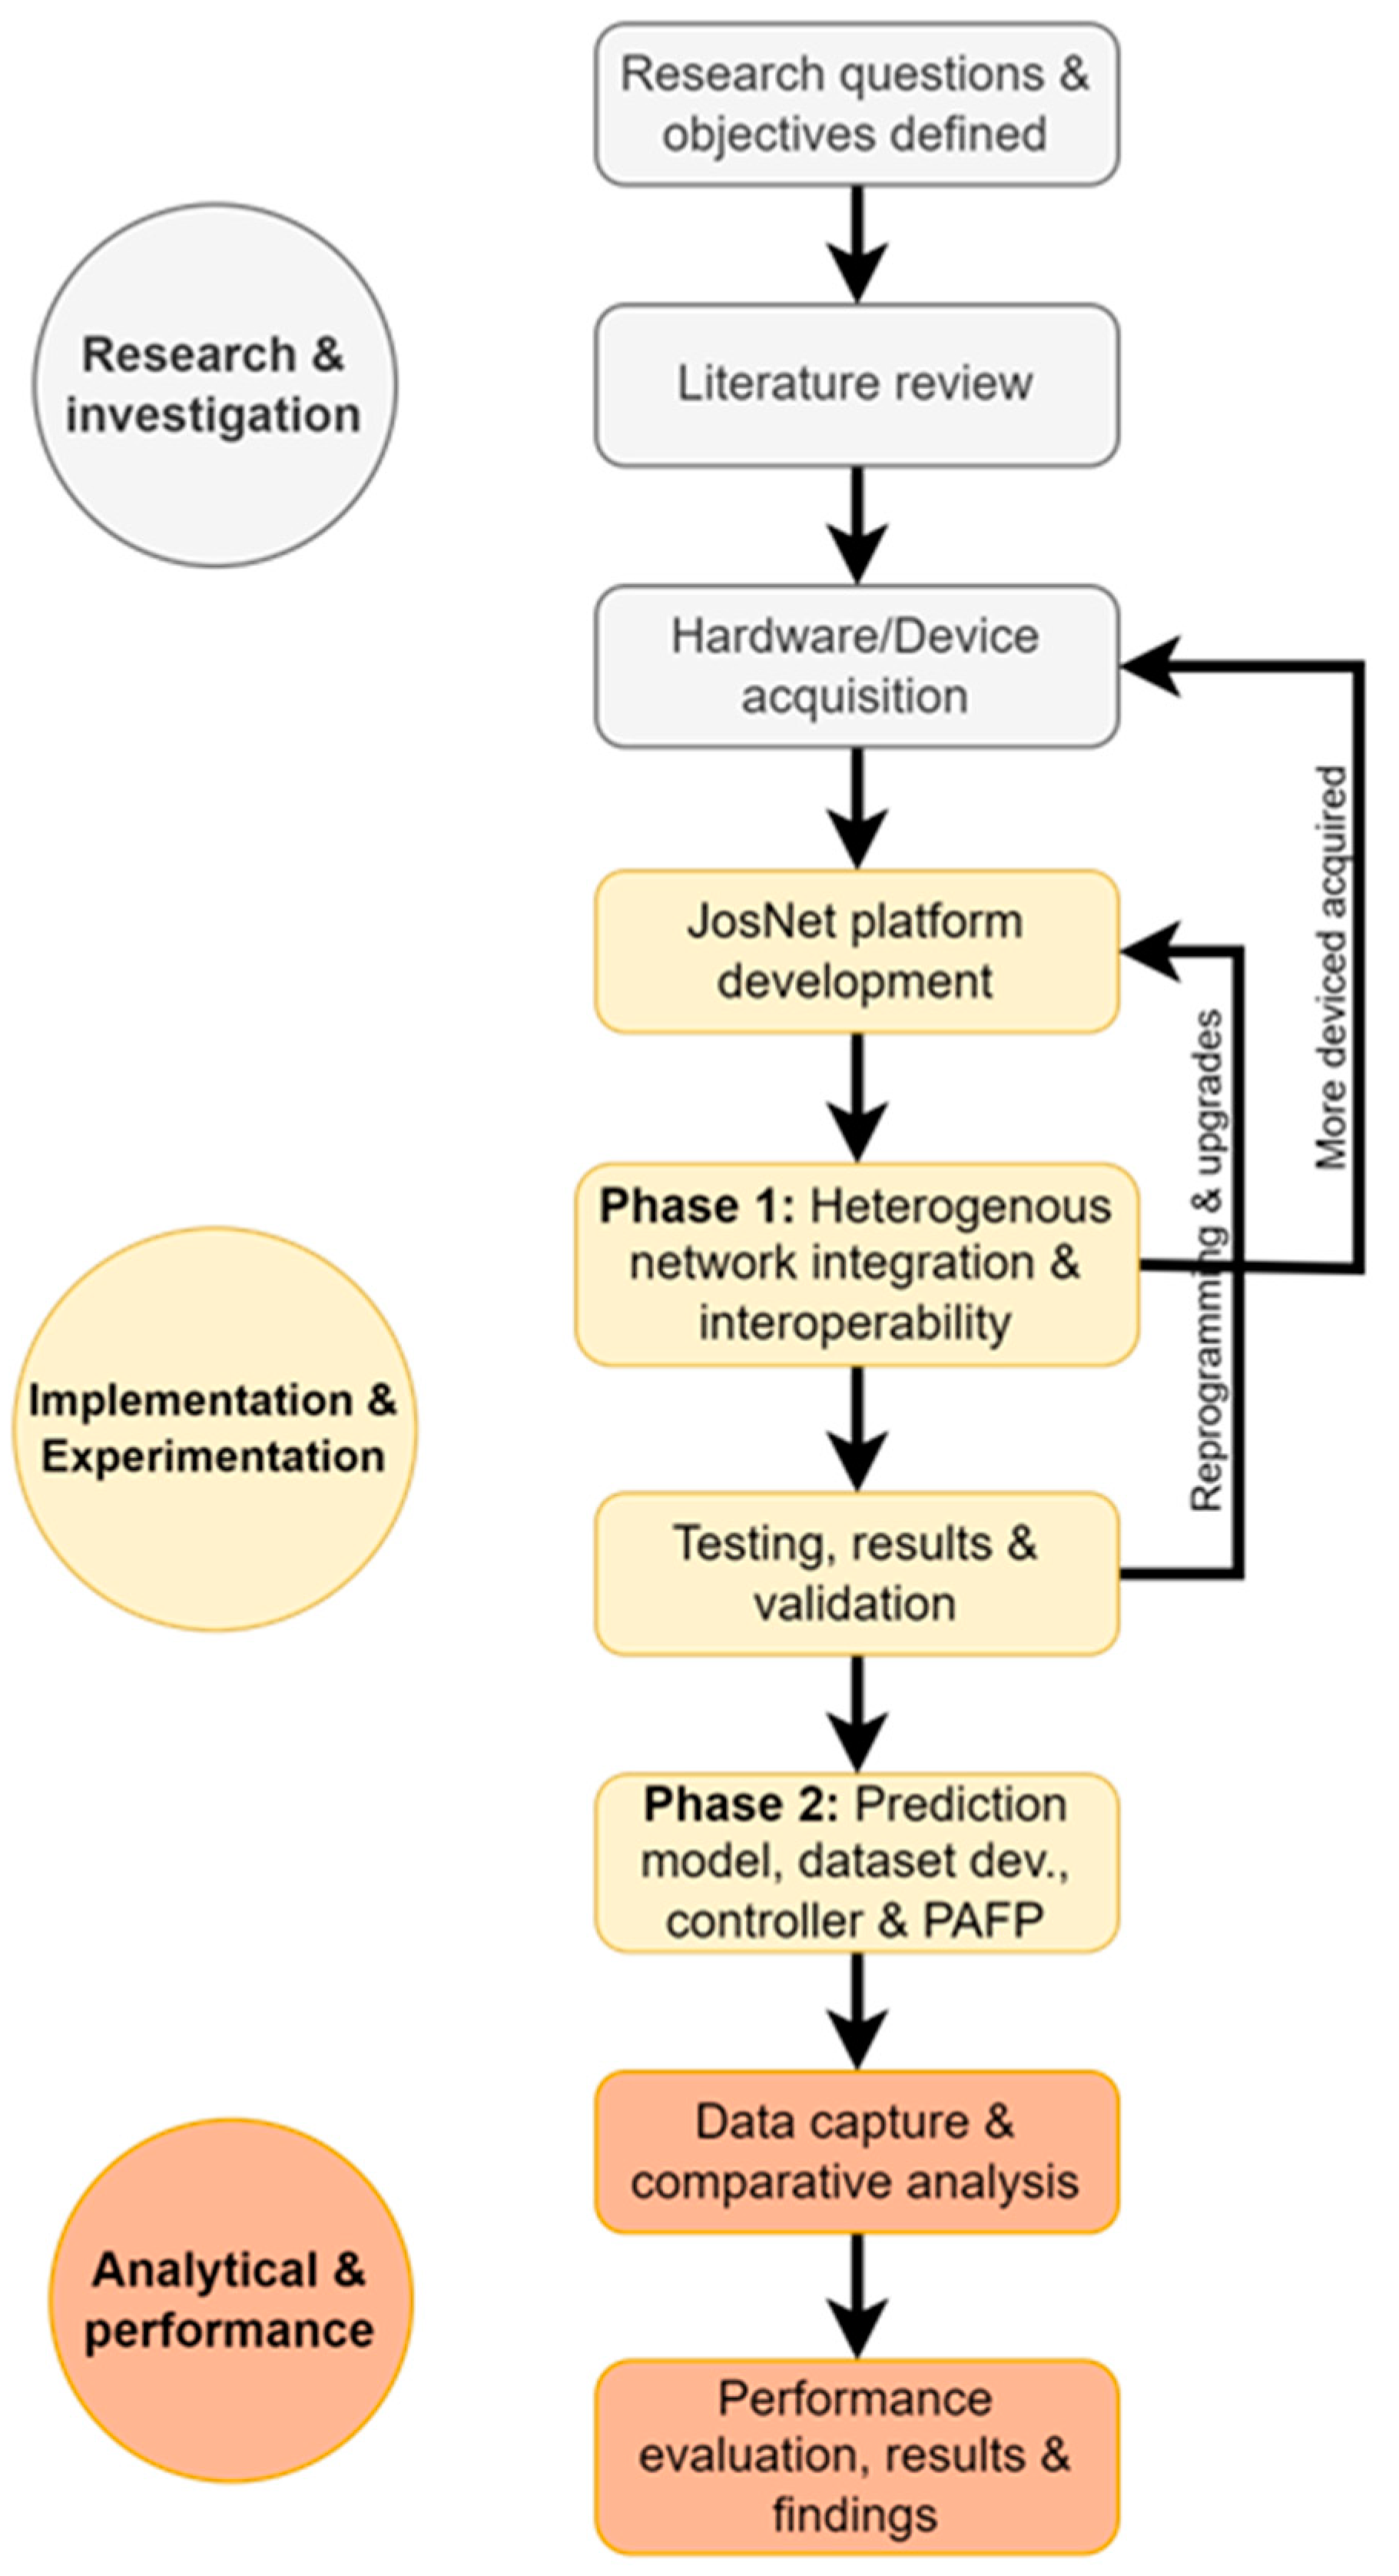
For a better understanding and readability of the developmental process of the work, a simplistic overview is provided in Figure 1 below. There are three key aspects of the study: (i) research and investigation, (ii) implementation and experimentation, and (iii) analytical and performance evaluation.
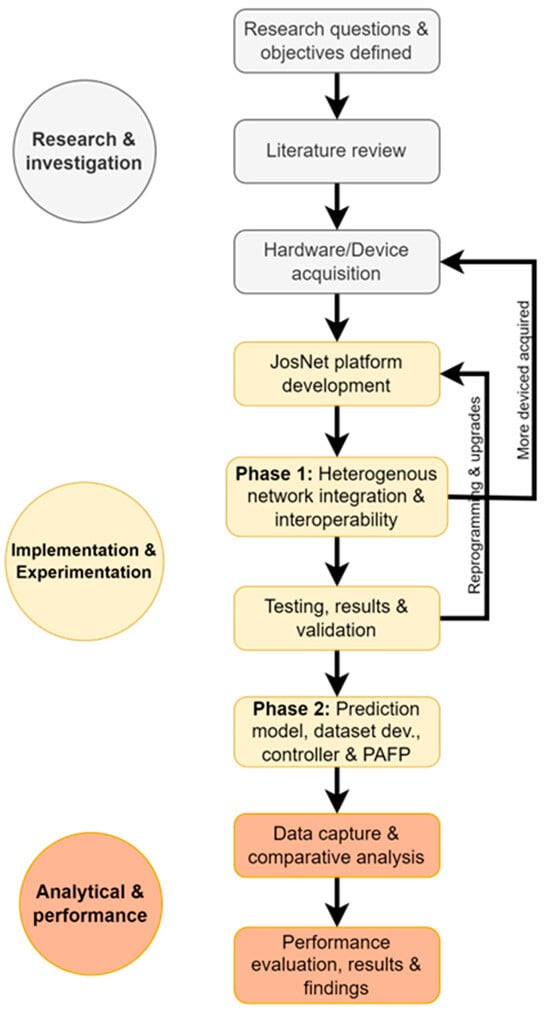
Figure 1.
Flow chart showing the major and sub-categories undertaken for the study.
- Research and Investigation:
- Research Questions and Objectives Defined: Here, existing gaps are identified, and the research scope and objectives are defined as discussed in Section 1.
- Literature Review: Detailed study on what has been done, existing work, understanding the architecture and the availability of the source code for each network protocol implemented in this study.
- Hardware Acquisition: This process requires careful consideration of the specific parameters on each development board to ensure compatibility with the low-rate and low-power wireless network protocols or expected programming configuration and resources.
- Implementation and Experimentation: This stage required a combination of software and hardware technical trial, testing and experimentation and addressing different software and hardware compatibility concerns as the project progresses.
- JosNet Platform Development: Programming of the software integration platform using the development source code for each network technology (Bluetooth LE, Zigbee network protocol, Thread, and WirelessHART) and creating an interpretation mapping for each network.
- Phase 1: Heterogeneous Network Integration and Interoperability: Further details on this point can be found in [3].
- Testing, Results and Validation: For phase 1, the parameters tested are primary throughout and end-to-end latency time. To ensure communication is up to standard, dedicated hardware devices are further acquired for various reasons.
- Phase 2: Prediction Model, Dataset Development, JosNet Controller and PAFP: As part of the implementation and experimentation, phase 2 focuses on data packet size and end-to-end latency time predictions as described in Section 4 of this paper. Also, ensuring that timestamps (such as arrival time, destination and source network, and every required parameter) are captured and stored in a local database and then used by the model for prediction and routing is critical to this study—further discussion is provided in Section 3.2.2 and Section 4 of this paper.
- Analytical and Performance Evaluation: After successful implementation, collecting, storing and evaluating the data is vital.
- Data capture and comparative analysis: The data is collected over a long period of time over 400 times for each connection pair. The average value is then used to perform interpolation or extrapolation. Section 4.2 and Section 4.3 discuss the comparative analysis using R-square and other statistical correlations.
- Performance evaluation, results, and findings: Finally, we provide evidential discussions on the outcome and benefits of the findings from the study in Section 4.4 and Section 5.
3.1. Hardware
For JosNet development and evaluation, a number of hardware devices have been acquired to represent each network protocol, Bluetooth LE, Zigbee, Thread network, and WirelessHART, as shown in Section 3.2. This research uses real implementation to reflect a real-world use of the platform for prediction and not simulations.
- i.
- For Bluetooth LE, the Core51822 module [56] has been used because it provides flexibility for developers and multiple connection interfaces.
- ii.
- Zigbee network in JosNet, we have utilized the CC2530 Zigbee Module and the development ZB502 board. Both are developed by Waveshare and offer flexible connectivity options for the Zigbee network protocol.
- iii.
- Thread network is represented using a low-cost IoT device, the nRF52840_MDK IoT development kit from Makerdiary [57]. It is versatile and compatible with a wide range of network protocols.
- iv.
- WirelessHART network, the Centero WiHART module [58] which follows the IEC62591 industrial IoT standard has been used to test the WirelessHART network in JosNet. However, the results for the WirelessHART network for connected pairs in Section 4 are not discussed in this research.
All hardware representing a network protocol is physically connected via a USB Cable to the PC (JosNet station), where data is stored and managed for prediction and other purposes. This paper will not go into a detailed discussion on the interoperability connectivity of multi-network pairs and how data packets are exchanged, as the full details with practical illustrations have been published in a separate article [3]. The focus of this paper remains to minimize end-to-end latency time through prediction of data packet.
3.2. Process Flow of JosNet Brokerage Intergration for Multi-Network Communication
JosNet plays the role of a brokerage or gateway that translates data and packets of the sending network protocol to the receiving network protocol and vice versa. Not only does JosNet act as a brokerage, it also collects information about network communication (e.g., network speed, data loss, delay, sender and receiver address, packet timing, network baud rate, COM port, etc), subsequently displaying this information on a console display as well as graphically representing this information in real-time.
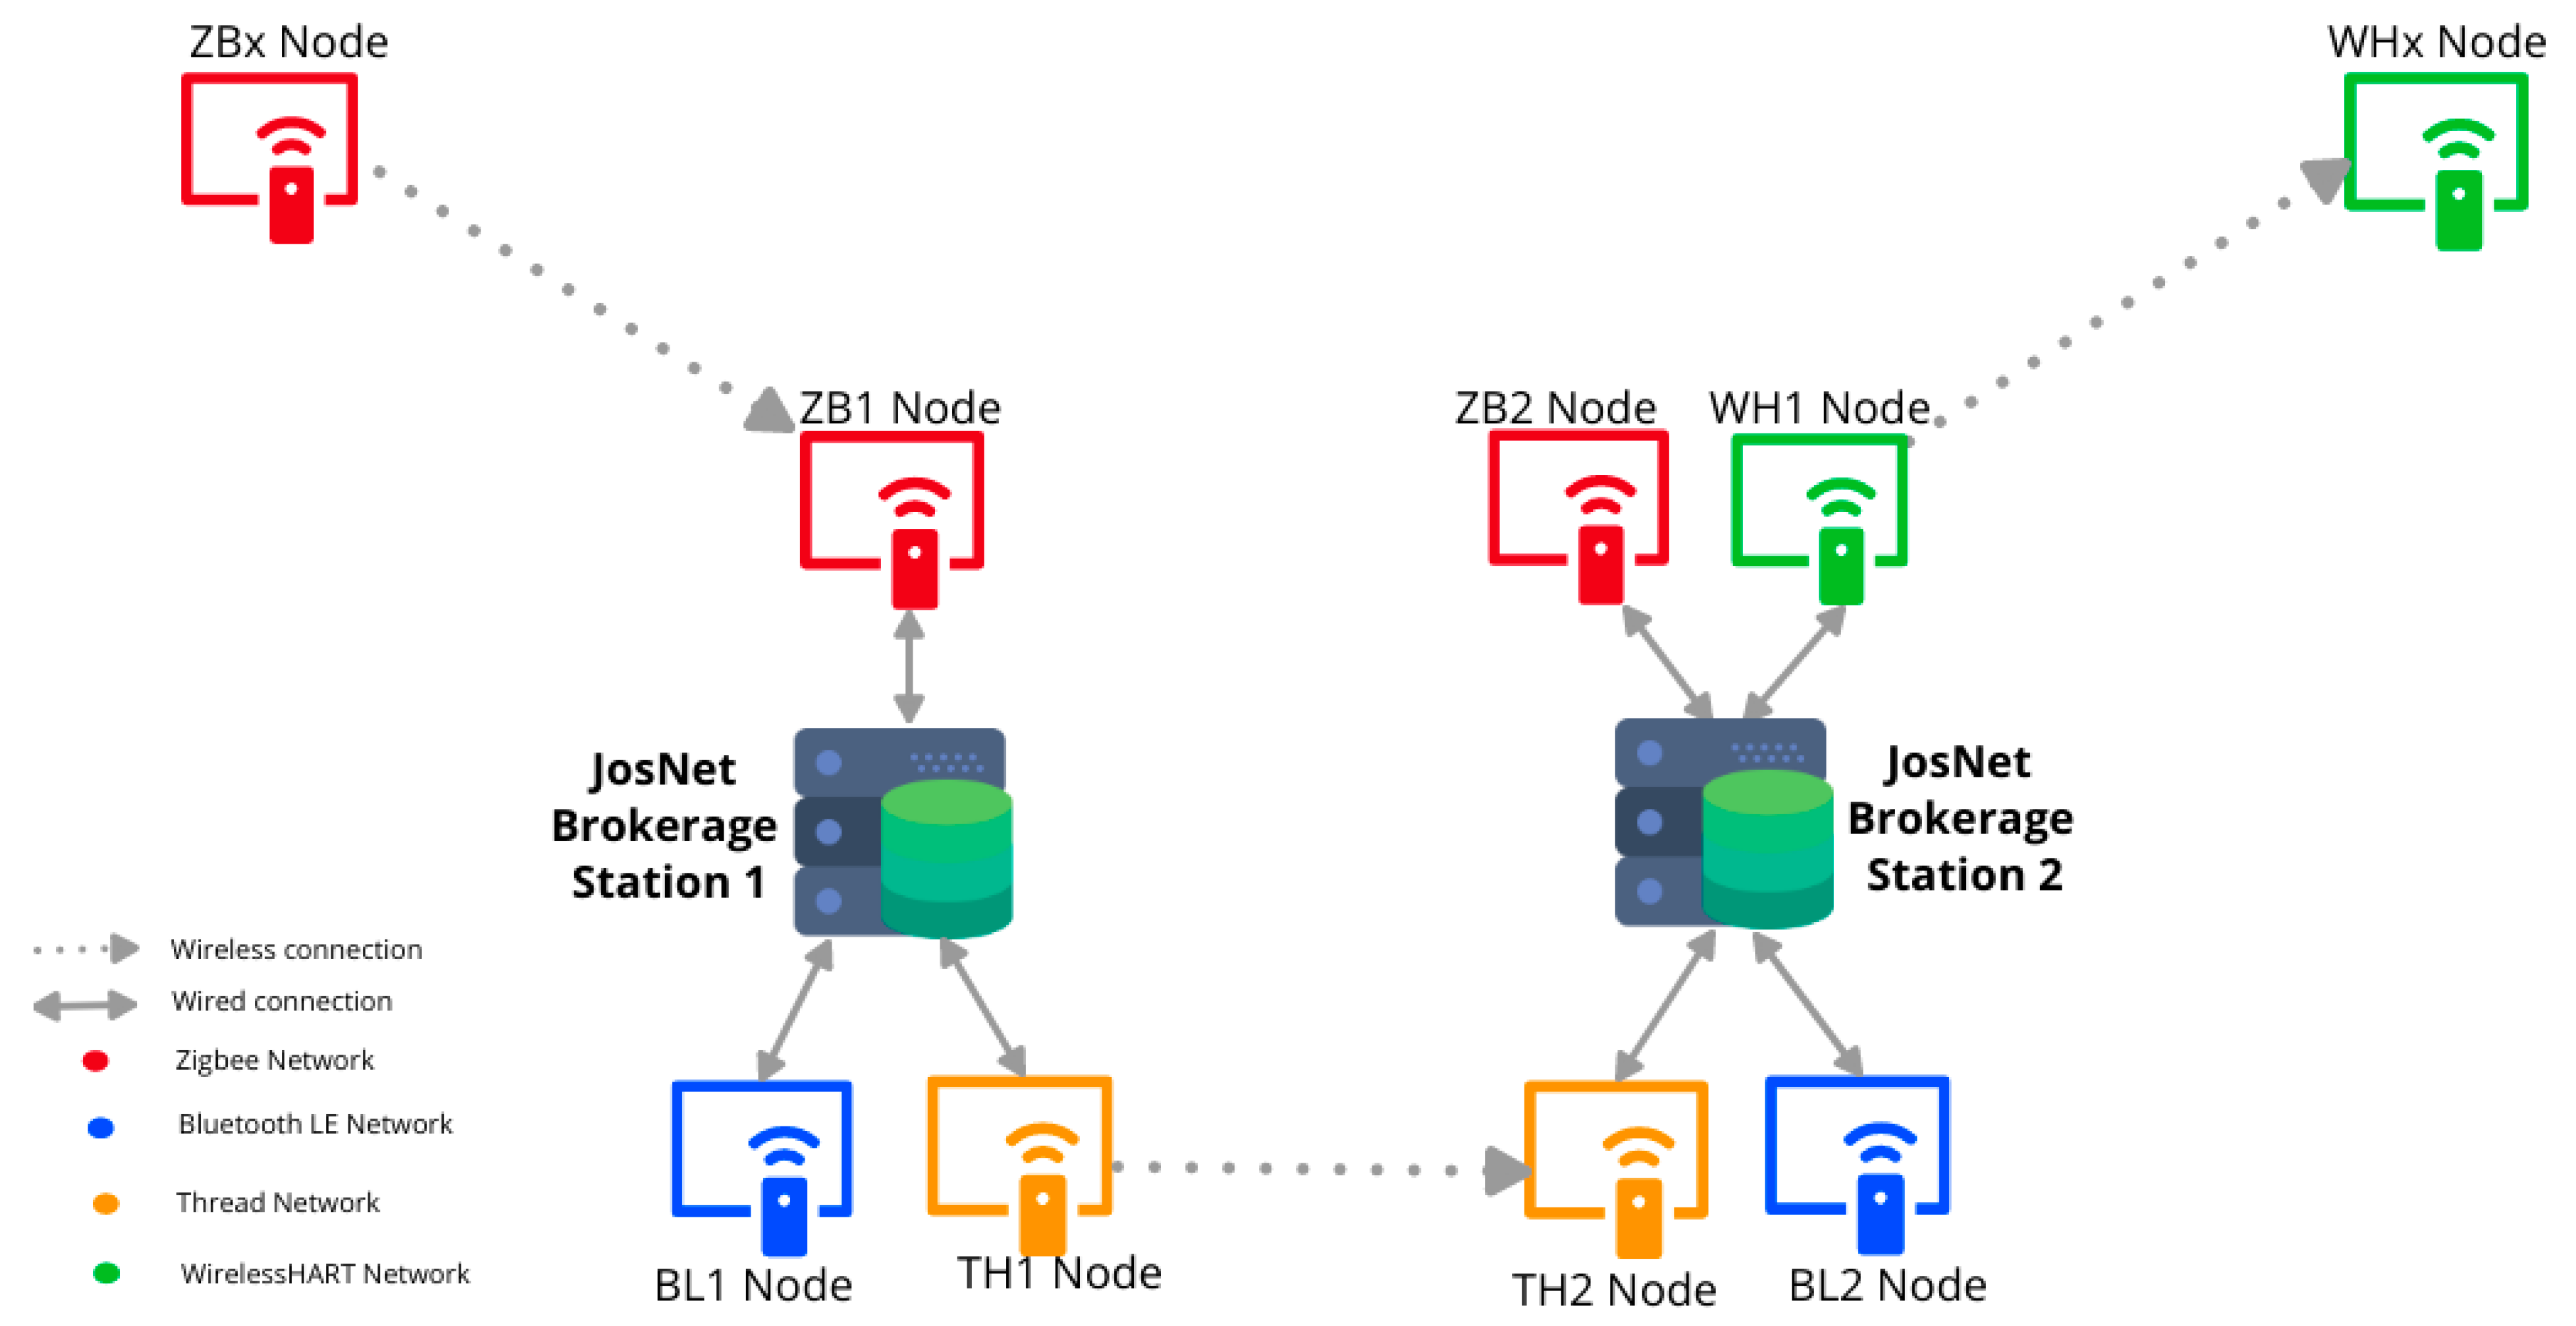
Figure 2 presents an example of a Zigbee device (source) sending a message or data packet using JosNet brokerage to a WirelessHART device (destination) about 60 m away.
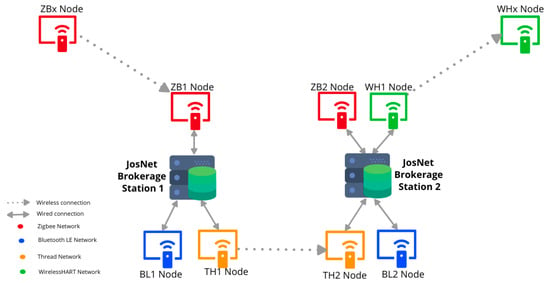
Figure 2.
Schematic Architecture Diagram, showing the step-by-step process in JosNet from Source to Destination.
3.2.1. Typical Devices on the Network Setup Are
- (a)
- ZBx represents a Zigbee external device, connected wirelessly to ZB1.
- (b)
- ZB1, BL1, and TH1 represent Zigbee node 1, Bluetooth LE node 1, and Thread node 1, respectively, all attached via USB to JosNet brokerage station 1.
- (c)
- ZB2, BL2, TH2, and WH1 represent Zigbee node 1, Bluetooth LE node 2, Thread node 2, and WirelessHART node 1, respectively, all attached via USB to JosNet Brokerage station 2.
- (d)
- WHx represents a WirelessHART external device, connected wirelessly to WH1.
3.2.2. Process Flow for Multi-Network Data Packet Exchange and Integration
The process flow of activity between different network protocols within JosNet from the initiation at the source node to arrival at the destination node is described below:
- ZBx initiates a request after connecting to the nearest Zigbee Node (ZB1) attached to a JosNet Brokerage Station (on this occasion, station 1) about 20 m away. Initiating a request requires selecting the destination address and clicking “send”. The list of external devices is available for selection, hence, devices that are not currently connected or hidden cannot be selected.
- ZB1 receives incoming packet messages and hands them over to JosNet at the Packet Arrival and Forwarding Point (PAFP). Note that network communications maintain the original network standard, these are not altered in anyway, however, the PAFP is designed to receive data packet, extract the payload information of the sender & intending destination, pass the payload information to the brokerage station controller. The PAFP receives a “modified version” of the same packet and then forwards it to the required destination node.
- At JosNet Brokerage Station 1, the controller and routing table receives data packet from the PAFP, then processes various information/commands attached within the packet (e.g., source protocol, destination address, destination protocol). The JosNet Station controller also reads the routing table via the Serial Port Manager (SPM) for the destination device, an error message is sent if the destination cannot be found on other stations. If the network exists in the routing table and the “prediction model” is activated, the routing table uses this to modify the payload and provide a routing map, at the same time attaching a readable command for the next node (TH1). The appropriate COM port and network protocol are selected and handed over for the best routing (in this case TH1 is selected). All COM ports receive the message if “Send Broadcast” is activated from the source (ZBx).
- TH1 receives the packets from JosNet and forwards them to TH2. Again, the Thread network communication maintains the original network standard, and is not altered in anyway.
- TH2 hands over the received packets to JosNet brokerage station 2 at the PAFP.
- JosNet Brokerage Station 2 processes the packet again as described in (iii) above for information (e.g., routing map or tag prediction model, from the previous station). When a tag is identified, the PAFP simply forwards it as described on the routing map (in this case, WH1 receives this packet).
- WH1 then forwards the message to WHx which is the intended destination connected wirelessly to the network.
- WHx receives the message packet from the source device (ZBx) in less than 150 milliseconds.
- Integration between Zigbee and WirelessHART is complete.
Note that JosNet Brokerage Station 1 does not have a WirelessHART node and that the data packet is routed through a Thread (TH1 Node) wirelessly to another Thread node (TH2 Node) in Station 2, as shown in Figure 2. For this example, any of the 3 networks (ZB, BL and TH) attached to Station 1 can route the data packet to JosNet Brokerage Station 2.
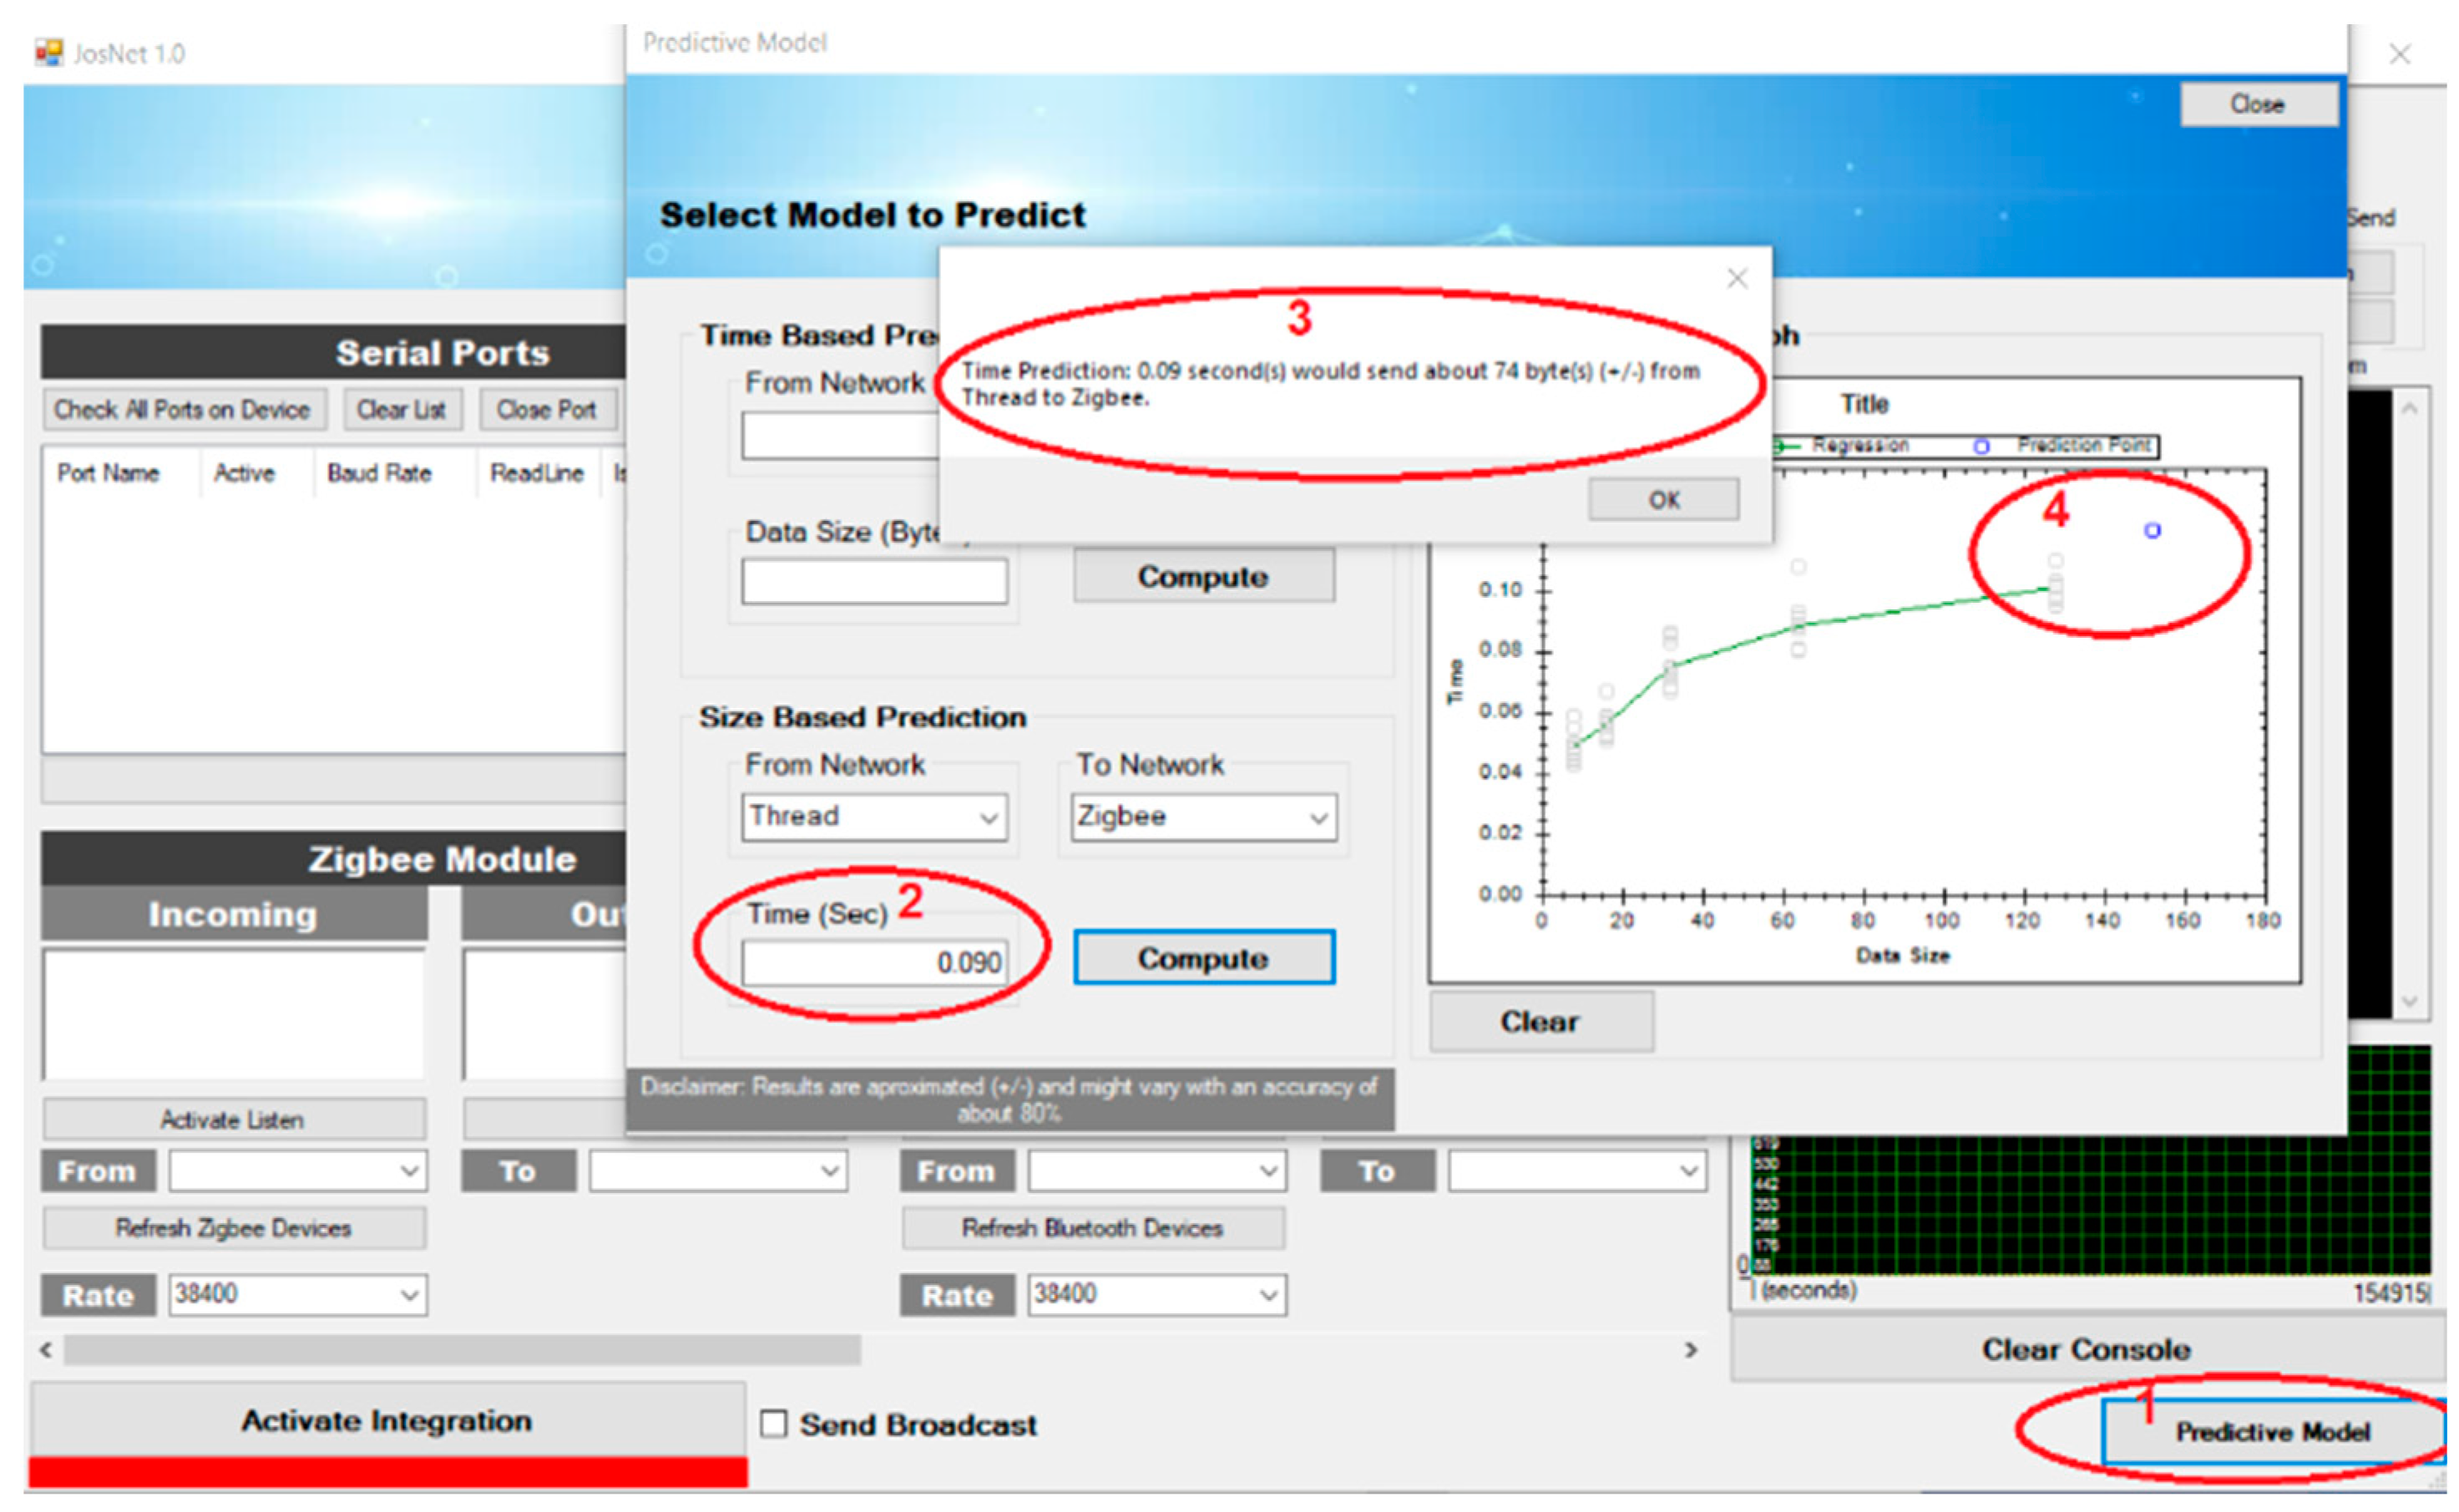
The software application is also designed to allow a user to manually check predictions for end-to-end latency time (time-based prediction) and data packet size (data-based prediction) by selecting the appropriate network connection pair—as shown in Point 2 of Figure 3, the prediction value is displayed (Point 3), and a prediction point/mark is visually represented (Point 4).
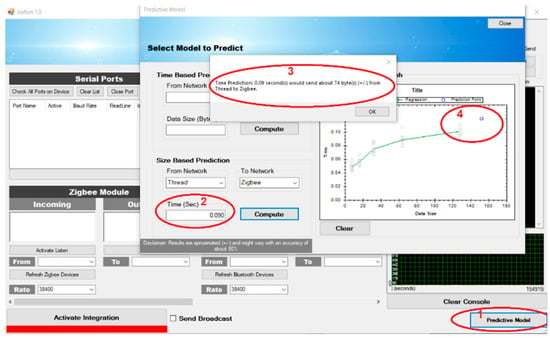
Figure 3.
Steps to implement the data size prediction in JosNet.
3.3. Time Synchronizing between Devices
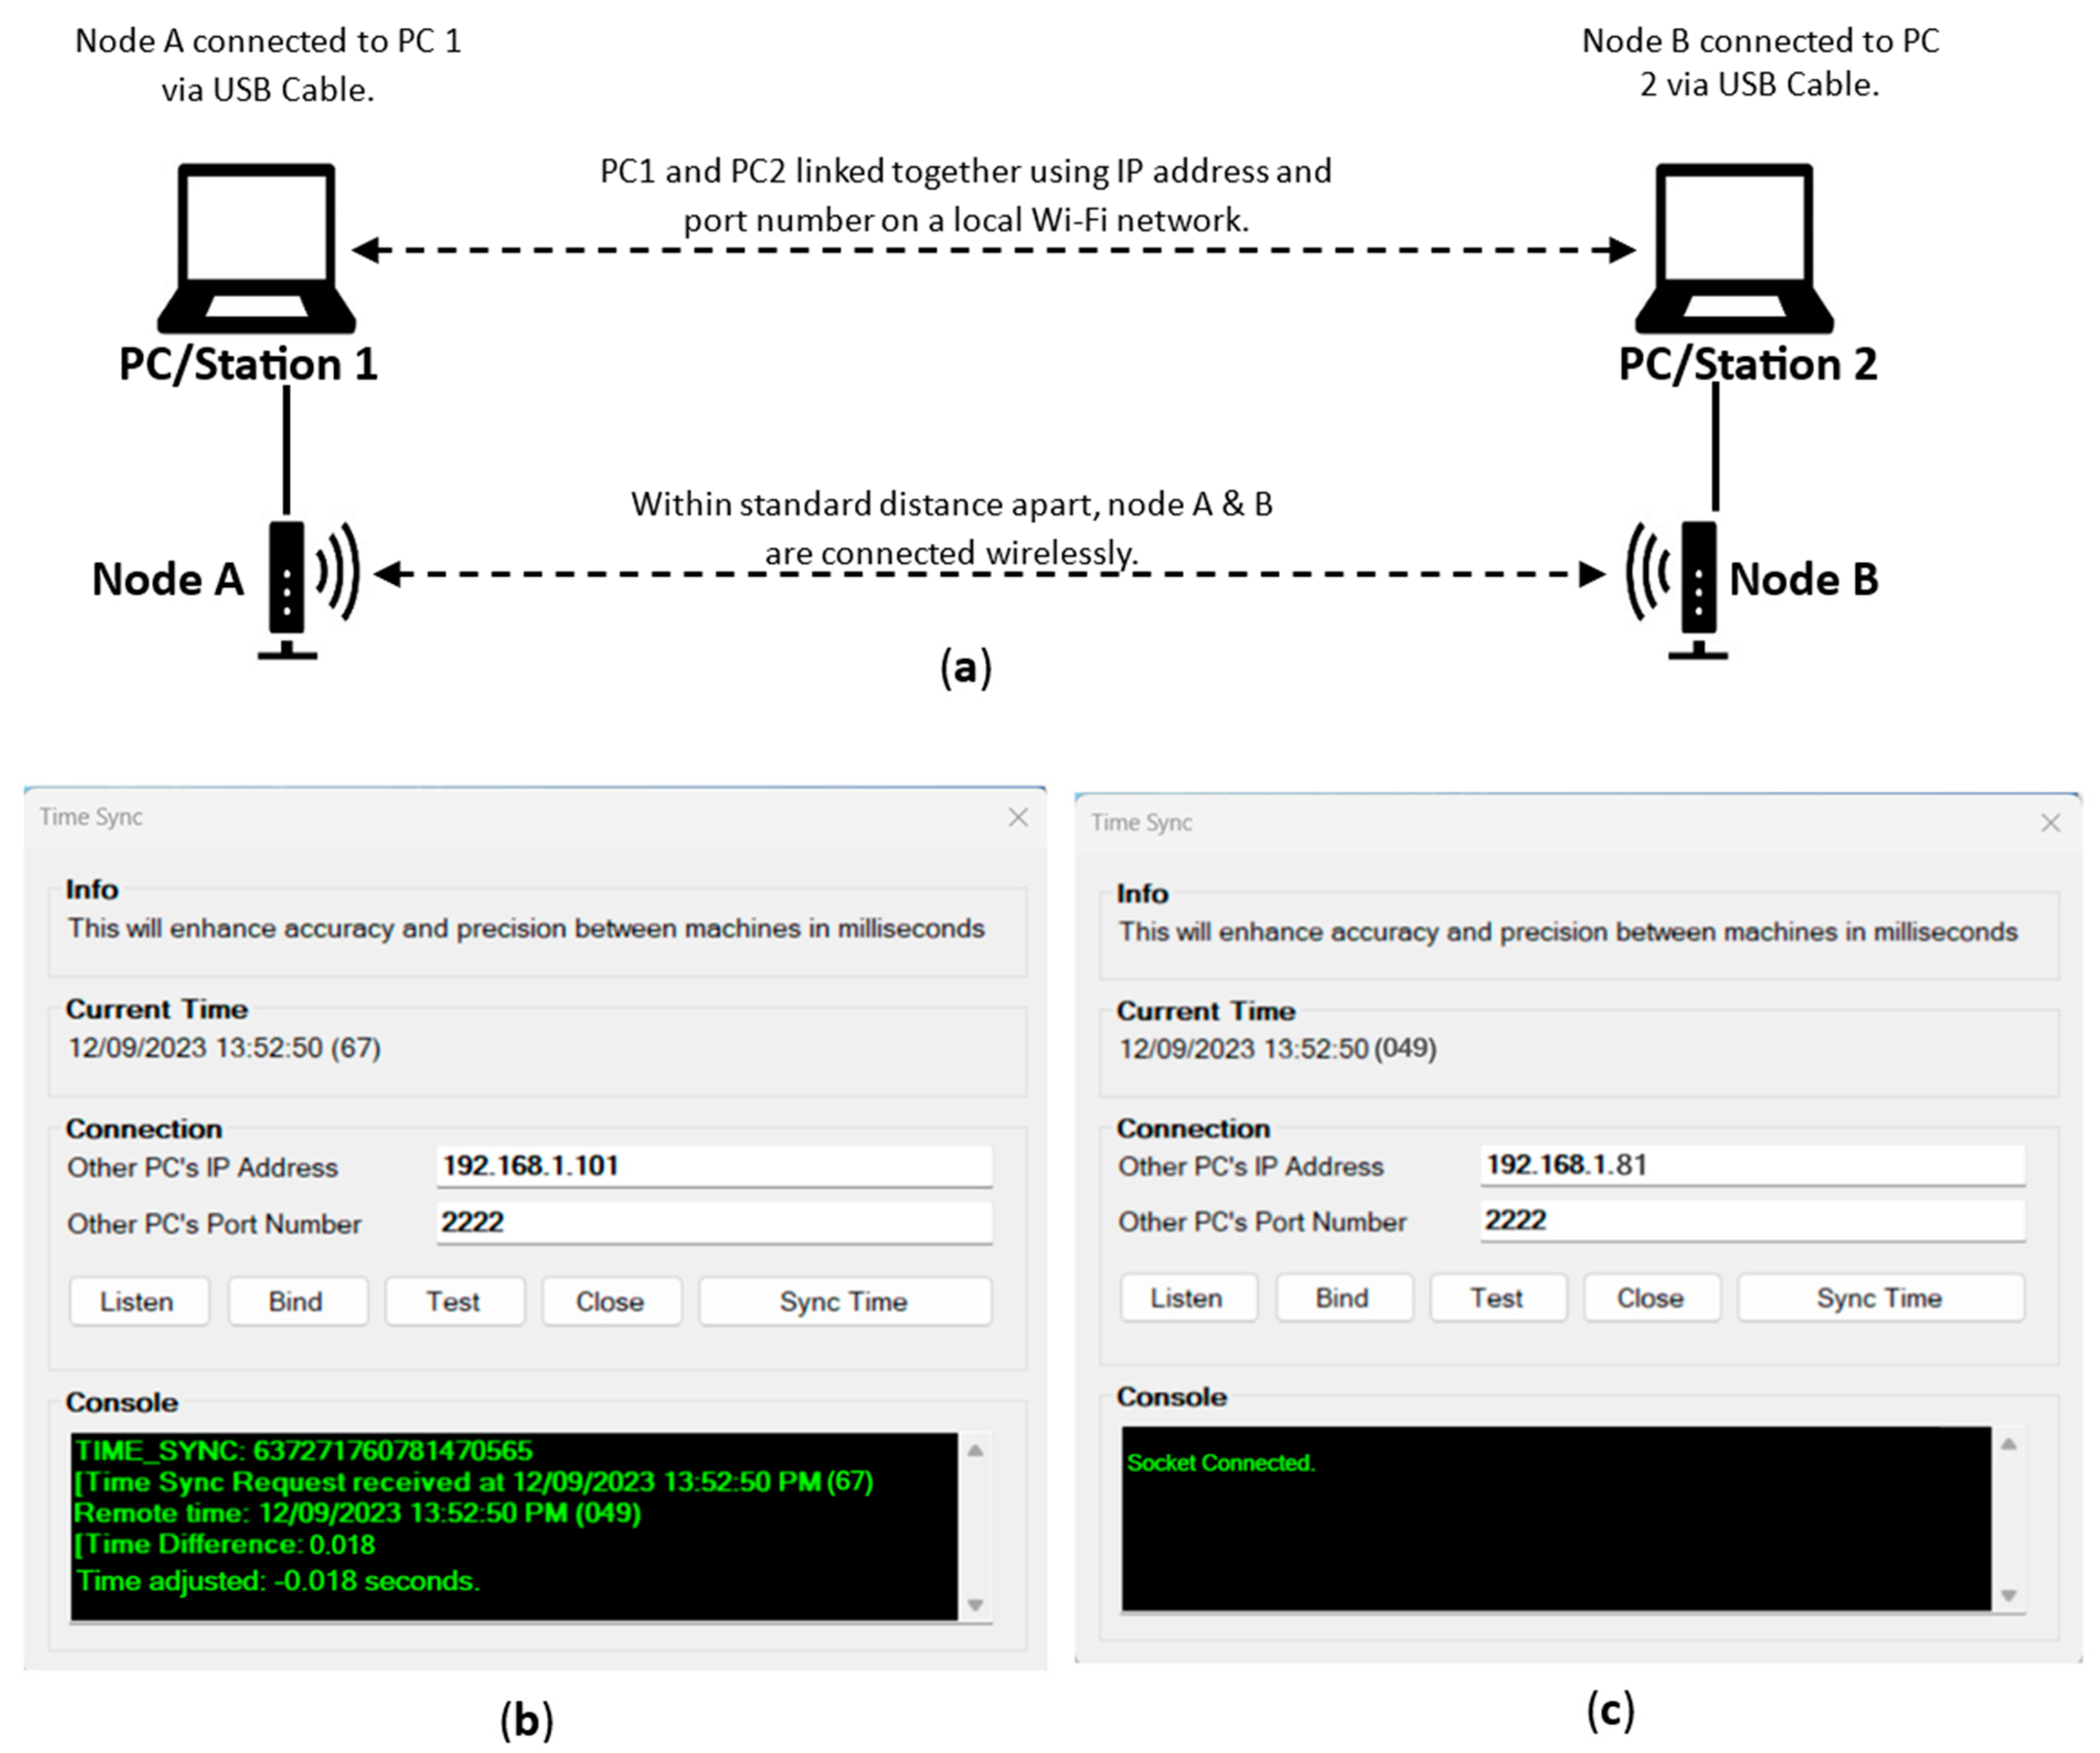
To achieve the research objectives, it is imperative to capture every significant event accurately and precisely, including end-to-end latency time registered on each network node, the routing map, data packet size, source and destination network, source and destination ID, source and destination MAC addresses, etc. Time synchronization will ensure all devices connected to the network operate using a single clock to the nearest nanosecond and this is done by assigning a local client or server to one JosNet Station device from which other stations can capture their time, thereby capturing and recording the actual time difference between nodes. Time sync operates using the local IP address and port number (see Figure 4) of the PCs while connected to the same Wi-Fi. The listening device is assigned the client role (primary time holder) while the binding device is assigned the server role, it captures time from the client. The “frmTimeSync.cs” is the program class that handles time synchronization on the JosNet code, which scans for the entered IP address, calculates the response time between its own PC and remote PC over the local Wi-Fi network, and finally updates its own time based on detected time difference.
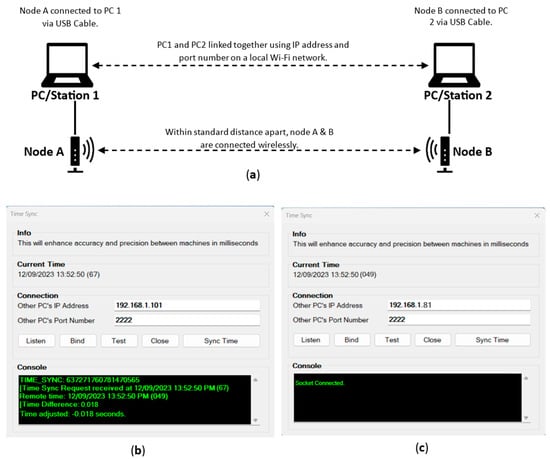
Figure 4.
Shows (a) Time Synchronization setup, (b) JosNet binding device (c) Listening Client as the host.
For better understanding, the protocol used for time sync is TCP/IP via raw socket such that the host computer uses “Listen” (shown in Figure 4b) to scan for open ports while the server PC uses “Bind” (shown in Figure 4c) to initiate a connection and connect to the socket. Once connected, the host PC displays “Socket connected”. Finally, “Sync time” is used to capture the time from the host computer. This is possible if both computers are running JosNet as Admin and have no firewall/anti-virus restrictions, to allow automatic clock adjustment. JosNet uses the Windows “kernel32.dll” library that manages the operating system runtime interop services to implement time sync.
Figure 4b,c shows the time difference as 18 milliseconds between node A and node B captured using JosNet Time Sync, the requesting PC’s time is adjusted to match the host PC.
3.4. Prediction Model
JosNet brokerage accommodates multiple modules working collectively for effective operation and management of heterogenous WSNs within the application [3]. These are: Packet Arrival and Forwarding Point (PAFP), Controller, Network Information, Resource, and Data and Integration. For the purpose of this research, the focus is on the Resource Module which has two elements: the prediction model and new network.
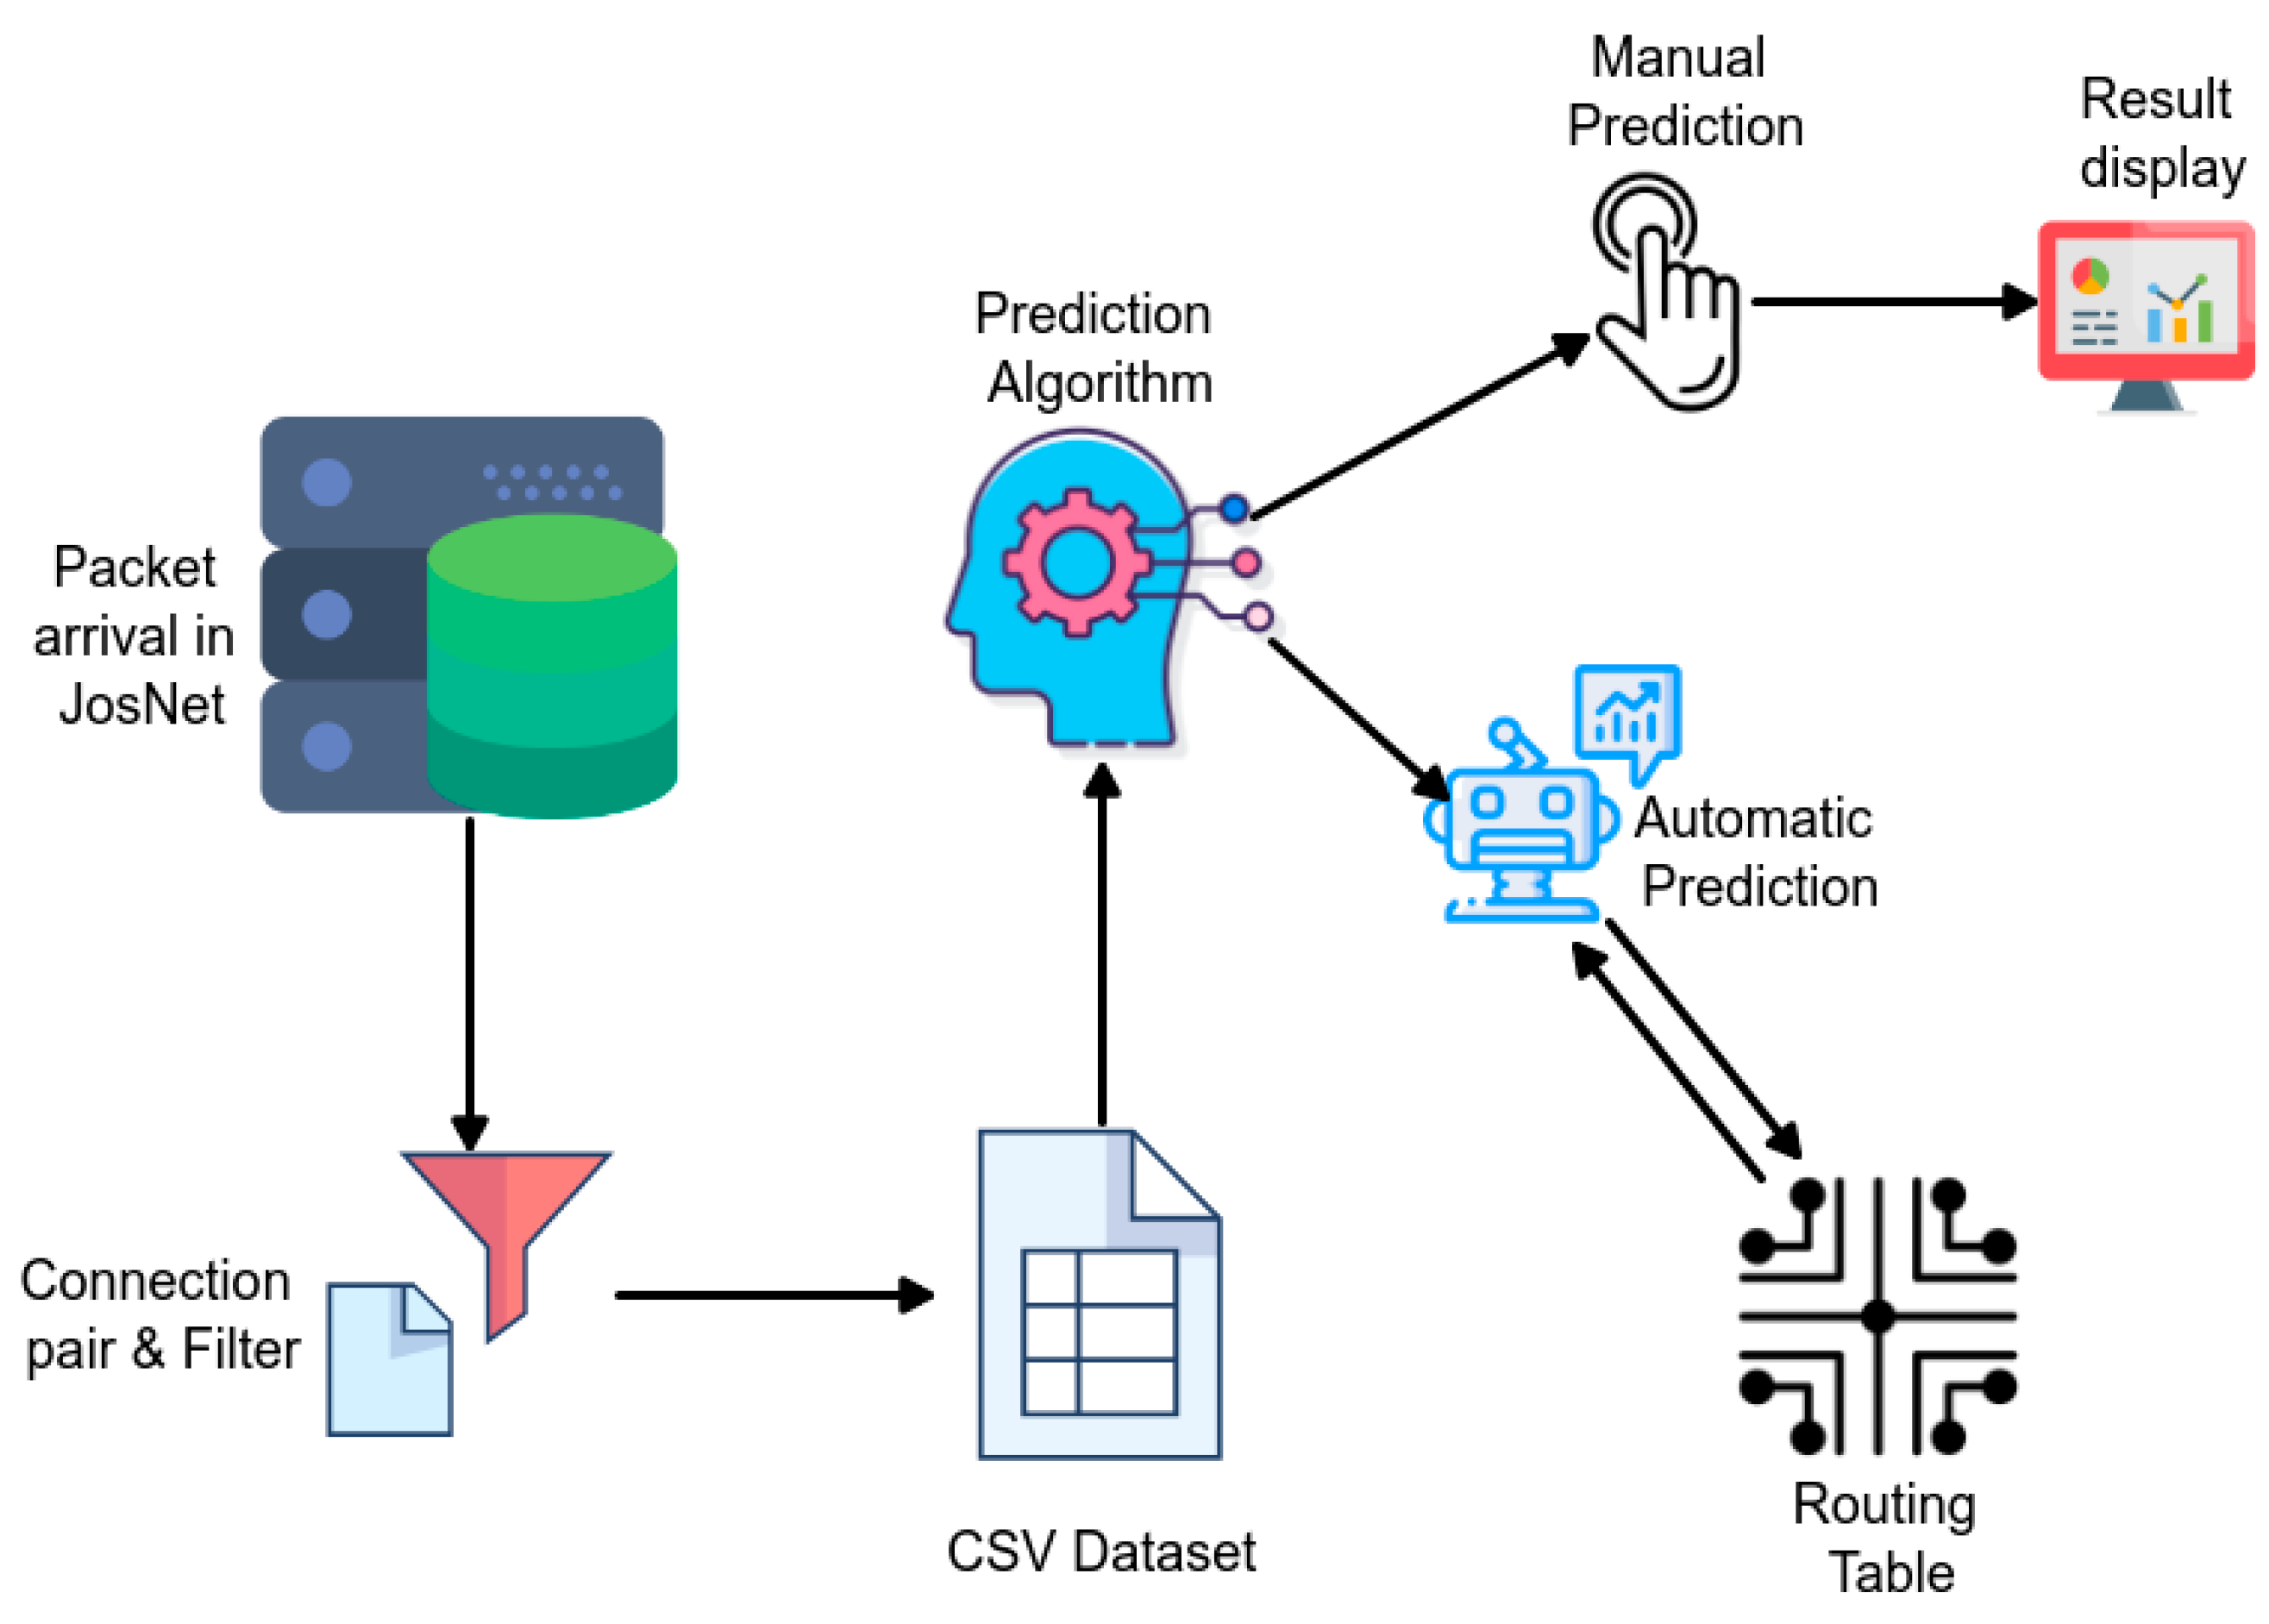
The prediction model could be manually activated through the JosNet app (see Figure 3) or automatically triggered through the routing table. The following steps explain the core details involved in the prediction process (see Figure 5).
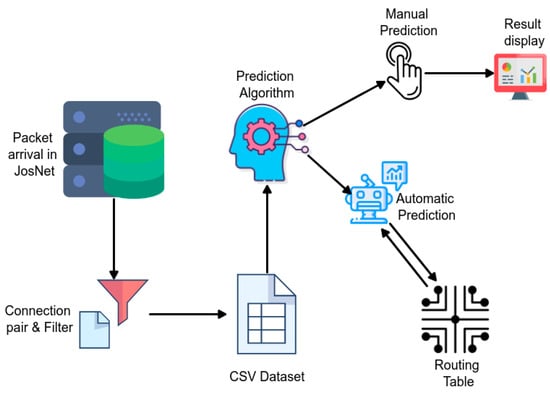
Figure 5.
Showing the activity flow diagram of the prediction model.
- (a)
- At Devices: Communication is initiated at the hardware devices through any available network protocol, and this occurs as described in Section 3.2, through the JosNet Brokerage Station.
- (b)
- At JosNet: There is a list of information being captured by JosNet for every communication. This includes source and destination network, source and destination device ID, COM port, baud rate, packet size, packet departure time, etc. This is essential for prediction and network routing. Currently, the source and destination network name (ZB, BL, TH, WH), actual (initial) data size, and time are the only input features for the prediction model. At JosNet, the controller, which is considered JosNet’s brain, manages all the activities, links all the resources and processes required information and commands for each wireless network.
- (c)
- Network Pairing (Filter): Packets are filtered and arranged according to wireless network pair. For example, if the source network name is captured as ZB and the intended destination is also captured as ZB, this represents a Zigbee-Zigbee communication, therefore, all further details about the communication are booked for storage. This is vital because multiple networks are going through JosNet stations, details about each communication pair must be recorded accurately, and also avoid misleading the routing table.
- (d)
- Local Storage: For prediction, three parameters are captured and stored, these are: (i) data packet size, (ii) time at the source (when the “send” is triggered), and (iii) arrival time at the destination (when the last data packet arrives at destination). Points (ii) and (iii) are known as “end-to-end latency time” [59,60]. This is achieved by using the “EPPlus” library in the NuGet Package Manager of Visual Studio, which permits multiple inputs to be written into the same CSV Excel file. For easy retrieval, files are stored according to connection pair. This means that data for ZB-TH is stored separately from BL-BL or TH-BL, etc.
- (e)
- Prediction Algorithm (Manual or Automatic): Next, the prediction tool reads data from the stored file directory and performs calculations based on available data in the CSV file. Prediction can be triggered in two ways: (i) Manually—For results validation and authentication purposes, JosNet makes room for a manual prediction check, which can be done by selecting a wireless network pair followed by graphical display of data packet size (in bytes), and predicted time in the point marked “4” in Figure 3, and (ii) Automatically—Data packet arrival time can be requested by the routing table automatically during communication between protocols to facilitate easy access to destination node.
- (f)
- Displayed Result: For manual predictions, results are displayed showing the prediction value and followed by a point appearance in the prediction graph.
- (g)
- Routing Table: For large-scale implementation, which involves two or more JosNet stations, the routing table which is managed by the controller has the list of devices connected to the entire network, helping with data packet routing, and hopping across multiple devices. The knowledge of end-to-end data packet time provides the routing table with efficient network routing management and therefore can be requested or triggered automatically.
4. Implementation and Analysis
In this section, we present and discuss the experimental analysis, mathematical formulation, and results related to multi-network data speed prediction using JosNet to reduce end-to-end latency time and minimize data loss in WSN.
4.1. Prediction in JosNet
There is no justification for accumulating/storing data without making constructive and effective use of the data. One constructive and effective way to utilize the data generated from JosNet is to build and implement a prediction model for different connection types based on the previous outcome of such connections. For example, if a user or routing table intends to find the average time it takes to send any size of a data packet from Zigbee to Thread, the best and most reliable approach would be to look at existing recorded data, in this case, created by JosNet in CSV file format, which is a direct or accurate report of the communication between connected devices (if all bias factors remain constant). Alternatively, if the average end-to-end latency time for the requested data packet size has not been previously captured and stored, JosNet can provide a prediction time using the linear interpolation or extrapolation algorithm which offers around 98% accuracy (based on the R-Square value of the curve for ZB-TH) for this specific example. This means that values that do not already exist within the stored directory can achieve up to 99% prediction accuracy. Sufficient data is required to achieve higher accuracy that allows the system to apply relevant mathematical formulae or algorithms, making use of certain input features to draw an appropriate conclusion/prediction. A recent review from Lu and colleagues [61] states that accurate prediction models are data-driven while Wynants and colleagues [62] recommend conclusively that to have an accurate predictive model, there must be at least 10 events per variable (EPV) and up to 50 events per variable (EPV) when variable selection is an option in the system. This research uses over 400 repeated observations (events) to test different data sizes (8 bytes, 16 bytes, 32 bytes, 64 bytes, 128 bytes, and 256 bytes) in each case.
In our research, we predict end-to-end latency time and data packet size based on data generated in JosNet. Two approaches have been employed to demonstrate such prediction: interpolation (if a data packet size falls within the range of 0–256 bytes) or extrapolation (if a data packet size falls beyond the range of 0–256 bytes); and univariate linear regression models (shown in Section 4.2). To reiterate, this research has ensured that at least 400 observations in every event or test set-up are carried out to ensure the accuracy and consistency of result outcomes generated.
4.1.1. Time-Based Prediction
When some known variables, (e.g., in this case, the data packet time (D) and the network connection pair), are used to find the end-to-end latency time, we term this as “Time-based prediction”. The interpolation/extrapolation algorithm for JosNet time-based prediction and regression prediction models could be applied to both end-to-end latency and transmission times. However, in this paper, we shall only demonstrate how they are used for the former with evidence presented in the remaining part of Section 4. The interpolation algorithm is employed when the input query value falls within the range of values provided in the CSV dataset while the extrapolation algorithm is employed when the input query value falls beyond or beneath the range of values. Note that the algorithm only covers positive values.
Initialization variables are: D(input), D(), D(), , T(input), T(), T(), , a′, a″, , , b, b′, b″, c, c′, c″ to 0
where:
D(input) = Input data packet size
= Lower value closest to D(input) in CSV dataset
= Upper value closest to D(input) in CSV dataset
= End-to-end latency for data packet size
= End-to-end latency for data packet size
= Maximum data packet size in CSV dataset
= Minimum data packet size in CSV dataset
T(input) = End-to-end latency for the inputted data packet size
T) = End-to-end latency for corresponding maximum data packet size x
T(
= End-to-end latency for corresponding minimum data packet size x
Read “D(input)”
Assuming “D(input)” exists in the CSV dataset, then display the average T of input “T(input)”
However, if “D(input)” does not exist in CSV then carry out interpolation as follows:
Output c
where a is the gradient of the linear line, and c is D(input).
For extrapolation: The input value is compared if it falls outside the data range,
Then calculate the gradient of each graph segment (a1....an) as follows:
Calculate the mean gradient, a′
Calculate the gradient of each graph segment (....) as follows:
where
Calculate the mean gradient, a″
Output c″
For example, if the Routing Table requests for the end-to-end latency time required for 128 bytes of data to be transmitted from one Zigbee device to another Zigbee device, JosNet compares the required data packet size value with the existing available CSV dataset for ZB-ZB. The current data packet size values are 8, 16, 32, 64, 128, and 256 bytes, therefore, we say 128 exists in the ZB-ZB CSV data files. Subsequently, JosNet outputs the average end-to-end latency time: 0.057 s or 57 milliseconds, because 57 milliseconds is a confirmed recorded average latency time for the inputted 128 bytes data packet.
For interpolation: If 110 bytes is the requested value (a randomly selected value D) which does not exist in the ZB-ZB CSV dataset file, then:
The data packet size value closest to the requested value (D), or in other words, the algorithm looks for the point on the graph where 110 bytes would sit, this would be between the 64- and 128-bytes data point. Here, 64 bytes () is the lower value closest to D, while 128 () is the upper value closest to D. Finally, D() = 0.057 and D() = 0.052 are the corresponding time values to and , respectively. Using the linear interpolation equation above to find “a”, we then use this to find a prediction value of “c”, as shown below.
For extrapolation: Again, if the value requested by the Routing Table is 505 bytes which is greater than the maximum CSV dataset value of 256 bytes. The following is adopted as:
The final possible option is that, if the value inputted by the user is less than the existing data points in the CSV dataset (8 bytes). The minimum time in the CSV dataset is divided by the minimum data packet size in the CSV dataset. Assuming the value entered is 6 bytes for Zigbee-to-Zigbee transmission, which is obviously lower than the minimum data packet size value in our CSV dataset, the next option is adopted as:
4.1.2. Data-Based Prediction
When some known variables, which in this case are the end-to-end latency time (T) and the network connection pair, are used to find the data packet size, we term this as “data-based prediction”. The interpolation algorithm can be applied when the input query value falls within the range of values (the bounding limit of each graph segment) provided in the CSV dataset while the extrapolation algorithm will be applied when the input query value falls beyond or beneath the CSV range. The general regression model for end-to-end latency time (T) = a D + A. It should be noted that the query value should be more than the minimum end-to-end latency time (A) (i.e., for data packet size (D) equal to zero). The algorithm only covers positive values.
Initialization variables are: T(input), T(), T(), T(), T(), D(input), D(), D(), T(), T(), a, a′, a″, , , b, b′, b″, c, c′, c″ to 0
where:
T(input) = Input latency time
T() = Lower value closest to T(input) in CSV dataset
T() = Upper value closest to T(input) in CSV dataset
D() = Data packet size for end-to-end latency
D() = Data packet size for end-to-end latency
T() = Maximum end-to-end latency time in CSV dataset
T() = Minimum end-to-end latency time in CSV dataset
D(input) = Data packet size for the inputted end-to-end Latency time
D() = Data packet size for corresponding maximum end-to-end latency timeD() = Data packet size for corresponding minimum end-to-end latency time
Read T(input)
Assuming “T(input)” exists in the CSV dataset, then display the average D of input “T(input)”
However, if “T(input)” does not exist in CSV then carry out interpolation as follows:
Output c
where a is the gradient of the linear line, and c is T(input).
For extrapolation: The input value is compared if it falls outside the data range,
Output g
Calculate the gradient of each graph segment (....) as follows:
Calculate the mean gradient, a′
Output c′
Calculate the gradient of each graph segment (....):
Calculate the mean gradient, a″
Output c″
For example, if a user intends to use JosNet to manually find the data packet size that can be sent in 0.088 s from a Thread network device to a Zigbee network device, JosNet compares the entered value with the existing CSV dataset file available for TH-ZB. The current average time that corresponds with each data size value (8, 16, 32, 64, 128, and 256 bytes) are 0.049, 0.056, 0.075, 0.088, and 0.101, respectively. Therefore, we say 0.088 exists in the TH-ZB CSV dataset file. Then, JosNet outputs 64 bytes, which is a confirmed recorded data size for the inputted latency time of 0.088 s.
For interpolation: Assuming 0.095 is the entered value (a randomly selected value T) which does not exist in the TH-ZB CSV dataset file, then:
Assuming
JosNet looks for the time value closest to the entered value (T), or for the point on the graph where 0.095 s fits in, this would be between 0.088 and 0.101 s. Here, 0.088 () is the lower value closest to T, while 0.101 () is the upper value closest to T. Finally, T() = 128 and T() = 64 are the corresponding data size values to y and x, respectively. Using the linear interpolation equation above to find “a”, and then use it to find the value of “c” as shown below.
c = 98.46 bytes
For extrapolation: Assuming the value entered by the user is 0.23 s for end-to-end latency time from a Thread network to a Zigbee network (TH-ZB), which is higher than the current maximum end-to-end latency time in the CSV dataset (0.101 s), the following approach is adopted as:
However, assuming the value entered is 0.015 s for transmission from a Bluetooth to Bluetooth network, this time the entry is lower than the minimum end-to-end latency time value in the CSV dataset,
then: (0 < T(input) < T())
This prediction algorithm has shown that collecting and storing of data within JosNet provides the prediction model with a wide scope of events occurrence and therefore improves its prediction accuracy. Furthermore, the research provides a simplified and unambiguous approach to predicting network data packet activities.
4.2. Comparative Analysis of JosNet Interpolation/Extrapolation Time-Based Algorithm and Univariate Regression Prediction Model
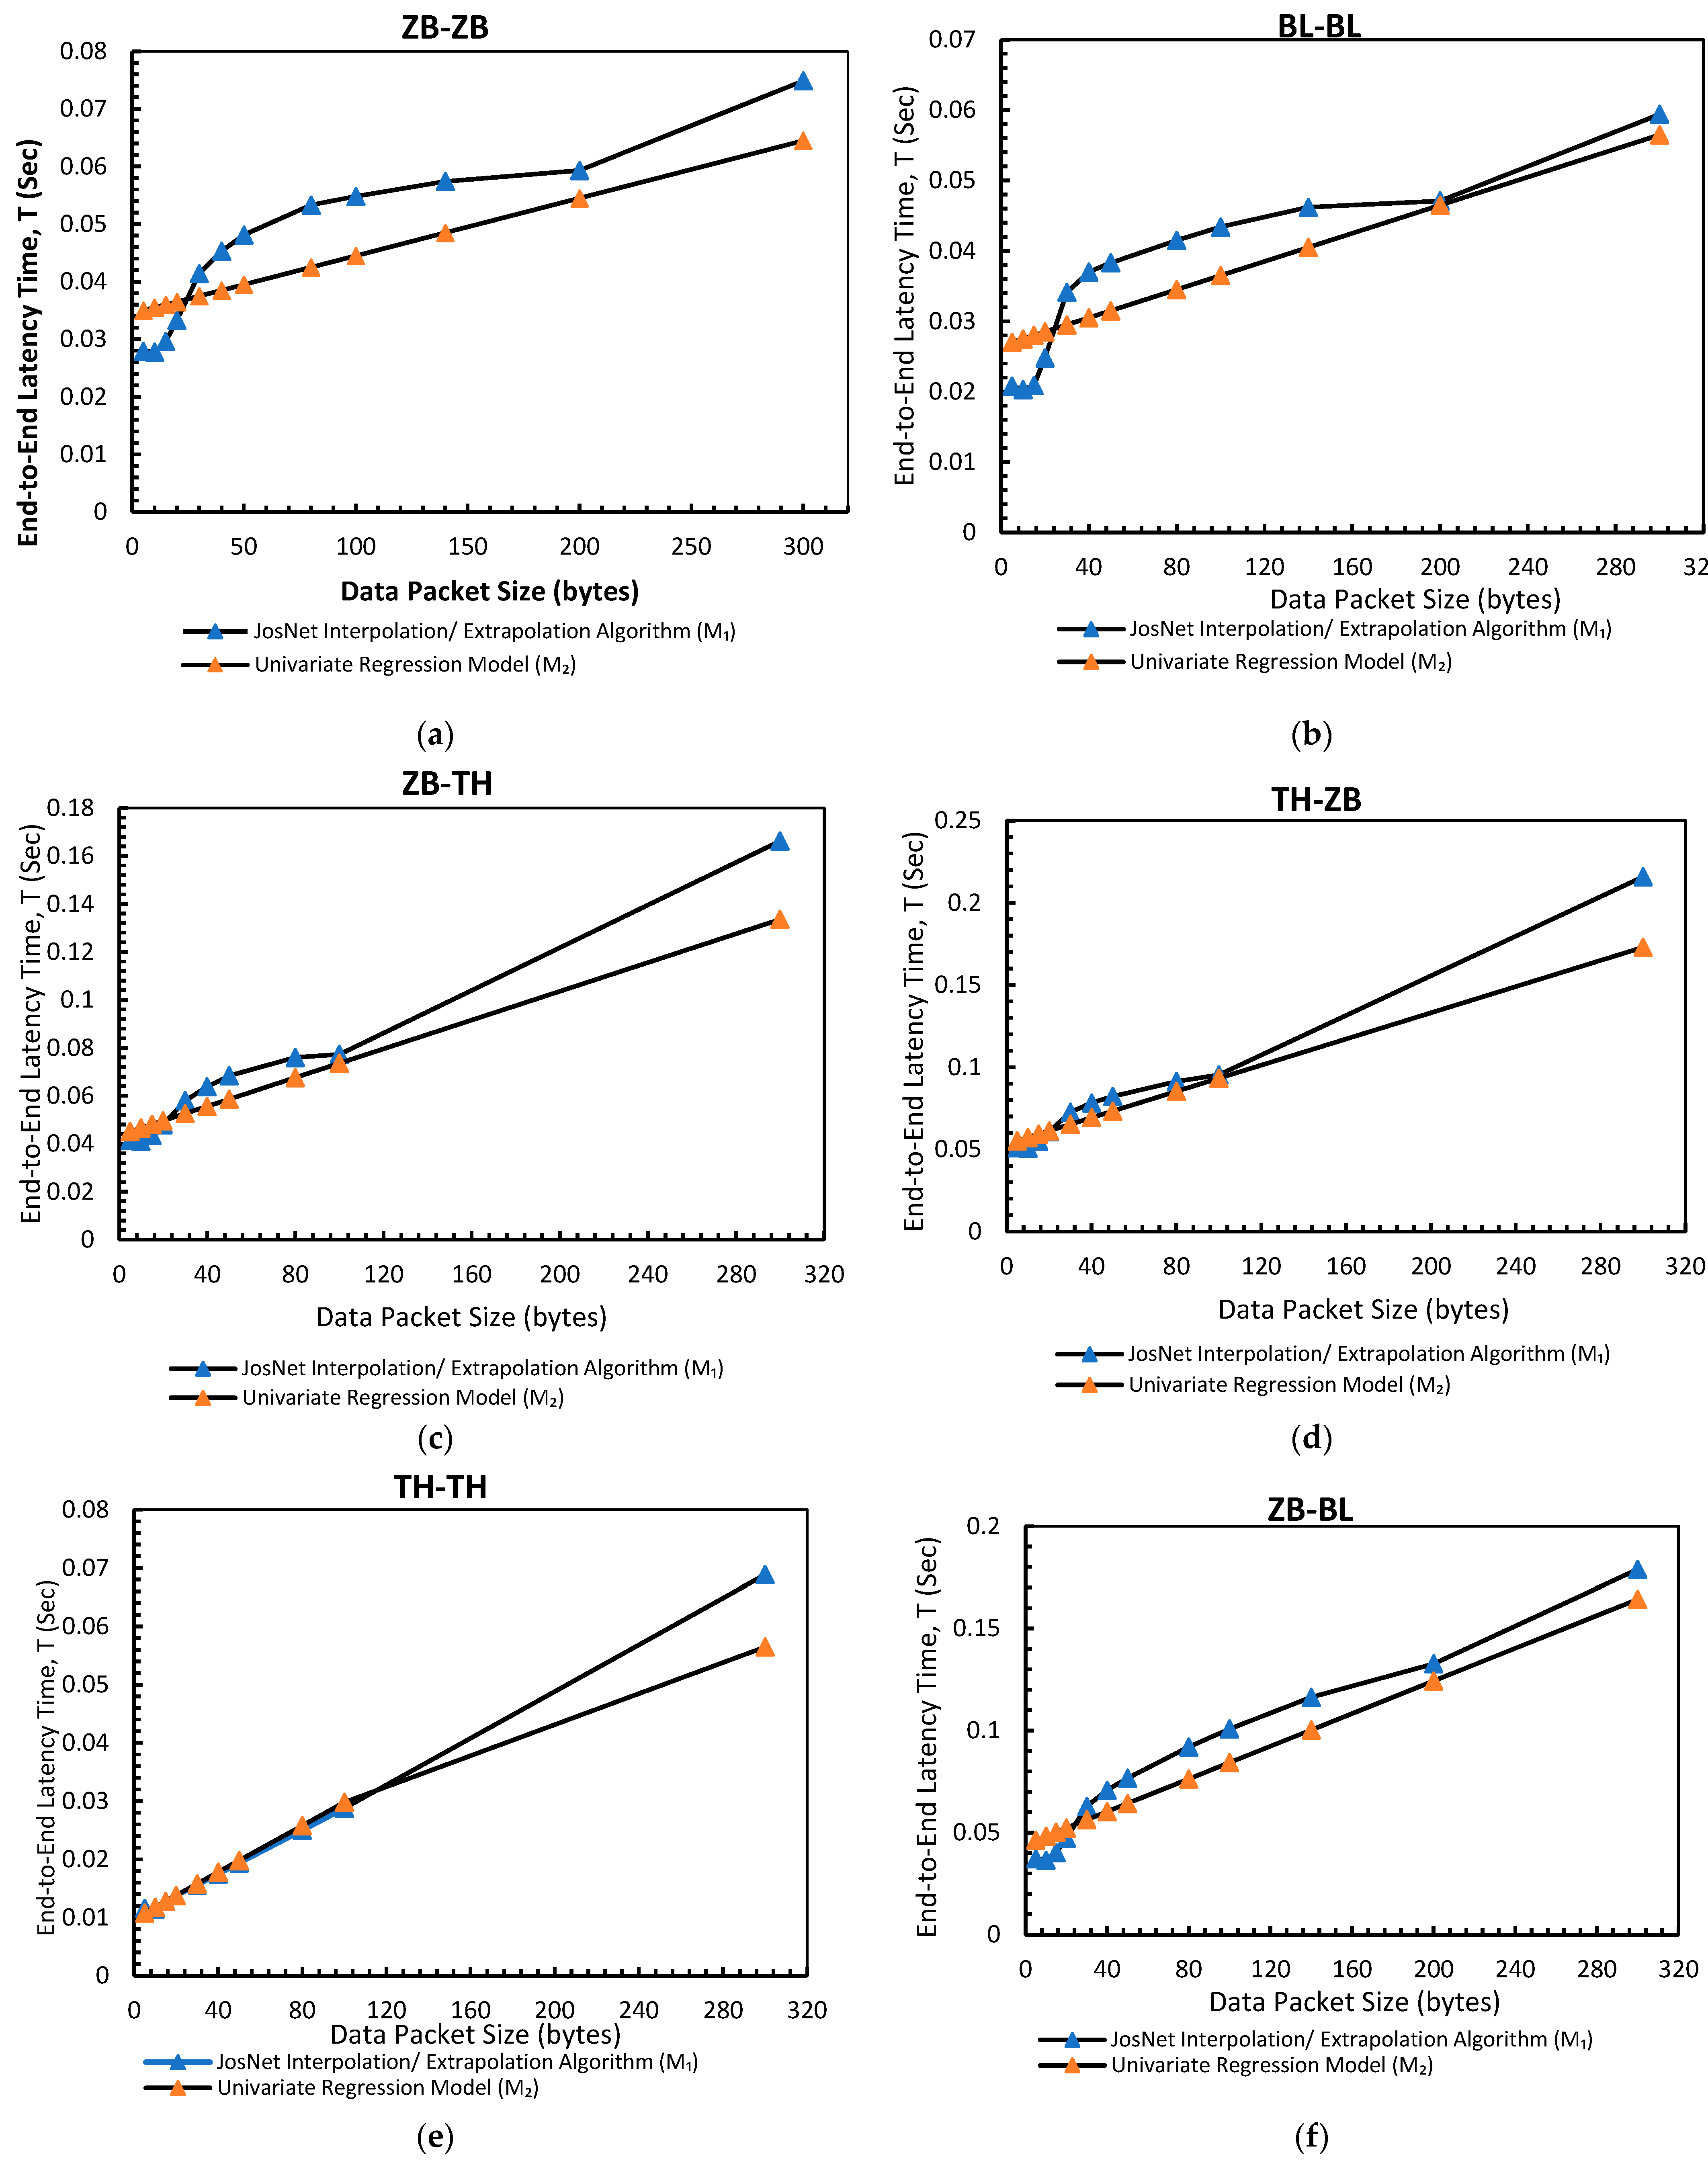
In this section, we compare the end-to-end latency (M1) predicted results using the algorithm depicted in Section 4.1.1 and Section 4.1.2 above and the univariate linear regression model (M2). The univariant equations shown in Table 1 below are derived from the linear graph trendline, where D is the data packet size input and T is the predicted regression end-to-end latency time. The selected data points are sample data size inputs that are: (i) smaller than the minimum data packet size (8 bytes), (ii) greater than the maximum data packet size (256 bytes), and (iii) within the following data size graph segments (8–16 bytes; 16–32 bytes; 32–64 bytes; 64–128 bytes; 128–256 bytes) when appropriate. Subsequently, the mean and R-squared values of M1 and M2 are compared to establish the accuracy margin of JosNet’s predicted values. The comparative results for time-based prediction are shown in Table 2. The hypotheses are: Ho (null hypothesis)—mean of sample 1 = mean of sample 2; Ha (alternative hypothesis)—mean of sample 1 ≠ mean of sample 2. The number of variables used in calculating the mean is represented as n, while the degree of freedom (df) is n − 1 for each case (M1 and M2).

Table 1.
Time-based univariate regression equation for connected network pairs.

Table 2.
Comparative Analysis of Time-Based Prediction Using JosNet Interpolation/Extrapolation Algorithm and Univariate Regression Model: (a) Zigbee to Zigbee connection pair (ZB-ZB); (b) Bluetooth to Bluetooth (BL-BL) connection pair; (c) Thread to Thread (TH-TH) connection pair; (d) Zigbee to Bluetooth (ZB-BL) connection pair; (e) Zigbee to Thread (ZB-TH) connection pair; and (f) Thread to Zigbee (TH-ZB) connection pair.
All the network connection pairs have achieved a very high R-square value which is an indicator of how the predictor variable can explain the variations in response to changes in the inputs [63,64]. Four JosNet connection pairs achieved over 98% prediction accuracy while two connection pairs achieved over 80% prediction accuracy. Further details of the results and what they represent will be discussed in Section 5 of this paper.
As mentioned earlier, note that the values of data packet size (inputs) are selected to match the graph segments and are similar across all network pairs.
Graphical Representation of Time-Based Algorithm and Univariate Regression Prediction Model
Figure 6 below visually depicts the relationship between JosNet’s predictions and the univariate prediction model.
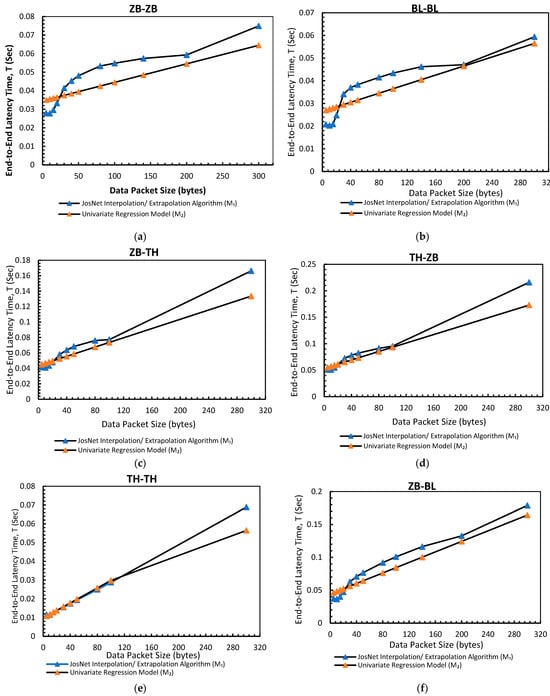
Figure 6.
The graphs for JosNet Interpolation and extrapolation for time-based prediction against the Univariant Regression Model: (a) Zigbee to Zigbee connection pair (ZB-ZB); (b) Bluetooth to Bluetooth (BL-BL) connection pair; (c) Thread to Thread (TH-TH) connection pair; (d) Zigbee to Bluetooth (ZB-BL) connection pair; (e) Zigbee to Thread (ZB-TH) connection pair; and (f) Thread to Zigbee (TH-ZB) connection pair.
4.3. Comparative Analysis of JosNet Interpolation/Extrapolation Latency Time-Based Algorithm and Univariate Regression Prediction Model
Predicting the data packet size from any user-given time applies the same mathematical algorithm and JosNet procedure, however, the value of D is replaced with T. This requires the user to enter a time value as shown in the number marked “2” in Figure 3. The source and destination network must also be selected to ensure the right dataset is accessed when making predictions. However, when an invalid time value is entered, JosNet returns an error message.
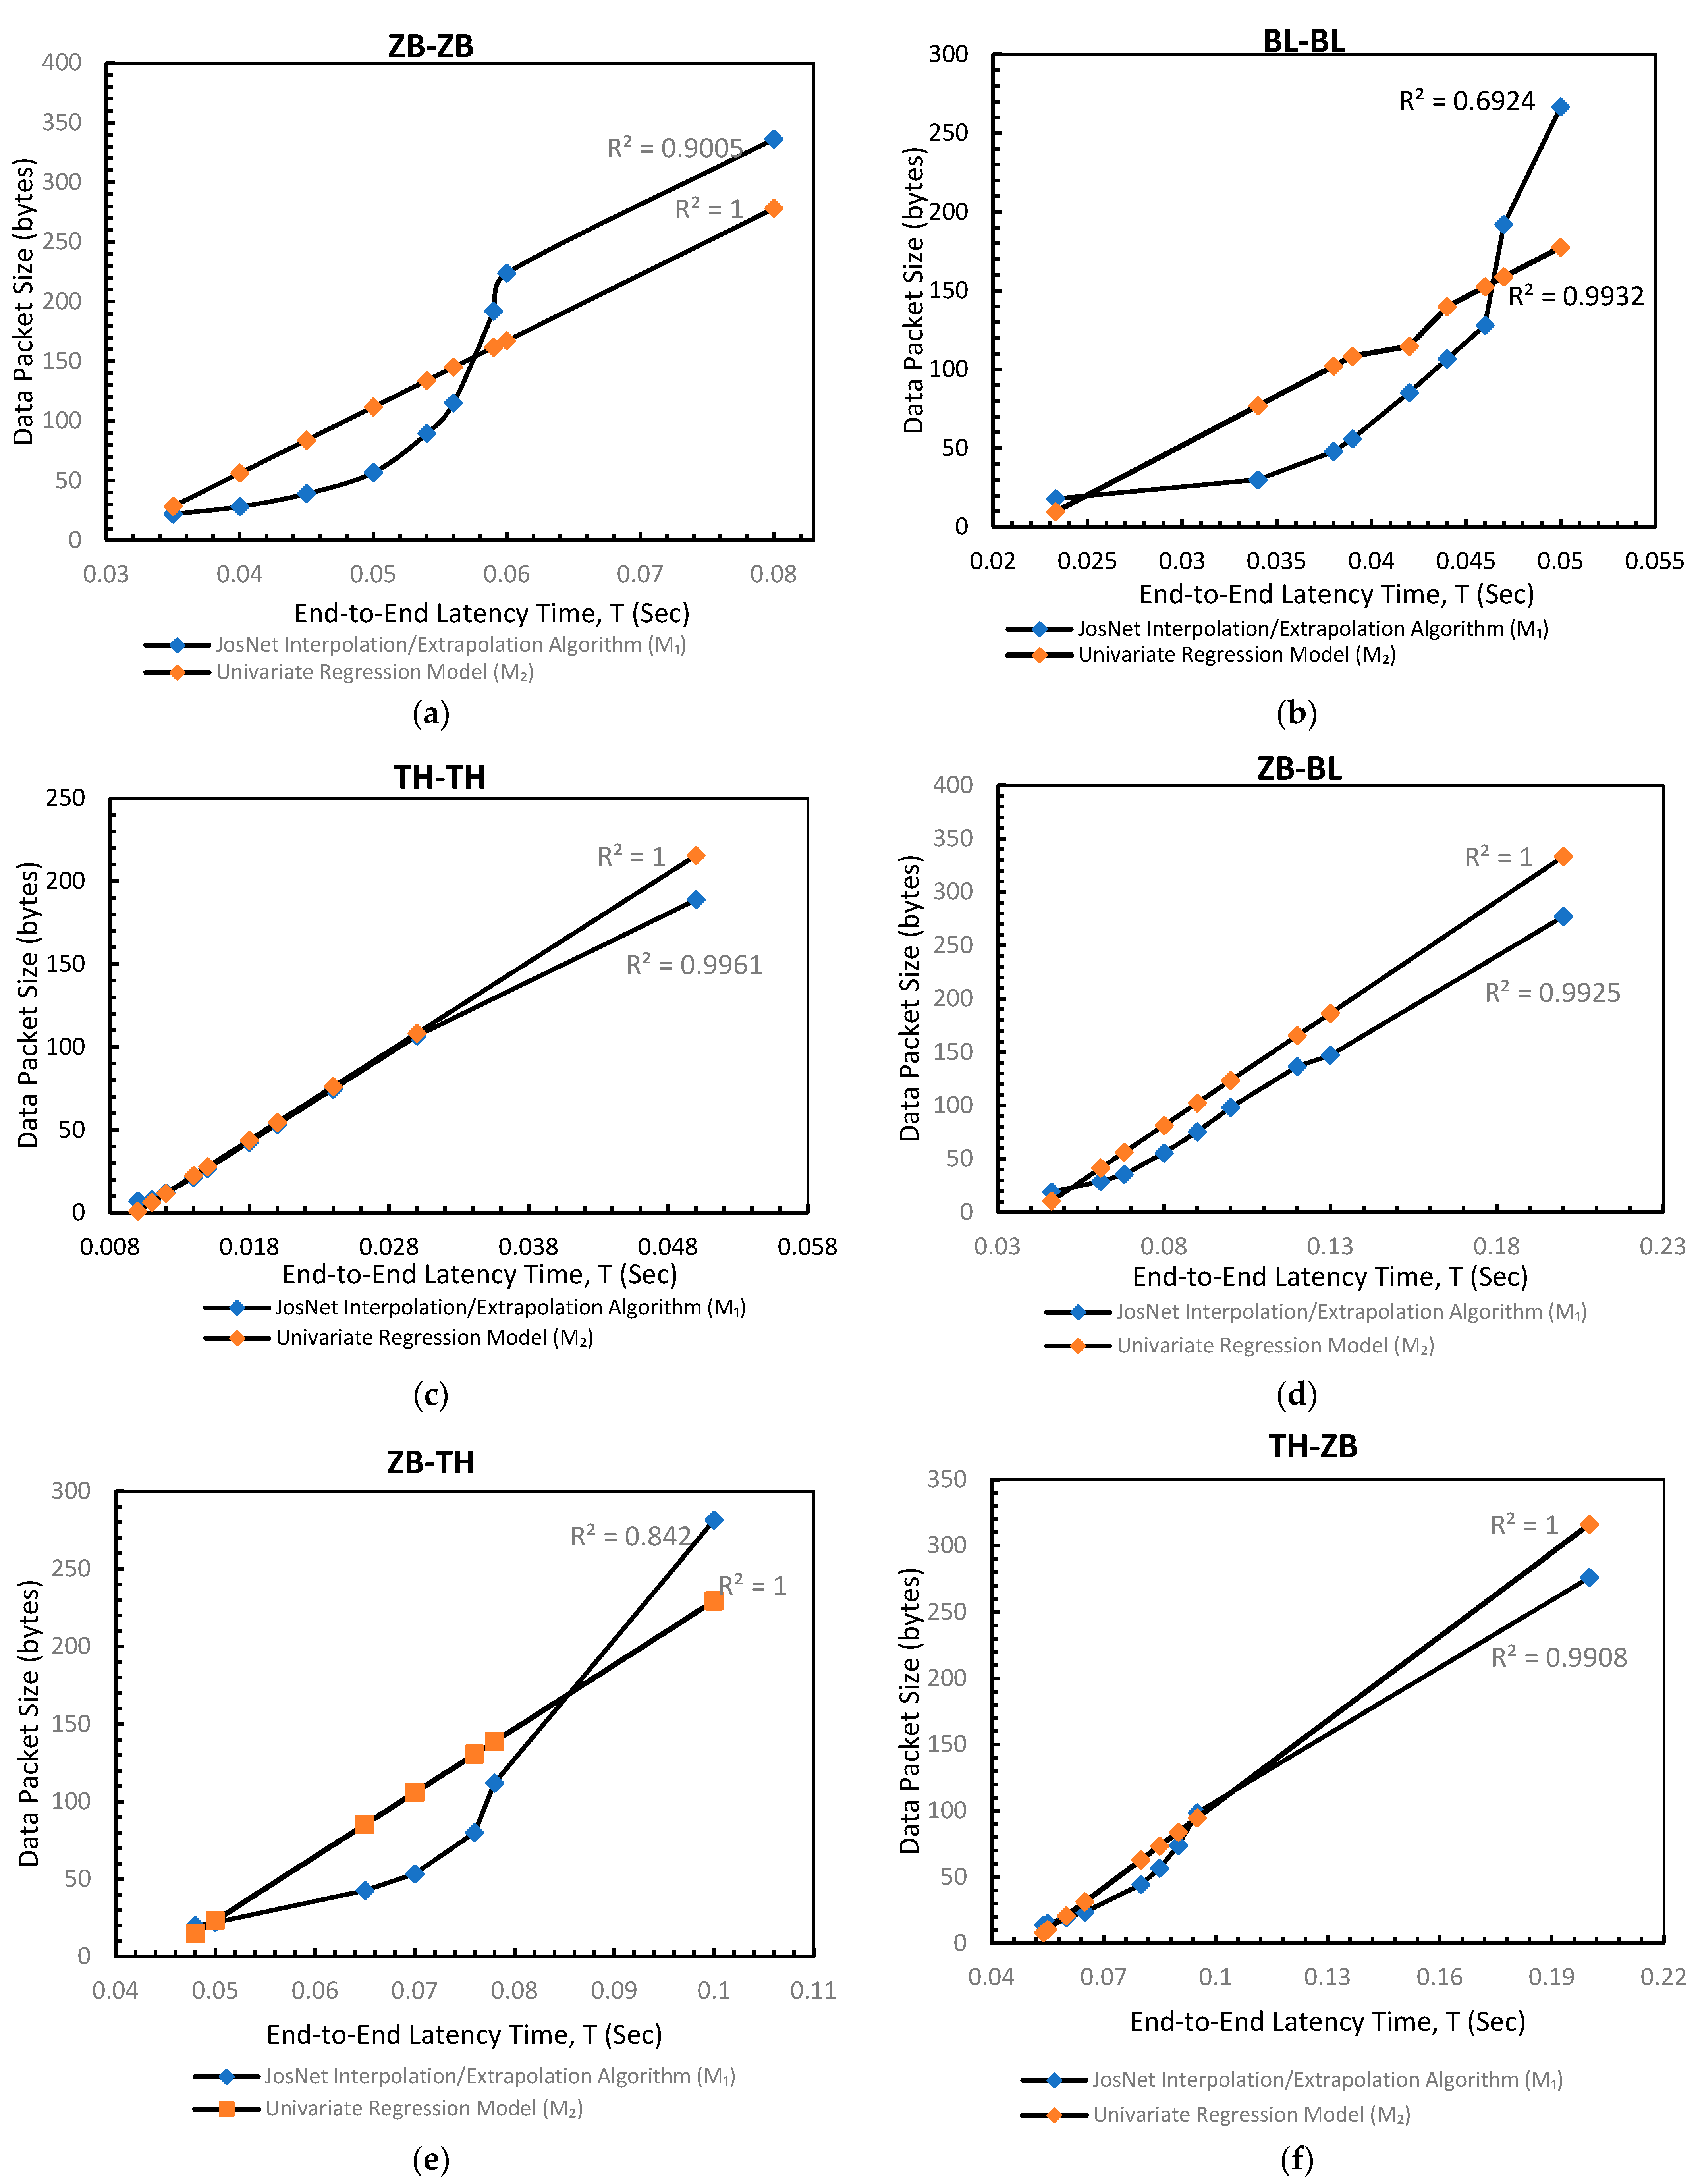
The univariate equations shown in Table 3 below are derived from the linear graph trendline, where T is the end-to-end latency time input and D is the predicted regression data packet size. The selected times are sample inputs that are (i) smaller than the minimum data packet size (8 bytes), (ii) greater than the maximum data packet size (256 bytes), and (iii) within the following data size graph segments (8–16 bytes; 16–32 bytes; 32–64 bytes; 64–128 bytes; 128–256 bytes) when appropriate. Subsequently, the mean and R-squared values of M1 and M2 are compared to establish the accuracy margin of JosNet’s predicted values. The comparative results for data-based prediction are shown in Table 4. The hypotheses are: Ho (null hypothesis)—mean of sample 1 = mean of sample 2; Ha (alternative hypothesis)—mean of sample 1 ≠ mean of sample 2. The number of variables used in calculating the mean is represented as n, while the degree of freedom (df) is–n − 1 for each case (M1 and M2).

Table 3.
Data-based univariate regression equation for connected network pairs.

Table 4.
Comparative Analysis of Data Packet Size-Based Prediction Using JosNet Interpolation/Extrapolation Algorithm and Univariate Regression Model: (a) Zigbee to Zigbee connection pair (ZB-ZB); (b) Bluetooth to Bluetooth (BL-BL) connection pair; (c) Thread to Thread (TH-TH) connection pair; (d) Zigbee to Bluetooth (ZB-BL) connection pair (e) Zigbee to Thread (ZB-TH) connection pair; and (f) Thread to Zigbee (TH-ZB) connection pair.
Unlike time-based prediction, the input value within each data packet graph segment varies across each network connection pair. This is because the end-to-end latency time for one connection pair is different from other connection pairs even with the same data packet size, therefore, the sample input of time within each graph segment is different for data-based prediction. Again, all the network connection pairs have achieved a very high R-square value which is an indicator of how the predictor variable can explain the variations in response to changes in the inputs. Three out of six JosNet connection pairs achieved over 99% prediction accuracy, one connection pair achieved over 90% prediction accuracy, while two connection pairs achieved over 80% prediction accuracy. Further details of the results and what they represent will be discussed in Section 5 of this paper.
Graphical Representation of Data-Based Algorithm and Univariate Regression Prediction Model
Figure 7 below visually depicts the relationship between JosNet’s predictions and the univariate prediction model.
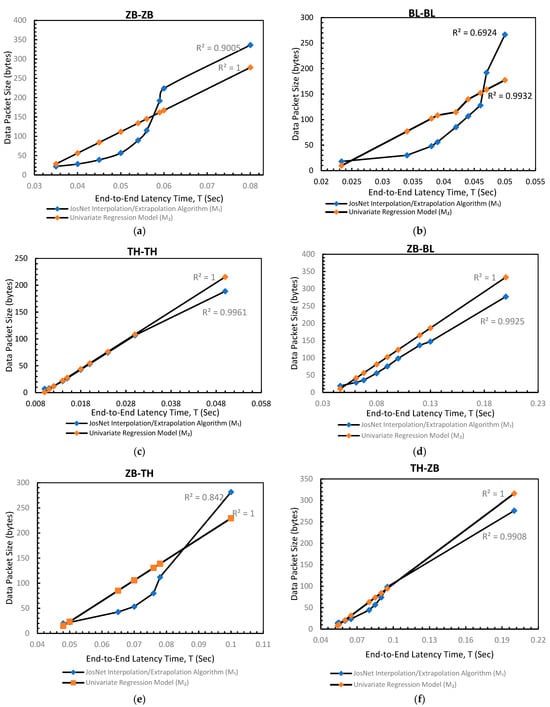
Figure 7.
The graphs for JosNet Interpolation and extrapolation for data-based prediction against the Univariant regression Model: (a) Zigbee to Zigbee (ZB-ZB) connection pair; (b) Bluetooth to Bluetooth (BL-BL) connection pair; (c) Thread to Thread (TH-TH) connection pair; (d) Zigbee to Bluetooth (ZB-BL) connection pair; (e) Zigbee to Thread (ZB-TH) connection pair; and (f) Thread to Zigbee (TH-ZB) connection pair.
4.4. Discussion of Findings
This study identified some prevalent existing gaps or challenges in multi-network heterogeneous WSNs that could be addressed when a robust prediction system such as JosNet is applied. This has been addressed using linear interpolation and extrapolation algorithms to predict end-to-end latency time and data packet size using real-time captured data from over 400 repeated observations for seven connection data size segments: (i) smaller than the minimum data packet size (8 bytes), (ii) greater than the maximum data packet size (256 bytes), (iii) 8–16 bytes, (iv) 16–32 bytes, (v) 32–64 bytes, (vi) 64–128 bytes, and (vii) 128–256 bytes. This is repeated for all six connection pairs with a total of over 16,800 transmitted communications captured throughout the experiment, to provide a more accurate framework of the model.
In the comparative analyses of time-based prediction in Table 2 and Figure 6, where M1 is the outcome of JosNet interpolation/extrapolation algorithm and M2 is the univariate regression algorithm. Also, the mean values for all the connected pairs have a significantly low variation margin between M1 and M2. We observe the graph of TH-TH for both time-based and data-based predictions are almost in a perfect straight linear plot, achieving a 99% R-square value. This implies that an increase in data packet size will synonymously increase its end-to-end latency time (if all external factors/bias remain constant) as compared to other connection pairs that may fall on either side of the linear plot.
- ZB-ZB: Recorded a mean of 0.0461 for M1 and 0.0428 for M2, with 84.3% in R-squared value (R2)
- BL-BL: Recorded a mean of 0.03615 for M1 and 0.03457 for M2, with 80.65% in R-squared value (R2)
- TH-TH: Recorded a mean of 0.0249 for M1 and 0.02147 for M2, with 99.95% in R-squared value (R2)
- ZB-BL: Recorded a mean of 0.0827 for M1 and 0.0773 for M2, with 96% in R-squared value (R2)
- ZB-TH: Recorded a mean of 0.0684 for M1 and 0.0631 for M2, with 99% in R-squared value (R2)
- TH-ZB: Recorded a mean of 0.0856 for M1 and 0.0793 for M2, with 99% in R-squared value (R2)
In the comparative analyses of data-based prediction as shown in Table 4 and Figure 7, the outcomes are as follows:
- ZB-ZB: Recorded a mean of 122.61 for M1 and 129.68 for M2, with 90% in R-squared value (R2)
- BL-BL: Recorded a mean of 103.41 for M1 and 115.63 for M2, with 69.63% in R-squared value (R2)
- TH-TH: Recorded a mean of 54.12 for M1 and 56. for M2, with 99.61% in R-squared value (R2)
- ZB-BL: Recorded a mean of 97.08 for M1 and 122.30 for M2, with 99.25% in R-squared value (R2)
- ZB-TH: Recorded a mean of 87.34 for M1 and 103.95 for M2, with 84.2% in R-squared value (R2)
- TH-ZB: Recorded a mean of 69.00 for M1 and 74.94 for M2, with 99% in R-squared value (R2)
The data speed prediction framework demonstrates the use of interpolation and extrapolation to enable JosNet to automatically adjust and adapt to changes with regular data capture, which corresponds to every datum uploaded (in the CSV dataset) for more accurate prediction. This implies that collecting and storing the end-to-end latency time data within JosNet provides adequate historical data for the prediction model.
5. Conclusions
The rise of the Internet of Things (IoT) has intricately woven an interconnected landscape, with Wireless Sensor Networks (WSNs) playing a pivotal role in facilitating seamless communication. However, the effective prediction of latency across diverse networks in the IoT realm faces myriad challenges due to the inherent heterogeneity of IoT devices and networks. The complexity arises from the assortment of communication protocols, hardware specifications, and transmission media among interconnected devices. Our study employs linear interpolation and extrapolation algorithms, leveraging multi-network live end-to-end latency data for precise prediction. This strategy has proven instrumental in optimizing network performance by enhancing throughput and response time.
Our findings provide insights which are aligned to the following research objectives:
- RO1 and RO2: The retention and utilization of historical data are fundamental in predicting and forecasting events in network communication. In this study, we have successfully implemented the utilization of existing multi-network live end-to-end latency data for predicting future arrival times. This was achieved through the application of linear interpolation and extrapolation algorithms, resulting in enhanced network performance, increased throughput, and improved response time.
- RO3: The research reveals that prediction accuracy is higher for interpolations and diminishes as the input value deviates further from the existing data size graph segment (8–256 bytes). From a practical perspective, network nodes maintaining a regular communication packet load range are likely to receive more accurate routing predictions compared to nodes with irregular patterns or fluctuating usage.
- RO4: The research surpasses anticipated benchmarks, with most connection pairs achieving over a 95% prediction accuracy marker, while others fall within the range of 70% to 95% prediction accuracy.
- Furthermore, our analysis underscores that the application of data packet prediction and end-to-end latency time prediction for heterogeneous low-rate and low-power Wireless Sensor Networks (WSN) using a localized dataset significantly enhances network performance and minimizes end-to-end latency time.
- The research contributes to the control and management of data packets for mesh network routing, leading to improved throughput and enhanced network efficiency within WSNs.
- An additional contribution lies in the establishment of a simplified and unambiguous approach for WSN prediction. This is achieved by applying linear interpolation and extrapolation algorithms, streamlining the prediction process for enhanced efficiency.
Future studies can assess the influence of 5G networks on Multi-Network Latency Prediction. This exploration involves investigating the way the integration of 5G technology with pre-existing networks shapes latency patterns and how predictive models can be tailored to optimize performance within an IoT environment enabled by 5G. The outcomes of such research endeavors have the potential to augment the current body of knowledge by contributing complementary insights to the findings presented in this existing study.
Author Contributions
Conceptualization, J.E.B. and A.-L.K.; literature review, J.E.B. and O.A.S.; methodology, J.E.B.; software, J.E.B.; validation, J.E.B., A.-L.K. and O.A.S.; formal analysis, J.E.B. and A.-L.K.; investigation, J.E.B.; resources J.E.B.; data curation, J.E.B.; experimental setup and implementation, J.E.B.; data analysis and visualization, J.E.B., A.-L.K. and O.A.S.; primary author, J.E.B.; project management, J.E.B. and A.-L.K.; supervision, A.-L.K. All authors have read and agreed to the published version of the manuscript.
Funding
This research received no external funding.
Data Availability Statement
The data presented in this study are available on request from the corresponding author.
Conflicts of Interest
The authors declare no conflict of interest.
References
- Ajay, P.; Nagaraj, B.; Pillai, B.M.; Suthakorn, J.; Bradha, M. Intelligent Ecofriendly Transport Management System Based on IoT in Urban Areas. Environ. Dev. Sustain. 2022. [Google Scholar] [CrossRef]
- Alghofaili, Y.; Rassam, M.A. A Trust Management Model for IoT Devices and Services Based on the Multi-Criteria Decision-Making Approach and Deep Long Short-Term Memory Technique. Sensors 2022, 22, 634. [Google Scholar] [CrossRef] [PubMed]
- Balota, J.E.; Kor, A.-L. Brokerage System for Integration of LrWPAN Technologies. Sensors 2022, 22, 1733. [Google Scholar] [CrossRef] [PubMed]
- Shihao, W.; Qinzheng, Z.; Han, Y.; Qianm, L.; Yong, Q. A Network Traffic Prediction Method Based on LSTM. ZTE Commun. 2019, 17, 19–25. [Google Scholar] [CrossRef]
- Ma, Y.; Li, L.; Yin, Z.; Chai, A.; Li, M.; Bi, Z. Research and Application of Network Status Prediction Based on BP Neural Network for Intelligent Production Line. Procedia Comput. Sci. 2021, 183, 189–196. [Google Scholar] [CrossRef]
- Alaerjan, A. Towards Sustainable Distributed Sensor Networks: An Approach for Addressing Power Limitation Issues in WSNs. Sensors 2023, 23, 975. [Google Scholar] [CrossRef]
- Jecan, E.; Pop, C.; Ratiu, O.; Puschita, E. Predictive Energy-Aware Routing Solution for Industrial IoT Evaluated on a WSN Hardware Platform. Sensors 2022, 22, 2107. [Google Scholar] [CrossRef]
- Adu-Manu, K.S.; Engmann, F.; Sarfo-Kantanka, G.; Baiden, G.E.; Dulemordzi, B.A. WSN Protocols and Security Challenges for Environmental Monitoring Applications: A Survey. J. Sens. 2022, 2022, e1628537. [Google Scholar] [CrossRef]
- Chandnani, N.; Khairnar, C.N. An Analysis of Architecture, Framework, Security and Challenging Aspects for Data Aggregation and Routing Techniques in IoT WSNs. Theor. Comput. Sci. 2022, 929, 95–113. [Google Scholar] [CrossRef]
- El-Sayed, H.; Mellouk, A.; George, L.; Zeadally, S. Quality of Service Models for Heterogeneous Networks: Overview and Challenges. Ann. Telecommun. 2008, 63, 639–668. [Google Scholar] [CrossRef]
- Bello, O.; Zeadally, S.; Badra, M. Network Layer Inter-Operation of Device-to-Device Communication Technologies in Internet of Things (IoT). Ad Hoc Netw. 2017, 57, 52–62. [Google Scholar] [CrossRef]
- Cloudflare What Is a Packet?|Network Packet Definition. Available online: https://www.cloudflare.com/learning/network-layer/what-is-a-packet/ (accessed on 16 June 2023).
- Stallings, W.; Case, T.L. Business Data Communications—Infrastructure, Networking and Security; Department of Enterprise Systems and Analytics Faculty Publications, 7th ed.; Pearson: London, UK, 2012; ISBN 978-0-273-76916-3. [Google Scholar]
- Sikos, L.F. Packet Analysis for Network Forensics: A Comprehensive Survey. Forensic Sci. Int. Digit. Investig. 2020, 32, 200892. [Google Scholar] [CrossRef]
- Mazumdar, N.; Nag, A.; Nandi, S. HDDS: Hierarchical Data Dissemination Strategy for Energy Optimization in Dynamic Wireless Sensor Network under Harsh Environments. Ad Hoc Netw. 2021, 111, 102348. [Google Scholar] [CrossRef]
- Forero, F.; da Fonseca, N.L. Distribution of Multi-Hop Latency for Probabilistic Broadcasting Protocols in Grid-Based Wireless Sensor Networks. Ad Hoc Netw. 2022, 126, 102754. [Google Scholar] [CrossRef]
- Jain, K.; Agarwal, A.; Abraham, A. A Combinational Data Prediction Model for Data Transmission Reduction in Wireless Sensor Networks. IEEE Access 2022, 10, 53468–53480. [Google Scholar] [CrossRef]
- Narayan, V.; Daniel, A.K. Energy Efficient Protocol for Lifetime Prediction of Wireless Sensor Network Using Multivariate Polynomial Regression Model. J. Sci. Ind. Res. 2022, 81, 1297–1309. [Google Scholar] [CrossRef]
- Evangelakos, E.A.; Kandris, D.; Rountos, D.; Tselikis, G.; Anastasiadis, E. Energy Sustainability in Wireless Sensor Networks: An Analytical Survey. J. Low Power Electron. Appl. 2022, 12, 65. [Google Scholar] [CrossRef]
- Yan, B.; Liu, Q.; Shen, J.; Liang, D. Flowlet-Level Multipath Routing Based on Graph Neural Network in OpenFlow-Based SDN. Future Gener. Comput. Syst. 2022, 134, 140–153. [Google Scholar] [CrossRef]
- Zhang, M.; Dong, C.; Yang, P.; Tao, T.; Wu, Q.; Quek, T.Q.S. Adaptive Routing Design for Flying Ad Hoc Networks. IEEE Commun. Lett. 2022, 26, 1438–1442. [Google Scholar] [CrossRef]
- Wang, N.; Li, B.; Yang, M.; Yan, Z.; Wang, D. Traffic Arrival Prediction for WiFi Network: A Machine Learning Approach. In Proceedings of the IoT as a Service, Xi’an, China, 19–20 November 2020; Li, B., Zheng, J., Fang, Y., Yang, M., Yan, Z., Eds.; Springer International Publishing: Cham, Switzerland, 2020; pp. 480–488. [Google Scholar] [CrossRef]
- Liu, B.; Niu, D.; Li, Z.; Zhao, H.V. Network Latency Prediction for Personal Devices: Distance-Feature Decomposition from 3D Sampling. In Proceedings of the 2015 IEEE Conference on Computer Communications (INFOCOM), Hong Kong, 26 April–1 May 2015; pp. 307–315. [Google Scholar] [CrossRef]
- Choi, S.; Shin, K.; Kim, H. End-to-End Latency Prediction for General-Topology Cut-Through Switching Networks. IEEE Access 2020, 8, 13806–13820. [Google Scholar] [CrossRef]
- Natarajan, V.A.; Kumar, M.S. Improving QoS in Wireless Sensor Network Routing Using Machine Learning Techniques. In Proceedings of the 2023 International Conference on Networking and Communications (ICNWC), Chennai, India, 5–6 April 2023; pp. 1–5. [Google Scholar] [CrossRef]
- Ge, Z.; Hou, J.; Nayak, A. GNN-Based End-to-End Delay Prediction in Software Defined Networking. In Proceedings of the 2022 18th International Conference on Distributed Computing in Sensor Systems (DCOSS), Los Angeles, CA, USA, 30 May–1 June 2022; pp. 372–378. [Google Scholar] [CrossRef]
- Larrenie, P.; Bercher, J.-F.; Venard, O.; Lahsen-Cherif, I. Low Complexity Approaches for End-to-End Latency Prediction. In Proceedings of the 2022 13th International Conference on Computing Communication and Networking Technologies (ICCCNT), Virtual, 3–5 October 2022; pp. 1–6. [Google Scholar] [CrossRef]
- Despaux, F.; Song, Y.-Q.; Lahmadi, A. Combining Analytical and Simulation Approaches for Estimating End-to-End Delay in Multi-Hop Wireless Networks. In Proceedings of the 2012 IEEE 8th International Conference on Distributed Computing in Sensor Systems, Hangzhou, China, 16–18 May 2012; pp. 317–322. [Google Scholar] [CrossRef]
- He, Y.; Sun, Y.; Yang, Y.; Li, H.; Wu, X. End-to-End Latency Bottleneck Analysis for Multi-Class Traffic in Data Center Networks. In Proceedings of the 2015 Sixth International Conference on Intelligent Systems Design and Engineering Applications (ISDEA), Guiyang, China, 18–19 August 2015; pp. 366–371. [Google Scholar] [CrossRef]
- Guo, Y.; Hu, G.; Shao, D. Multi-Path Routing Algorithm for Wireless Sensor Network Based on Semi-Supervised Learning. Sensors 2022, 22, 7691. [Google Scholar] [CrossRef] [PubMed]
- Morales, C.R.; Rangel de Sousa, F.; Brusamarello, V.; Fernandes, N.C. Evaluation of Deep Learning Methods in a Dual Prediction Scheme to Reduce Transmission Data in a WSN. Sensors 2021, 21, 7375. [Google Scholar] [CrossRef] [PubMed]
- Rizky, R.; Mustafid; Mantoro, T. Improved Performance on Wireless Sensors Network Using Multi-Channel Clustering Hierarchy. J. Sens. Actuator Netw. 2022, 11, 73. [Google Scholar] [CrossRef]
- Kocian, A.; Chessa, S. Iterative Probabilistic Performance Prediction for Multiple IoT Applications in Contention. IEEE Internet Things J. 2022, 9, 13416–13424. [Google Scholar] [CrossRef]
- Zhong, L.; Liu, R.; Miao, X.; Chen, Y.; Li, S.; Ji, H. Compressor Performance Prediction Based on the Interpolation Method and Support Vector Machine. Aerospace 2023, 10, 558. [Google Scholar] [CrossRef]
- Cranmer, S.J.; Desmarais, B.A. What Can We Learn from Predictive Modeling? Political Anal. 2017, 25, 145–166. [Google Scholar] [CrossRef]
- Joarder, A.H. Six Ways to Look at Linear Interpolation. Int. J. Math. Educ. Sci. Technol. 2001, 32, 932–937. [Google Scholar] [CrossRef]
- Lepot, M.; Aubin, J.-B.; Clemens, F.H.L.R. Interpolation in Time Series: An Introductive Overview of Existing Methods, Their Performance Criteria and Uncertainty Assessment. Water 2017, 9, 796. [Google Scholar] [CrossRef]
- Wmcnamara Linear Interpolation Explained. Available online: https://gamedev.net/tutorials/programming/general-and-gameplay-programming/linear-interpolation-explained-r5892 (accessed on 3 October 2023).
- Said, N.; Fischer, H. Extrapolation Accuracy Underestimates Rule Learning: Evidence from the Function-Learning Paradigm. Acta Psychol. 2021, 218, 103356. [Google Scholar] [CrossRef]
- Chapman, T.; Larsson, E.; von Wrycza, P.; Dahlman, E.; Parkvall, S.; Sköld, J. Chapter 9—High-Speed Uplink Packet Access. In HSPA Evolution; Chapman, T., Larsson, E., von Wrycza, P., Dahlman, E., Parkvall, S., Sköld, J., Eds.; Academic Press: Oxford, UK, 2015; pp. 163–218. ISBN 978-0-08-099969-2. [Google Scholar]
- FlexBooks, C.-12 F. Linear Interpolation and Extrapolation|CK-12 Foundation. 2022. Available online: https://flexbooks.ck12.org/cbook/ck-12-conceptos-de-álgebra-nivel-básico-en-español/section/5.11/related/lesson/linear-interpolation-and-extrapolation-bsc-alg/ (accessed on 2 October 2023).
- x-engineer Linear Interpolation and Extrapolation with Calculator—X-Engineer.Org 2023. Available online: https://x-engineer.org/linear-interpolation-extrapolation-calculator/ (accessed on 2 October 2023).
- Schneider, A.; Hommel, G.; Blettner, M. Linear Regression Analysis. Dtsch. Arztebl. Int. 2010, 107, 776–782. [Google Scholar] [CrossRef]
- Kanade, V. What Is Linear Regression?—Spiceworks. Spiceworks 2023. Available online: https://www.spiceworks.com/tech/artificial-intelligence/articles/what-is-linear-regression/ (accessed on 3 October 2023).
- Prabhakaran, S. Linear Regression with R. Available online: http://r-statistics.co/Linear-Regression.html (accessed on 3 October 2023).
- Souza, F.; Araújo, R. Online Mixture of Univariate Linear Regression Models for Adaptive Soft Sensors. IEEE Trans. Ind. Inform. 2014, 10, 937–945. [Google Scholar] [CrossRef]
- Uyanık, G.K.; Güler, N. A Study on Multiple Linear Regression Analysis. Procedia—Soc. Behav. Sci. 2013, 106, 234–240. [Google Scholar] [CrossRef]
- Acharige, D.; Johlin, E. Machine Learning in Interpolation and Extrapolation for Nanophotonic Inverse Design. ACS Omega 2022, 7, 33537–33547. [Google Scholar] [CrossRef] [PubMed]
- An, J.; Wang, Z.-O.; Yang, Q.; Ma, Z. A SVM Function Approximation Approach with Good Performances in Interpolation and Extrapolation. In Proceedings of the 2005 International Conference on Machine Learning and Cybernetics, Guangzhou, China, 8–21 August 2005; Volume 3, pp. 1648–1653. [Google Scholar] [CrossRef]
- Cao, X.; Yousefzadeh, R. Extrapolation and AI Transparency: Why Machine Learning Models Should Reveal When They Make Decisions beyond Their Training. Big Data Soc. 2023, 10, 20539517231169731. [Google Scholar] [CrossRef]
- Bhattacherjee, A. Experimental Research. In Social Science Research: Principles, Methods and Practices (Revised Edition); University of Southern Queensland: Toowoomba, Australia, 2019; pp. 80–89. Available online: https://usq.pressbooks.pub/socialscienceresearch/chapter/chapter-10-experimental-research/ (accessed on 18 October 2023).
- Cash, P.; Stanković, T.; Štorga, M. An Introduction to Experimental Design Research. In Experimental Design Research: Approaches, Perspectives, Applications; Cash, P., Stanković, T., Štorga, M., Eds.; Springer International Publishing: Cham, Switzerland, 2016; pp. 3–12. ISBN 978-3-319-33781-4. [Google Scholar]
- Kipping, M.; Wadhwani, R.D.; Bucheli, M. Analyzing and Interpreting Historical Sources: A Basic Methodology. In Organizations in Time: History, Theory, Methods; Bucheli, M., Wadhwani, R.D., Eds.; Oxford University Press: Oxford, UK, 2013; ISBN 978-0-19-964689-0. [Google Scholar]
- Kuckartz, U. Qualitative Text Analysis: A Systematic Approach. In Compendium for Early Career Researchers in Mathematics Education; Kaiser, G., Presmeg, N., Eds.; ICME-13 Monographs; Springer International Publishing: Cham, Switzerland, 2019; pp. 181–197. ISBN 978-3-030-15636-7. [Google Scholar]
- Alazzawi, L.; Elkateeb, A. Performance Evaluation of the WSN Routing Protocols Scalability. J. Comput. Netw. Commun. 2009, 2008, e481046. [Google Scholar] [CrossRef]
- Waveshare NRF51822 Eval Kit BLE4.0 Bluetooth 2.4 G Development/Evaluation Kit Designed for nRF51822. Available online: https://www.waveshare.com/product/iot-communication/short-range-wireless/bluetooth/nrf51822-eval-kit.htm (accessed on 21 September 2021).
- Makerdiary nRF52840-MDK IoT Development Kit. Available online: https://makerdiary.com/products/nrf52840-mdk-iot-development-kit (accessed on 15 August 2020).
- Centero Tech WiHaRT WirelessHART™ Development Kit|Centero. Available online: https://centerotech.com/product/wihart-wirelesshart-development-kit/ (accessed on 4 October 2023).
- Singhal, S.; Zyda, M. Networked Virtual Environments: Design and Implementation; SIGGRAPH Series; Addison-Wesley: Reading, MA, USA, 1999; ISBN 978-0-201-32557-7. [Google Scholar]
- Smed, J.; Kaukoranta, T.; Hakonen, H. Aspects of Networking in Multiplayer Computer Games. In Proceedings of the Proceedings of the International Conference on Application and Development of Computer Games in the 21st Century (ADCOG), Hong Kong, 1 November 2001; pp. 74–81. Available online: https://www.researchgate.net/publication/269251176_Aspects_of_Networking_in_Multiplayer_Computer_Games (accessed on 2 February 2023).
- Lu, H.; Ma, X.; Ma, M.; Zhu, S. Energy Price Prediction Using Data-Driven Models: A Decade Review. Comput. Sci. Rev. 2021, 39, 100356. [Google Scholar] [CrossRef]
- Wynants, L.; Bouwmeester, W.; Moons, K.G.M.; Moerbeek, M.; Timmerman, D.; Van Huffel, S.; Van Calster, B.; Vergouwe, Y. A Simulation Study of Sample Size Demonstrated the Importance of the Number of Events per Variable to Develop Prediction Models in Clustered Data. J. Clin. Epidemiol. 2015, 68, 1406–1414. [Google Scholar] [CrossRef]
- Chugh, A. MAE, MSE, RMSE, Coefficient of Determination, Adjusted R Squared—Which Metric Is Better? Analytics Vidhya 2022. Available online: https://becominghuman.ai/univariate-linear-regression-clearly-explained-with-example-4164e83ca2ee (accessed on 3 October 2023).
- Yang, X.; Zheng, Y.; Zhang, Y.; Wong, D.S.-H.; Yang, W. Bearing Remaining Useful Life Prediction Based on Regression Shapalet and Graph Neural Network. IEEE Trans. Instrum. Meas. 2022, 71, 1–12. [Google Scholar] [CrossRef]
Disclaimer/Publisher’s Note: The statements, opinions and data contained in all publications are solely those of the individual author(s) and contributor(s) and not of MDPI and/or the editor(s). MDPI and/or the editor(s) disclaim responsibility for any injury to people or property resulting from any ideas, methods, instructions or products referred to in the content. |
© 2023 by the authors. Licensee MDPI, Basel, Switzerland. This article is an open access article distributed under the terms and conditions of the Creative Commons Attribution (CC BY) license (https://creativecommons.org/licenses/by/4.0/).

