Abstract
To address the challenges associated with wind power integration, this paper analyzes the impact of distributed renewable energy on the voltage of the distribution network. Taking into account the fast control of photovoltaic inverters and the unique characteristics of photovoltaic arrays, we establish an active distribution network voltage reactive power-optimization model for planning the active distribution network. The model involves solving the original non-convex and non-linear power-flow-optimization problem. By introducing the second-order cone relaxation algorithm, we transform the model into a second-order cone programming model, making it easier to solve and yielding good results. The optimized parameters are then applied to the IEEE 33-node distribution system, where the phase angle of the node voltage is adjusted to optimize the reactive power of the entire power system, thereby demonstrating the effectiveness of utilizing a second-order cone programming algorithm for reactive power optimization in a comprehensive manner. Subsequently, active distribution network power quality control is implemented, resulting in a reduction in network loss from 0.41 MW to 0.02 MW. This reduces power loss rates, increases utilization efficiency by approximately 94%, optimizes power quality management, and ensures that users receive high-quality electrical energy.
1. Introduction
As global energy demand escalates and environmental sustainability takes center stage, renewable energy sources, such as photovoltaic generation, wind power, and hydropower, are gradually emerging as crucial choices for addressing energy supply and environmental considerations. However, the large-scale integration and efficient utilization of renewable energy in power systems still pose challenges due to the intermittent and stochastic nature of these energy sources when connected to the grid. This results in phenomena, such as the curtailment of renewable energy, wastage of energy, and other associated difficulties.
The objective of the power grid’s reactive power-optimization model is to achieve the optimal allocation of reactive power during normal distribution network operations. Its goals include minimizing network losses, ensuring node voltage stability, improving power quality, and maintaining system stability under various operating conditions, such as integration of the distributed power supply, load variations, and changes in energy-storage devices. In general, achieving reactive power optimization in distribution networks involves formulating objective functions and multiple constraints, defining various variables, and employing optimization algorithms to find solutions. However, due to the non-convex and non-linear nature of this problem, finding the globally optimal solution can be challenging. Currently, commonly used methods include classical non-convex and non-linear programming algorithms, such as Newton’s method and quadratic programming, which may pose implementation difficulties. Another approach involves utilizing artificial intelligence algorithms, such as genetic algorithms, improved BP neural networks, convolutional networks, and particle swarm optimization algorithms [1]. While these methods effectively enhance convergence speed, they may encounter challenges in updating and utilizing examples. Considering these challenges, this paper proposes the utilization of a second-order cone relaxation algorithm for computing reactive power optimization in active distribution networks. This approach effectively linearizes the problem while enhancing the ability to obtain a globally optimal solution. Additionally, distributed energy storage with available capacity and flexible scheduling can establish scalable energy-storage clusters that provide various auxiliary services to the power grid. The second-order cone optimization algorithm [2] is primarily applied in various aspects of power system optimization, the integration of distributed energy sources, solving reactive power optimization models, and enhancing universality, computational accuracy, and efficiency. Firstly, the second-order cone optimization algorithm is extensively utilized in power-system-optimization problems. With the widespread integration of distributed energy sources, such as photovoltaic and wind power, managing reactive power optimization in the grid becomes increasingly intricate. This complexity poses a challenge that all reactive power optimization models must address. When faced with large-scale mixed-integer nonlinear optimization problems, classical algorithms often encounter challenges in programming or exhibit limited applicability for specific instances. Moreover, they may struggle with precision and solution speed, which can be significant drawbacks when dealing with large-scale networked problems. However, the second-order cone optimization algorithm can effectively address various instances by offering improved solving efficiency while ensuring computational accuracy. The second-order cone optimization algorithm can also be extended to unit commitment problems, power grid management, bidding decisions, and other domains, showcasing its remarkable versatility.
The article initially compiles historical and projected data on combined cooling, heating, and power (CCHP) systems, distributed energy resources, energy-storage devices, and demand response systems. Next, it establishes an optimization model for reactive power in the active distribution network with the objective of minimizing losses, while incorporating constraints, such as branch power flow, voltage magnitude, load power, inverter capacity, and energy-storage system capacity. Subsequently, it coordinates distributed energy storage and photovoltaic generation sources by considering their power parameters and interactions and utilizes second-order cone optimization algorithms to optimize system dispatch. Through this algorithmic approach, the scheduling of energy storage and demand-side resources is achieved to enhance clean energy utilization while adjusting the forecasts of distributed energy sources and loads. This enables the real-time control and pre-scheduling of future electricity demand and renewable energy growth while taking into account power loads. Finally, the use of an improved IEEE 33 test case for simulation purposes demonstrates that the participation of energy-storage units in active distribution network (ADN) optimization stabilizes node voltages effectively, smoothing fluctuations from distributed energy sources. Additionally, utilizing photovoltaic generation sources as inverters assists in actively scheduling distributed generation sources within the distribution network resulting in the improved quality of power generation and reduced losses.
2. Related Works
With the worsening of environmental pollution and the depletion of traditional fossil fuels, the development and utilization of new energy sources have become a global trend [3,4,5,6]. To achieve the high penetration of renewable energy and enhance the performance of power systems, researchers have focused on the safety, stability, and energy quality benefits of power systems.
Wang Ke et al. [7] proposed a power feedforward method combining dynamic inductance, capacitance power, and static load power to stabilize grid-side current and reduce DC bus voltage fluctuations. Simulation results indicated that the combined dynamic and static power feedforward strategy can suppress grid-side harmonic components and reduce DC bus voltage fluctuations. Xu Dan et al. [8] introduced a daily planning model based on the interconnection of line sections and provincial standby control. Simulation results showed that the model, under safety constraints, could flexibly control inter-provincial support methods, optimizing the coordination of generation units and interconnection line plans to achieve reasonable re-balancing. Lü Sizhuo et al. [9] proposed an optimized solution for voltage stability issues in weak receiving-end power grids in Tibet by employing a flexible DC control system with a newly developed fault-crossing strategy with PSD-BPA transient simulation software. Simulation results demonstrated that optimizing critical parameters in the flexible DC fault-crossing control could improve recovery performance after faults in weak receiving-end power grids. Zhao Xinkuan et al. [10] addressed the heterogeneity inherent to diverse power sources by formulating mathematical models for both photovoltaics and fuel cells. They used an improved droop control method to achieve power distribution balance in a microgrid with heterogeneous power sources. The results demonstrated the effectiveness of the proposed control method in ensuring the microgrid’s reliable operation. Wang Yue et al. [11] proposed a method to optimize the controller parameters of energy-storage devices to improve the inertia characteristics and damping ability of synchronous machine systems. Simulation verification confirmed its effectiveness. Wang Fuzhong et al. [12] introduced a PI parameter online optimization algorithm based on population partitioning and multi-strategy adaptive fruit fly optimization. Experimental results using a microgrid constant power control system validated the enhanced performance and accelerated response of inverters following optimization with the introduced algorithm. Wang Qi et al. [13] proposed a power distribution optimization control strategy for interconnecting converters. Simulation analysis using MATLAB/Simulink confirmed that introducing capacity weighting factors could optimize power distribution among microgrids, fully utilizing the regulating capabilities of distributed power sources for the rational sharing and flow of energy between sub-microgrids. Wang Jianping et al. [14] developed a multi-objective reactive power optimization control model using an improved quantum particle swarm algorithm. Case studies confirmed the convenience and efficiency of the proposed voltage reactive power optimization control algorithm. Dong Feifei et al. [15] optimized the average demand loss of each load bus through dynamic line rating technology, incorporating the peak shaving and valley filling demand response. The approach enhanced system reliability, reduced the average line aging rate, and significantly improved economic benefits. Cao Shankang et al. [16] established a quantitative evaluation model, analyzed system and component constraints, and applied a time-based optimization strategy based on the INSGA2-DS algorithm to achieve a rational active-reactive power distribution mode and microgrid control strategy, enhancing the stability of DC microgrids and AC power grids. Guo Ya et al. [17] proposed an optimization strategy for regenerative braking energy utilization and comprehensive negative sequence compensation. This strategy was designed to address limitations in compensation device capacity and account for voltage imbalance conditions in the grid. Using a sequential quadratic programming method and simulation verification, the strategy was shown to increase the utilization of regenerative braking energy and reduce the energy demand of traction loads on traction substations. Li Zhenkun et al. [18] devised a carbon trading market architecture for a park microgrid, designed carbon trading quota and pricing mechanisms, and established optimization models with minimum actual operating costs as the objective and a multi-objective optimization model based on game theory combined weighting for scheduling flexible resources within the park microgrid. The simulation results of the two optimization models were analyzed to show the rationality and subjectivity of the multi-objective optimization model based on game theory, providing strong reference value for practical park microgrid optimization operation. Ouyang Sen et al. [19] established a dual-layer optimization model for a light-storage microgrid considering guaranteed power supply demand and employed a genetic algorithm to effectively solve the model. The comprehensive evaluation of the microgrid power quality was performed using a combined weighting method. The results confirmed the effectiveness of the proposed model, showing that considering guaranteed power supply demand could improve microgrid power quality and increase user satisfaction within a certain range. Jia Honggang et al. [20] proposed an optimization model for voltage and frequency control in AC/DC hybrid transmission systems considering the integration of new energy clusters. An improved differential evolution algorithm was used, and the effectiveness of the method was verified through a simulation using grid data from a certain region in the Northwest.
Currently, the active control of photovoltaic (PV) output is one of the main methods to mitigate voltage violations in low-voltage distribution networks. Tonkoski R et al. [21] established a predetermined droop coefficient for voltage-reactive power, which determines the amount of active power curtailed by PV systems in response to overvoltage at nodes, ensuring that the grid-connected point voltage remains within the upper limit. Tonkoskit et al. [22] employed a voltage sensitivity matrix to effectively coordinate the reduction of PV grid-connected power at different nodes, aiming for an optimized design of control parameters. However, it is important to note that controlling voltage by curtailing PV generation may have potential drawbacks, such as compromising user revenue and overlooking under-voltage issues in the network. In this regard, energy-storage devices offer a viable solution by enabling the optimization of network voltage through active power absorption or injection. Worthmann, Karl et al. [23] investigated predictive control techniques for household photovoltaic and energy-storage systems, proposing centralized, distributed, and decentralized control schemes to optimize user energy storage output. Wang Pengfei [24] introduced a centralized energy-storage-control strategy with the goal of voltage regulation economics, efficiently utilizing energy storage. However, the prevalence of energy storage in low-voltage distribution networks is very low, with a short lifespan and relatively high operation and maintenance costs, posing difficulties in widespread adoption. Additionally, the mentioned control strategies are challenging to apply in low-voltage distribution networks where communication networks are not robust. Traditional distribution networks achieve reactive power optimization by adjusting transformer tap positions and switched reactive power compensation devices. These adjustments aim to minimize network losses, system losses, and voltage differences and achieve the lowest possible system operating cost while meeting the energy supply needs of the demand side. However, the simultaneous integration of distributed energy sources into active distribution networks requires more reactive power compensation devices, increasing costs and operational control difficulties. By transforming distributed energy sources into inverters and considering the reactive power characteristics of inverters, it is possible to leverage inverter-controlled distributed generation (DG) for reactive power optimization, significantly reducing operating losses in distribution networks. Liu Yang et al. [25] proposed a reactive power optimization method for distribution networks with distributed power sources based on a multi-objective differential evolution algorithm, demonstrating the algorithm’s strong optimization capability for multi-objective problems. Yuan Changhao et al. [26] proposed a voltage-optimization method for distribution networks considering coordinated control at the feeder layer and substation layer, effectively controlling voltage deviations, reducing equipment switching times, and improving system economic efficiency. Adjusting the reactive power control voltage of PV inverters [27] can effectively utilize the capacity of PV inverters without increasing equipment investment, providing an economically feasible method. Therefore, this paper addresses the reactive power-optimization problem of active distribution networks based on the characteristics of PV inverters.
3. Proposed Method
3.1. Reactive Power-Optimization Scheduling Model
The reactive power-optimization and scheduling model for an active distribution network with distributed energy storage consists of three main parts: model establishment, algorithm solution, and load regulation.
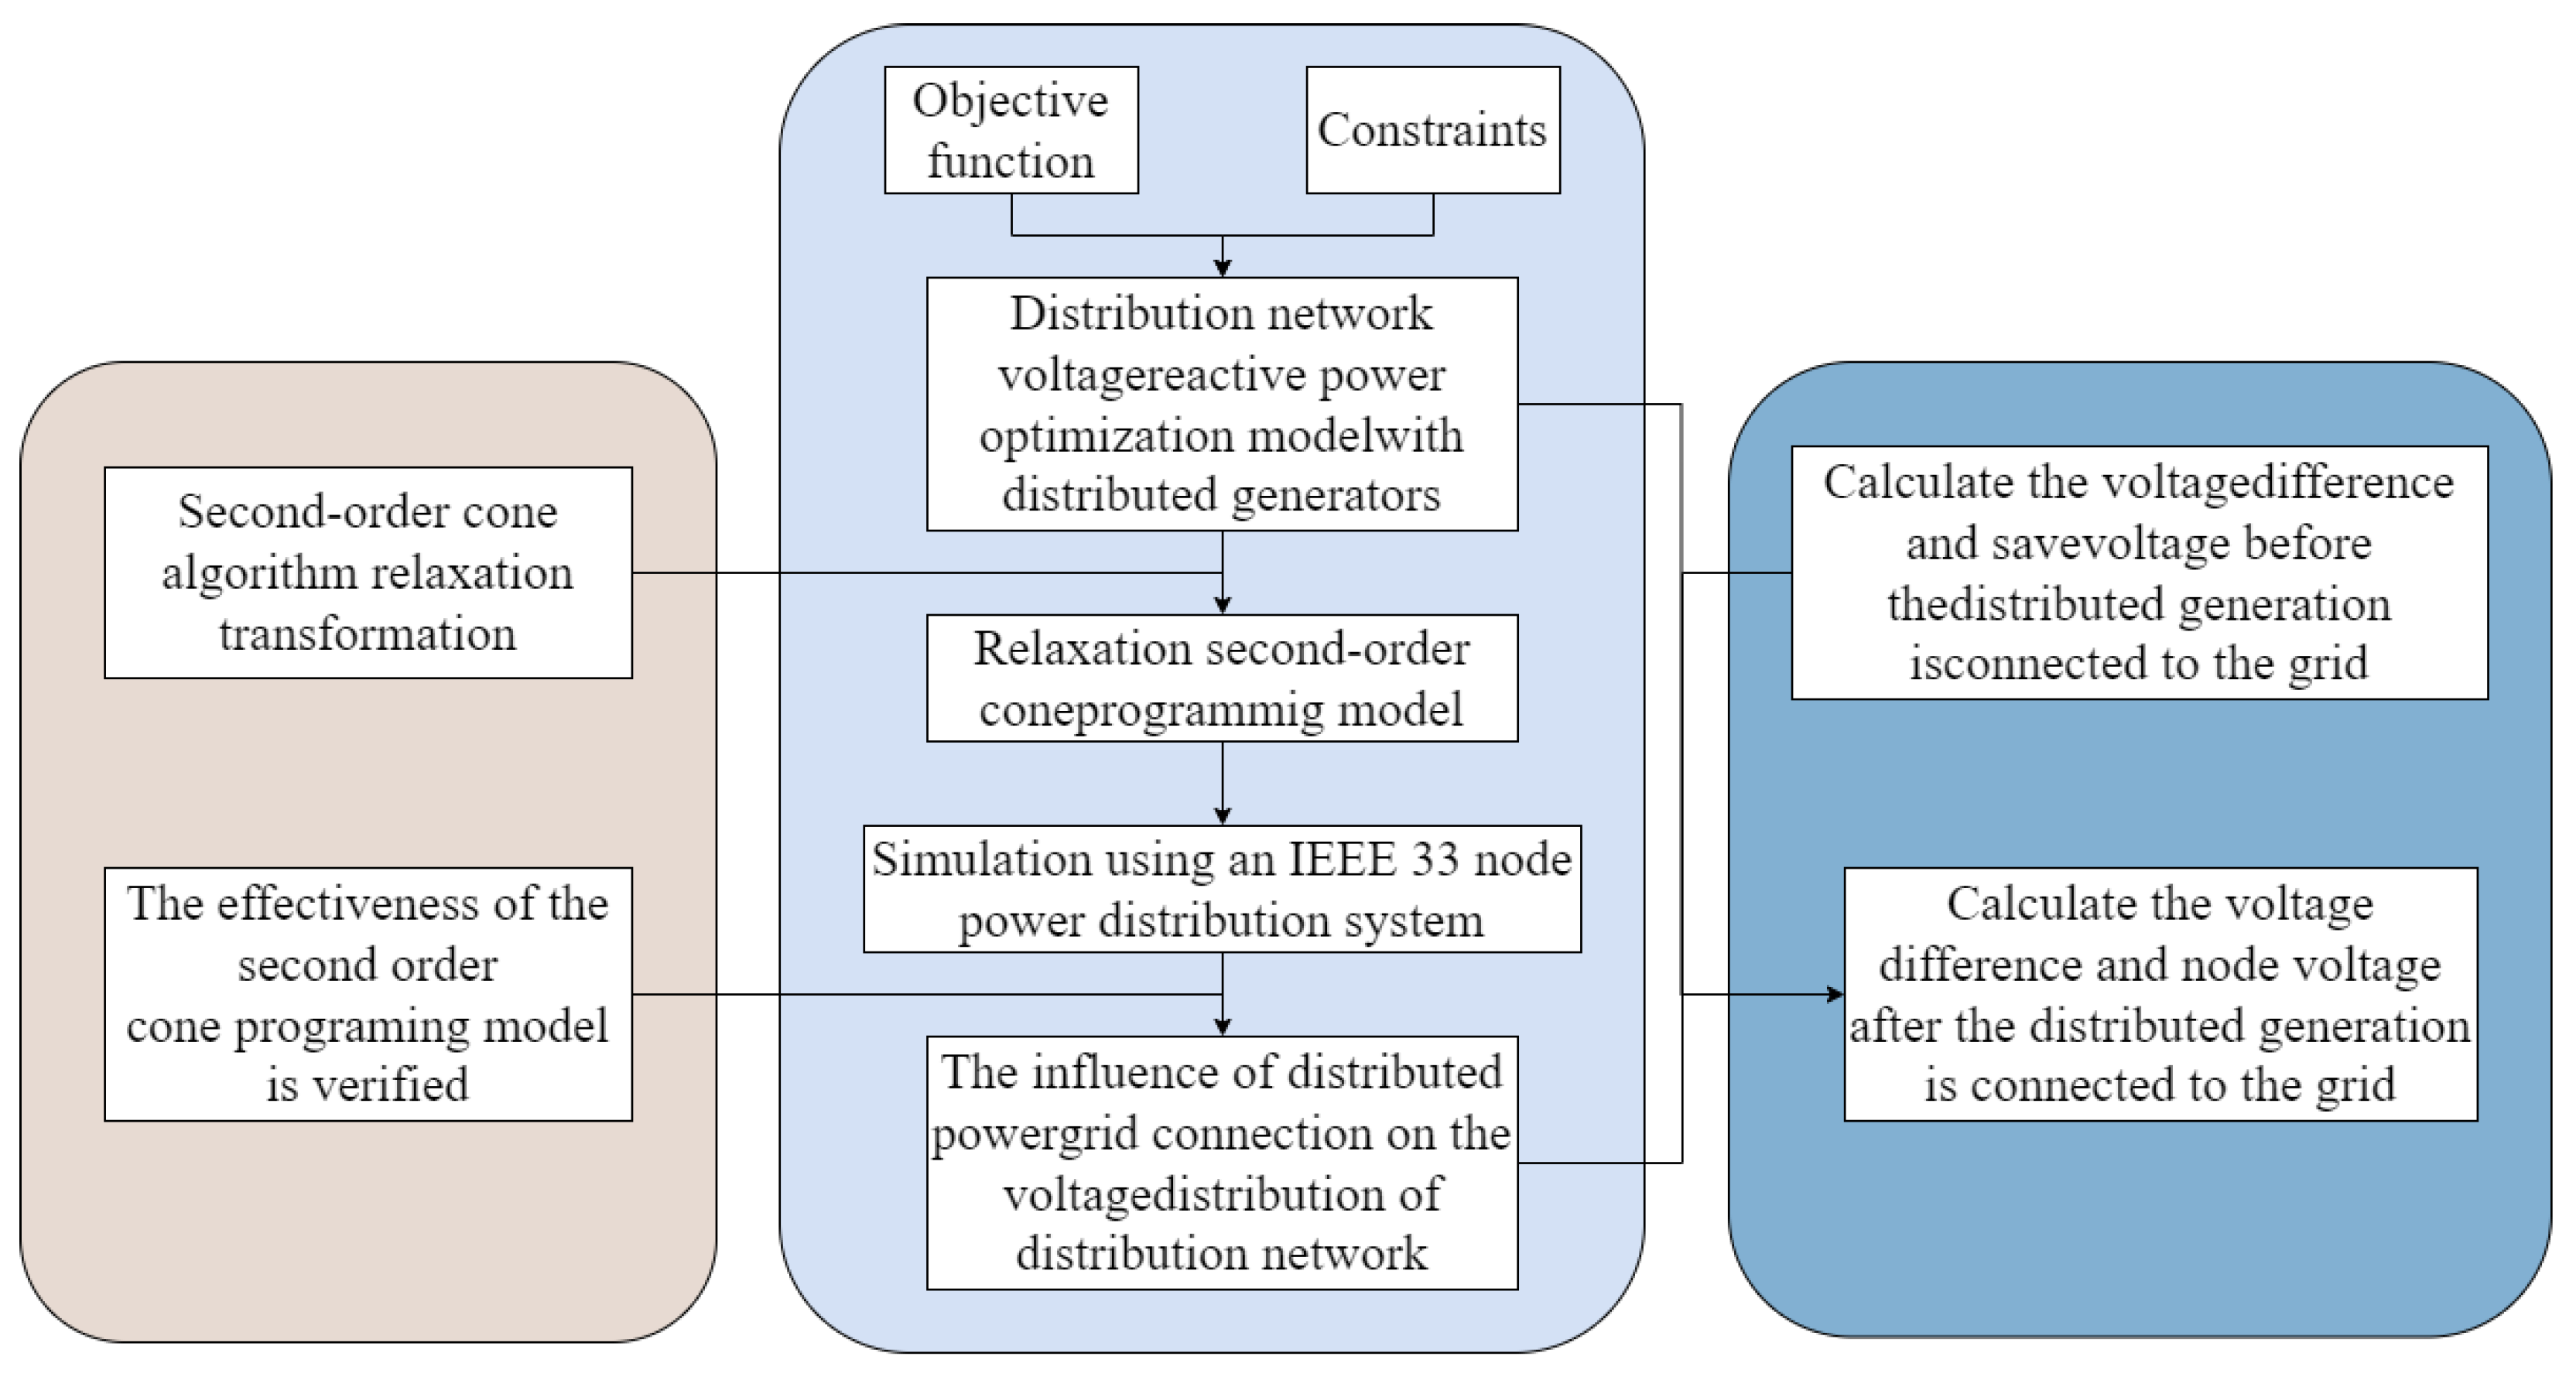
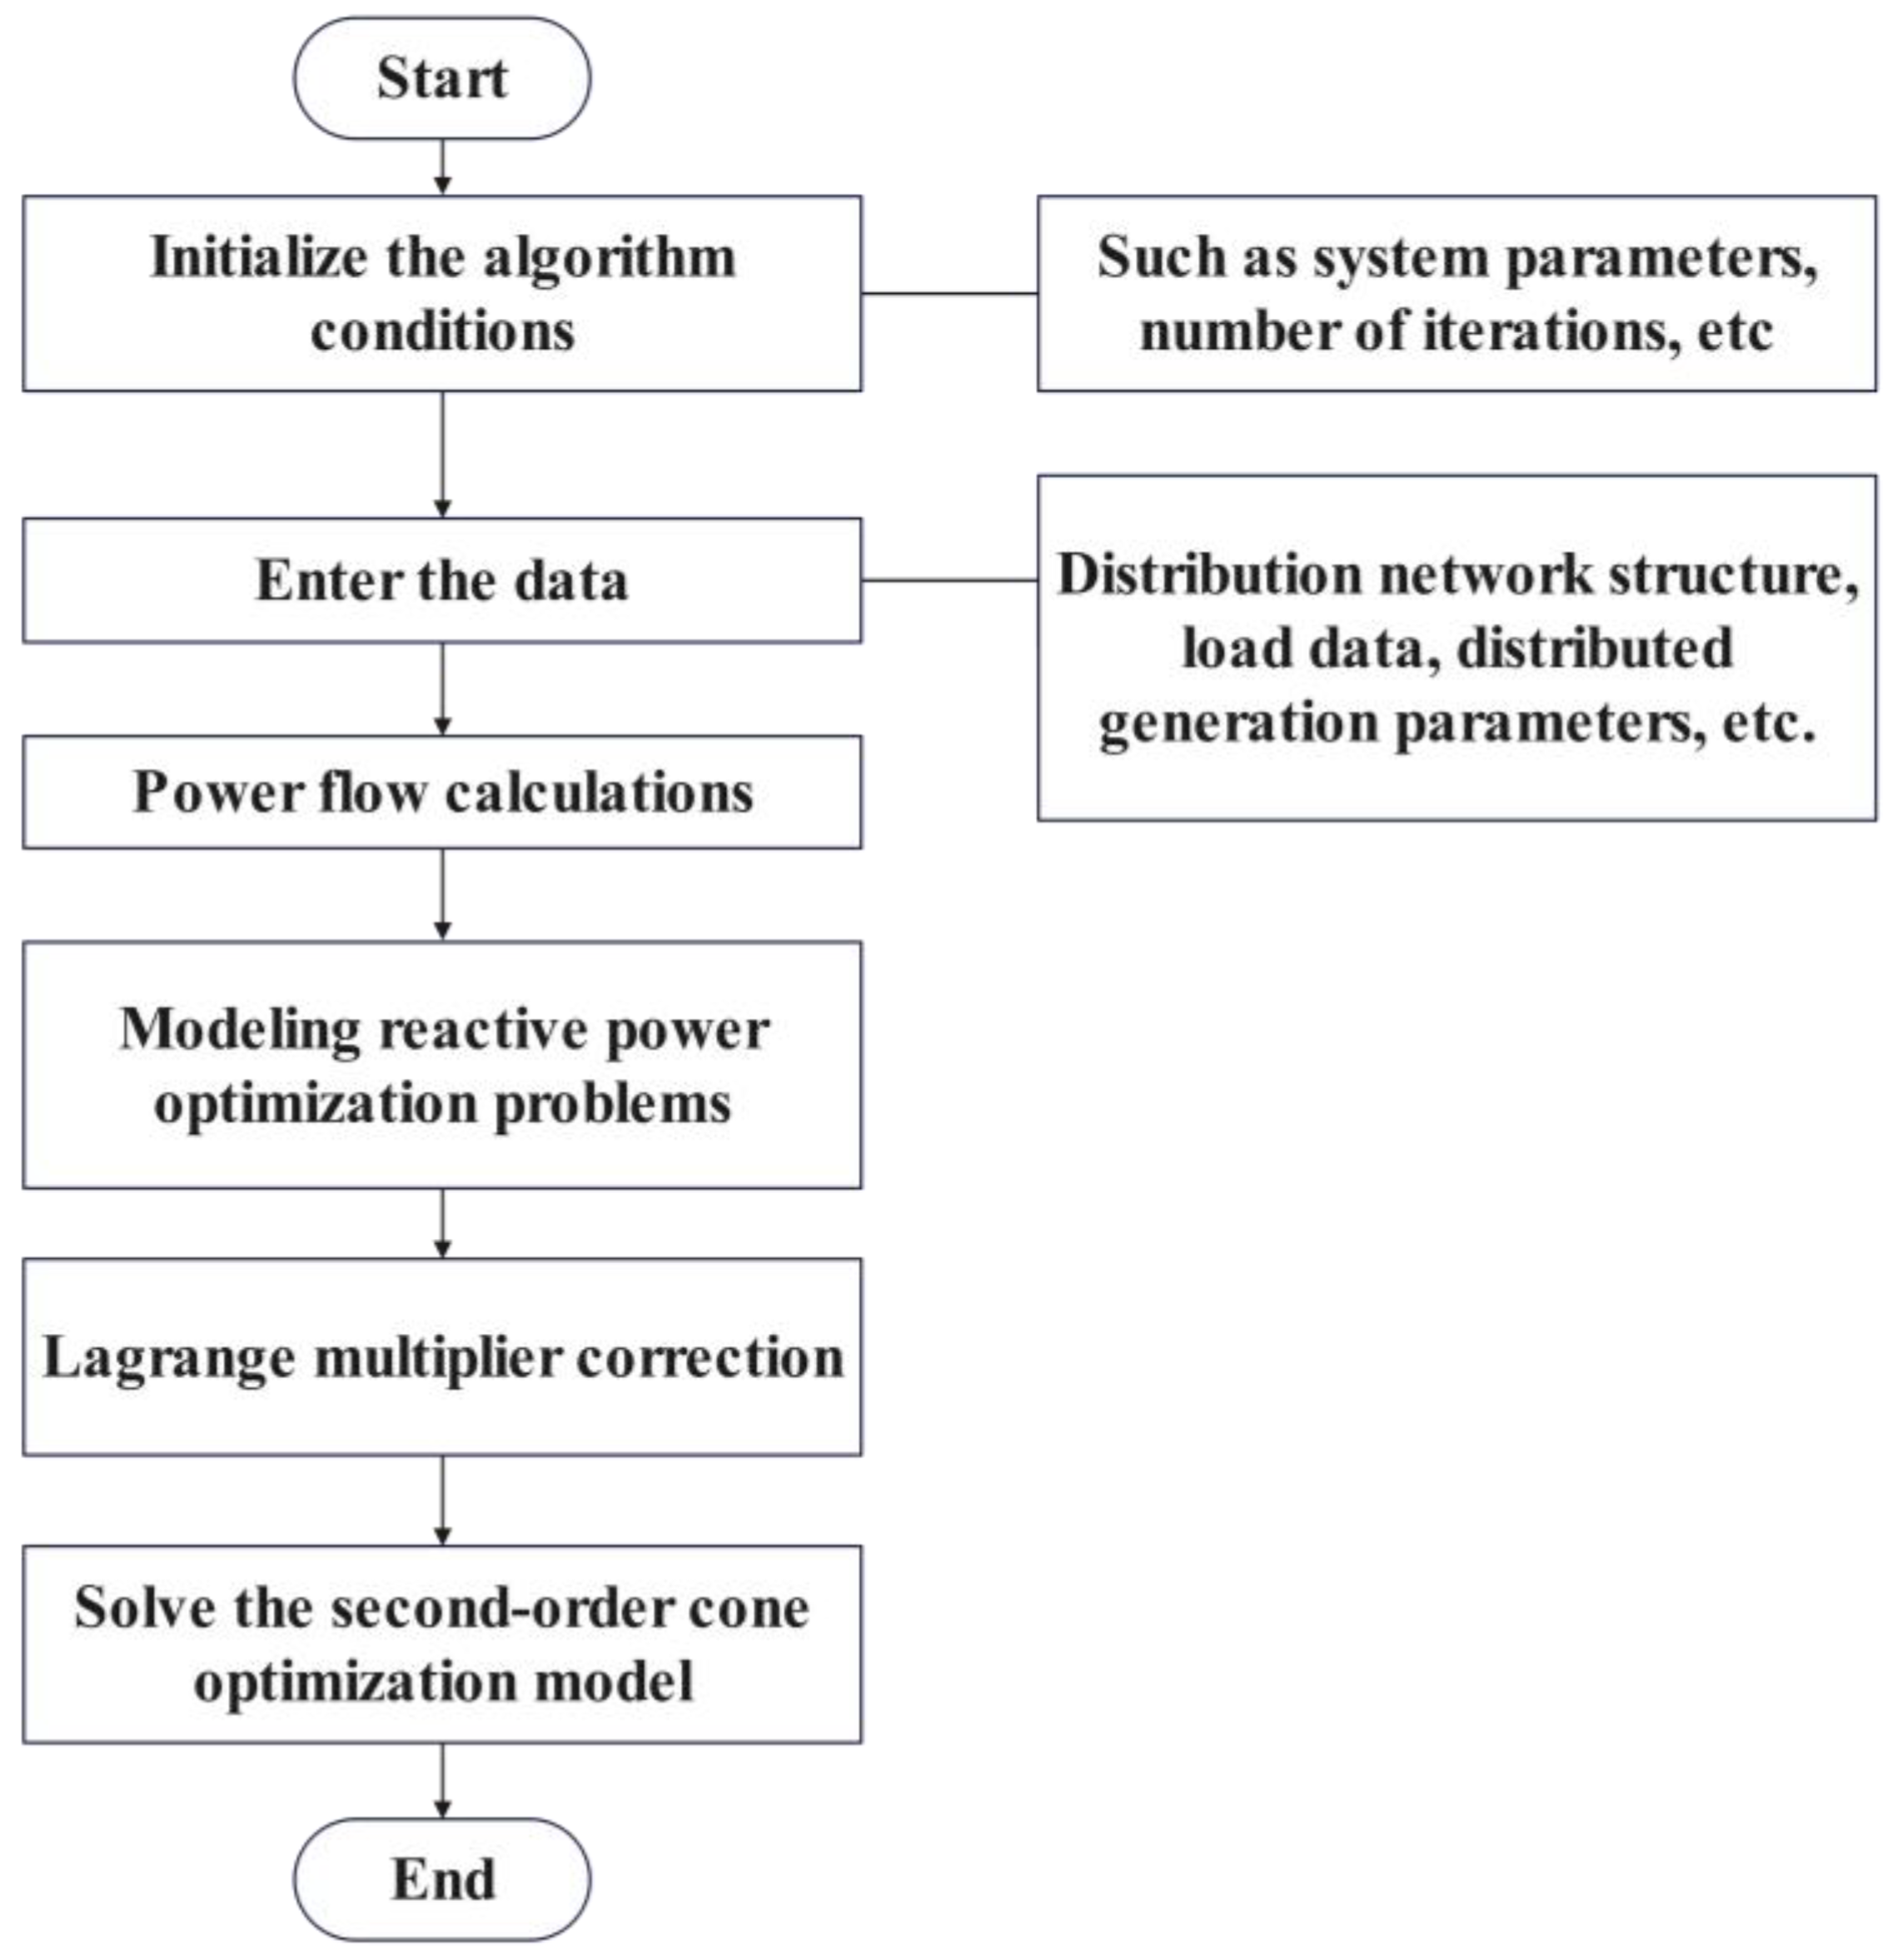
Firstly, after determining the impact of the integration of distributed energy sources on the voltage distribution in the distribution network, we calculate the voltage difference before the integration of distributed energy sources and the node voltage when the power factor of residential loads is high. Subsequently, the node voltage and voltage difference after the integration of distributed energy sources into the distribution network are calculated, demonstrating that the possibility of exceeding the upper limit of node voltage increases when the output power of distributed energy sources is too high. Next, a voltage-reactive power optimization model for the distribution network with distributed energy sources is established. The objective function is to minimize network losses, including line, inverter, and system energy losses. Constraints are modeled around these components and include branch flow constraints, voltage magnitude constraints, load power constraints, inverter capacity constraints, and energy-storage system capacity constraints. After completing the overall model establishment, the second-order cone relaxation algorithm is chosen to relax the phase angle of the objective function, transforming it into a function related to a certain optimization variable. This results in the corresponding relaxed second-order cone programming model, and the optimization is carried out using the second-order cone’s phase angle relaxation method. The model is then applied to the IEEE 33-node distribution system with preset parameters to obtain the corresponding optimization results, ultimately demonstrating the effectiveness of the second-order cone programming algorithm in reactive power optimization. The technical roadmap of the second-order cone programming model is shown in Figure 1.
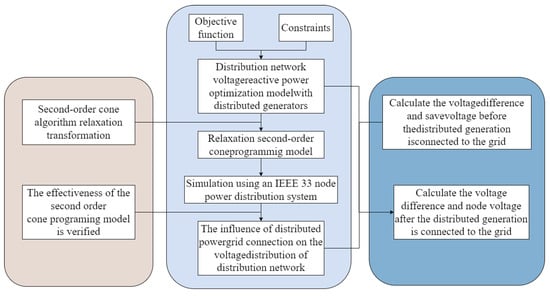
Figure 1.
Second-order cone programming model.
3.1.1. Objective Function
The major issue with traditional distribution networks lies in their slow response to load variations, typically limited to hourly adjustments. In particular, the parallel operation of capacitor units and voltage regulators makes the control of traditional distribution networks cumbersome. However, in an active distribution network where photovoltaic (PV) inverters serve as reactive power-regulation devices, the system can adapt to rapid control changes on a minute-by-minute scale. This aligns well with the fluctuating demands associated with renewable energy generation. Therefore, this model considers the study of the inverter’s short-term reactive power-optimization calculation in the active distribution network.
In this paper, we establish an optimal period of 24 h and formulate an objective function for minimizing the active power loss in the distribution network throughout the day. The objective function is expressed as follows:
In the above equation, represents the total active power loss in the distribution network over the entire day; represents the branch connecting node and node ; represents the set of branches in the distribution network; is the total number of time periods in a day; is the resistance of branch ; is the time period index, and represents the current through branch during time period .
3.1.2. Constraints
The development of active distribution networks has reached a certain stage where more controllable units can be connected. Through adjustments to these controllable units, the optimization of distribution network scheduling can be achieved. Constraints are imposed based on distributed energy sources, discrete reactive compensation devices, and continuous reactive compensation devices. Optimal power flow constraints are established according to the distribution network’s power flow and the outputs of control units.
- (1)
- Branch Flow Constraints
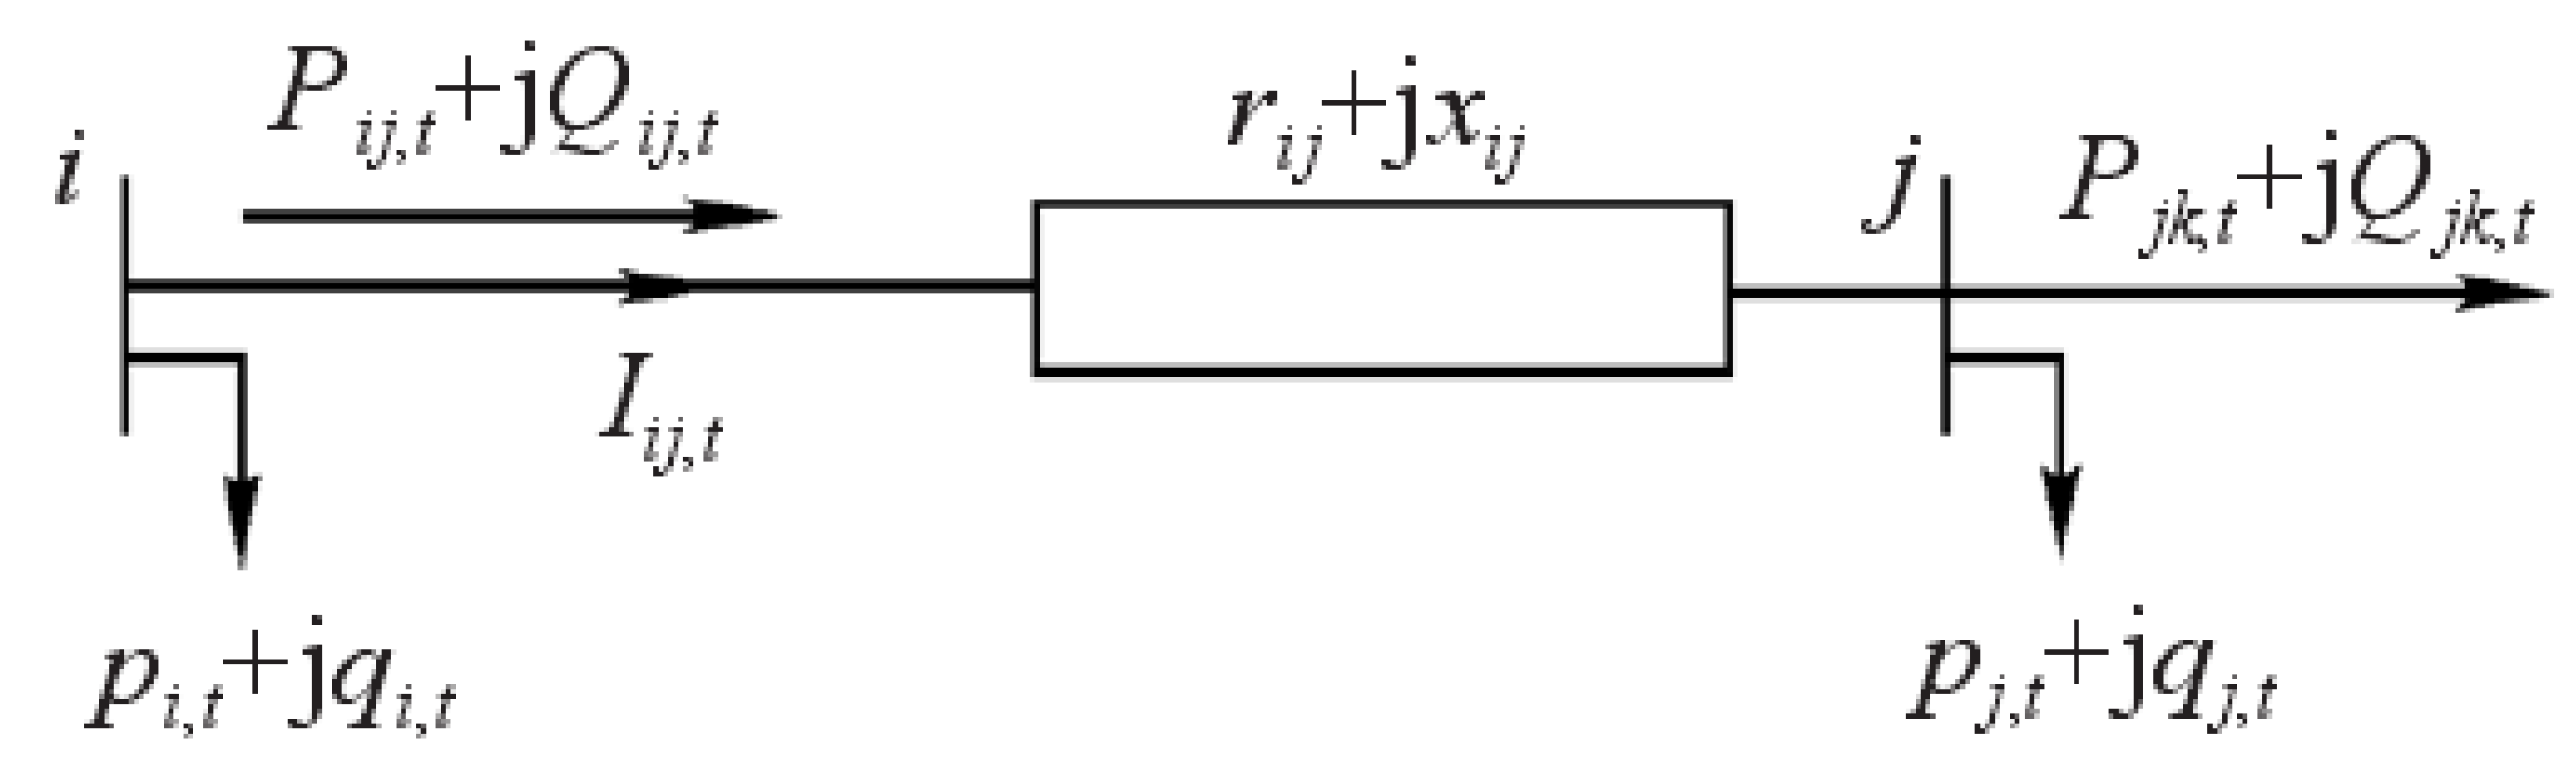
Taking a radial distribution network as an example, the analysis focuses on establishing the branch flow model for a specific branch at time . The model is shown in Figure 2:

Figure 2.
Slip flow model.
The branch flow for this specific branch should satisfy the following constraints:
In the above equation, and are the node indices; and are the voltages at nodes and , respectively. and are the active power injections at nodes and , respectively; and are the reactive power injections at nodes and , respectively; and are the active and reactive power at the sending end of branch , respectively; represents the impedance of branch ; and represent the active and reactive power at the sending end of branch , respectively; is the set of child nodes with node as the parent node.
- (2)
- Distributed Generation Operation Constraints
If node is connected to a Distributed Generation (DG) unit, the output range should satisfy the following constraints:
In the above equation, represents the actual output of the DG installed at node during time period ; is the maximum allowable output of the DG during time period . The model assumes that the output of DG is continuous.
- (3)
- Constraints on Discrete Reactive Power Compensation Devices
If the capacitor bank (CB) is connected with group switching, the reactive power compensation is a discrete variable, and CB must satisfy the following constraints:
In the above equation, represents the reactive power compensation capacity of the capacitor bank at node during time period , is the number of CB groups activated (integer), is the reactive power compensation capacity of each capacitor bank group, is the maximum number of activated groups, and is the set of integers.
- (4)
- Constraints on Continuous Reactive Power Compensation Devices
If the static reactive power compensation device is continuous, the reactive power compensation is also continuous. Therefore, the operational constraints for SVC are as follows:
In the above equation, represents the reactive power compensation amount of the SVC device at node during time period , and and are the minimum and maximum reactive power compensation values of the SVC device.
- (5)
- Node Voltage Constraints
Distribution network loads exhibit characteristics of time-series variation. If we consider the characteristics of distributed power supply and reactive power compensation devices, it will affect the system operation. To ensure that the system node voltage operates normally in each time period, node voltage constraints are set as follows:
In the above equation, and represent the lower and upper limits of the node voltage operation, respectively.
3.2. Second-Order Cone Algorithm
Second-Order Cone Programming (SOCP) is a novel approach to linear programming. Currently, there has been significant development in the techniques for solving SOCP. Methods, such as dual interior-point methods and commercial solvers, can be applied to solve optimal power flow problems based on Second-Order Cone Programming. Furthermore, SOCP is a special form of convex programming, meaning that a unique global optimal solution can be obtained by solving SOCP.
The standard formulation of Second-Order Cone Programming is as follows:
In the above equation, the variables and are the second-order cone or rotated second-order cone as defined in the following expression:
Second-order cone:
Rotated second-order cone:
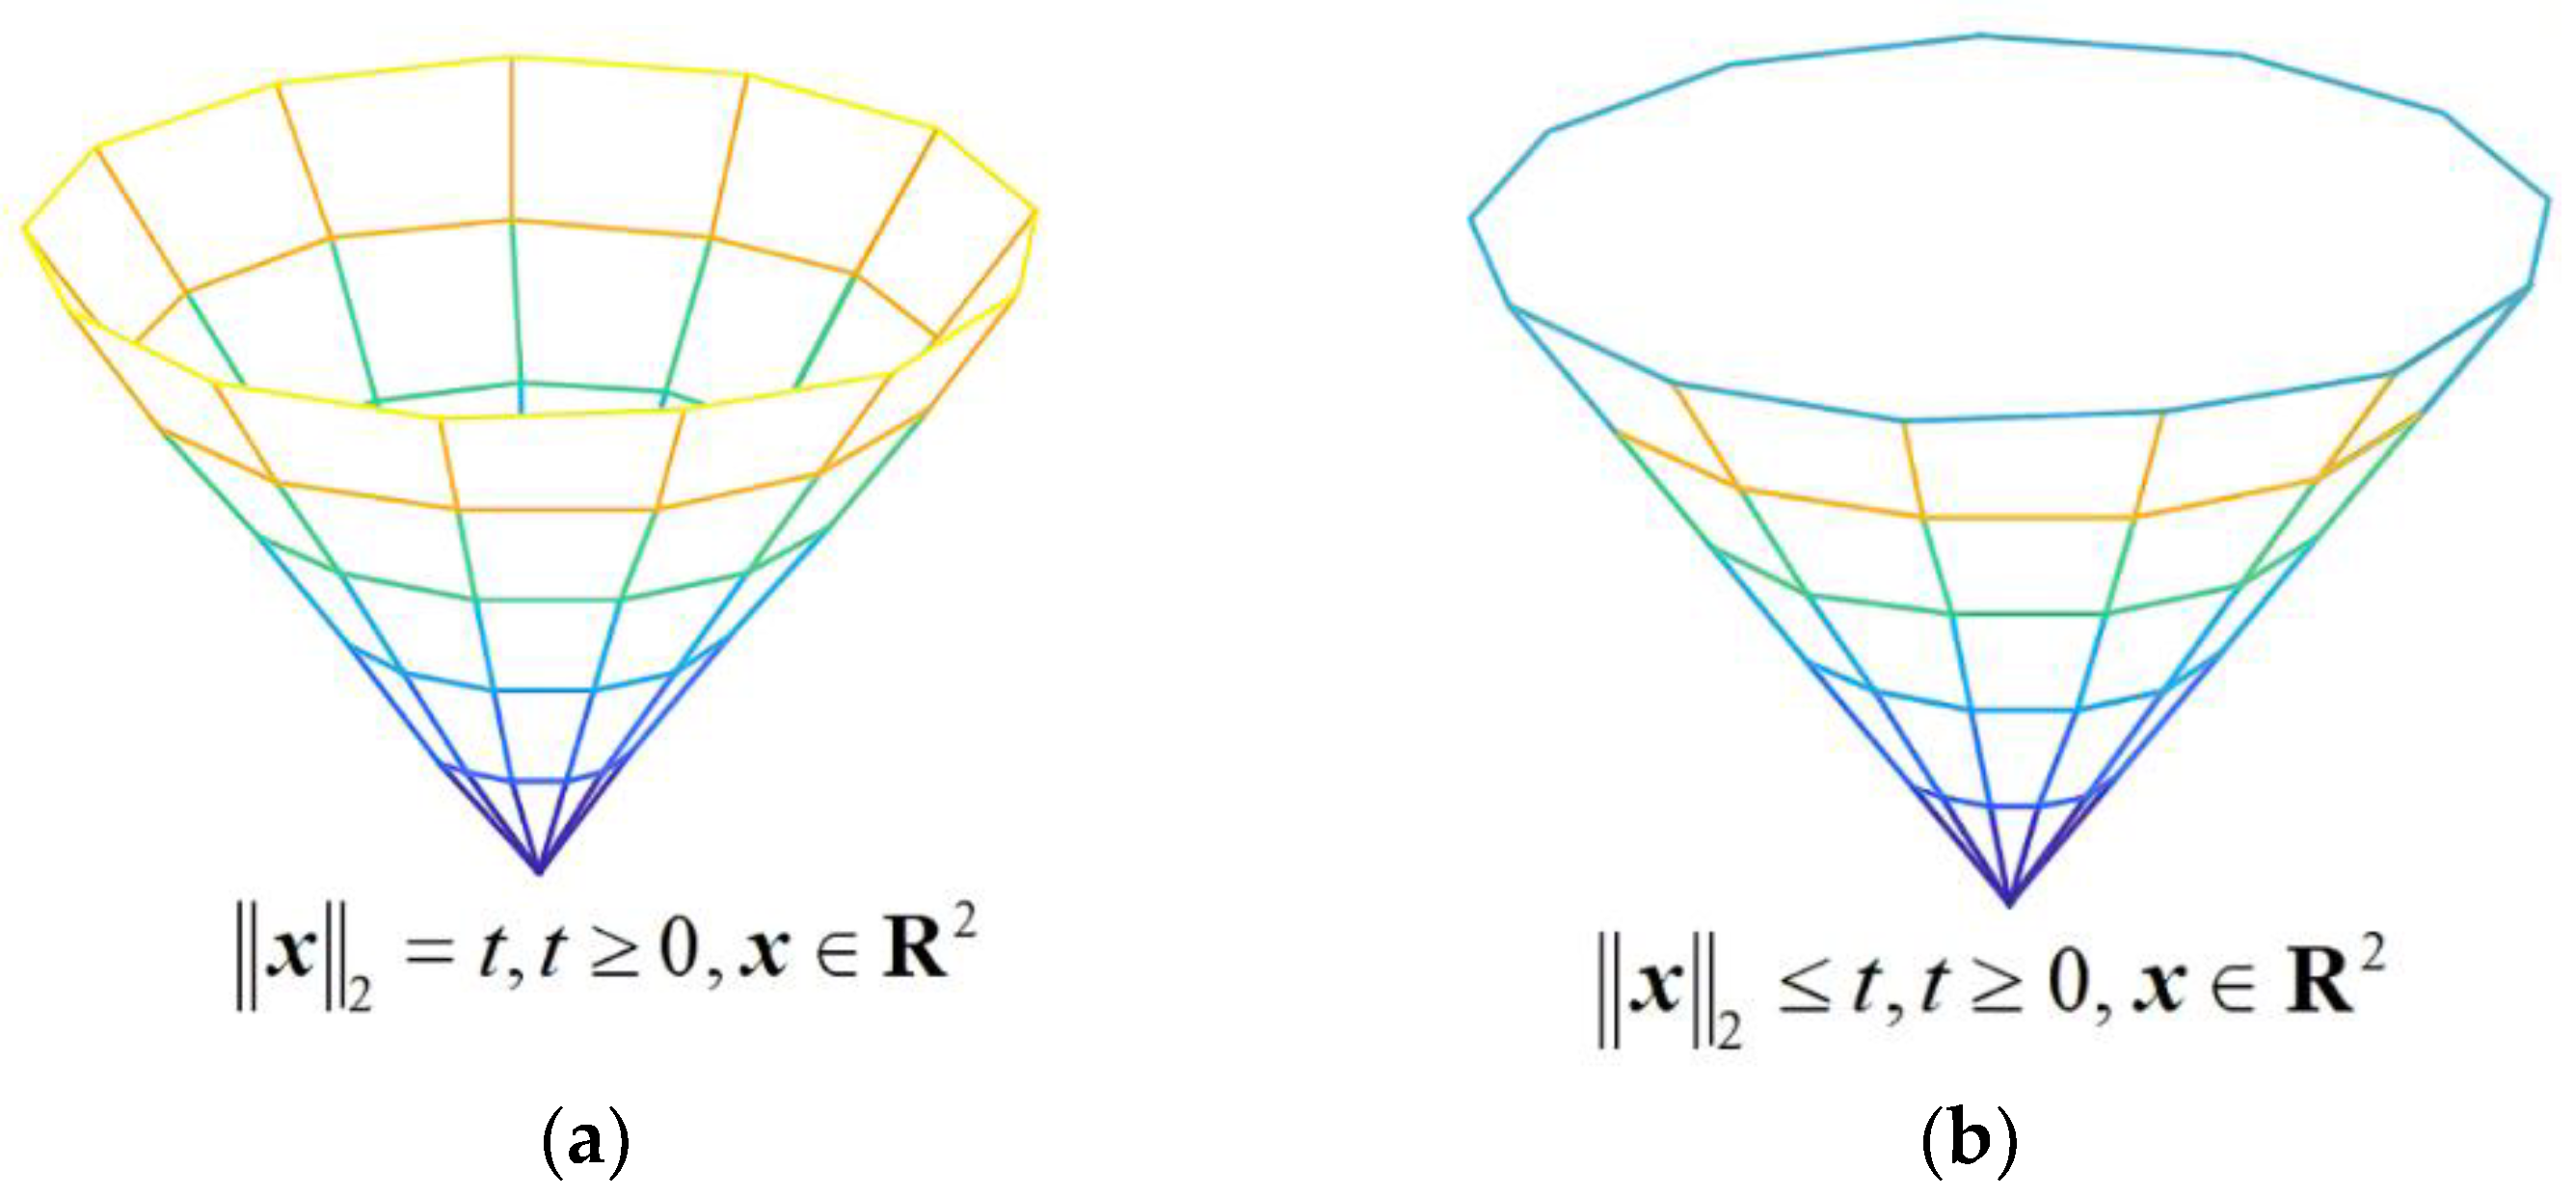
The relaxed theory and relaxation algorithm for the second-order cone program involve two aspects: relaxation and convergence after the superposition of second-order cone programs. Initially, the challenging nonlinear constraints are relaxed into second-order cone constraints that are easier to solve. Simultaneously, an appropriate optimization objective function is set to drive the second-order cone relaxation to “tighten” the optimal solution. The concept of relaxation tightening is illustrated in the following Figure 3:
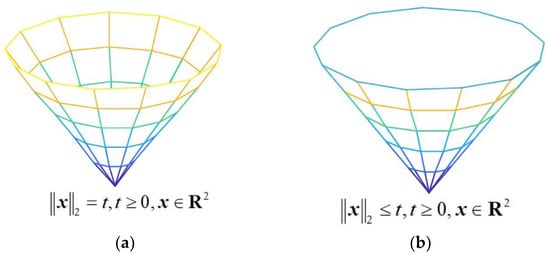
Figure 3.
Second-order cone relaxation tightening model. (a) pre-relaxation; (b) post-relaxation.
If the objective function is an increasing function of branch currents and the network is a radial-type network, then the use of second-order cone relaxation would be quite precise. The algorithm steps of the second-order cone relaxation algorithm are shown in Figure 4. The operators specified in MATLAB for executing the second-order cone algorithm and their respective functionalities are presented in Table 1.
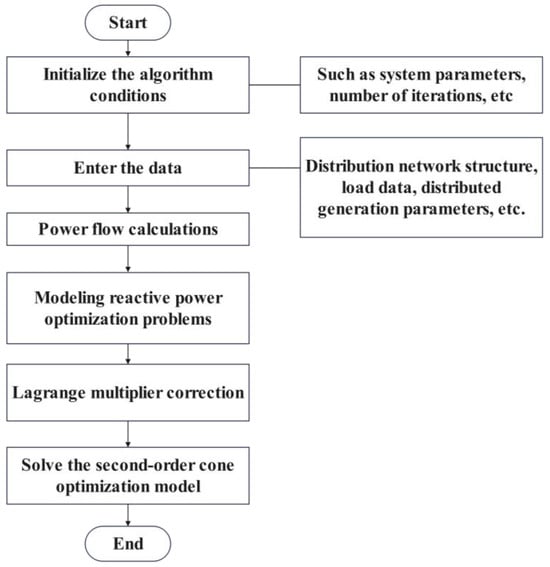
Figure 4.
Solving steps of relaxation algorithm.

Table 1.
Operators defined in matlab and their purposes.
3.3. Power Quality Control
In contrast to traditional power grids, improvements in this project involve three components in the Active Distribution Network’s power quality control. The first component entails the installation of IDUs and safety interlocking devices between two substations. By controlling the interlocking in a normal state, the current impact of the interlocking at substation A is examined for corresponding quality. This is achieved through software adjustments, and the feedback from substation B regulates the acceptance of the current from substation A. The loop closing device in the substation is shown in Figure 5.
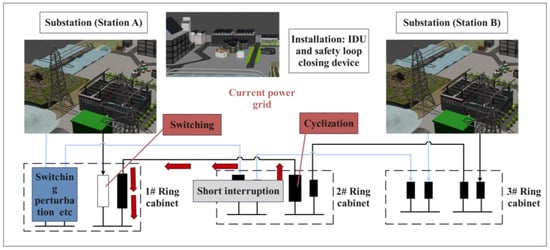
Figure 5.
Loop closure device inside the substation.
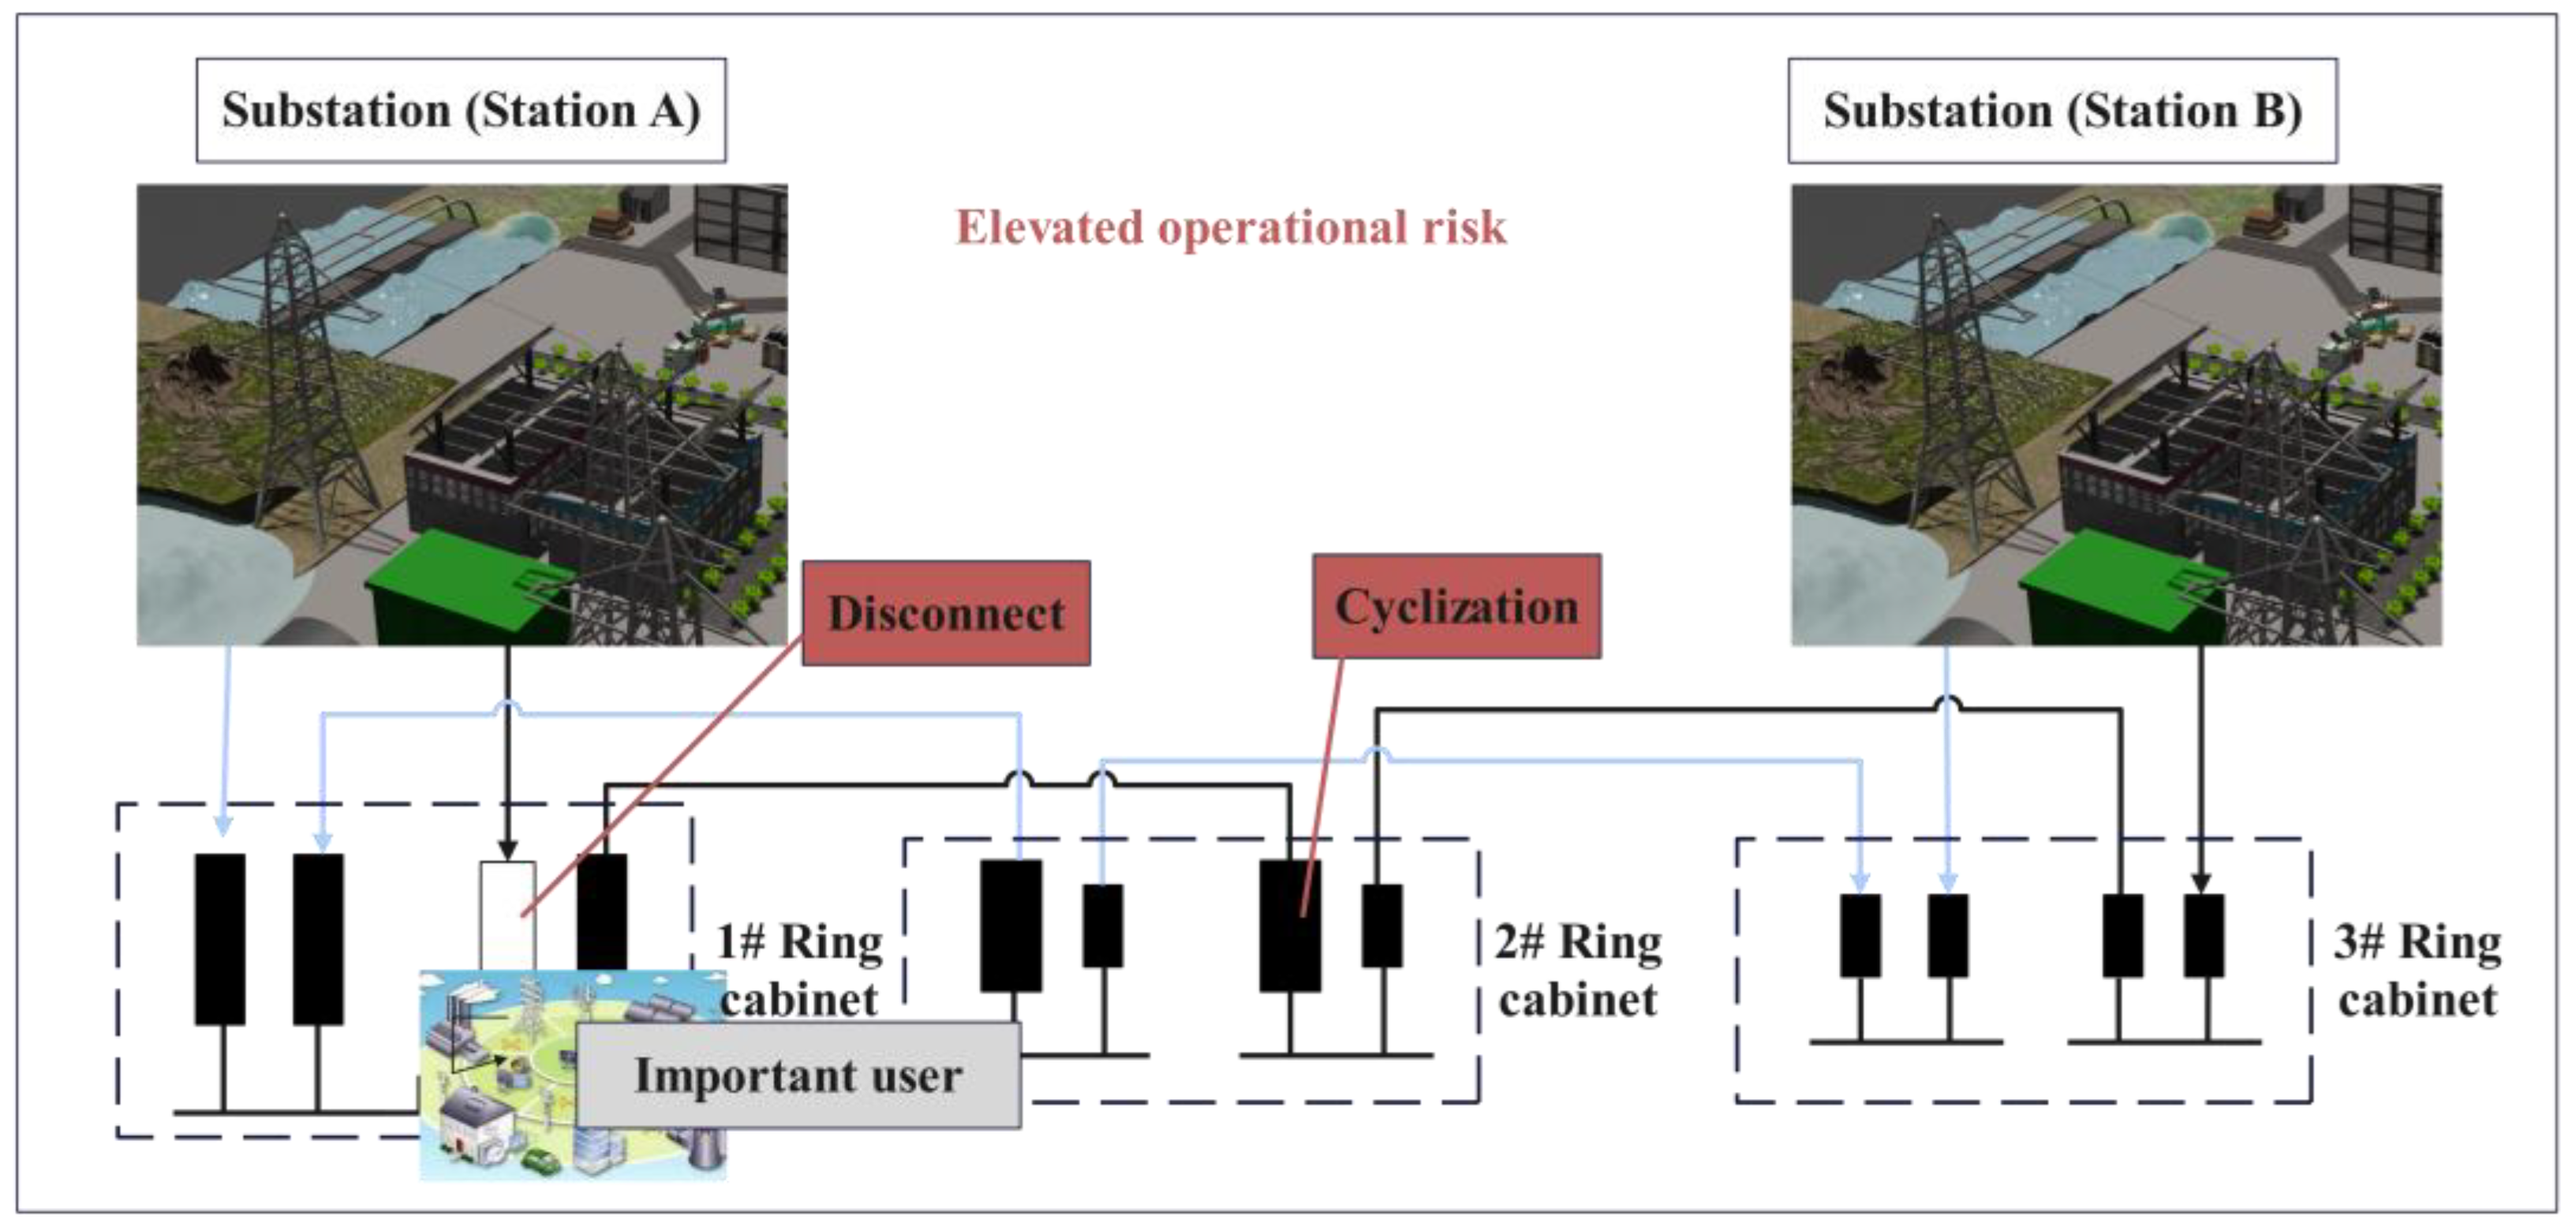
The second component involves risk management for key users. If the interlocking system detects an increased operational risk at substation A, the emergency disconnection of critical users is executed through the interlocking device. This prevents voltage elevation from affecting the electricity consumption for critical users. The loop closing device for the client is shown in Figure 6.

Figure 6.
Loop closure device at the user end.
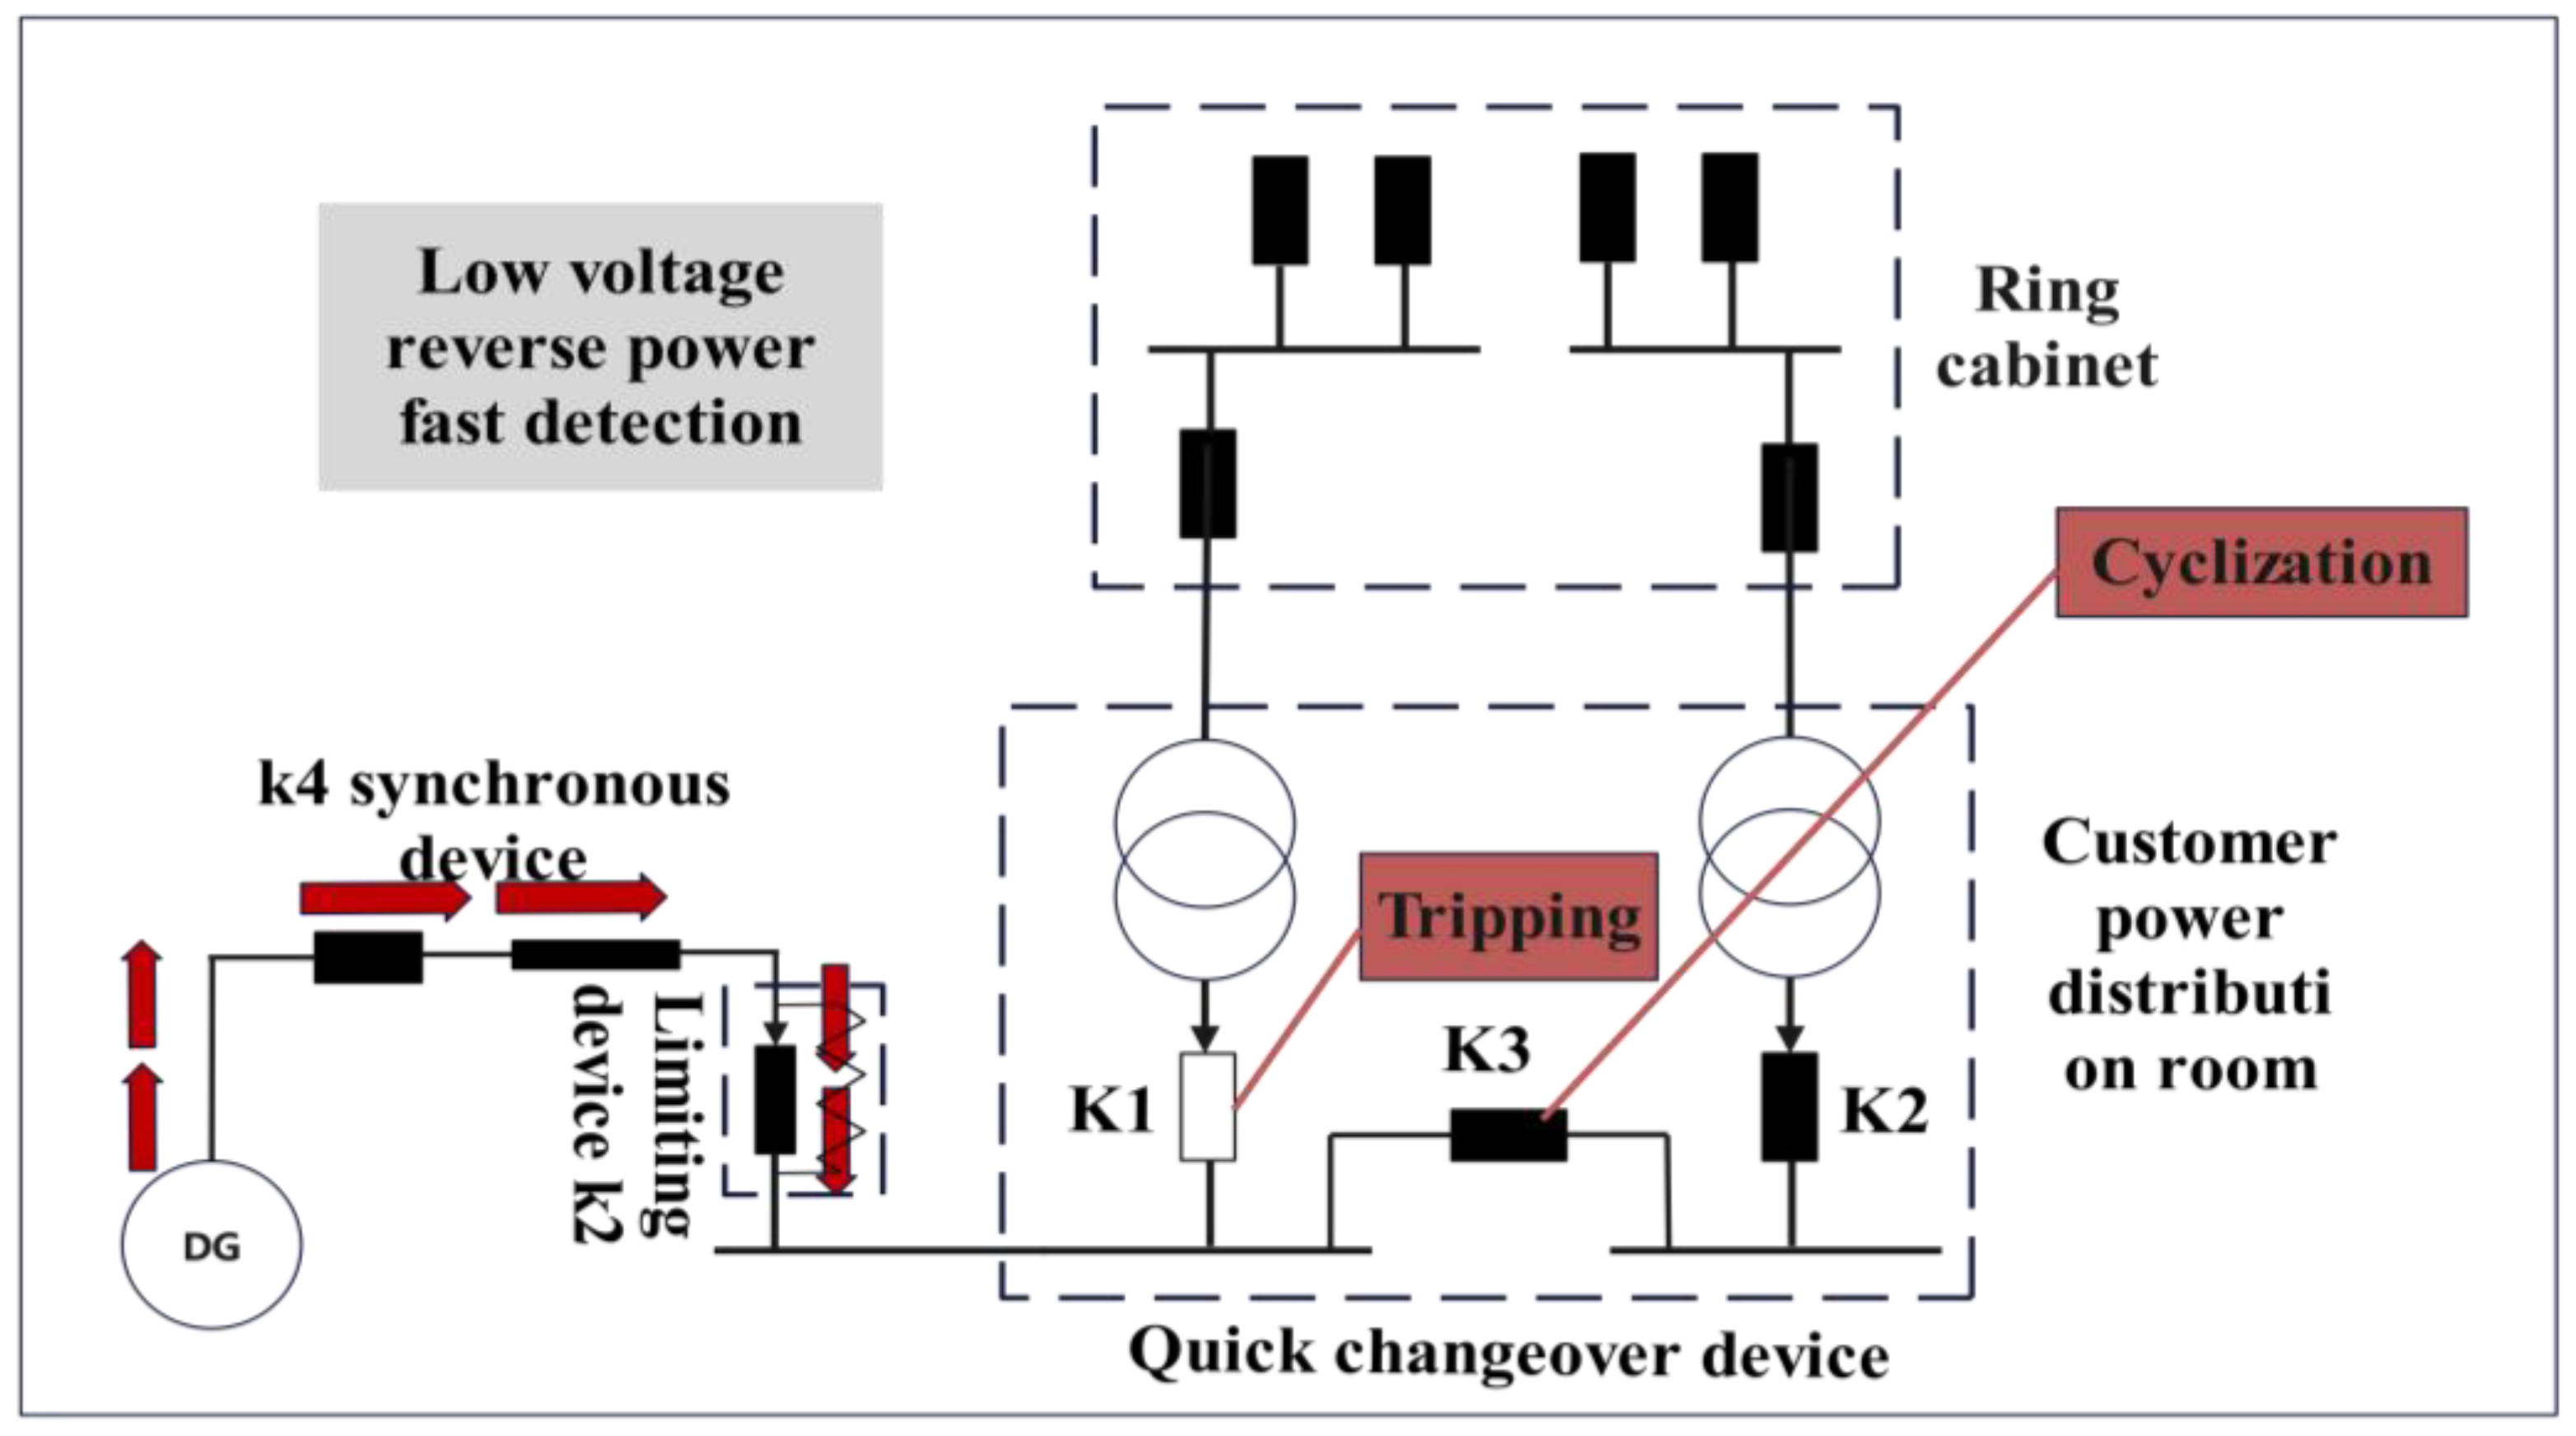
The third component involves designing a corresponding loop cabinet for the fast detection of low voltage and reverse power to achieve rapid switching during temporary voltage drops and short interruptions. The central control unit adjusts independently, and the supply to critical users is switched through the tripping and loop closure of the fast-switching device. The switching device for voltage dips and short interruptions is shown in Figure 7.

Figure 7.
Voltage dip and short interruption switching device.
The implementation of power quality control in active distribution networks enables efficient management and optimized scheduling of the distribution grid. This contributes to enhancing the reliability, safety, and economic efficiency of the power grid. It aids power utility companies in reducing power losses, improving supply quality, and meeting the electricity needs of users, thereby promoting the sustainable development of the power system. The main evaluation criteria of power quality are shown in Table 2.
Table 2.
The main criterion of power quality.
4. Experiments and Result
4.1. Model Solution
Firstly, introduce the variable through Equation (10), that is
In the equation, and represent the square of the voltage at node and the square of the current in branch during time period , respectively.
The objective function and constraints (2) and (6) of the optimal power flow can be transformed into
It can be observed that Equation (11) is a linear function, and Equations (12) to (14) and Equation (16) are linear constraints, while Equation (15) is a nonlinear equality constraint. In this case, the second-order cone optimization (SOCO) is employed to handle Equation (15), resulting in the following:
After equivalent transformation, Equation (17) can be substituted into the standard second-order cone form, yielding the following:
In the given equation, the symbol denotes the Euclidean norm. By applying transformations to the aforementioned equations, the optimal power flow model is reformulated into a second-order cone optimization problem. The resulting complete expression is provided below:
where some expressions involve integer variables due to the operational constraints of CB, making the final model a Mixed-Integer Second-Order Cone Programming (MISOCP) problem. Additionally, from the discussion of this problem, it is found that the approach to handling second-order cone programming is to relax the constraints to achieve efficient solutions. Although there may be relaxation errors, these errors can be defined as follows:
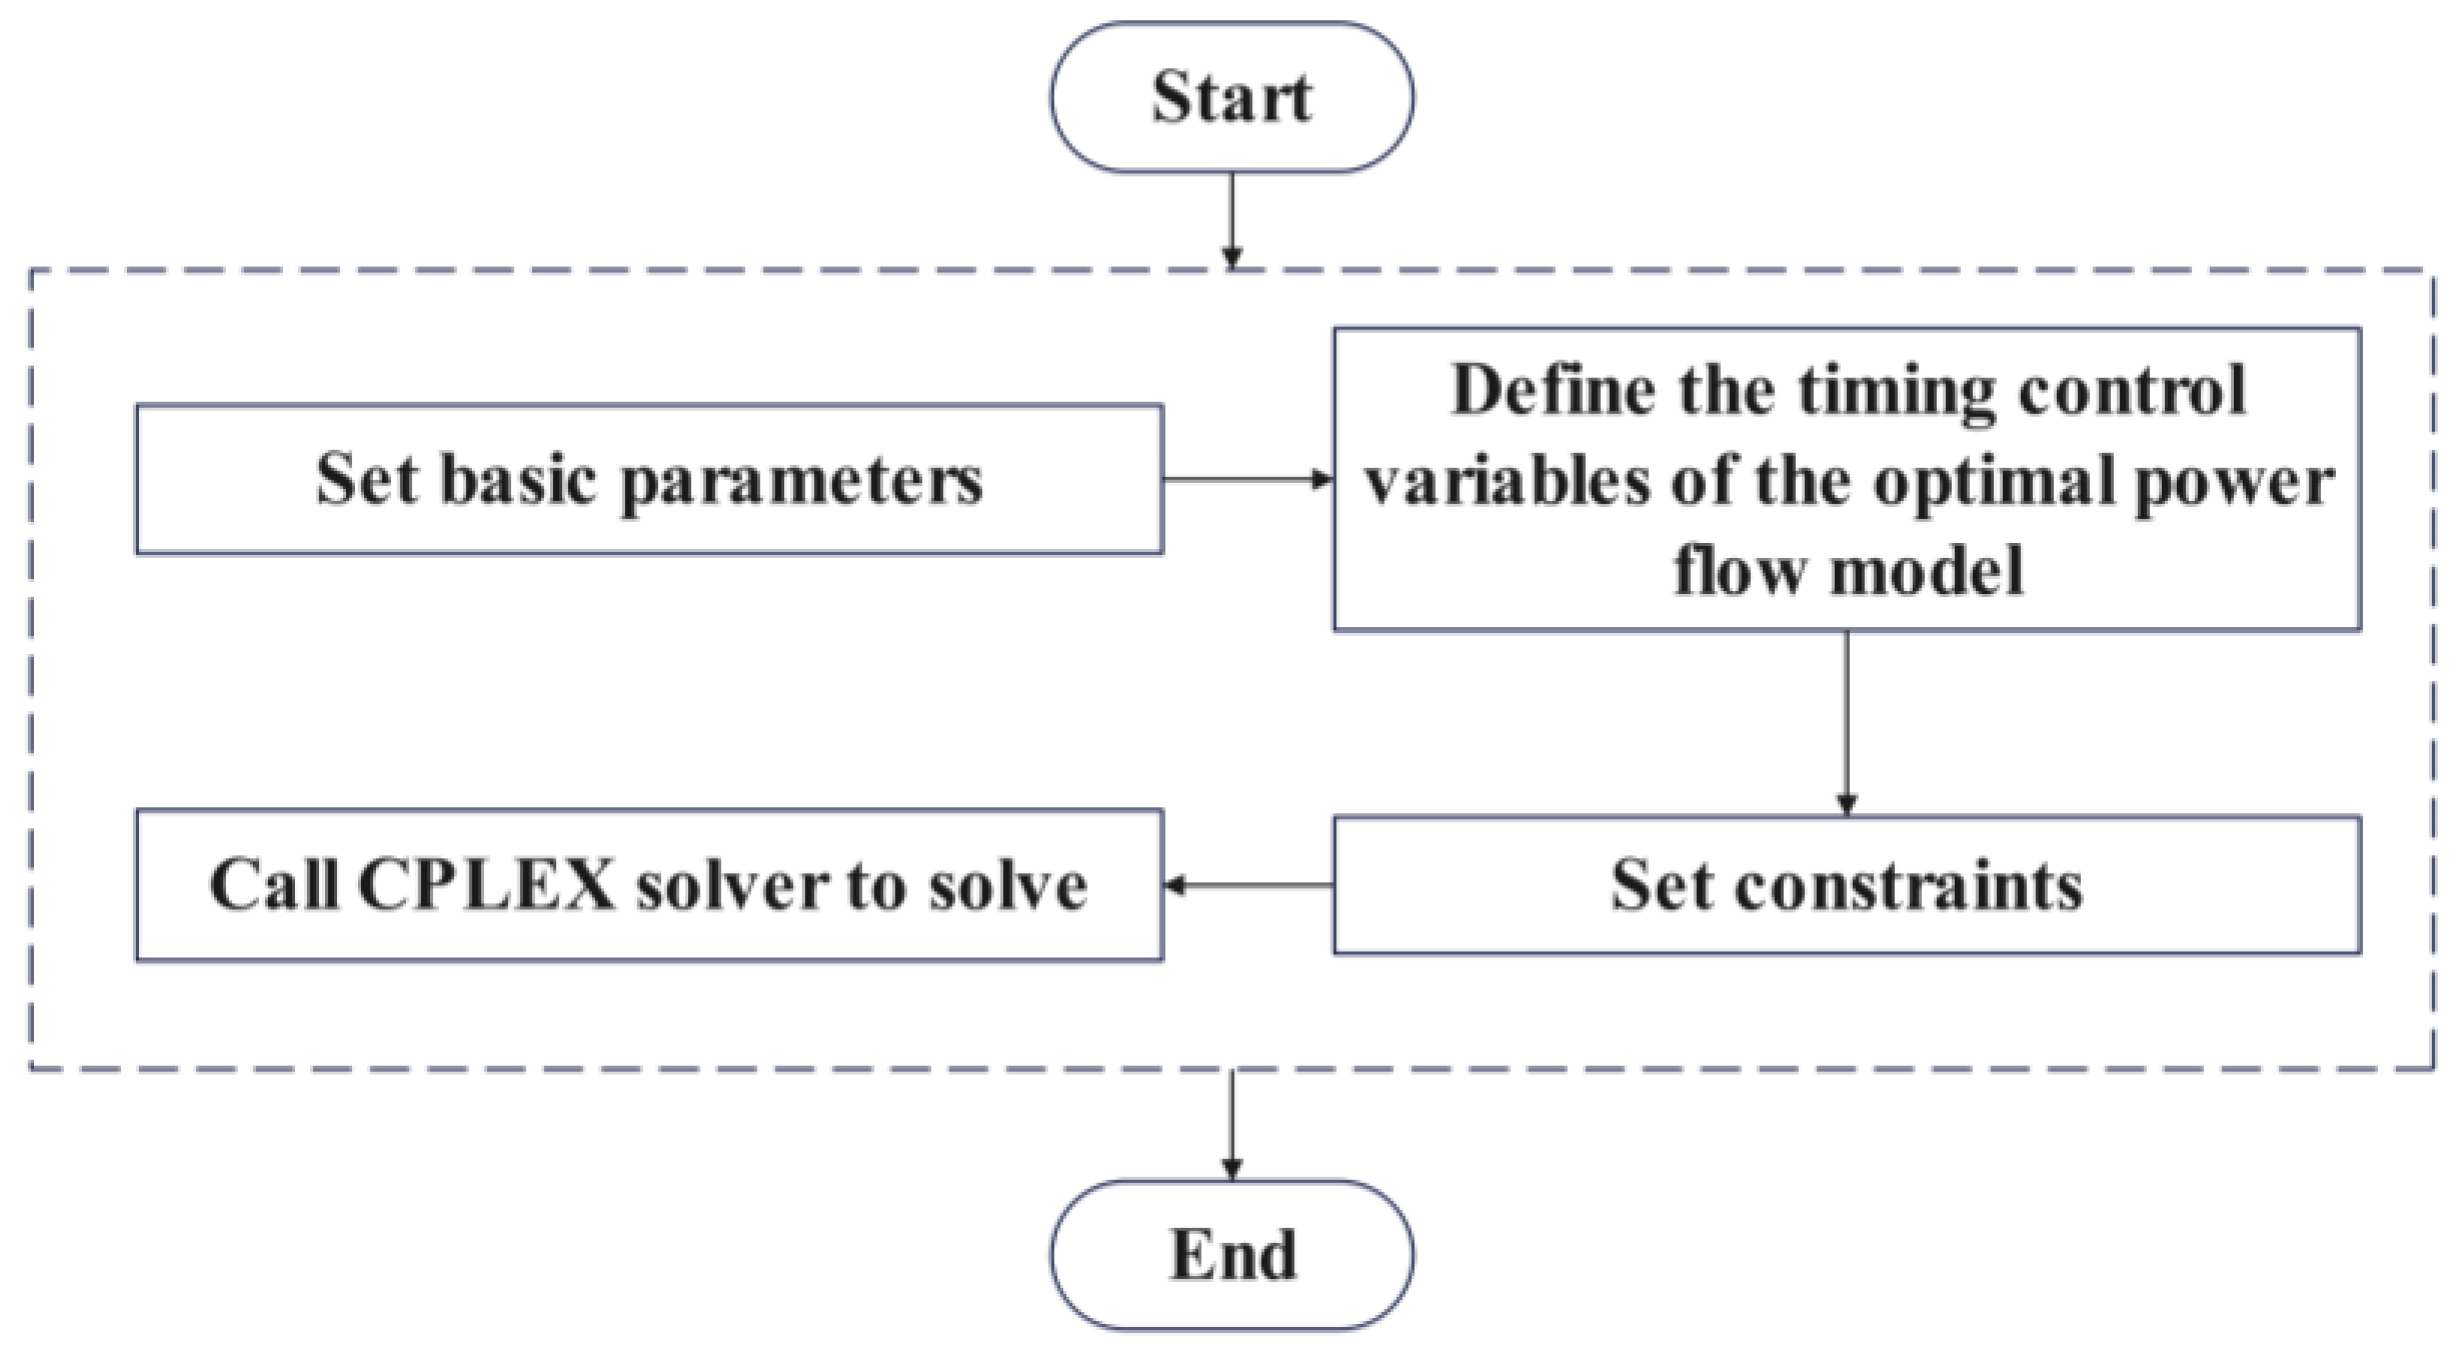
For the minimal second-order cone programming problem, based on the MATLAB platform, the YALMIP modeling package is utilized to formulate the model, set basic parameters of the distribution network grid, branch impedance and DG, define timing control variables for optimal power flow model and set constraints, and use CPLEX solver to solve the model. The implementation process of the program is illustrated in Figure 8.
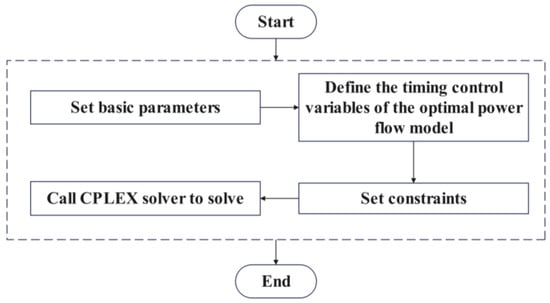
Figure 8.
MATLAB solution process.
4.2. Simulation and Analysis
4.2.1. Simulation System and Parameter Settings
In this study, simulation analysis is conducted using the IEEE 33-bus test case designed with the Matepower toolbox. The IEEE 33-bus system is depicted in Figure 9, and relevant data are presented in Table 3.
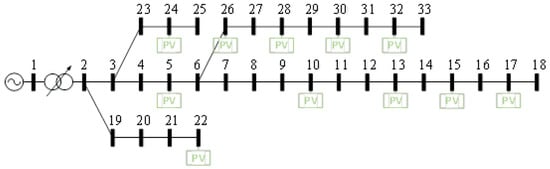
Figure 9.
IEEE 33 nodes.
Table 3.
Branch parameters of IEEE 33-node distribution system.
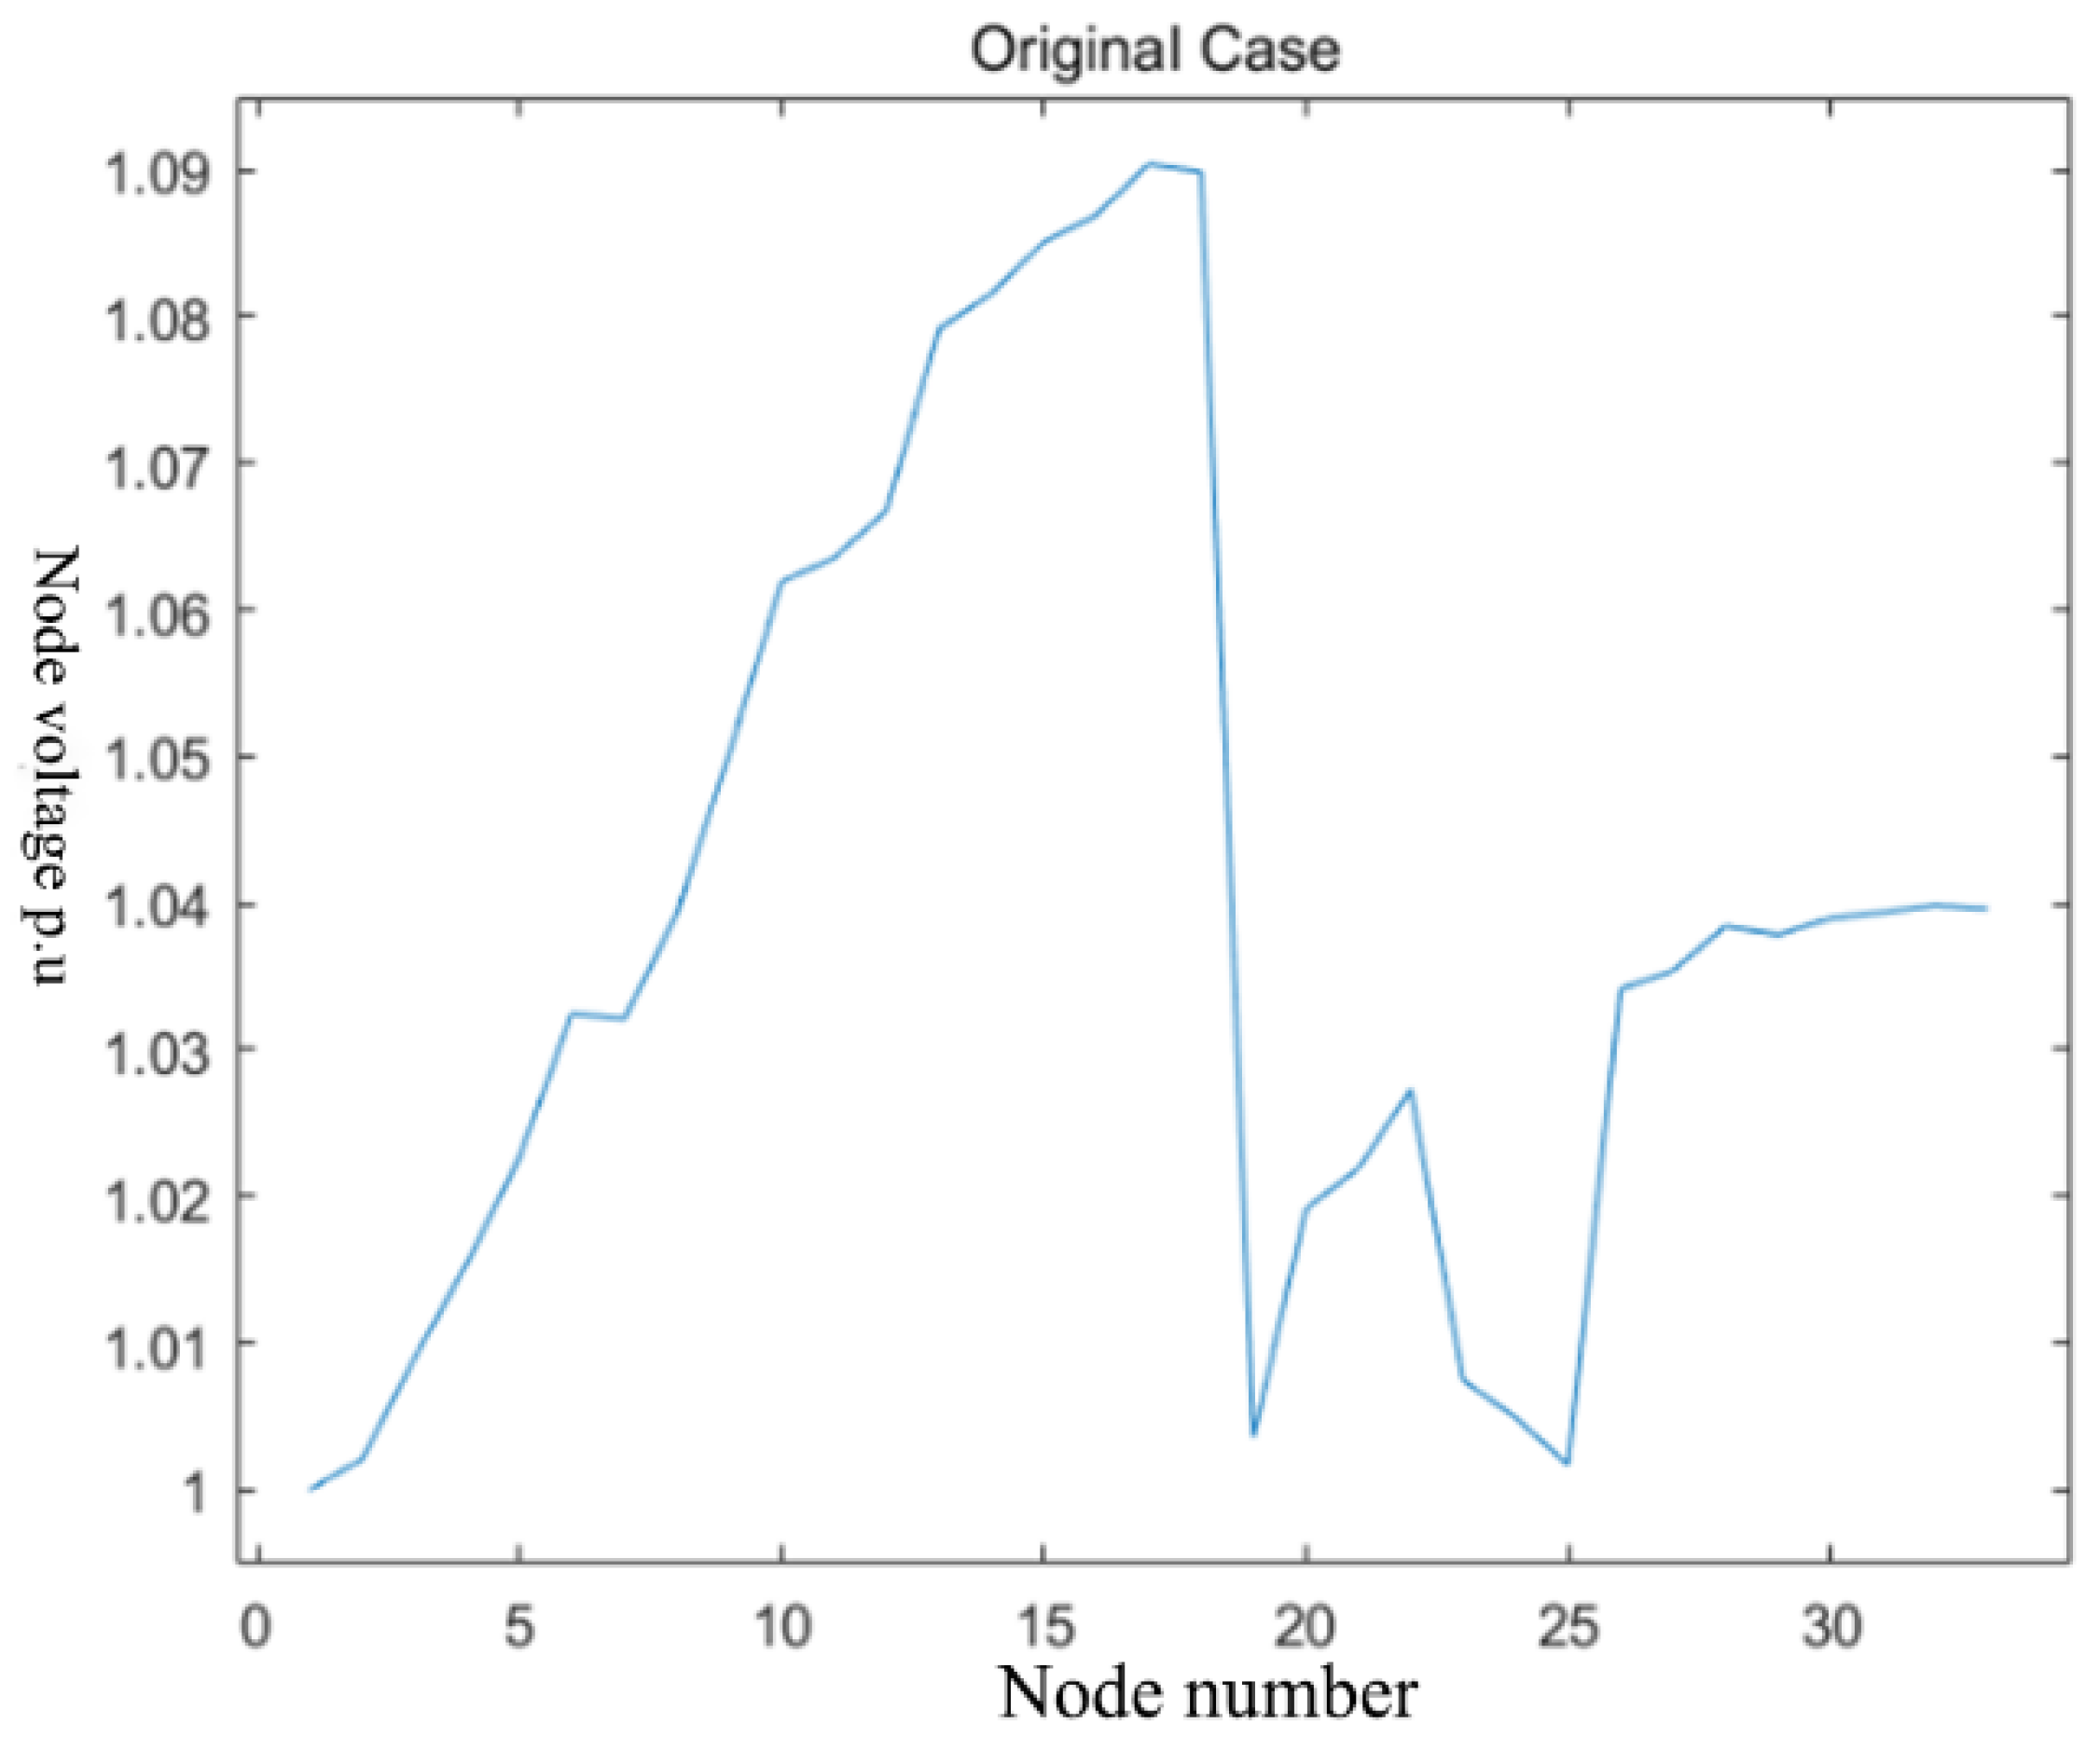
During the phase of model establishment, the paper primarily incorporated photovoltaic (PV) as the selected distributed energy source. A total of 11 PV nodes were installed at specific locations: nodes 5, 10, 13, 15, 17, 22, 24, 26, 28, 30, and 32. The cumulative installed capacity amounted to a significant value of approximately 1.5 MW. The installation of capacitor banks (CBs) is located at node 18, while a Static Var Compensator (SVC) is installed at node 31, providing compensation within the range of −0.2 to 1 Mvar. The reference voltage specified in the paper is 12.66 kV, with a corresponding operating range for nodes set between 0.95 and 1.05 per unit (pu), equivalent to 12.027 kV and 13.293 kV, respectively. It should be noted that subsequent control group node voltages are also referenced against the value of 12.66 kV, but with upper and lower limits adjusted accordingly. The optimization model in the paper still focuses on minimizing voltage deviations, as well as variations in active and reactive power, for each node in the IEEE 33 power system when control group calculations are included, with the ultimate goal of obtaining optimized network losses. The parameters of IEEE 33 branches, obtained through power flow calculations and resulting in the voltages at corresponding nodes, are illustrated in Figure 10. This provides a fundamental basis for reactive power optimization and voltage optimization.

Figure 10.
Voltage in IEEE 33-node system.
4.2.2. Simulation Results
The optimization process focuses on voltage, active power, and reactive power based on the provided branch parameters and calculated node voltages. In particular, it emphasizes the significant role of photovoltaic inverters in optimizing node voltages and reactive power. The data are partitioned, and matrices are constructed to facilitate the importation of the problem into the CPLEX solver, resulting in a simplification to 53 quadratic constraints. Subsequently, these constraints are prioritized using approximate minimum degree ordering to address more significant issues first. Finally, aided by the CPLEX solver, the model was successfully solved within a mere 0.64 s. The ultimate optimization outcomes reveal a remarkable decrease in total network losses from 0.410318 MW prior to optimization to a mere 0.024680 MW post-optimization over a span of 24 h, signifying an impressive reduction in active power losses by 94%. The graphical representation of these optimization results can be observed in Figure 11.
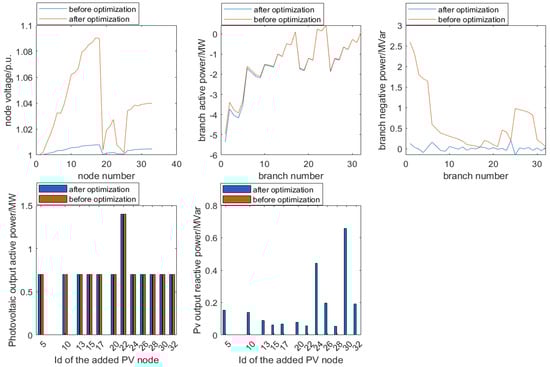
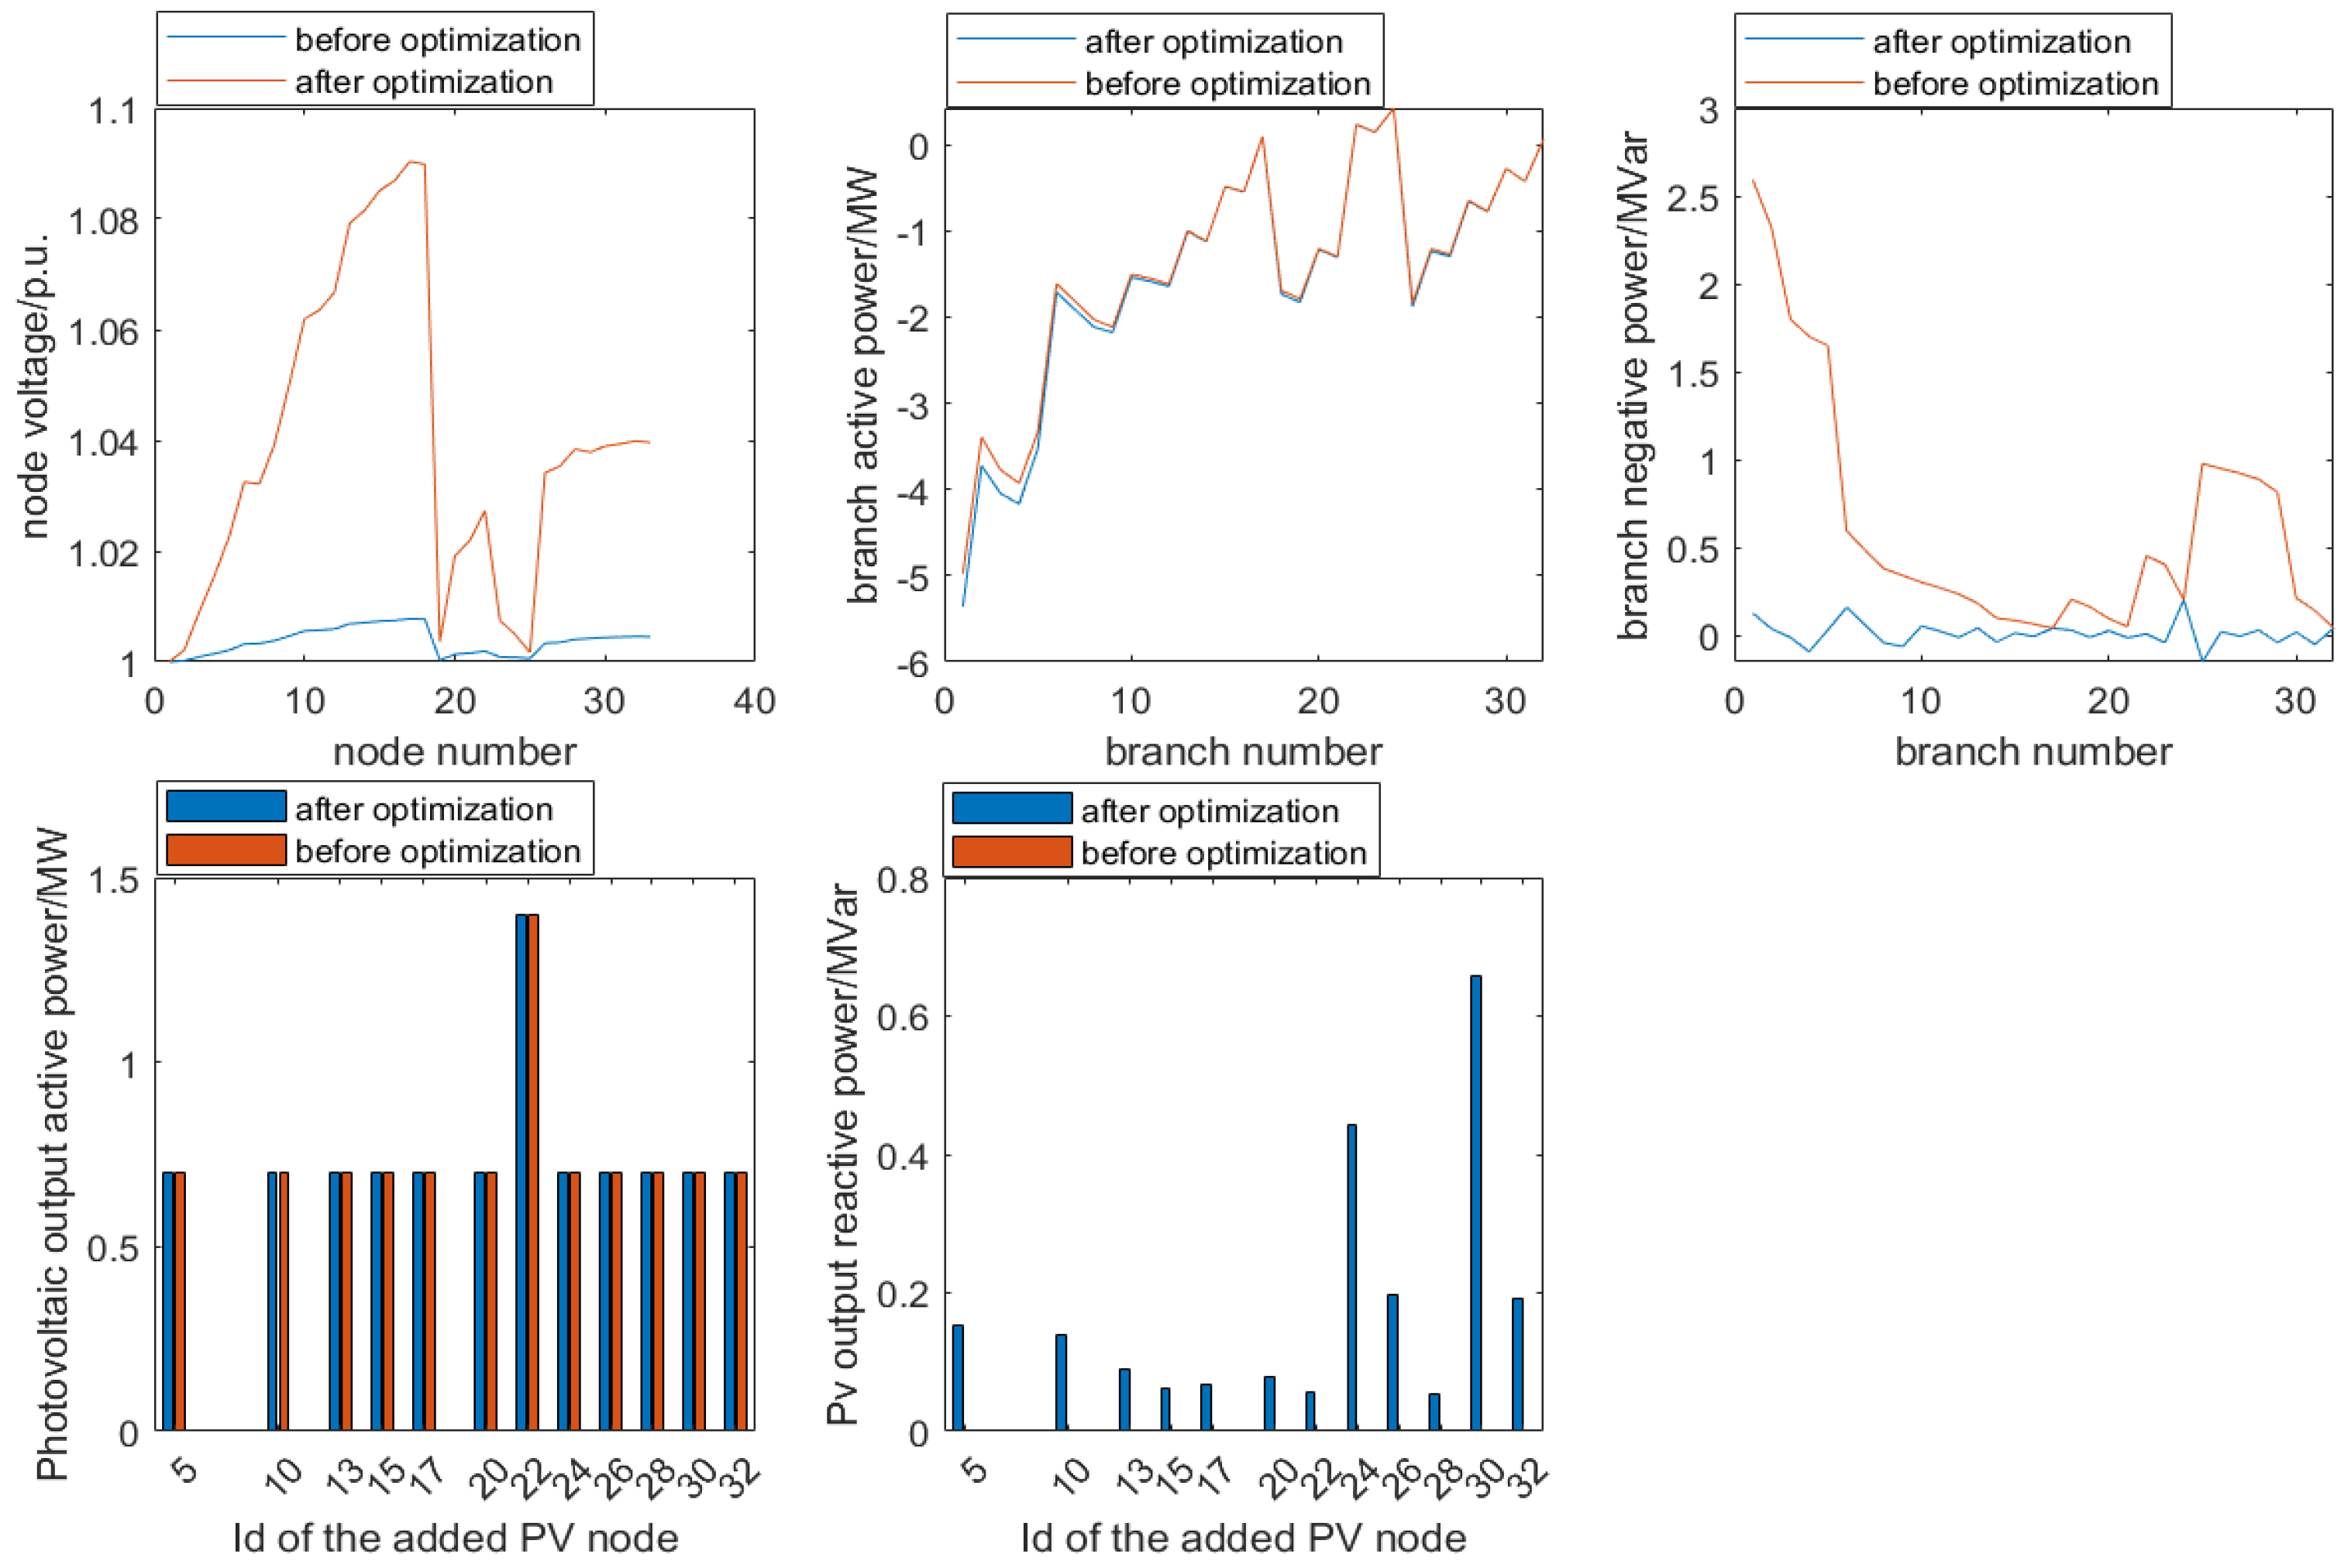
Figure 11.
IEEE 33 simulation optimization comparison chart (node voltage 1.05–0.95 pu).
The node voltage analysis in Figure 11 clearly demonstrates significant adjustments in the key nodes’ voltages before and after optimization. Notably, node 17, initially exhibiting a voltage peak, experienced a decrease from 1.09 pu to 1.07 pu following the optimization process. By mitigating the fluctuations of distributed energy sources, grid stability is ensured, meeting the requirements for stable operation after integrating these sources. Furthermore, it is crucial to avoid rapid voltage magnitude changes within the specified limits at nodes when adjusting them. Such changes could result in significant variations in voltage phase angles and consequently impact the overall stability of grid operations. Indeed, stable voltage reduction has been proven to be an effective adjustment measure for distribution network systems when combined with distributed energy sources and energy-storage units.
The comparison of active power distribution at nodes before and after optimization reveals that the integration of distributed energy sources, particularly photovoltaics, modifies the original distribution in the network. However, it is important to note that the incorporation of distributed energy sources does not universally lead to an increase in optimized active power output. In fact, slight decreases are observed in active power output within certain branches. The optimization model effectively achieves load demand and a generation supply balance by efficiently scheduling energy-storage units and distributed energy sources, thereby minimizing ineffective active power losses and maximizing the utilization of existing generation resources. It ensures uninterrupted power supply without blindly increasing the output of distributed energy sources.
After optimization, the reactive power distribution at nodes was strategically concentrated at key points to ensure overall stability of the power system and facilitate efficient energy transfer. The integration of distributed energy sources, such as photovoltaic inverters, into the distribution network necessitates the consideration and control of their reactive power characteristics, resulting in a more balanced allocation of reactive power among various branches. This effectively reduces instances of local surplus or deficiency in reactive power, thereby enhancing grid stability.
The installation of photovoltaic inverters at corresponding nodes ensures consistent active power output from them. However, slight variations in active power may occur at other nodes where photovoltaic inverters are not installed. While simulation scenarios are used to maintain consistent active power at nodes primarily for reactive power optimization through voltage phase angle adjustments, the actual situation may differ.
The reactive power output from photovoltaic inverters is achieved through an adjustment of the node voltage and phase angle, ensuring stability in the operation of the overall power system. This mechanism prevents excessive phase angle deviations at corresponding nodes, thereby mitigating excessive energy consumption. It represents an effective approach for optimizing reactive power using photovoltaic inverters.
In practical scenarios, there are inherent limitations to the adjustment of photovoltaic inverters. These limitations pertain to the loading capacity and voltage constraints at the nodes. In order to assess the efficacy of reactive power optimization utilizing photovoltaic inverters, adjustments were made to the upper and lower limits of the voltage range for IEEE 33 nodes, setting them at 0.95–1.5 pu, while maintaining a reference value of 12.66 kV; all other parameters of IEEE 33 remained unchanged throughout this analysis. The final results are depicted in Figure 12.
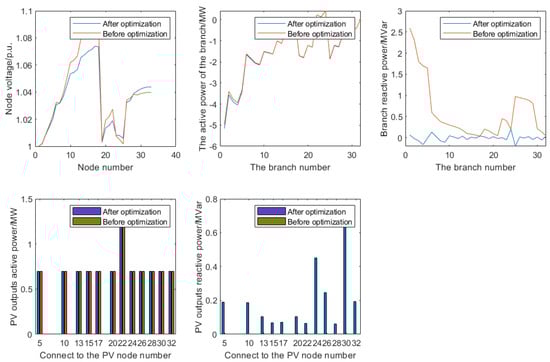
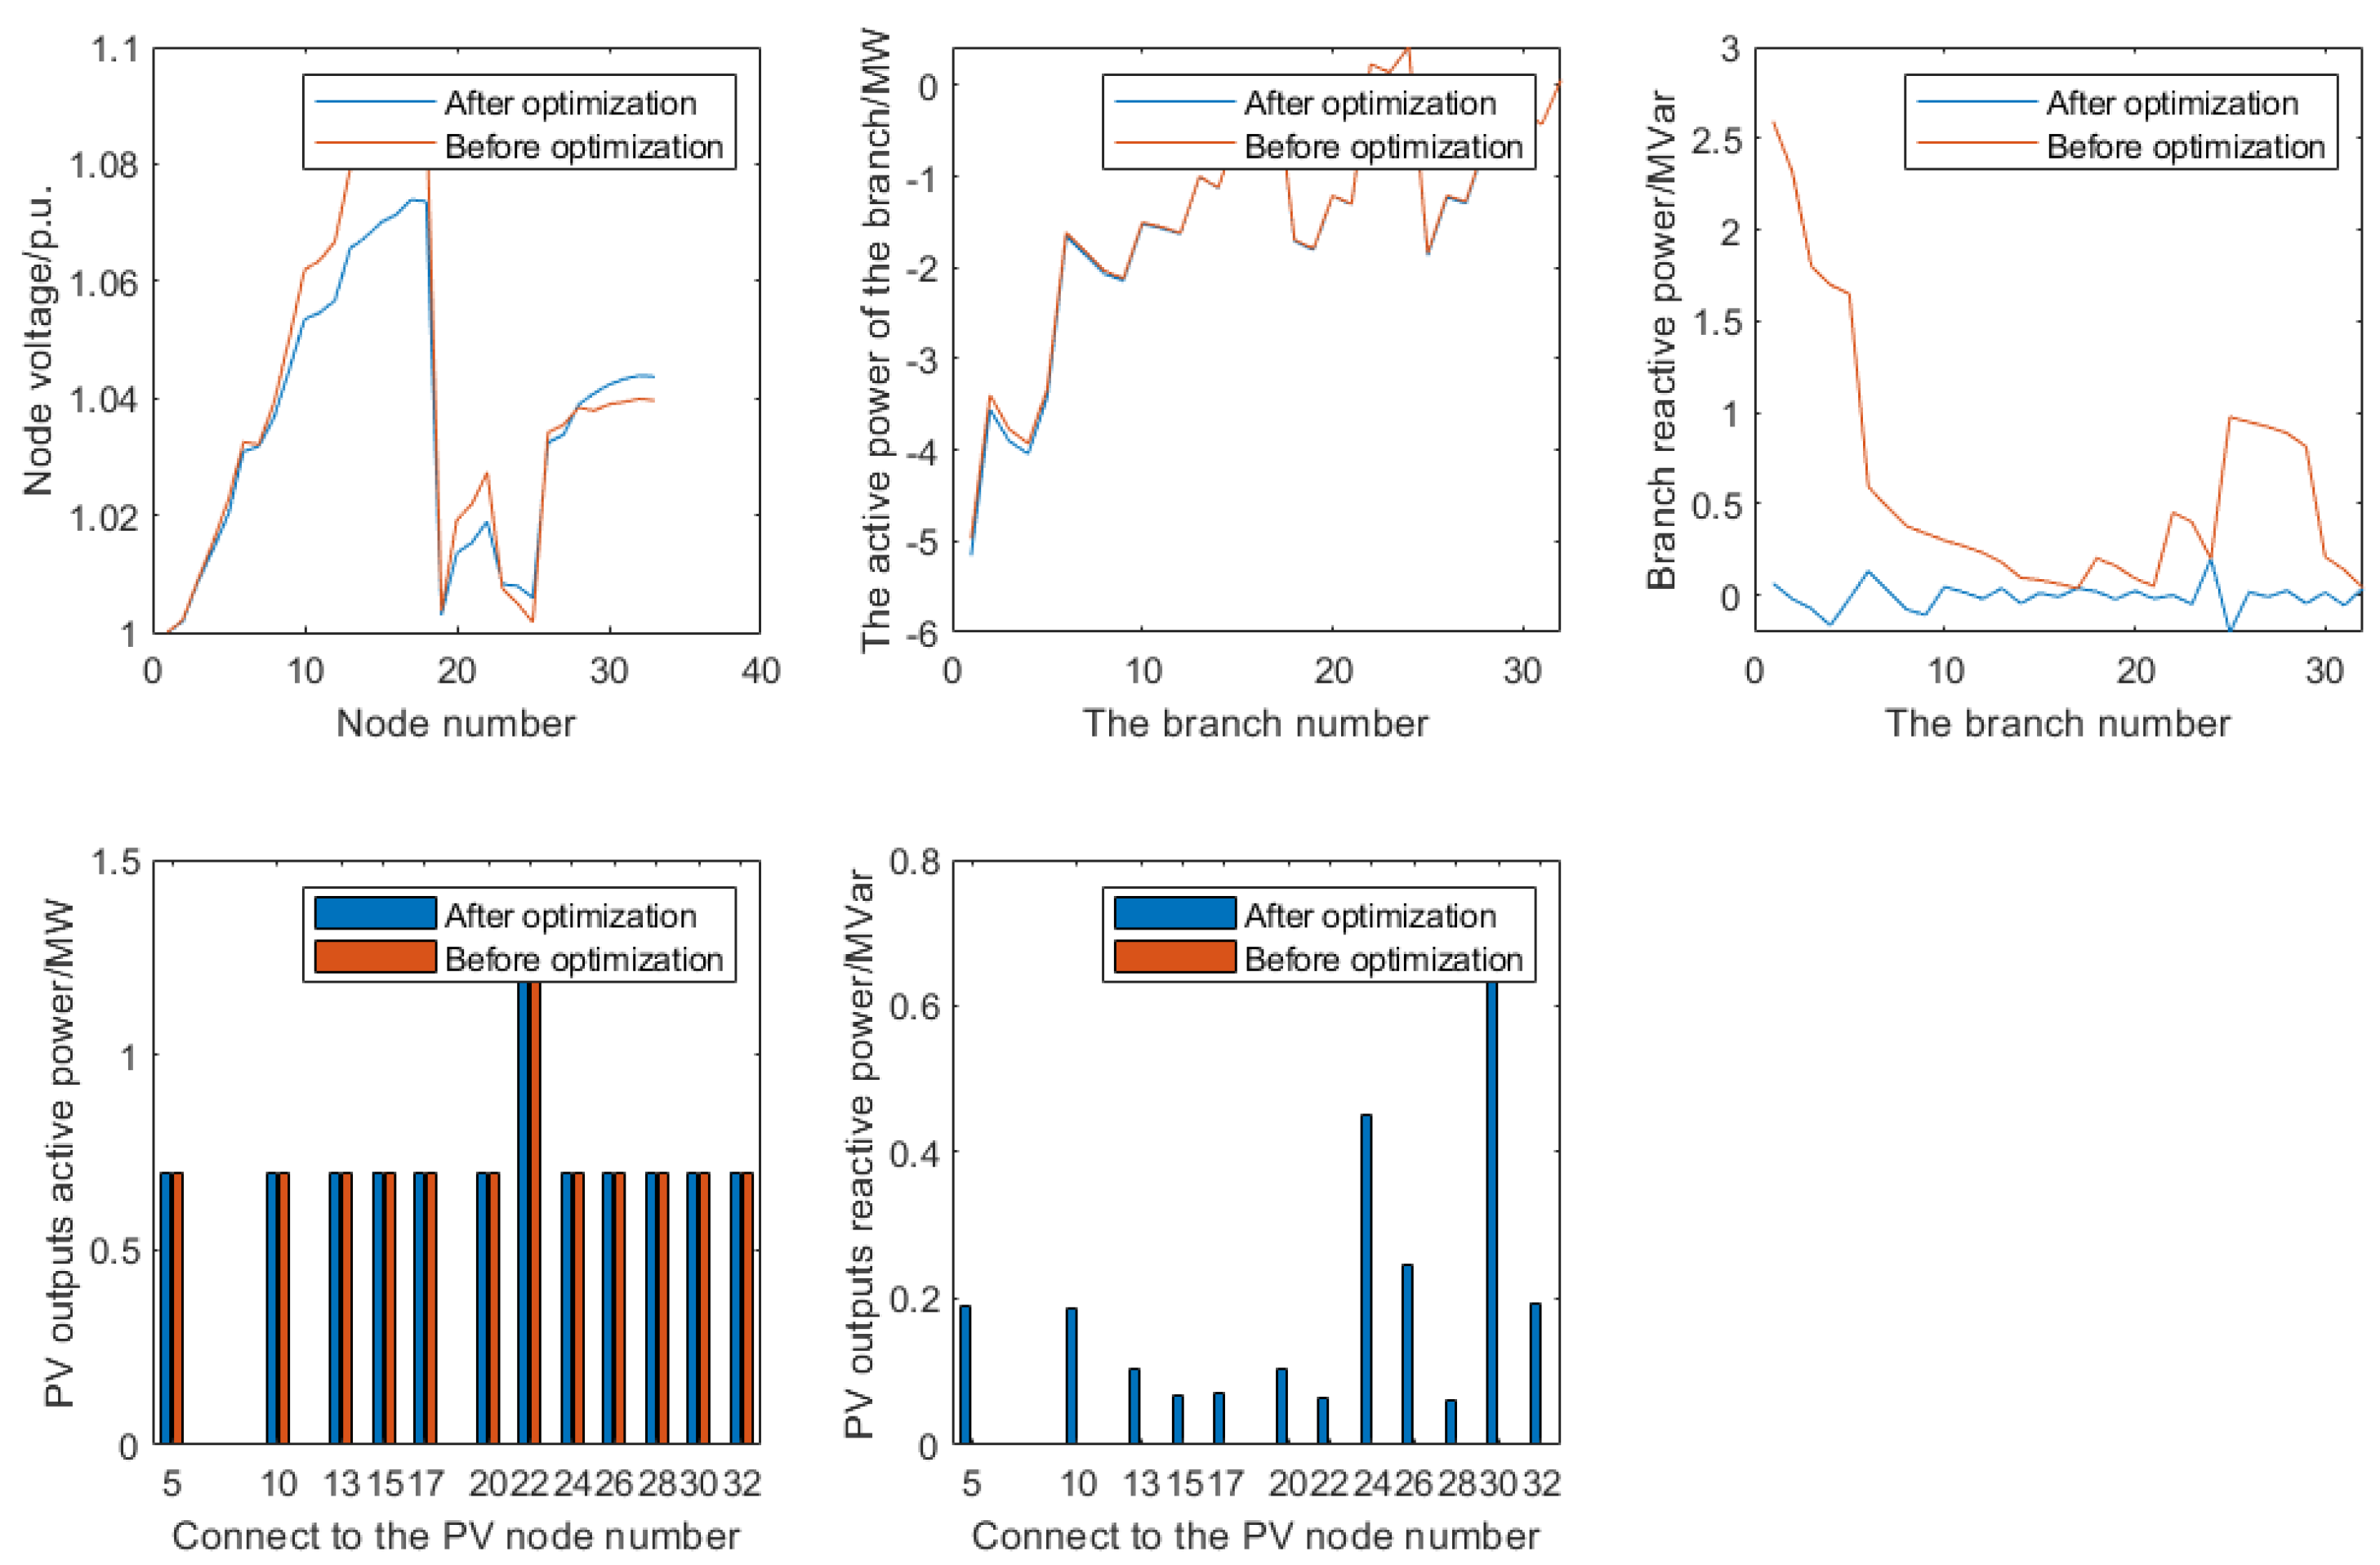
Figure 12.
IEEE 33 simulation optimization comparison chart (node voltage 1.5–0.95 pu).
Compared to Figure 11, significant voltage changes are observed in nodes 10–18 in Figure 12. However, as the loading capacity of the photovoltaic inverters remains unchanged, there will be no variation in active power. Nevertheless, there is a more uniform variation in reactive power across branches. This can be attributed to the significant changes in voltage limits for IEEE 33 nodes, while the actual installed capacity has not reached an equal level across all nodes, resulting in lower adjustment levels. Additionally, notable adjustments are seen in the phase angles of voltage nodes concentrated between nodes 13 and 18, with an average phase angle deviation of 6.13°, and nodes 28 and 33, with an average deviation of 4.8°. Finally, considering the overall network losses, which decreased from 0.410318 MW before optimization to 0.225484 MW after optimization, a reduction of 45% is achieved. This demonstrates that under larger voltage adjustment amplitudes, the impact of relatively small photovoltaic inverter loading capacities on optimization is limited.
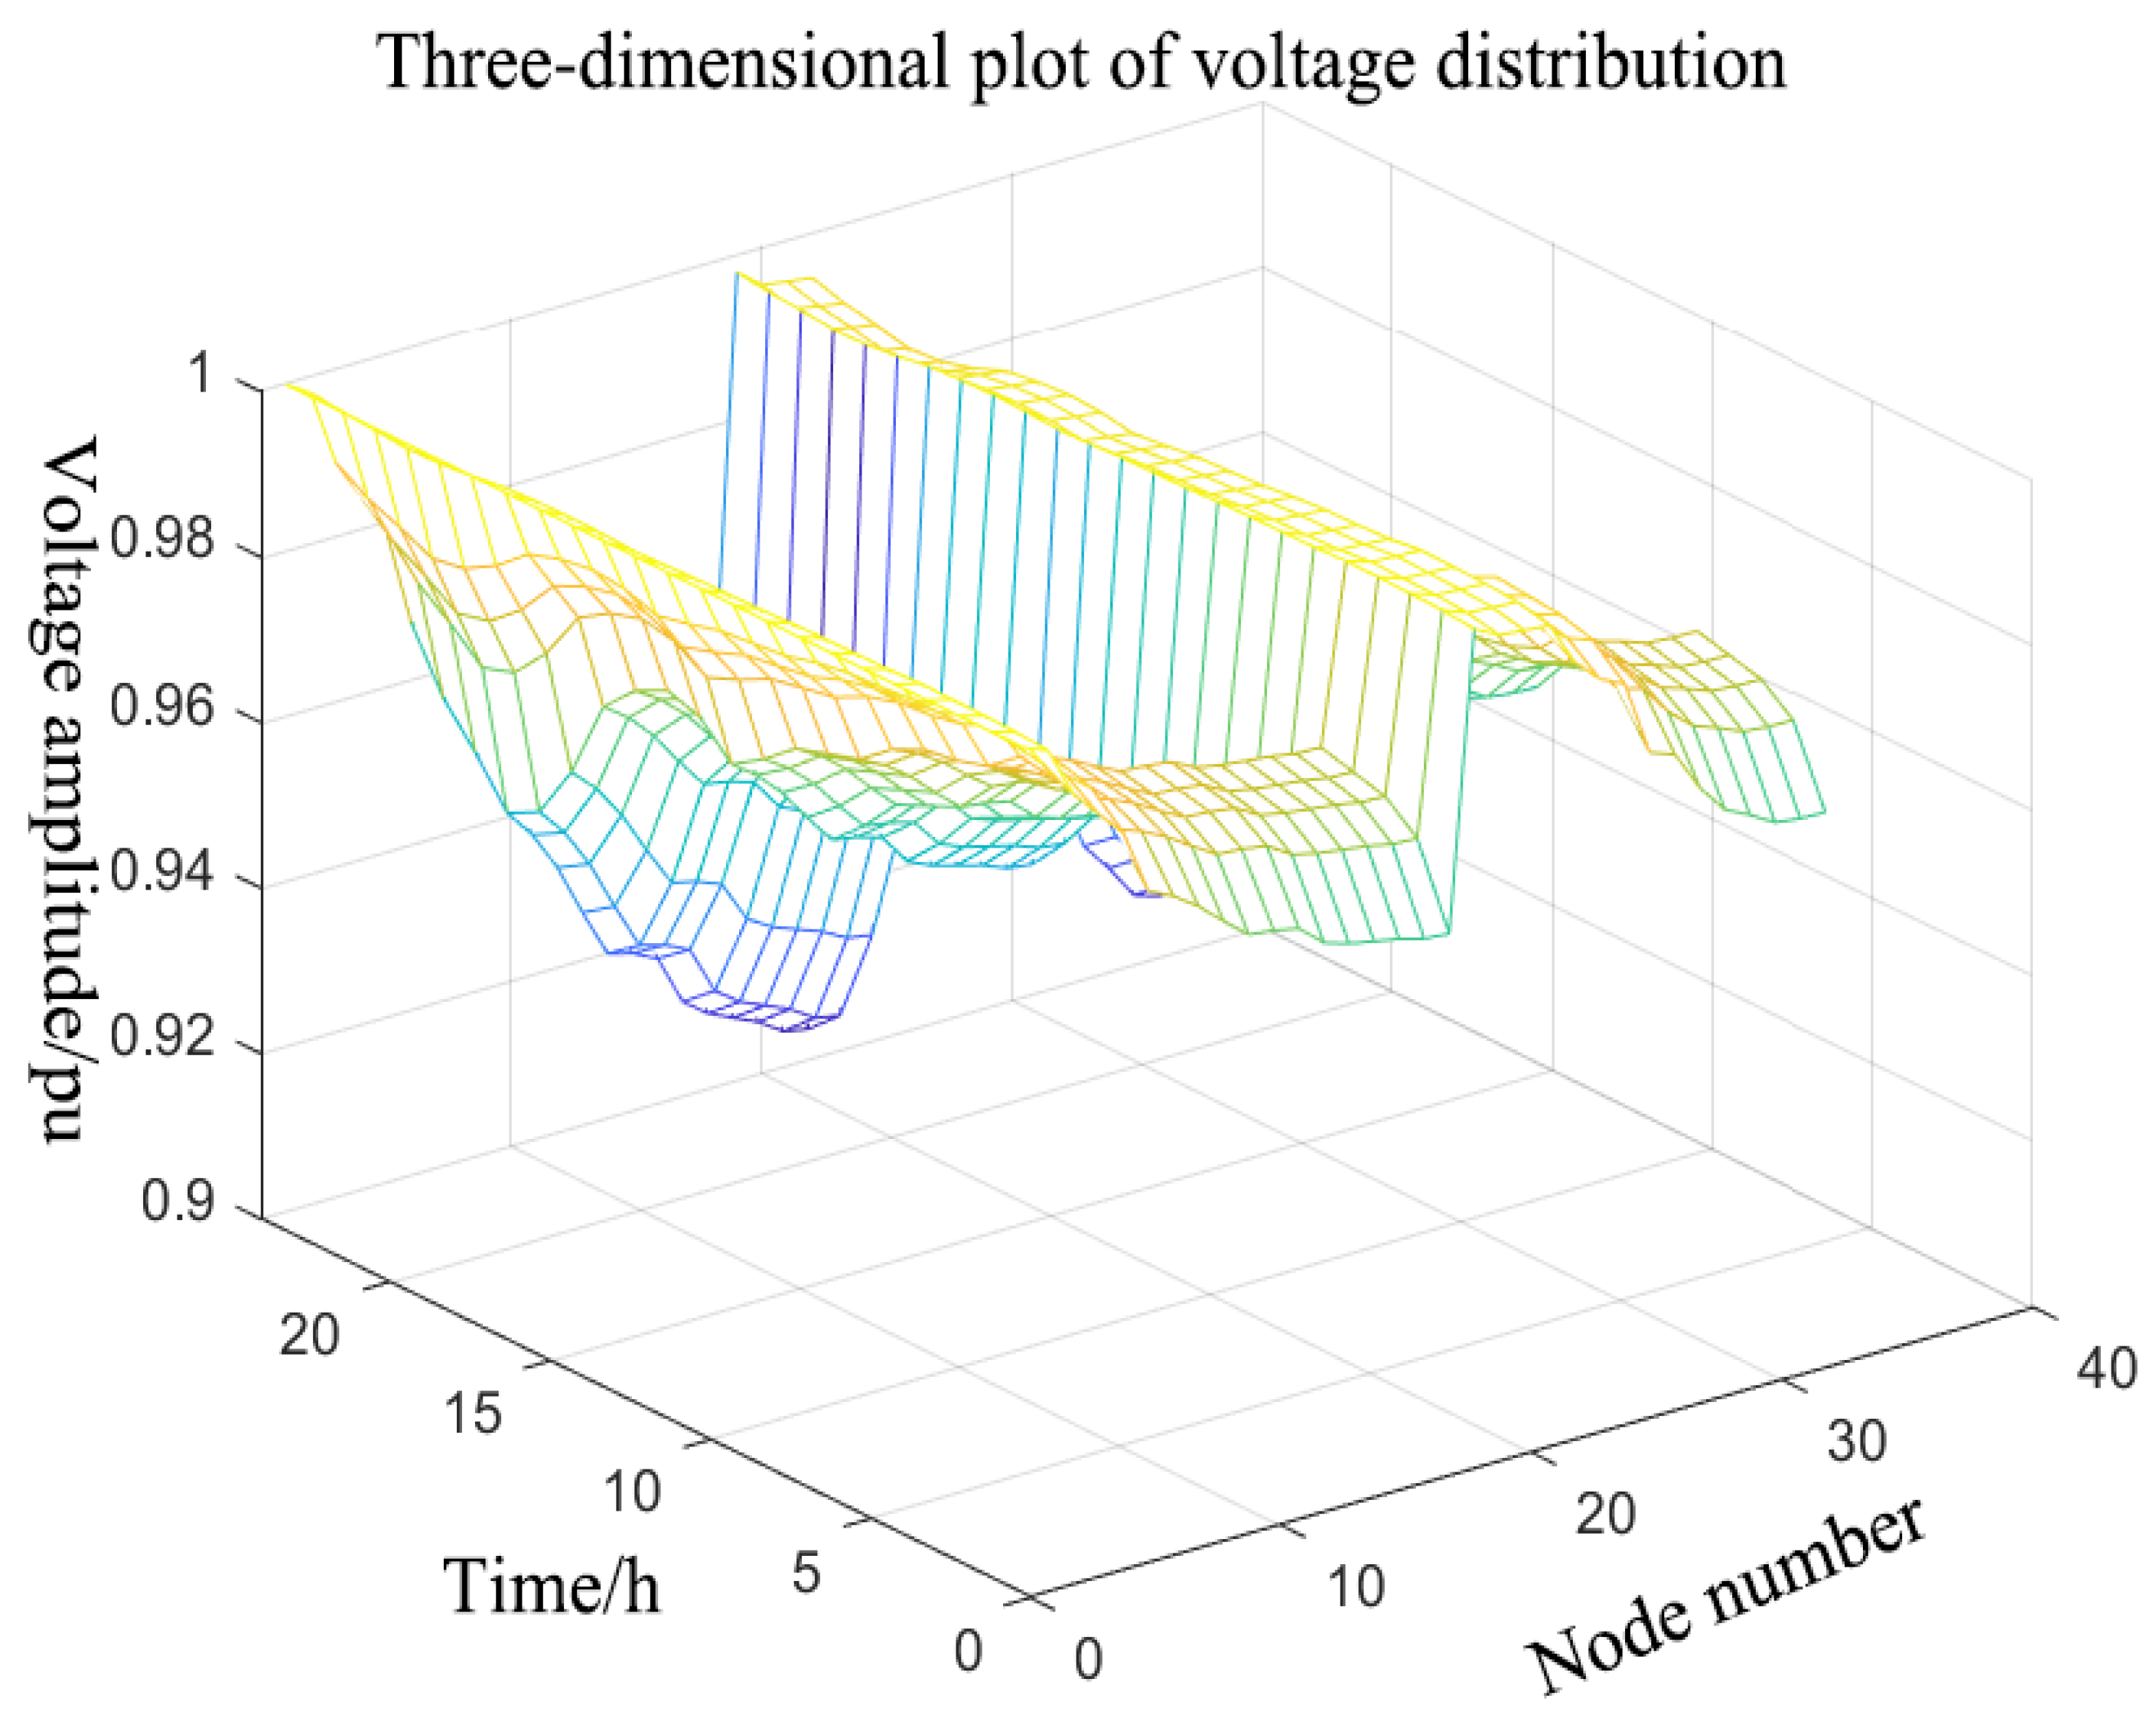
Finally, the forward generation-reflow method is used to predict and optimize voltage amplitudes during the time period. The IEEE 33-node case is simulated for the analysis, revealing the changing trend in voltage amplitudes during the time period. It is observed that the voltage deviations closely approximate those from the second-order cone optimization. This demonstrates that within the approximation range, normal voltage amplitudes decrease when the load is low, aligning with the optimization goals of the second-order cone for its load calculation. The prediction of IEEE 33 voltage amplitude in the time interval is shown in Figure 13.
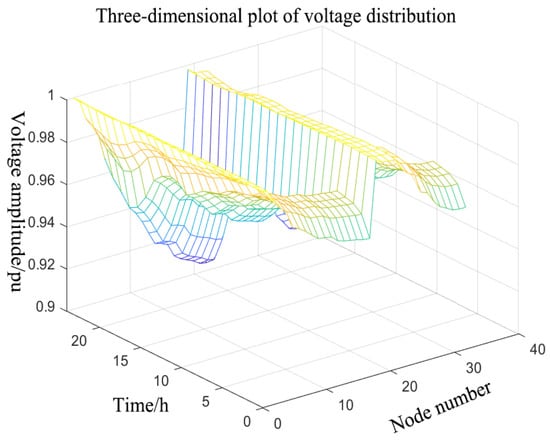
Figure 13.
IEEE 33 prediction of voltage amplitude over time.
5. Limitations
- Model Applicability: The proposed model for reactive power optimization in active distribution networks, which utilizes the second-order cone relaxation algorithm, is specifically tailored to optimize distribution networks that encompass intricate scenarios involving distributed renewable energy sources, such as photovoltaic generation and energy-storage systems. The study has been validated through simulation on the IEEE 33-node system, showcasing significant reductions in network losses. However, it should be noted that the model’s applicability may vary depending on the type and scale of distribution network structures, particularly for transmission networks operating at voltage levels exceeding 13 kV and distribution networks encompassing a diverse range of distributed energy resources and distinct topological structures. Further verification is required to ascertain the universality of the model.
- Assumptions and Simplifications: The study made certain assumptions and simplifications regarding specific conditions, such as assuming that distributed energy sources primarily consist of photovoltaics. However, it did not fully consider the uncertainty and complementary effects of other types of renewable energy sources, like wind or hydroelectric power. Furthermore, the study lacked the extensive exploration of the issue of coordinated optimization among multiple types of energy-storage devices.
- Incomplete Coverage of All Influencing Factors: While the study primarily focuses on enhancing power quality, it solely provides a detailed analysis of phase angle deviation in individual nodes and overall node voltage deviation to meet operational standards and improve power quality. However, it fails to comprehensively address all factors that impact power quality and system stability, such as harmonic mitigation, system stability, and frequency control, which were not directly integrated into the proposed reactive power-optimization model.
6. Conclusions
The paper conducts a comprehensive investigation and analysis of reactive power optimization in distribution networks, considering the impact of integrating distributed renewable energy sources on voltage levels within the distribution network. Based on this thorough analysis, an active distribution network reactive power-optimization model is established using a second-order cone algorithm. The paper employs the second-order cone relaxation algorithm to convert non-convex, non-linear power flow optimization models into easily solvable and efficient second-order cone programming models. By utilizing the IEEE 33 test case and the CPLEX solver, simulation experiments are conducted in this study to validate the superior performance of the second-order cone programming algorithm in addressing distribution network loss problems. The results demonstrate a remarkable enhancement in system efficiency resulting from optimization strategies, leading to a significant reduction in distribution network losses from 0.410318 MW to 0.024680 MW, representing a decrease of nearly 94%. This substantial improvement notably optimizes power quality management while enhancing the efficiency and utilization of the power system. Furthermore, this study provides a comprehensive description of how intelligent distribution units (IDUs) and safety ring devices effectively control and enhance power quality in the grid system. Additionally, it establishes stringent standards for power quality compliance. By comparing optimized node voltages, it is demonstrated that they successfully meet power quality standards encompassing the grid frequency, voltage deviation, and three-phase voltage imbalance while adhering to operational requirements for power quality. Consequently, within the IEEE 33 system these technologies exhibit notable advantages in augmenting power quality while mitigating harmonics and minimizing voltage fluctuations in the power system.
Taken together, this research underscores the importance of reactive power optimization and power quality control in distribution networks, demonstrating the effectiveness and feasibility of corresponding technologies. It is believed that with further in-depth research and ongoing improvements in these technologies, they will play a greater role in the field of distribution networks, contributing significantly to improving efficiency, reliability, and power quality in the power grid.
Author Contributions
Conceptualization, Q.L., Z.J. and C.D.; methodology, J.H. and Y.X.; validation, Y.X., Z.Y. and C.D.; formal analysis, Z.J.; investigation, Z.J. and Y.X.; resources, Z.J. and C.D.; data curation, J.H.; writing—original draft preparation, Y.X. and Z.Y.; writing—review and editing, C.D. and Z.J.; supervision, Z.J.; project administration, C.D. and Q.L. All authors have read and agreed to the published version of the manuscript.
Funding
This research was funded by National Key Research and Development Program of China grant number 2017YFE0135700.
Data Availability Statement
No new data was created or analyzed in this study. Data sharing does not apply to this article.
Conflicts of Interest
The authors declare no conflict of interest.
References
- Yoshida, H.; Fukuyama, Y.; Takayama, S.; Nakanishi, Y. A particle swarm optimization for reactive power and voltage control in electric power systems considering voltage security assessment. In Proceedings of the 1999 IEEE International Conference on Systems, Man, and Cybernetics, Tokyo, Japan, 12–15 October 1999; pp. 497–502. [Google Scholar]
- Abdelouadoud, S.Y.; Girard, R.; Neirac, F.P.; Guiot, T. Optimal power flow of a distribution system based on increasingly tight cutting planes added to a second order cone relaxation. Int. J. Electr. Power Energy Syst. 2015, 69, 9–17. [Google Scholar] [CrossRef]
- Liu, H.; Zhang, L.; Zhang, J.; Wang, S.; Xie, Y. Research on the Hybrid Distributed Energy Systembased on Wind, Solar and Nature Gas. Energy Sav. Technol. 2020, 38, 60–65. [Google Scholar]
- Pan, X.; Huang, Y.; Tang, J.; Yang, L. Influencing Factors and Prospects for Development of Renewable Energy Power Generation. Smart Grid 2019, 47, 41–47. [Google Scholar]
- Sun, Y.; Cui, G.; Xiao, Y.; Chen, Z. Maximum Integration Capacity of Distributed Photovoltaic Power Considering Voltage Fluctuation. Energy Sav. Technol. 2019, 37, 331–338. [Google Scholar]
- Weng, Y.; Cheng, R.; Ma, W.; Zhu, Y.; He, X.; Cheng, W. Modeling the Energy Transmission based on the Energy Internet and Lines Connection. Smart Grid 2018, 46, 28–32. [Google Scholar]
- Wang, K.; Fan, B.; Zhang, F.; Zeng, J. Mains Supply Load Rectifier Power Optimization Control Simulation. Comput. Simul. 2017, 34, 100–104. [Google Scholar]
- Xu, D.; Ge, R.; Cai, Z.; Zhang, C.; Pi, J.; Wan, X. Optimization and Adjustment Method for Intraday Generation Scheduling of Regional Power Grid Considering Large-scale Power Loss. Autom. Electr. Power Syst. 2017, 41, 68–73. [Google Scholar]
- Lv, S.; Shu, Z.; Song, X.; Yang, Z.; Zhang, Z.; Zheng, C. Influence of VSC-HVDC interconnection on recovery characteristics of weak receiving-end grid fault and optimization measure. Electr. Power Eng. Technol. 2020, 39, 31–37. [Google Scholar]
- Zhao, X. Research on optimal control of power distribution in microgrid with heterogeneous power supply. Foreign Electron. Meas. Technol. 2020, 39, 84–88. [Google Scholar]
- Wang, Y.; Lin, J.; Zhang, Y.; Zha, Y.; Hao, J.; Tang, Z. Parameter Optimization Design of Energy Storage Devices to Suppress Power System Oscillation. Smart Grid 2020, 48, 76–83. [Google Scholar]
- Wang, F.; Tao, X.; Tian, G. Constant power control algorithm for a microgrid inverter based on an improved fruit fly algorithm. Power Syst. Prot. Control 2021, 49, 71–79. [Google Scholar]
- Wang, Q.; Wang, B.; Xu, W.; Cheng, Y. Research on Power Distribution Optimization Control of Hybrid Microgrid Interlinking Converter. Control Eng. 2021, 28, 388–394. [Google Scholar]
- Wang, J. Research on Reactive Power Optimization Control Method Considering Power Grid Randomness. Electron. Devices 2022, 45, 178–182. [Google Scholar]
- Dong, F.; Liu, X.; Zhang, Y.; Zhang, T.; He, T.; Zou, H. Power Grid Aging and Reliability Optimiztion Based on Contractual Power and Duration. Smart Grid 2022, 50, 1–6+15. [Google Scholar]
- Cao, S.; Wei, F.; Lin, X.; Li, Z.; Xiao, S.; Wang, T.; Xu, A. Multi-objective Optimization Strategy of DC Microgrid Based on Reactive Power Support Efficiency During Voltage Sag. Proc. Chin. Soc. Electr. Eng. 2023, 43, 5759–5772. [Google Scholar]
- Guo, Y.; Chen, X.; Wang, Y.; He, Y.; Yang, H.; Chang, Z. Negative Sequence Optimization Compensation Strategy for Energy Storage Type Railway Power Conditioner Considering Grid Voltage Imbalance. High Volt. Eng. 2023, 49, 772–780. [Google Scholar]
- Li, Z.; Li, Y.; Luo, X.; Wang, W.; Wei, Y. Optimal operation of microgrid in the park considering carbon trading and the proportion of green electricity. Electr. Meas. Instrum. 2022, 1–11. [Google Scholar]
- Ouyang, S.; Xin, X.; Wang, F.; Cao, H. Optimal Configuration of Photovoltaic-Storage Microgrid Considering Power Supply Demand and Power Quality Evaluation. South. Power Grid Technol. 2023, 1–15. [Google Scholar]
- Jia, H.; Tai, K.; Wang, Z.; Yan, H.; Chen, C.; Zhao, B. Optimization model of voltage and frequency control of AC-DC transmission power grid considering new energy cluster access. Renew. Energy 2023, 41, 1383–1390. [Google Scholar]
- Tonkoski, R.; Lopes, L.A.C. Impact of active power curtailment on overvoltage prevention and energy production of PV inverters connected to low voltage residential feeders. Renew. Energy 2011, 36, 3566–3574. [Google Scholar] [CrossRef]
- Tonkoski, R.; Lopes, L.A.C.; El-Fouly, T.H.M. Coordinated Active Power Curtailment of Grid Connected PV Inverters for Overvoltage Prevention. IEEE Trans. Sustain. Energy 2011, 2, 139–147. [Google Scholar] [CrossRef]
- Worthmann, K.; Kellett, C.M.; Braun, P.; Grune, L.; Weller, S.R. Distributed and Decentralized Control of Residential Energy Systems Incorporating Battery Storage. IEEE Trans. Smart Grid 2015, 6, 1914–1923. [Google Scholar] [CrossRef]
- Wang, P.; Liang, D.H.; Yi, J.; Lyons, P.F.; Davison, P.J.; Taylor, P.C. Integrating Electrical Energy Storage into Coordinated Voltage Control Schemes for Distribution Networks. IEEE Trans. Smart Grid 2014, 5, 1018–1032. [Google Scholar] [CrossRef]
- Liu, Y. Reactive Power Optimization Method of Distribution Network with Distributed Generation Based on Multi-Objective Differential Evolution. Autom. Appl. 2023, 64, 53–55. [Google Scholar]
- Yuan, C.; Zhu, J.; Ni, J. Coordinated voltage optimization method in distribution network with distributed photovoltaic. Electr. Power Eng. Technol. 2023, 42, 74–82. [Google Scholar]
- Cai, Y.; Tang, W.; Zhang, L.; Xu, O. Multi-mode Voltage Control in Low Distribution Networks Based on Reactive Power Regulation of Photovoltaic Inverters. Autom. Electr. Power Syst. 2017, 41, 133–141. [Google Scholar]


Disclaimer/Publisher’s Note: The statements, opinions and data contained in all publications are solely those of the individual author(s) and contributor(s) and not of MDPI and/or the editor(s). MDPI and/or the editor(s) disclaim responsibility for any injury to people or property resulting from any ideas, methods, instructions or products referred to in the content. |
© 2024 by the authors. Licensee MDPI, Basel, Switzerland. This article is an open access article distributed under the terms and conditions of the Creative Commons Attribution (CC BY) license (https://creativecommons.org/licenses/by/4.0/).