Article

YOLOv8-Based Drone Detection: Performance Analysis and Optimization

1
Graduate School of Natural and Applied Science, Gazi University, Ankara 06500, Turkey
2
Aselsan Inc., Ankara 06830, Turkey
3
Electrical & Electronics Department, Gazi University, Ankara 06570, Turkey
*
Author to whom correspondence should be addressed.
Computers 2024, 13(9), 234; https://doi.org/10.3390/computers13090234
Submission received: 24 July 2024 / Revised: 5 September 2024 / Accepted: 13 September 2024 / Published: 17 September 2024
(This article belongs to the Special Issue Machine Learning Applications in Pattern Recognition)

Abstract

:
The extensive utilization of drones has led to numerous scenarios that encompass both advantageous and perilous outcomes. By using deep learning techniques, this study aimed to reduce the dangerous effects of drone use through early detection of drones. The purpose of this study is the evaluation of deep learning approaches such as pre-trained YOLOv8 drone detection for security issues. This study focuses on the YOLOv8 model to achieve optimal performance in object detection tasks using a publicly available dataset collected by Mehdi Özel for a UAV competition that is sourced from GitHub. These images are labeled using Roboflow, and the model is trained on Google Colab. YOLOv8, known for its advanced architecture, was selected due to its suitability for real-time detection applications and its ability to process complex visual data. Hyperparameter tuning and data augmentation techniques were applied to maximize the performance of the model. Basic hyperparameters such as learning rate, batch size, and optimization settings were optimized through iterative experiments to provide the best performance. In addition to hyperparameter tuning, various data augmentation strategies were used to increase the robustness and generalization ability of the model. Techniques such as rotation, scaling, flipping, and color adjustments were applied to the dataset to simulate different conditions and variations. Among the augmentation techniques applied to the specific dataset in this study, rotation was found to deliver the highest performance. Blurring and cropping methods were observed to follow closely behind. The combination of optimized hyperparameters and strategic data augmentation allowed YOLOv8 to achieve high detection accuracy and reliable performance on the publicly available dataset. This method demonstrates the effectiveness of YOLOv8 in real-world scenarios, while also highlighting the importance of hyperparameter tuning and data augmentation in increasing model capabilities. To enhance model performance, dataset augmentation techniques including rotation and blurring are implemented. Following these steps, a significant precision value of 0.946, a notable recall value of 0.9605, and a considerable precision–recall curve value of 0.978 are achieved, surpassing many popular models such as Mask CNN, CNN, and YOLOv5.

1. Introduction

In recent years, drones have emerged as a noteworthy technological advancement with vast potential across numerous industries [1]. Their far-reaching selection of usages has led to innovative solutions in fields ranging from package delivery to agricultural practices and security surveillance [2]. However, the increasing use of drones has also brought new challenges to public safety, particularly regarding misuse of these devices for illegal or harmful purposes. With he inclusion of the cameras to drones especially, the problem has spread to the concerns in various areas such as privacy and terrorism matters [3,4,5]. Therefore, security authorities accelerated the research to create systems that are effective at detecting and recognizing drones. This concluded in a new research area addressing to limitations of traditional detection methods and more effective solutions [6]. Eventually, employing deep learning techniques has become a crucial part of the studies in this area. Deep learning, a subset of artificial intelligence, facilitates the automated recognition of complex data patterns, offering more precise and adaptable detection systems through extensive data analysis to find safer solutions.
Current unmanned aerial vehicle detection methods are sound-signal-based, radar-based, radio-frequency-based, and image-and-video-based approaches [7,8]. Although radars are efficient for long ranges, resistant to bad weather conditions such as fog and rain, and have advantages such as night vision, it has been evaluated that the electromagnetic waves emitted by drones are not sufficient for detection by radars [9]. The fact that radars generally only provide information about the target such as location and speed causes high costs even for this limited data [10], and this makes image-based detection methods more useful. Radio-frequency-based methods have many advantages such as having a wide coverage area, being affected by environmental factors at a very low level, and detecting the target location accurately. However, considering the fact that drones have low radio frequencies, the use of different frequency values for different types of drones, and the fact that the radio-frequency-based method is very costly when there are many signal sources make this method disadvantageous for drone detection [11]. Sound-based methods can be efficient in detecting targets at short range, but their performance at long range is quite low due to noise sensitivity. In addition, different drone models and engine types can produce sound at different frequencies, which makes target detection with a sound-based model quite complex and costly [12]. Image-based methods are very suitable for the use of deep learning because they can provide high resolution and detail of objects and high performance can be achieved. Although bad weather conditions reduce the performance of image-based methods, this effect can be reduced with augmentation methods. However, all these methods used to achieve high performance generally require high computing power and data processing capacity.
This article examines techniques centered on images, as those techniques offer numerous advantages contributing to enhanced performance in deep learning. One of the various contributions is that image-based approaches enable one to gather rich information with the help of images, objects, patterns, and colors. Furthermore, thanks to high dimensionality, they manage the complexity of deep networks. This approach would lead to a wide range of applications in various fields such as defense industry. Also, the image-based approach offers data augmentation capability and shows resilience in noisy environments [13].
In this article, the YOLOv8 model is employed as an image-based method. The YOLOv8 model introduces a new backbone and head structure to improve object detection performance. This updated structure allows the model to work more efficiently. The architecture of YOLOv8 includes modern techniques such as attention mechanisms and depth discrete convolution, which increase the model’s ability to detect objects of different sizes and shapes. It also uses more advanced algorithms for automatic complexity tuning and hyperparameter optimization to significantly improve the model performance. Thanks to these innovations, YOLOv8 achieves higher accuracy and lower error rates compared to previous versions YOLOv5 and YOLOv4 [14]. Although the YOLOv8 model is superior in terms of overall performance, it may have some limitations in challenging situations such as adverse weather conditions. Some of the augmentation methods used, such as blurring, contributed to the study in terms of simulating adverse weather conditions and observing the model’s response to it.
The outputs gathered from this study can be applied to enhance security and provide preservation against various threats in both military and civilian areas. The results of this study can also be used for the following purposes. The first one is threat detection and identification. Possible threats (drones) can be detected and identified using images acquired through cameras. It can also be useful for warning systems. When a threat is detected, audible, visual, or other warnings can be provided to alert personnel or users. This ensures timely responses to notify the presence of danger and take necessary precautions. It can be used to protect civilian or military facilities, areas, or vehicles. Early detection and warning of potential threats help prevent attacks or at least mitigate their impact. Finally, it can be evaluated for tactical use in military operations. It can be used to determine the approach of the enemy and initiate defense preparations by alerting military units. In addition, the model’s ability to work on portable devices facilitates its use in military operations or emergency interventions that require real-time detection.
This study continues as follows: Section 2 outlines the present research, Section 3 elucidates experimental particulars including setup, evaluation, parameter tuning, results, and comparisons, while Section 4 offers a summary of this study’s findings. Section 5 gives a brief suggestion for future works.

2. Literature Review

Over the years, many methods for drone detection have been tried; suggested and related studies have been carried out. Many different studies have been executed to detect drones using radars and alternative methods [15], and it has been evaluated that the electromagnetic waves emitted by drones are not sufficient for detection by radars [9]. Through studies on relevant methods, it has been evaluated that the price/performance ratio of sound-based and radio-frequency-based methods studies are low [11]. The most prominent method used for drone detection is image processing.
Angelo Coluccia and colleagues studied using radar sensor networks for drone detection and the main challenges that occur in this context [16]. An investigation of the existing literature has been executed considering the most promising approaches adopted to solve different challenges such as detecting the possible presence of drones, target verification, and classification. This content was also effective in concluding that the most efficient method that can be used for drone detection is image processing.
Image processing is vital for drone detection. The study by B. Srinivasa, S. P. Kumar, and Irshad Ahmad Wani used fish-eye cameras to detect flying drones [17]. Fish-eye cameras are cameras with a 180-degree or wider angle of view designed to capture a wide area in a single shot. In the study carried out with these cameras, drone detection was made using convolutional neural network (CNN), support vector machine (SVM), and nearest neighbor classification methods. Among these three methods, the accuracy of the convolutional neural network classifier was found to be satisfactory when compared with other classifiers with the same experimental conditions [17].
Mariusz Wisniewski and his colleagues trained the drone classification model they created using a convolutional neural network (CNN) with the dataset they created synthetically. By using synthetic data to train the model, they aimed to closely examine the effects of synthetic noise, dataset size, and simulation parameters. They also aimed to reduce the classification cost by adding new drone types that will emerge with the development of technology to the synthetic data model. They contributed to the literature as a new study by testing this model with open-source real-world data [18].
Demir, B. et al. aimed to detect drones at long range with a visual-based system for drone detection using 16 cameras with 20 MP resolution. By combining the processing power of embedded systems with the flexibility of software, they have provided a comprehensive platform for drone detection and tracking [19].
Another study in the literature is on real-time drone detection with high accuracy. In this study, a two-stage method was applied: detecting moving objects (drone, bird, or background) and classifying the detected object. With this approach, it aimed to achieve high processing speed and high accuracy in drone detection. While background subtraction was performed for moving object detection, a convolutional neural network (CNN) was used for classification [20].
In another study, a deep learning-based object detection algorithm You Only Look Once (YOLOv5) was used to defend restricted areas or special regions from illegal drone interference [21]. One of the most challenging issues in drone detection inside the context of surveillance videos is to distinguish the apparent similarity of drones on different backgrounds. Therefore, it aimed to improve the performance of the model. Since there are not enough examples in the dataset, transfer learning was used to pre-train the model. Thus, very high results were obtained for experiments, loss value, drone location detection, precision, and recall.
Haoyu Wang and colleagues [22] focused on three main issues in their study, and in this way aimed to improve the performance of the original YOLOV8 algorithm for the DOTA V1.0 dataset. Firstly, to extract more information about small targets in the images, it performed an additional detection in the base network layer to detect targets of different sizes in images. To detect targets of different sizes in the images, they emphasized that it would be beneficial to use an Efficient Multiscale Attention (EMA) module-based C2f-E structure. Lastly, they used Wise-IoU as a replacement for the CIoU loss function in the original algorithm to increase the robustness of the model. It has been proven that the improved algorithm has 1.3% better performance for DOTA V1.0 data and it can effectively increase target detection accuracy in remote sensing images. This study presents a remote sensing image target detection algorithm based on YOLOv8 that focuses on the complexity of remote sensing images background, targeting a large number of small targets and a variety of target scales.
In another study, YOLOv8 has been used for real-time drone detection by B. Srinivasa and colleagues [23]. Real-time detection is a mandatory prerequisite for timely identification and response service. To achieve this goal, the YOLOv8 model is integrated with TensorFlow.JS, thus enabling system installation and integration into web-based applications without the need for server-side processing is provided. The proposed real-time drone detection system has exceptional accuracy rates and established a robust criterion for reliability. This research utilized the MS COCO dataset, containing images of drones, aircraft, and birds. The model yielded highly successful results in terms of recall, precision, F1 score, and mAP values.

History of YOLO

In the realm of deep learning, there exists a multitude of algorithms; however, You Only Look Once (YOLO) is favored predominantly due to its rapid processing speed and its more accurate results. The fundamental reason of its speed is the process-developing working mechanism. The YOLO family has evolved through multiple iterations, as seen Figure 1, each building upon the previous versions to address limitations and enhance performance.
YOLO was developed by Joseph Redmon and Ali Farhadi at the University of Washington. Launched in 2015, YOLO quickly gained popularity for its high speed and accuracy. There are several key patterns to be able to benchmark the development of the YOLO versions: anchors, backbone, framework, and performance [14].
YOLOv2 was released (in 2016) to solve the problem where YOLOv1 did not detect different size objects. To be able to solve this, batch normalization, anchor boxes, and dimension clusters were improved.
YOLOv3, which was launched in 2018, enhanced the model’s performance. To be able to do this, backbone network, multiple anchors, and spatial pyramid pooling were enhanced. YOLOv4, which was launched in 2020, shows minimal deviation from YOLOv3 in terms of significant changes. There are more CNN layers in YOLOv4 than YOLOv3.
YOLOv5 stands out as the most distinct version compared to its predecessors, primarily because it adopts PyTorch instead of Darknet. This change has led to an enhancement in the model’s performance. Additionally, the introduction of hyperparameter optimization, integrated experiment tracking, and automatic export features further contribute to its advancements.
YOLOv6 was improved to have better performance, faster training, and better detection. To be able to succeed, this model’s architecture has been improved.
YOLOv7 has expanded its capabilities by incorporating new tasks like pose estimation using the COCO key point’s dataset.
YOLOv8 is the latest iteration of the YOLO series of real-time object detectors, offering the ultimate in performance in terms of accuracy and speed. Building on the developments of previous versions, it offers new features and optimizations that make it an ideal choice for a variety of object detection tasks in a wide range of applications.
Exploring the advancements of YOLO provides a thorough understanding of the framework’s progression. This progression can be outlined in various areas such as network design, adjustments to the loss function, modifications to anchor boxes, and changes in input resolution. Additionally, each new version of YOLO demonstrates improvements in both speed and accuracy. When choosing a YOLO version, it is crucial to consider the specific application’s context and requirements.

3. Materials and Methods

This chapter discusses the materials used for evaluation of YOLOv8 and the evaluation criteria after the experiment was conducted.

3.1. Experimental Environment and Dataset

In this paper, the YOLOv8 model was implemented using the free cloud-based Jupyter notebook, Google Colab. The biggest advantage of Google Colab is that it provides a Tesla T4 NVIDIA GPU with 15110MiB of memory while training the model. Additionally, Google Colab can store projects and can be easily accessed since it is integrated with Google Drive.
In this study, we utilized the freely available dataset collected by Mehdi Özel for a UAV competition [24]. This dataset includes both “.txt” and “.xml” files, facilitating training on Darknet (YOLO), TensorFlow, and PyTorch models. The dataset comprises 1359 images, all of which have been meticulously labeled and annotated for the purpose of detecting and recognizing drone objects. The dataset contains multiple categories of drones, and the images were captured at different distances from the drones. The dataset includes various angles, altitudes, and backgrounds to ensure diversity. In this study, all categories of drones are treated as a single class. The dataset was split in an 70:20:10 ratio for training, validation, and testing the YOLOv8 model by using Roboflow.
The samples of the dataset, which include various categories and sub-categories, can be seen in Figure 2. The dataset features various drone orientations and sizes, as illustrated in Figure 3. Figure 3a illustrates the distribution of drone object locations within the dataset, while Figure 3b depicts the size distribution of the drone objects.
The variation in the sizes of the drone objects can lead to an excessive number of computational parameters. Therefore, before training, the original image size is uniformly reduced to 640 pixels × 640 pixels by pixel transformation. In addition to resizing, auto-orientation is applied to the dataset as a preprocessing step. To enable comparison of the effects of various augmentation methods on the dataset, techniques such as rotation, flipping, blurring, cropping, and gray-scale conversion were applied. The results of the augmentation methods will be elaborated upon in Section 4.2 Dataset Augmentation.

3.2. Evaluation Indicators

To facilitate the assessment of detected samples, a confusion matrix acts as a valuable tool. It delineates four distinct outcomes: true positive (TP), false positive (FP), true negative (TN), and false negative (FN). Real parameters correspond to columns, while predicted parameters correspond to rows, enabling the display of these four results as illustrated in Table 1:
To assess the efficacy of the trained model in drone detection, three key metrics are utilized: recall (R), precision (P), and average precision (AP). The recall parameter is determined by dividing the count of correctly identified positive targets by the total number of positive targets, as demonstrated below:
R e c a l l ( R ) = T P ( T P + F N )
where TP is the number of correctly identified positive samples by the algorithm, and FN is the positive samples incorrectly detected as negative samples by the algorithm. Precision parameter is determined by dividing the count of correctly identified positive targets by the total number of positive detections, as demonstrated below:
P r e c i s i o n ( P ) = T P ( T P + F P )
where TP is the number of correctly identified positive samples by the algorithm, and FP is the negative samples incorrectly detected as positive samples by the algorithm.
Once precision (P) and recall (R) parameters are computed, the average precision (AP) can be visualized by plotting precision on the y-axis against recall on the x-axis. The mean average precision parameter represents the average of AP values across multiple classes. The formulas for calculating average precision (AP) and mean average precision (mAP) are provided as follows:
A P = 0 1 P R d R
m A P = k = 1 n A P k n
Each parameter listed above holds significant importance in evaluating the model, and all results will be utilized for assessment purposes.

4. Results Discussion

4.1. Hyperparameter Settings

The hyperparameter settings in YOLO play a crucial role in determining the performance, speed, and accuracy of the model. These configurations significantly influence the behavior of the YOLO model across different stages of its development: training, validation, and testing. This study involved altering the hyperparameters to assess the system’s behavior; the changes made are as follows.
Epoch represents a complete pass over the entire dataset. Adjusting this value may affect training time and model performance. In this study, the best results were consistently achieved with 150 epochs for all trials. When the number of epochs was set to 150, it was noticed that the trained model became steady and stable. When non-default values were assigned to other hyperparameters, 150 epochs emerged as the optimal choice for achieving the maximum value. Figure 4 represents some of the results obtained in this study.
Figure 4a shows a precision–recall value of 0.939 at 50 epochs, while Figure 4b indicates a slightly higher precision–recall value of 0.941 at a higher epoch. Figure 4c demonstrates the maximum precision–recall performance value of 0.956. In contrast, Figure 4d illustrates a dramatic decrease in the precision–recall value to 0.919 at 150 epochs.
The Imgsz hyperparameter is employed to adjust the dimensions of input images, aiming to enhance both the accuracy and computational efficiency of the YOLOv8 model. During this study, it was observed that configuring the imgsz parameter to 640, as determined during preprocessing, enhanced the model’s accuracy in contrast to alternative values. Experimenting with different imgsz values revealed that alternatives resulted in inferior performance compared to 640. Figure 5 represents some of the results obtained in this study.
Figure 5a demonstrates that an imgsz value of 640 results in a higher precision–recall value of 0.956. Conversely, Figure 5b shows that using a different imgsz value from the preprocessing size decreases the precision–recall value to 0.944.
The Batch parameter is utilized to regulate the quantity of images processed simultaneously. When set to −1, it activates auto-batching, dynamically adjusting the number of images based on GPU memory availability. In our research, setting batch to −1 led to a significant decrease in precision. Hence, the default value of 16 was retained.
The Warmup epoch parameter is employed to gradually increase the learning rate during the initial epochs, aiming to stabilize the training process. By doing so, the model operates more consistently from the outset, resulting in more accurate outcomes. In this research, the value was adjusted to 5 from the default of 3, leading to an improvement in the precision–recall curve values.
Numerous hyperparameters are utilized in YOLOv8, such as momentum, warmup_ momentum, weight_decay, and others. All remaining hyperparameters have been retained at their default values.

4.2. Dataset Augmentation

In our study, we employed the YOLOv8 model configured specifically for the Kaggle drone dataset [24]. Preprocessing and augmentation of the dataset were conducted using Roboflow. The efficacy of augmentation techniques varies depending on the dataset, which may consist of real-world images, close-distance shots, long-distance captures, noisy visuals, angled perspectives, and so forth. Various augmentation techniques were applied during our study and their results were observed, the impacts of which are summarized as follows:
Flip augmentation entails augmenting the dataset by symmetrically reflecting the sample images. This technique is aimed at training the model to recognize various aspects of the sample images. In our study, we found that this method did not positively impact the results; therefore, it was not utilized to achieve better outcomes.
Rotation augmentation involves generating new image samples by rotating the original ones by a few degrees. This approach aims to enhance model performance by presenting images to the model from various perspectives. In our research, implementing rotation augmentation alone yielded notably positive outcomes, resulting in an increase in the precision–recall function value. It appears that rotation augmentation is indeed an effective technique for this particular dataset.
Crop augmentation involves augmenting the sample image count by cropping certain sections of the sample images. This approach aims to diversify the aspects of the target that the model learns. However, in our research, employing this augmentation method did not change the results, suggesting the presence of critical components necessary for drone detection within this particular dataset.
Blur augmentation entails creating additional image samples by introducing blur. The purpose is to reduce the level of detail in the images, thereby training the model on more challenging samples. In our study, exclusively employing blur augmentation led to an increase in precision–recall values, indicating compatibility between this augmentation method and the model combination for this dataset.
Gray-scale augmentation involves generating extra images through the conversion of color images into gray-scale versions. This adjustment encourages the model to prioritize fundamental properties of the images. However, in our study, gray-scale augmentation did not change the model performance, suggesting that color variability may not be a critical factor for this dataset.
The evaluation criteria for YOLOv8 performance on various dataset augmentations, precision–recall curves, are shown in Figure 6:
Figure 6a displays the YOLOv8 model’s performance on a dataset with flip augmentation, yielding a precision–recall value of 0.957. Figure 6b presents the model’s performance on a dataset with rotation augmentation, achieving a precision–recall value of 0.977. Figure 6c shows the results for the model on a dataset with crop augmentation, with a precision–recall value of 0.971. Figure 6d illustrates the model’s performance on a dataset with blurring augmentation, also achieving a precision–recall value of 0.971. Finally, Figure 6e depicts the model’s performance on a dataset with gray-scale augmentation, with a precision–recall value of 0.969. Based on these experiments, it was concluded that applying both rotation and blurring augmentation methods to the dataset can enhance model performance.

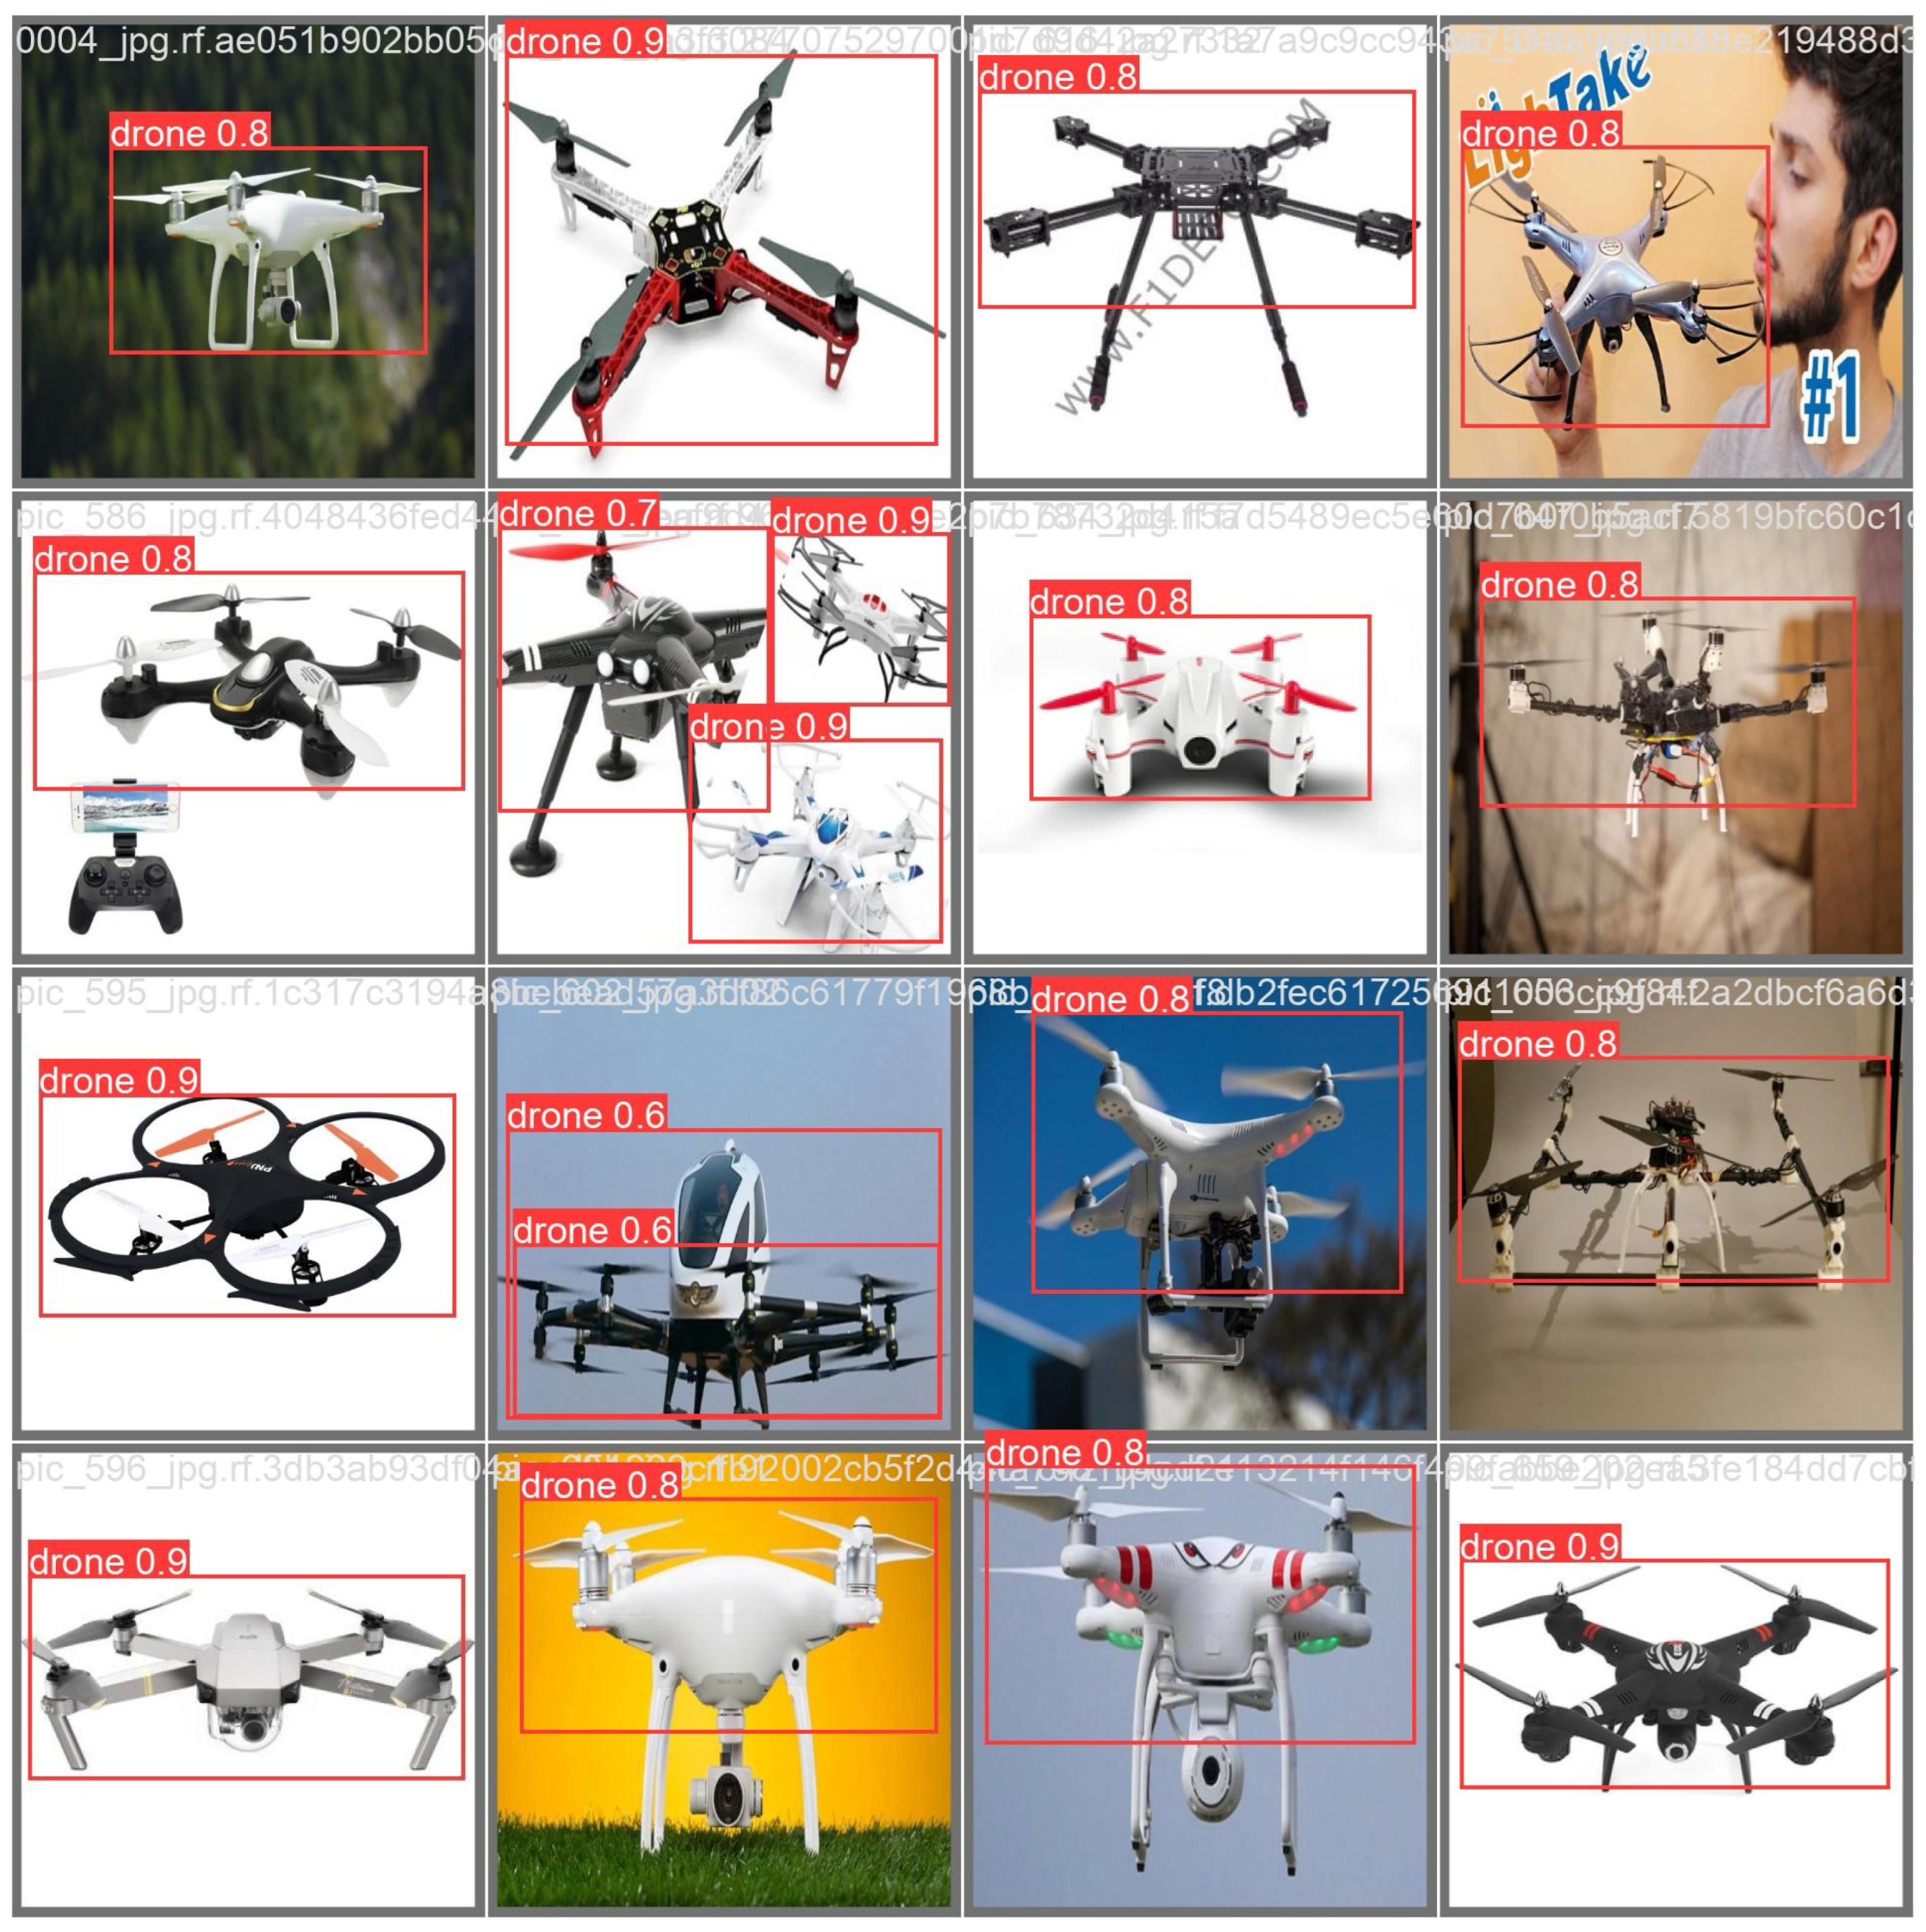
4.3. Model Performance

To achieve successful outcomes, two primary approaches were employed on both the model and dataset, as detailed in preceding sections: adjusting hyperparameters and augmenting the specific dataset. These two methods were applied sequentially. Initially, hyperparameters were adjusted to optimize the results, followed by the application of augmentation techniques to further enhance performance. When hyperparameter tuning was conducted to achieve the best possible outcomes, the results can be summarized as follows:
Figure 7 is presented to summarize the performance of the YOLOV8 model throughout the entire training process. Based on the results, it can be concluded that selecting 150 epochs as the optimal value for this dataset and model is justified for several reasons. Upon examining the first row, which represents the training performance results, it is evident that the loss values consistently decrease between epochs 100 and 150. Moreover, both precision and recall values stabilize around epoch 150. Similarly, in the second row representing validation performance, mAP values also stabilize around epoch 150. Overall, the results exhibit minor oscillations, which are not critical and can be attributed to the weights used in the training process.
For the model with hyperparameter tuning, additional results such as the precision curve, recall curve, F1 score, and PR curve are available and can be displayed in Figure 8:
The precision–recall curve value significantly improves with hyperparameter tuning, reaching a notably high value of 0.970.
Figure 9a indicates that the F1 curve reaches its peak value of 0.588 at a specific point. In Figure 9b, the recall value is indicated as 0.97, whereas in Figure 9c, the precision value is shown to be 0.832.
Figure 10 depicts the test outcomes of this method, showcasing the model’s ability to identify drones of different sizes and orientations within the test images, with precision values ranging from 0.6 to 0.9.
After hyperparameter tuning, diverse augmentation methods were applied, and the best among them was selected, resulting in the following (Figure 11) obtained results.
The notable distinction between Figure 7 and Figure 11 lies in the range of the loss values, with Figure 7 exhibiting higher maximum and minimum values. It is evident that larger datasets lead to increased loss values. Another significant impact of augmentation is observed in the precision–recall curve. This metric was enhanced by carefully selecting appropriate augmentation methods tailored to the specific dataset, namely blurring and rotation. These methods were determined through iterative experimentation, as detailed in earlier sections.
The precision–recall curve value significantly improves with dataset augmentation reaching a high value of 0.97, as shown in Figure 12.
Figure 13a demonstrates that the F1 curve achieves its maximum value of 0.236 at a particular point. In Figure 13b, the recall value is shown to be 0.98, while Figure 13c displays the precision value as 0.840.
Figure 14 illustrates the test results of this approach, demonstrating the model’s capability to detect drones of various sizes and orientations in the test images, with precision values ranging from 0.8 to 0.9.

4.4. Comparison with Other Models

In this research, the YOLOv8 model was trained on a specific dataset, yielding significant success. To assess the position of YOLOv8 among other models, results from YOLOv4, YOLOv3, transfer learning applied YOLOv5, and the Mask R-CNN model for the same specific dataset were used [21]. The results obtained from this study are summarized in Table 2.
In this study, the performance criteria were determined based on multiple parameters, including the precision–recall curve, precision, recall, and true positive values, which directly influence precision and recall, as mentioned in previous sections. True positive values are used as a comparison parameter because they have been utilized for performance evaluation in the referenced studies. When examining the true positive (TP) values for YOLOv8, notably successful results were obtained even without using transfer learning. Additionally, PR curve values for YOLOv8, both with augmented and non-augmented datasets, were determined to be 0.978 and 0.970, respectively, both of which surpass the values obtained by other models.

5. Future Works

In the future, YOLOv8’s performance will undergo assessment with a more extensive dataset. This dataset can be broadened by integrating supplementary data categories like land vehicles and marine vessels. Furthermore, the dataset will be enriched by introducing ambiguous images featuring drones, land vehicles, and marine vessels. Moreover, increasing the diversity within these vehicle categories will enhance YOLOv8’s effectiveness, enabling the model to be applicable across a broader range of scenarios.

6. Conclusions

This study concludes that YOLOv8 demonstrates high performance and achieves successful results on the specific dataset used. Various augmentation techniques were applied, along with adjustments to hyperparameters, with specific recommendations proposed to enhance the model’s performance. It was demonstrated that rotation and blurring augmentation methods were suitable for this dataset, leading to improved model performance. Optimal values were proposed and their effects were showcased. These adjustments were compared with other popular and similar deep learning models such as YOLOv5, YOLOv4, and YOLOv3, revealing that YOLOv8 outperforms them on the same specific dataset. For future endeavors, exploring the performance of YOLOv8 in drone detection could involve utilizing diverse datasets. Expanding the scope of the dataset to encompass a wider range of scenarios and complexities would allow for more comprehensive training of the model.

Author Contributions

Conceptualization, B.Y. and U.K.; methodology, B.Y. and U.K.; software, B.Y.; validation, B.Y.; formal analysis, B.Y.; investigation, B.Y.; resources, B.Y.; data curation, B.Y.; writing—original draft preparation, B.Y.; writing and editing, B.Y.; reviewing, B.Y. and U.K.; visualization, B.Y.; supervision, U.K. All authors have read and agreed to the published version of the manuscript.

Funding

This research received no external funding.

Data Availability Statement

The dataset utilized in this research study is publicly available on Kaggle at https://www.kaggle.com/dasmehdixtr/drone-dataset-uav, accessed on 25 April 2024.

Conflicts of Interest

Author Betul Yilmaz is employed by Aselsan Inc., Ankara 06830, Turkey. The remaining author declares that the research was conducted in the absence of any commercial or financial relationships that could be construed as a potential conflict of interest.

Abbreviations

The following abbreviations are used in this manuscript:
YOLOYou Only Look Once
CNNConvolutional Neural Networks
UAVUnmanned Aerial Vehicle
SVMSupport Vector Machine
EMAEfficient Multiscale Attention

References

  1. Mohsan, S.A.H.; Khan, M.A.; Noor, F.; Ullah, I.; Alsharif, M.H. Towards the unmanned aerial vehicles (UAVs): A comprehensive review. Drones 2022, 6, 147. [Google Scholar] [CrossRef]
  2. Niu, R.; Zhi, X.; Jiang, S.; Gong, J.; Zhang, W.; Yu, L. Aircraft Target Detection in Low Signal-to-Noise Ratio Visible Remote Sensing Images. Remote Sens. 2023, 15, 1971. [Google Scholar] [CrossRef]
  3. Sivakumar, M.; Tyj, N.M. A literature survey of unmanned aerial vehicle usage for civil applications. J. Aerosp. Technol. Manag. 2021, 13, e4021. [Google Scholar] [CrossRef]
  4. Udeanu, G.; Dobrescu, A.; Oltean, M. Unmanned aerial vehicle in military operations. Sci. Res. Educ. Air Force 2016, 18, 199–206. [Google Scholar] [CrossRef]
  5. Pedrozo, S. Swiss military drones and the border space: A critical study of the surveillance exercised by border guards. Geogr. Helv. 2017, 72, 97–107. [Google Scholar] [CrossRef]
  6. Zheng, Z.; Lei, L.; Sun, H.; Kuang, G. A review of remote sensing image object detection algorithms based on deep learning. In Proceedings of the 2020 IEEE 5th International Conference on Image, Vision and Computing (ICIVC), Beijing, China, 10–12 July 2020; IEEE: Piscataway, NJ, USA, 2020; pp. 34–43. [Google Scholar]
  7. Elsayed, M.; Reda, M.; Mashaly, A.S.; Amein, A.S. Review on real-time drone detection based on visual band electro-optical (EO) sensor. In Proceedings of the 2021 Tenth International Conference on Intelligent Computing and Information Systems (ICICIS), Cairo, Egypt, 5–7 December 2021; IEEE: Piscataway, NJ, USA, 2021; pp. 57–65. [Google Scholar]
  8. Basak, S.; Rajendran, S.; Pollin, S.; Scheers, B. Combined RF-based drone detection and classification. IEEE Trans. Cogn. Commun. Netw. 2021, 8, 111–120. [Google Scholar] [CrossRef]
  9. Ren, S.; He, K.; Girshick, R.; Sun, J. Faster R-CNN: Towards Real-Time Object Detection with Region Proposal Networks. IEEE Trans. Pattern Anal. Mach. Intell. 2017, 39, 1137–1149. [Google Scholar] [CrossRef] [PubMed]
  10. Li, J.; Hummel, R.; Stoica, P.; Zelnio, E.G. Radar Signal Processing and Its Applications; Springer: Berlin/Heidelberg, Germany, 2013. [Google Scholar]
  11. Simonyan, K.; Zisserman, A. Very Deep Convolutional Networks for Large-Scale Image Recognition. arXiv 2014, arXiv:1409.1556. [Google Scholar]
  12. Anwar, M.Z.; Kaleem, Z.; Jamalipour, A. Machine learning inspired sound-based amateur drone detection for public safety applications. IEEE Trans. Veh. Technol. 2019, 68, 2526–2534. [Google Scholar] [CrossRef]
  13. Liu, B.; Luo, H. An improved Yolov5 for multi-rotor UAV detection. Electronics 2022, 11, 2330. [Google Scholar] [CrossRef]
  14. Terven, J.; Córdova-Esparza, D.M.; Romero-González, J.A. A comprehensive review of yolo architectures in computer vision: From yolov1 to yolov8 and yolo-nas. Mach. Learn. Knowl. Extr. 2023, 5, 1680–1716. [Google Scholar] [CrossRef]
  15. Coluccia, A.; Fascista, A.; Schumann, A.; Sommer, L.; Ghenescu, M.; Piatrik, T.; Cubber, G.D.; Nalamati, M.; Kapoor, A.; Saqib, M.; et al. Drone-vs-Bird Detection Challenge at IEEE AVSS2019. In Proceedings of the 16th IEEE International Conference on Advanced Video and Signal Based Surveillance (AVSS), Taipei, Taiwan, 18–21 September 2019; IEEE: Piscataway, NJ, USA, 2019. [Google Scholar]
  16. Coluccia, A.; Parisi, G.; Fascista, A. Detection and classification of multirotor drones in radar sensor networks: A review. Sensors 2020, 20, 4172. [Google Scholar] [CrossRef] [PubMed]
  17. Mahdavi, F.; Rajabi, R. Drone Detection Using Convolutional Neural Networks. In Proceedings of the 6th Iranian Conference on Signal Processing and Intelligent Systems, ICSPIS 2020, Mashhad, Iran, 23–24 December 2020; Institute of Electrical and Electronics Engineers Inc.: Piscataway, NJ, USA, 2020; Volume 12. [Google Scholar] [CrossRef]
  18. Wisniewski, M.; Rana, Z.A.; Petrunin, I. Drone model classification using convolutional neural network trained on synthetic data. J. Imaging 2022, 8, 218. [Google Scholar] [CrossRef] [PubMed]
  19. Demir, B.; Ergunay, S.; Nurlu, G.; Popovic, V.; Ott, B.; Wellig, P.; Thiran, J.P.; Leblebici, Y. Real-time high-resolution omnidirectional imaging platform for drone detection and tracking. J. Real-Time Image Process. 2020, 17, 1625–1635. [Google Scholar] [CrossRef]
  20. Seidaliyeva, U.; Akhmetov, D.; Ilipbayeva, L.; Matson, E.T. Real-time and accurate drone detection in a video with a static background. Sensors 2020, 20, 3856. [Google Scholar] [CrossRef] [PubMed]
  21. Al-Qubaydhi, N.; Alenezi, A.; Alanazi, T.; Senyor, A.; Alanezi, N.; Alotaibi, B.; Alotaibi, M.; Razaque, A.; Abdelhamid, A.A.; Alotaibi, A. Detection of Unauthorized Unmanned Aerial Vehicles Using YOLOv5 and Transfer Learning. Electronics 2022, 11, 2669. [Google Scholar] [CrossRef]
  22. Wang, H.; Yang, H.; Chen, H.; Wang, J.; Zhou, X.; Xu, Y. A Remote Sensing Image Target Detection Algorithm Based on Improved YOLOv8. Appl. Sci. 2024, 14, 1557. [Google Scholar] [CrossRef]
  23. Kumar, B.S.S.; Wani, I.A. Realtime Drone Detection Using YOLOv8 and TensorFlow.JS. J. Eng. Sci. 2024, 15, 261–267. [Google Scholar]
  24. Ozel, M. Drone Dataset (UAV). WebPage, 12. Available online: https://www.kaggle.com/dasmehdixtr/drone-dataset-uav (accessed on 25 April 2024).
  25. Wu, Q.; Feng, D.; Cao, C.; Zeng, X.; Feng, Z.; Wu, J.; Huang, Z. Improved mask r-cnn for aircraft detection in remote sensing images. Sensors 2021, 21, 2618. [Google Scholar] [CrossRef] [PubMed]
Figure 1. YOLO family timeline.
Computers 13 00234 g001
Figure 2. Drone images samples from the dataset [24].
Computers 13 00234 g002
Figure 3. (a) The location distribution of drone object within dataset. (b) The size distribution of the drone objects within dataset.
Computers 13 00234 g003
Figure 4. (a) Precision–recall curve for specific dataset at 50 epochs. (b) Precision–recall curve for specific dataset at 100 epochs. (c) Precision–recall curve for specific dataset at 150 epochs. (d) Precision–recall curve for specific dataset at 200 epochs.
Computers 13 00234 g004
Figure 5. (a) Precision–recall curve for specific dataset at 640 image size. (b) Precision–recall curve for specific dataset at 800 image size.
Computers 13 00234 g005
Figure 6. (a) Precision–recall curve for flip augmented specific dataset. (b) YOLOv8 model precision-recall curve for rotation-augmented specific dataset. (c) YOLOv8 model precision–recall curve for crop-augmented specific dataset (d) YOLOv8 model precision–recall curve for blurring-augmented specific dataset. (e) YOLOv8 model precision–recall curve for gray-scale-augmented specific dataset.
Computers 13 00234 g006
Figure 7. YOLOv8 model results for specific dataset.
Computers 13 00234 g007
Figure 8. Precision–recall curve for specific dataset.
Computers 13 00234 g008
Figure 9. (a) F1–confidence curve for specific dataset. (b) Recall–confidence curve for specific dataset. (c) Precision–confidence curve for specific dataset.
Computers 13 00234 g009
Figure 10. Test results for specific dataset.
Computers 13 00234 g010
Figure 11. YOLOv8 model results for augmented dataset.
Computers 13 00234 g011
Figure 12. Precision–recall curve for augmented dataset.
Computers 13 00234 g012
Figure 13. (a) F1–confidence curve for augmented specific dataset (b) Recall–confidence curve for augmented specific dataset (c) Precision–confidence curve for augmented specific dataset.
Computers 13 00234 g013
Figure 14. Augmented dataset result.
Computers 13 00234 g014
Table 1. Confusion matrix.
Confusion Matrix Real Parameters
POSITIVENEGATIVE
Predicted ParameterPOSITIVETPFP
NEGATIVEFNTN
Table 2. Comparison table.
MethodDataset SizePrecisionRecallmAP
CNN [17]71296%94%95%
SVM [17]71282%91%88%
KNN [17]71274%94%80%
MaskRCNN [25]135993.6%89.4%92.5%
YOLOv3 [21]135992%70%78.5%
YOLOv4 [21]135991%89%93.8%
YOLOv5 [21]135994.7%92.5%94.1%
(Transfer Learning)
YOLOv8135995.4%93.4%97%
Proposed Model *321294.6%96.05%97.8%
* Model with data augmentation and hyperparameter adjustments implemented.
Disclaimer/Publisher’s Note: The statements, opinions and data contained in all publications are solely those of the individual author(s) and contributor(s) and not of MDPI and/or the editor(s). MDPI and/or the editor(s) disclaim responsibility for any injury to people or property resulting from any ideas, methods, instructions or products referred to in the content.

