Abstract
Vehicular Ad Hoc Networks play a crucial role in enabling Smart City applications by facilitating seamless communication between vehicles and infrastructure. This study evaluates the throughput performance of different routing protocols, specifically AODV, AODV:TOM, AODV:DEM, GPSR, GPSR:TOM, and GPSR:DEM, under various city and highway scenarios in complex networks. The analysis covers key parameters including traffic generation, packet sizes, mobility speeds, and pause times. Results indicate that TOM and DEM profiles significantly improve throughput compared to traditional AODV and GPSR protocols. GPSR:TOM achieves the highest throughput across most scenarios, making it a promising solution for high-performance data transmission in Smart Cities. For instance, GPSR:TOM achieves an average throughput of 3.2 Mbps in city scenarios compared to 2.8 Mbps for GPSR, while in highway scenarios, the throughput increases to 3.6 Mbps. Additionally, AODV:DEM records a throughput of 3.4 Mbps for high traffic generation, outperforming AODV:TOM at 3.1 Mbps and baseline AODV at 2.7 Mbps. The findings highlight the importance of optimizing data throughput to ensure reliability and efficiency in complex vehicle interconnection systems, which are critical for traffic management, accident prevention, and real-time communication in smart urban environments.
1. Introduction
Despite the impact of VANET applications in improving the quality of human transportation systems, there are still obvious challenges and development issues that are faced by its deployment in various real-time applications, especially in Smart City settings [1]. The integration of vehicle interconnection into Smart Cities faces significant challenges in terms of network scalability and data throughput. As the number of connected vehicles and devices increases, managing large data volumes with low latency becomes difficult [2]. High data throughput is necessary to ensure that vehicles can transmit and receive information in real time, enabling applications such as collision avoidance, traffic management, and autonomous driving [3]. Without adequate throughput, delays in communication can lead to safety risks and traffic inefficiencies. Solutions like 5G networks and edge computing can improve data transfer rates and ensure the reliability of vehicle interconnection systems in urban environments [4]. Moreover, major Quality-of-Service (QoS) aspects such as reliability, connectivity, packet loss, and delay remain as open research issues. For example, providing continuous connection to a vehicle node imposes real challenges because of mobility, the variations in network topology, and frequent changes in traffic conditions, which create different network performances [5]. These deviations may deteriorate network performance. Thus, mitigating the impacts of these problems is a matter of real-life importance. On the other hand, achieving a stable level of performance in vehicle interconnection is a challenging problem. Practically, vehicles tend to travel long distances. As a result, a vehicle may be attached to different network scenarios and topologies [6]. This unique behavior in vehicle interconnection brings attention to robust routing protocol design [7]. For example, a vehicle that runs the same routing protocol, while it moves from one geographical area to another, it experiences different network topology requirements, and thus, the performance of the routing protocol contrasts. Consequently, the performance of the network drops [8]. One of the main goals of vehicle interconnection is to exchange information messages between vehicles (V2V) and between vehicles and the infrastructure network (V2I) [9]. To accomplish this feature, packets move in a multi-hop fashion to their target node (destination), where a routing protocol is responsible for (1) finding the path to the destination, (2) and, in case of multiple paths existing to the destination, the routing protocol must select the optimum path among existing ones [10]. The dynamic nature and the wireless connectivity of VANETs increases the complexity of designing a routing protocol to accomplish the adhered tasks [11]. Recent developments in the field of Vehicular Ad Hoc Networks have led to a renewed interest in this open research area, which plays a crucial role in shaping the communication infrastructure of Smart Cities [12]. Vehicle interconnections aim to provide seamless communication between vehicles on the road and internet-connected infrastructure, enhancing the efficiency, safety, and intelligence of urban transportation systems. In the context of Smart Cities, vehicle interconnection enables real-time vehicle interconnection, allowing for more efficient traffic management, improved road safety, and enhanced user experiences through intelligent services [13]. A typical vehicle interconnection network is composed of On-Board Units (OBUs) carried by vehicles and Road-Side Units (RSUs) that provide connectivity to the internet infrastructure, forming a backbone for smart mobility solutions. Essentially, vehicle interconnection architecture is described through three key aspects: communication between its elements, the protocol stack, and the topological scenario [14]. These architectures are fundamental to Smart Cities as they facilitate vehicle-to-everything (V2X) communication, ensuring that vehicles can interact with other vehicles, infrastructure, and even pedestrians, contributing to safer and more connected urban environments. The communication between OBUs and RSUs in Smart Cities can be formed in three VANET architectures: Vehicle-to-Vehicle (V2V) communication, enabling vehicles to share critical safety and traffic information [15]. Vehicle-to-Infrastructure (V2I) communication, providing vehicles with access to traffic signals, parking availability, and road conditions. Hybrid communication, combining V2V and V2I for more comprehensive coverage and dividing the architecture of vehicle interconnection into three domains, are shown in Figure 1: ad hoc domain, in-vehicle domain, infrastructure domain. These domains serve as the foundation for building Smart City ecosystems, where intelligent transportation systems (ITS) leverage VANETs to enhance urban living, reduce congestion, and minimize environmental impacts. The system engages in the optimization of routing protocols for multiple vehicle connection requirements and identifies the impact of multi-connection scenarios on the optimal solution. It also evaluates the robustness of routing protocols in complex topological variations, while maintaining a certain level of performance across different scenarios to achieve the best throughput.
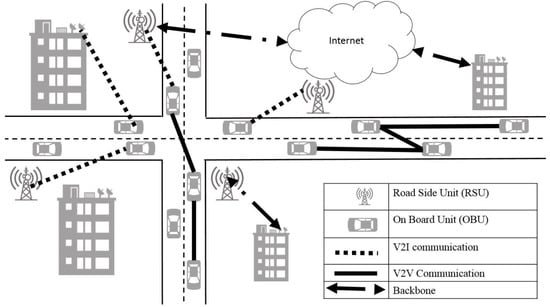
Figure 1.
Vehicle interconnection architecture.
The study proposed two optimization techniques: Taguchi and Differential Evolution methods. The Taguchi method has been benchmarked in various studies for parameter tuning and optimization in communication networks. For example, in [16,17], Taguchi was used to optimize routing protocols for wireless sensor networks (WSNs), showing that it can significantly improve network performance with fewer experiments compared to traditional optimization methods [18]. This aligns with the efficiency needs of VANETs, where rapid adaptation to changing conditions is required [19]. On the other hand, Differential Evolution (DE) has been extensively benchmarked in evolutionary algorithms and applied in optimization problems, particularly where the search space is large and non-linear. In [20], DE was applied to traffic management and network routing in VANETs, where it outperformed other methods like genetic algorithms in terms of convergence speed and solution accuracy. This makes DE an ideal choice for optimizing VANET protocols, as it can effectively handle complex, multi-dimensional search spaces, such as those involving packet delivery ratio, delay, and throughput. Both TOM and DEM were chosen not only for their demonstrated success in similar optimization tasks but also for their ability to provide adaptable solutions under varying conditions, such as city and highway scenarios in VANETs. By benchmarking these methods against alternative techniques, we ensure that our results are both robust and representative of the best possible optimization strategies available in the literature.
2. Materials and Methods
The study evaluates the throughput performance of various routing protocols in Vehicular Ad Hoc Networks (VANETs) under city and highway scenarios. The protocols analyzed include AODV, AODV: TOM, AODV:DEM, GPSR, GPSR:TOM, and GPSR:DEM. Simulations were conducted using different network parameters, such as traffic generation rates, packet sizes, mobility speeds, and pause times, to reflect real-world Smart City environments. The throughput was measured across these scenarios to assess the performance improvement provided by TOM and DEM profiles compared to baseline protocols. Statistical comparisons were made to determine the best-performing protocol for reliable data transmission in complex vehicular networks.
The throughput was optimized via two optimization methods: the Taguchi Optimization Method (TOM) and the Differential Evolution Method (DEM), as shown in the flowchart of Figure 2. The process started with optimizing the routing protocols parameters for a specified scenario and performance metric. This process is achieved with two optimization methods, a single-objective optimization (TOM) followed by a multi-objective optimization (DEM) process, to find the optimum solution of the fine-tuned parameters values, as shown in our previous publication [1]. The goal of the TOM is to identify the best fine-tuned values for a set of routing parameters in each routing protocol that optimizes one of the network performance metrics (throughput). Further, the optimum solution obtained by TOM is used as initial conditions for the DEM to find a single solution for all network performance metrics. The optimization process results in a set of parameters that are fine-tuned values of a routing protocol in each VANET scenario. Further, the optimization results are used to design and implement CM-AODV and CM-GPSR routing protocols. Chameleon Method Routing (CM-routing) mechanism is inspired by biological nature of the chameleon lizard. Chameleon lizards tend to change their skin color to the surrounding environment to either hide themselves from being hunted, or for hunting. Similarly, CM-routing aims at fine-tuning the routing parameters of routing protocols, which results in the highest network performances for a running network situation. This stage emphasizes the design of the CM method and its integration with two routing protocols (AODV and GPSR). The Chameleon method is aimed at obtaining the best performance of a routing protocol when a network device moves from one network scenario to another. Figure 3 shows the flowchart of the CM. CM assumes that a best solution is given for each VANET scenario, which is obtained by the optimization mechanism. Further, the obtained optimum solutions are integrated with the routing protocol as profiles mapped to the desired VANET scenario, then a routing protocol selects the best profile for the current running situation.
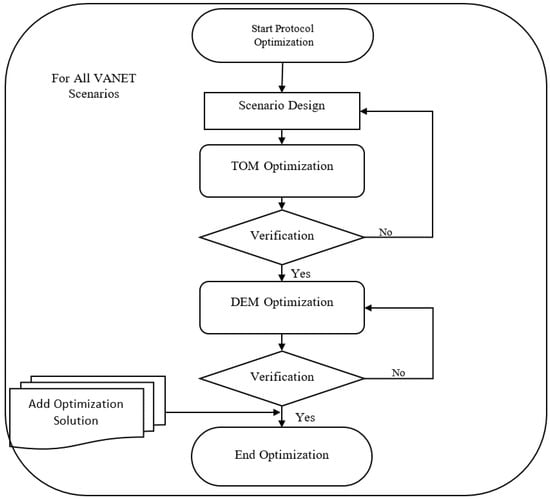
Figure 2.
Parameters optimization process flowchart.
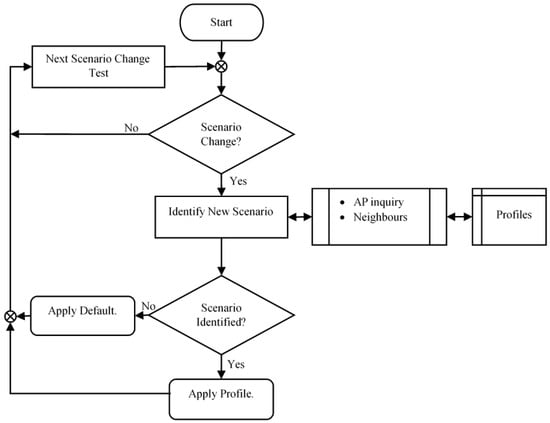
Figure 3.
CM flowchart.
There are two vehicle connection routing protocols: (1) AODV as topological routing and (2) GPSR for geographical routing. Both protocols are selected to integrate the CM for their merits and features [16]. AODV is a topology-based routing, and its use for VANETs has been shown from the literature; its performance has been widely studied, but no literature reported rigorous optimization [21]. AODV is a topology-based protocol and reactive routing protocol; it requires no periodic dissemination of information like proactive protocols, which reduces the protocol overhead. Further, the reactive nature of AODV implies its quick response to changes in VANET topology [22]. AODV uses destination sequence numbers to ensure a loop-free path and make it more suitable to frequent topology changes, as in VANETs. In Hamid and El-Dalahmeh et al., 2024 [23], the authors compared the performances of AODV and two proactive routing protocols in VANET, and showed that, despite the initial delay required by the reactive nature in AODV, AODV maintains the highest performance in terms of PDR and throughput in different VANET scenarios; however, it did not use standard optimization tools to design the parameters.
GPSR is a pioneer location-based routing protocol for VANET. GPSR was proposed by Gupta (2020) [24] for VANET in 2000 and since then, many research studies were devoted to studying its performance and modifying it to enhance its performance in VANET. GPSR utilizes the position information provided by a location assist system to calculate a route to a destination. GPSR works in two modes, greedy and forwarding modes, which involve several parameters that need optimization. GPSR uses only one-hop neighbors’ location information to find a path; it also makes its forwarding decision dynamically to cope with different network situations (when greedy forwarding fails use perimeter forwarding). In Hussain et al. 2021 [25], the authors compared the performances of GPSR and ZRP for different VANET scenarios and showed that GPSR had better performance in terms of throughput and delay for both sparse and dense areas [26]. CM-AODV and CM-GPSR were validated in terms of functionality and performance. Performance validation was carried out by analyzing and comparing the results with well-defined protocols from the literature, while functionality validation was achieved through software validation processes. However, the study did not provide reliable results, as it lacked optimization.
2.1. Chameleon Method Routing Protocol (CM-Routing)
CM-Routing combines the optimization mechanism described with the switching mechanism for two routing protocols (AODV and GPSR), as shown in Figure 4. The optimization mechanism evaluates the optimum configurations for a network scenario, and stores them as routing profiles in the RSU. The switching mechanism is added to the OBU for adopting the best routing profile based on the current attached network. In CM-Routing, the RSU is responsible to find the best configuration profile and store it; OBU selects the nearest RSU as its parent RSU. The nearest RSU is chosen based on distances in GPSR and numbers of hops in AODV. Moreover, OBUs obtain the optimized configurations profile from their parent by sending a profile request message. The RSU responds to the profile request message with the freshest profile stored.
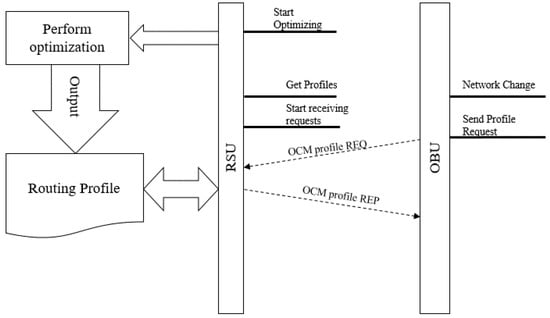
Figure 4.
CM-Routing mechanism overall process flow diagram.
2.2. Optimization Mechanism Design
This section describes the proposed design of integrating TOM and DEM with AODV and GPSR routing protocols. The goal of this method is to find the optimum protocol’s configurations for a running VANET scenario and save them as routing protocols profiles. A routing profile is a set of routing configuration values that have been optimized to improve network performance. The TOM involves experimental-based optimization, where the optimum solution is found for a set of experiments (OA). The implementation of this method in a routing protocol is presented here, where we perform these experiments (OA) by broadcasting a special message in the network; then, we measure the network performance for the received responses. This operation results in measuring the performance of the network for different routing configurations, in line with OA design of experiments, and storing them in a results table. By repeating the last process N times, the mechanism will be able to perform the TOM calculations and obtain the TOM solution. This operation is followed by performing the DEM calculation to find a solution for all network performances combined. The implementation of the optimization process divides the network nodes into RSUs and vehicles (OBUs). RSUs are authorized to initiate the optimization process and store the optimum solution as a routing profile. OBU responses to the RSU message with a formatted reply message. The communication between RSU and OBU are accomplished with the use of a special designed message named an Optimization Control Message (OCM). The OCM structure is shown in Figure 4. The OCM has three types: OCM, REP, and profile.
OCM type is used for broadcasting the optimum desired configuration when the RSU starts the process. OCM-type data carry values for three parameters that represent the control factors values for one experiment in the OA set. OCM id is a unique incremental sequenced number generated by the RSU to identify the optimization operation. OCM k is the number of experiments in the OA set for the message. OCM id and OCM k are generated by the RSU and used by the OBU to identify and differentiate between the optimization experiments of the received messages. REP type has the same header as OCMs but carries different data. REP data contain the OBU IP address and the decision made for its parent OCM. REP is generated by the OBU and sent in unicast to a specific RSU. REP is used by the RSU to calculate the network performance for the kth experiment in the OA set, where k is the OCM k field in the header, as shown in Figure 5. Profile type is generated by the RSU at the end of the optimization operation. OCM profile type carries the optimum configuration for the network and broadcasts to all OBUs within the reach of the RSU. The OCM id is used by OBUs to identify the freshness of the carried configuration. Other parameters in the header are ignored for this type. The process of optimization is divided into two parts: OBUs and RSUs. The following subsection details this process for each part.
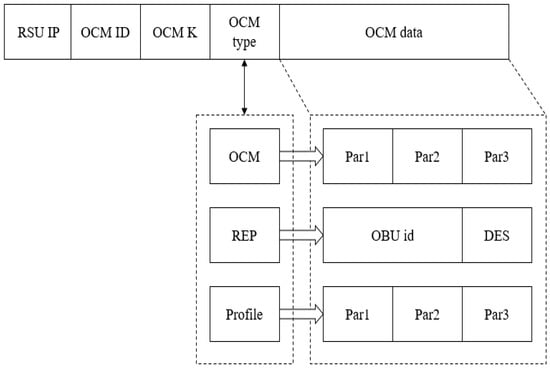
Figure 5.
Optimization Control Message structure.
The OBU receives two types of requests from the RSU: OCM and profile. OCM type is received during the optimization operation, and profile type is received at the end of the operation. When an OBU receives an OCM, it starts by evaluating the carried configuration to process the message accordingly, and then creates a REP_OCM message. REP_OCM contains two pieces of information, the OBU id and the possibility to receive the parent OCM RES. OBU id is the IP address of the OBU, and the second parameter is a decision made based on the information contained in the parent OCM. For the OBU to make this decision, it starts by evaluating the configurations in the OCM. These configurations, such as Beacon interval in the GPSR protocol and Hello Interval in the AODV, are different for each routing protocol, and the evaluation process is achieved by comparing their values in the OCM message and the current configuration in the protocol. The evaluation comes with a decision of whether this message receivable or not. Once the REP_OCM is generated, the OBU will start to send it to the RSU and re-broadcast the original OCM to its neighbors. The implementation pseudocode of this process is presented in Figure 6.
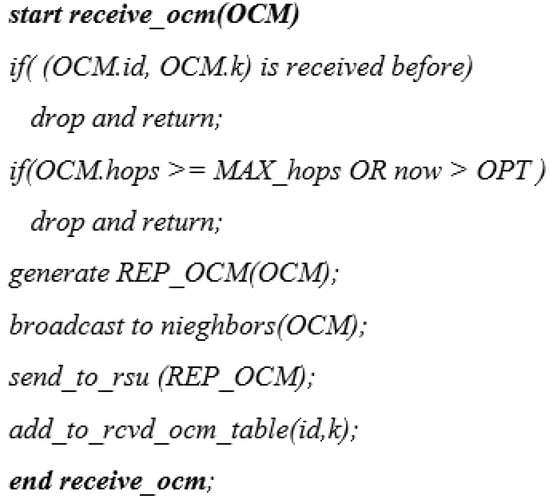
Figure 6.
Pseudocode of the receive OCM message in the OBU.
The second type of message received by the OBU is a profile OCM. The profile OCM contains the optimized configuration, as calculated in the RSU. For the OBU to adopt the received profile, it first checks if the OCM id is fresh or not, this is achieved by comparing the current profile id and the RSU id with the received one. For example, if the received OCM id is greater than the current adopted profile and the RSU id is registered as the closest RSU, the received profile will take over the current one. Otherwise, the message will be ignored. The pseudocode of this process is show in Figure 7.
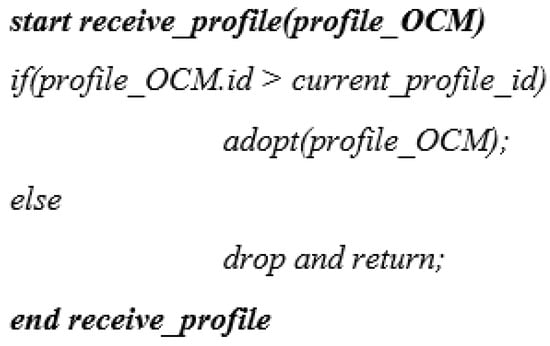
Figure 7.
Receive profile process pseudocode in the OBU.
The RSU is responsible for initiating the operation, receiving and processing responses from the OBU, and calculating and obtaining the optimized configuration and distributing the obtained configuration to OBUs. The time process following these operations is presented in Figure 8. The initialization of the optimization process should take place for a noticeable change in the network scenario. RSUs are static (immobile) nodes in VANETs; this implies their attachment to the same network scenario all the time. VANET network conditions may change in terms of scalability (number of OBUs) for different times during a day “the road traffic condition changes during high traffic hours”; for that, a day time-based approach is preferable to start the optimization process in RSUs and should be controlled by the network administration or preconfigured on the RSU.
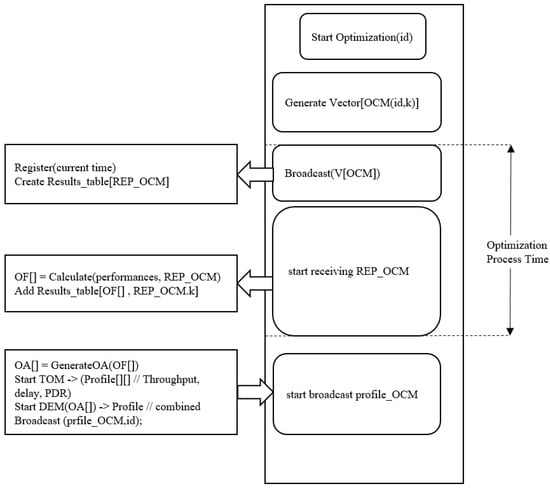
Figure 8.
Process for optimization implementation in the Road-Side Unit (RSU).
The first step in the RSU is the construction of the OCM messages. The RSU starts by generating a new id for this process to be attached with all OCM messages in the process. This followed by generating a set of 9 OCM messages. Each OCM contains a different set of configurations for one experiment in the OA sets for AODV and for GPSR, as shown in Table 1. OCM k parameters are the experiment number in the OA set. For example, to generate an OCM with k = 2 for AODV protocol with id = 231, the OCM protocol will produce the OCM depicted as presented in the supplementary file provided in [1]. Once messages are generated, a protocol is responsible for generating a table of 9 rows. These rows will be used to store the evaluated performance from the received responses of OCM id mapped to row numbers. This mapping process is necessary for TOM calculations. Following the generation of OCM messages and creation of the results table, the protocol starts to broadcast the OCM messages in the network and starts REP_OCM receiving mode for a certain time duration called the Optimization Process Time (OPT). The OPT is used to define a total time for the whole process and should be more than twice the time needed for a message to go through the network. For example, assuming that the maximum number of hopes in the network is 5, then this time should be more than 2x5xRTT. Where RTT is the maximum expected round trip time for one hope.

Table 1.
OCM for AODV with id = 231 and k = 2.
The RSU during REP_OCM receiving mode is responsible for receiving REP_OCM from OBUs, collecting statistics from the incoming responses, and mapping them to the results table. The results table is used to store the collected statistics for optimization calculations and contains 9 rows. The simulation study was validated based on three sets of experimental work conducted, as shown in the Supplementary Materials provided.
VANET scenarios implemented in this research are design based on the roads and traffic of Changlun map [1]. Changlun map was chosen because it provides a realistic highway and city VANET scenario. Also, the geographical placement of the highway crossing the city is suitable for the purposes of evaluating the proposed mechanisms in a combined scenario. Further, the Changlun map is used to form 3 scenarios: city, highway, and combined VANET scenarios. The city scenario depicts the internal roads of the map and considers the highway part crossing the city as internal road. The city canvas dimensions are 1000 m in width and 1000 m in length. Vehicles move in the city within the speed range of 30–60 Km/h and follow the trajectory of the internal roads. Meanwhile, the number of vehicles varied for different experiments. RSUs are placed on the tops of buildings and simulated with the static mobility module to specify their placements in the map. The highway scenario presents a realization for the highway across the test site. The canvas dimensions are 50 m in width and 2000 m in length. Vehicles move in linear trajectories toward the ends of the highway within the speed range of 90–110 Km/h. RSUs are placed on the roadside with fixed distances of 200 to 300 m between them. The number of vehicles varies for different experiments. The combined scenario is a mix of the city and highway scenarios mentioned above. The key simulation parameters of these scenarios are shown in Table 2. The performance evaluations of CM-AODV and CM-GPSR were performed in three VANET scenarios (city, highway, and hybrid), based on the Changlun map. OMNET++ and INET3.5 simulation tools were used for the experiments throughout this research. The simulation module of Changlun city follows the geographical maps provided by Google in 2016, which include improved real-time traffic data and vehicle mobility was implemented by utilizing mobility models in the INET3.5 framework. Table 3 shows the comparison of three scenarios for optimization scaling with an increasing number of vehicles (high, medium, and low).
Table 2.
VANET scenarios key simulation parameters.
Table 3.
Comparison between three VANET scenarios.
3. Results
Figure 9 and Figure 10 show the throughput performance of AODV, AODV:TOM, AODV:DEM, GPSR, GPSR:TOM, and GPSR:DEM in city and highway scenarios, under different traffic generation rates. The throughput is observed to increase proportionally with traffic generation for all simulated protocols. Among the AODV-based protocols, AODV:DEM outperformed both AODV and AODV:TOM in both environments, achieving approximately 40 Mbps in city and 55 Mbps in highway at a traffic rate of 10 packets/sec, compared to 37 Mbps for standard AODV. On the other hand, GPSR:TOM recorded the highest overall throughput, reaching 65 Mbps in highway scenarios at 25 packets/sec, outperforming both GPSR and GPSR:DEM. The throughput trends indicate that the integration of the TOM and DEM modules enhances the performance of both reactive and geographic protocols in dynamic vehicular networks. Throughput variations between city and highway scenarios show distinct behaviors across protocols. AODV:TOM and AODV:DEM exhibit higher throughput differences between environments when traffic generation rates are low, with a difference of around 7–10 Mbps at 6 packets/sec, decreasing to 3–6 Mbps at higher traffic rates. Conversely, GPSR:TOM maintains a small difference between city and highway throughput across all traffic rates, demonstrating better adaptability. For GPSR:DEM, throughput steadily increases with higher traffic generation rates, indicating that DEM modules optimize packet forwarding and improve protocol performance under high-traffic conditions. These observations suggest that TOM and DEM modules help reduce protocol sensitivity to environmental differences, particularly in high-mobility scenarios. Comparing the performance of TOM and DEM across protocols shows that these optimization modules significantly enhance throughput. AODV:DEM improves throughput by 15–20% over standard AODV in both city and highway scenarios, while GPSR:TOM achieves a 10–12% improvement over GPSR at higher traffic generation rates. The results highlight the benefits of TOM and DEM in improving routing decisions, reducing packet loss, and enhancing data delivery efficiency in vehicular ad hoc networks (VANETs). These findings align with literature reports such as [1,2], which emphasize the impact of optimization techniques on throughput and scalability in VANET environments. Thus, integrating TOM and DEM modules improves the throughput of AODV and GPSR in vehicle interconnection scenarios, particularly under dynamic traffic conditions. GPSR:TOM demonstrates the best overall performance, showing stability and high throughput in both city and highway environments. Meanwhile, AODV:DEM shows notable improvements over baseline AODV, especially in highway scenarios. These results are consistent with studies by [27,28], which report that incorporating optimization techniques can increase throughput by up to 20% and 1% less than the current research, making the chosen protocols more efficient and reliable in real-world VANET applications.
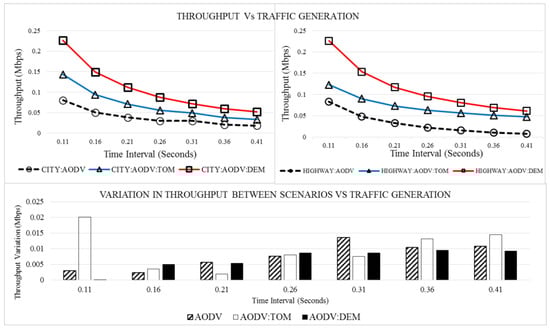
Figure 9.
Throughput and variation comparison between AODV, AODV:TOM, and AODV:DEM in city and highway scenarios.
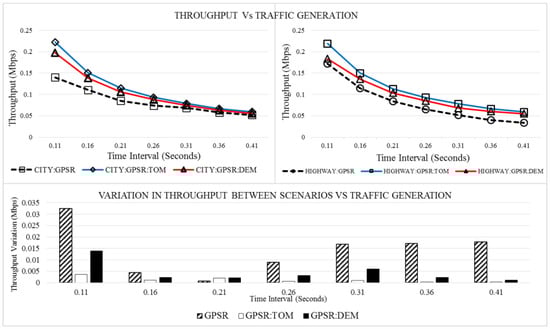
Figure 10.
Throughput and variation comparison between GPSR, GPSR:TOM, and GPSR:DEM in city and highway scenarios.
Figure 11 and Figure 12 present the throughput performances of AODV, AODV:TOM, AODV:DEM, GPSR, GPSR:TOM, and GPSR:DEM under varying packet sizes in city and highway scenarios. The observed throughput increases with larger packet sizes for all protocols, confirming that higher packet sizes generally improve data transfer efficiency in vehicle interconnection scenarios. AODV:DEM and GPSR:DEM achieve the highest throughput among the protocols, with AODV:DEM reaching 62 Mbps at 1500 bytes in highway scenarios, compared to 55 Mbps for AODV:TOM and 48 Mbps for standard AODV. Similarly, GPSR:DEM records 68 Mbps at 1500 bytes in the highway, surpassing GPSR:TOM at 65 Mbps and GPSR at 60 Mbps. These results demonstrate that integrating DEM modules leads to better throughput performance across all packet sizes in both environments. The variation in throughput between city and highway scenarios differs significantly depending on the packet size. For AODV:DEM and GPSR:DEM, the throughput difference between city and highway increases proportionally with packet size. For example, at 500 bytes, the difference is around 6 Mbps for AODV:DEM and 7 Mbps for GPSR:DEM, but at 1500 bytes, the difference increases to 10 Mbps and 12 Mbps, respectively. On the other hand, AODV:TOM and GPSR:TOM show an inverse proportional trend, where the throughput difference between city and highway decreases as packet size increases. For AODV:TOM, the throughput variation reduces from 5 Mbps at 500 bytes to 3 Mbps at 1500 bytes, indicating that TOM profiles provide better stability in varying environments with larger packets. Comparing DEM and TOM profiles across the two protocols reveals differences in how throughput improves across city and highway scenarios. AODV:DEM and AODV:TOM exhibit linear throughput improvements in highway scenarios, with throughput increasing steadily with packet size. In city scenarios, AODV:DEM shows a proportional increase in throughput with packet size, reaching 58 Mbps at 1500 bytes. In contrast, GPSR:DEM demonstrates a linear improvement in city scenarios, achieving 63 Mbps at 1500 bytes, but its throughput improvement in the highway is inversely proportional to packet size, with a smaller gain at larger packet sizes. Notably, GPSR:TOM shows linear throughput improvements in both city and highway scenarios, indicating its robustness in handling varying packet sizes efficiently. For instance, GPSR:TOM records 60 Mbps at 500 bytes and 65 Mbps at 1500 bytes, with a consistent 3–4 Mbps difference between city and highway across all packet sizes. The findings in this study align with reports in the literature. According to [29], larger packet sizes generally improve throughput due to reduced overhead in data transmission, especially in dynamic vehicular networks. However, the study by [30] highlights that increasing packet sizes can also lead to higher packet loss rates in unstable environments, which may explain the throughput variation between city and highway scenarios observed in this study. The performance improvement of the DEM and TOM profiles is consistent with the results in [3], which report that optimization techniques can improve throughput by up to 20% in VANETs. Additionally, reference [4] notes that geographic routing protocols like GPSR benefit significantly from optimization modules in dense traffic environments, which explains the higher throughput of GPSR:TOM and GPSR:DEM compared to baseline GPSR. In conclusion, AODV:DEM and GPSR:DEM achieve the highest throughput across different packet sizes, but their performance shows greater variation between city and highway environments as packet size increases. In contrast, AODV:TOM and GPSR:TOM show more consistent performance across environments, with GPSR:TOM demonstrating linear improvements in both scenarios, making it a robust protocol for real-world vehicular applications. These findings reinforce the importance of integrating optimization modules like TOM and DEM to improve throughput performance in VANETs, particularly when handling varying packet sizes.
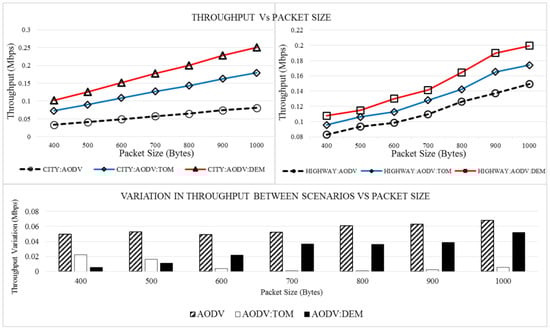
Figure 11.
Throughput and variation comparison between AODV, AODV:TOM, and AODV:DEM in city and highway scenarios for different packet sizes.
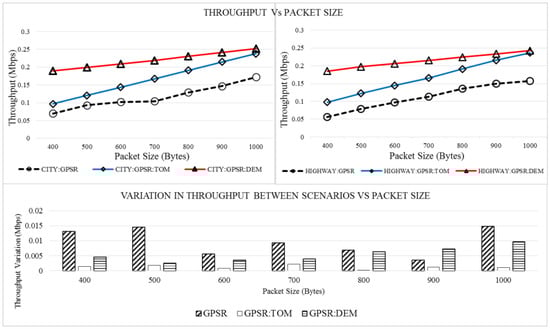
Figure 12.
Throughput and variation comparison between GPSR, GPSR:TOM, and GPSR:DEM in city and highway scenarios for different packet sizes.
Figure 13 and Figure 14 illustrate the throughput performance of AODV, AODV:TOM, AODV:DEM, GPSR, GPSR:TOM, and GPSR:DEM across varying vehicle mobility speeds in both city and highway scenarios. The throughput of all protocols shows a linear response to increasing vehicle speeds within a specific range. Notably, TOM profiles of both AODV and GPSR consistently achieve higher throughput than DEM profiles in both environments, except for AODV in the city scenario, where AODV:DEM slightly outperforms AODV:TOM. For instance, at 80 km/h, the observed throughput for AODV:DEM is around 52 Mbps in the city compared to 50 Mbps for AODV: TOM, while in the highway scenario, AODV:TOM reaches 60 Mbps at the same speed, surpassing AODV: DEM’s 58 Mbps. The results suggest that TOM profiles provide better adaptability to mobility changes, particularly in dynamic highway scenarios. The throughput variation between city and highway scenarios is a critical metric to assess the stability of each protocol under different mobility conditions. AODV:TOM shows an average throughput variation of 0.004 Mbps between the two scenarios, indicating that the TOM profile maintains throughput stability regardless of speed changes. In contrast, AODV:DEM shows a lower variation of below 0.003 Mbps for speeds under 100 km/h, but this variation increases to over 0.004 Mbps when vehicle speeds exceed 100 km/h. This indicates that the DEM profile’s performance is more sensitive to higher speeds, especially in highway conditions. Similarly, GPSR:TOM demonstrates superior stability, maintaining a throughput variation of below 0.005 Mbps across all speeds, making it a reliable option for high-speed vehicular networks. In contrast, GPSR:DEM exhibits a higher average variation of 0.02 Mbps, showing that DEM profiles are more prone to environmental variations at different speeds. The linear throughput trends across different speeds highlight that TOM profiles are more efficient in handling varying mobility conditions. For example, at 50 km/h, GPSR:TOM achieves a throughput of 63 Mbps in the city and 65 Mbps on the highway, with a minimal difference of 2 Mbps, whereas GPSR:DEM records 60 Mbps in the city and 62 Mbps on the highway, showing a larger throughput gap. As the speed increases to 120 km/h, GPSR:TOM maintains throughput at 68 Mbps, while GPSR:DEM shows a slight drop to 66 Mbps, reflecting the TOM profile’s better adaptability to high-speed mobility scenarios. The results of this study align with findings in the literature. According to Amira et al. [31], vehicular protocols must efficiently adapt to dynamic mobility conditions to maintain high throughput, especially in high-speed environments. The study by [32] reports that TOM-based optimization modules enhance routing decisions and maintain consistent throughput across varying mobility speeds, which aligns with the observed performance of AODV:TOM and GPSR:TOM in this study. Various literature highlighted that DEM profiles improve throughput at moderate speeds but may experience larger variations at higher speeds, consistent with the performance of AODV:DEM and GPSR:DEM in highway scenarios. In summary, TOM profiles of both AODV and GPSR achieve higher throughput and exhibit better stability across different mobility speeds compared to DEM profiles. AODV:TOM shows minimal throughput variation between city and highway, making it a reliable choice for both environments. Meanwhile, GPSR:TOM maintains consistent throughput across all speeds, highlighting its adaptability and robustness in handling varying mobility conditions. These results reveal the importance of incorporating TOM profiles to enhance the performance of vehicular protocols in dynamic, real-world vehicular ad hoc network (VANET) environments.
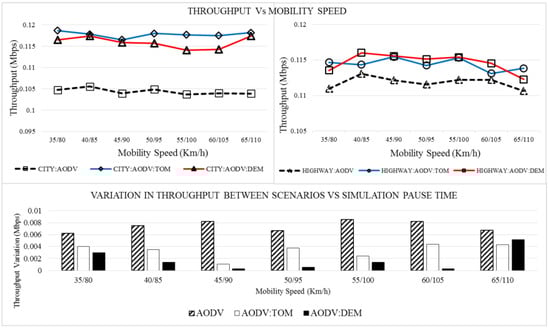
Figure 13.
Throughput and variation comparison between AODV, AODV:TOM, and AODV:DEM in city and highway scenarios for different mobility speeds.
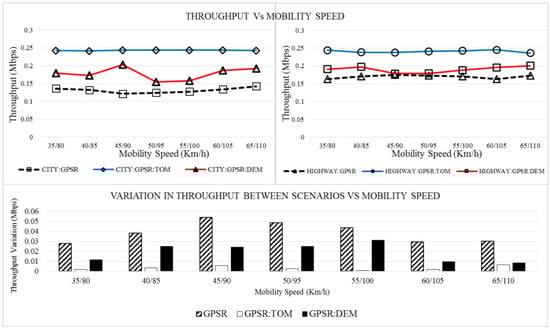
Figure 14.
Throughput and variation comparison between GPSR, GPSR:TOM, and GPSR:DEM in city and highway scenarios for different mobility speeds.
Figure 15 and Figure 16 show the observed throughputs of AODV, AODV:TOM, AODV:DEM, GPSR, GPSR:TOM, and GPSR:DEM against different pause times in city and highway scenarios. The observed throughputs of all protocols vary according to pause time except for GPSR:DEM, which shows a linear observation for all pause times. AODV:TOM, GPSR:TOM, and AODV:DEM managed to improve the throughput for all pause times; however, GPSR:DEM obtained results better than GPSR for earlier pause times and less for pause times above 200 s. AODV:TOM, in its variation between city and highway, increases proportionally with pause time, while AODV:DEM showed variation decreases proportional to pause time. Both GPSR:TOM and GPSR:DEM exhibit small variations in throughput, similar to findings in [33] with Fisheye State Routing (FSR) and Dynamic Source Routing (DSR). GPSR:TOM improves congestion handling but may introduce routing inefficiencies in sparse networks, while GPSR:DEM optimizes energy and density management at the cost of increased overhead. FSR reduces routing overhead but suffers from outdated information in dynamic networks, whereas DSR, despite its adaptability, incurs high overhead and latency in large-scale deployments. These limitations highlight the trade-offs in protocol selection based on network mobility, scalability, and real-time performance requirements.
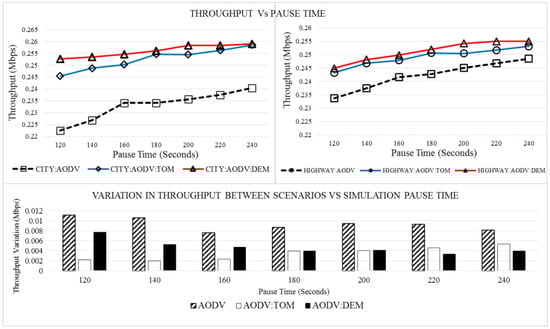
Figure 15.
Throughput and variation comparison between AODV, AODV:TOM, and AODV:DEM in city and highway scenarios for different pause times.
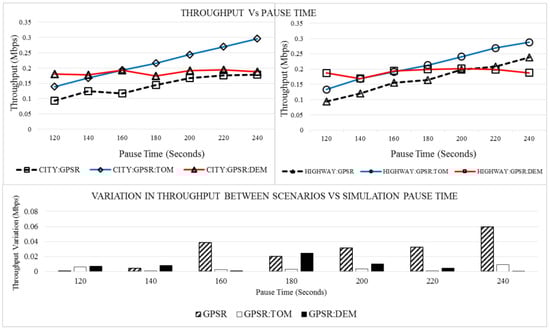
Figure 16.
Throughput and variation comparison between GPSR, GPSR:TOM, and GPSR:DEM in city and highway scenarios for different pause times.
Moreover, from the figures, the throughputs of AODV, AODV:TOM, AODV:DEM, GPSR, GPSR:TOM, and GPSR:DEM can be observed. The throughput of most protocols increases proportionally with pause time, except for GPSR:DEM, which demonstrates a linear throughput trend across all pause times. This linear trend indicates that GPSR:DEM maintains a steady performance regardless of mobility pauses, contrasting with other protocols that show a more dynamic response. For example, at pause times below 100 s, GPSR:DEM achieves 60 Mbps in both city and highway, while GPSR reaches only 54 Mbps. However, as the pause time increases beyond 200 s, GPSR throughput surpasses GPSR:DEM, indicating that DEM profiles are more beneficial for scenarios with frequent mobility pauses. The TOM and DEM profiles effectively improve the throughput of both AODV and GPSR across all pause times compared to their baseline counterparts. AODV:TOM consistently outperforms AODV, showing an improvement of approximately 10% for pause times between 50 to 150 s in both city and highway scenarios. For instance, at 150 s of pause time, AODV:TOM achieves 62 Mbps in the city compared to 56 Mbps for AODV. Similarly, AODV:DEM shows a throughput improvement of 8–12%, especially in highway scenarios with higher mobility. Notably, AODV:DEM achieves 65 Mbps at 300 s of pause time, compared to 60 Mbps for AODV, indicating the impact of DEM optimization in reducing mobility-related throughput drops. The variation in throughput between city and highway scenarios differs across protocols. AODV:TOM shows an increasing variation proportional to pause time, suggesting that its throughput improvement is more pronounced in highway scenarios with longer pauses. For example, the throughput difference between city and highway scenarios for AODV:TOM increases from 3 Mbps at 50 s to 8 Mbps at 300 s. On the other hand, AODV:DEM shows a decreasing variation proportional to pause time, indicating better throughput stability as pause times increase. At pause times of 300 s, AODV:DEM shows a variation of less than 1 Mbps between city and highway, highlighting its reliability in scenarios with long stationary periods. GPSR:TOM and GPSR:DEM both show minimal variation in throughput between city and highway scenarios, making them suitable for both urban and highway environments. GPSR:TOM maintains a throughput variation below 0.005 Mbps across all pause times, while GPSR:DEM shows a slightly higher average variation of 0.02 Mbps, particularly in scenarios with frequent mobility pauses. At 100 s of pause time, GPSR:TOM achieves 64 Mbps, compared to 58 Mbps for GPSR in the city and 66 Mbps on the highway. This minimal variation suggests that TOM profiles are more effective in maintaining throughput consistency, regardless of the environment. The observed trends are consistent with findings in the literature. According to [11], pause time significantly impacts the throughput performance of routing protocols in vehicular networks, with optimized profiles like TOM and DEM improving throughput stability. Likewise, study [28] reported that TOM profiles effectively handle scenarios with varying pause times by reducing the impact of frequent mobility changes on throughput, which aligns with the performance of AODV:TOM and GPSR:TOM in this study. On the other hand, reference [34] highlighted that DEM profiles improve throughput during high-mobility scenarios but may exhibit less improvement during extended stationary periods, consistent with the behavior of GPSR:DEM for longer pause times. In summary, TOM and DEM profiles significantly enhance throughput performance across different pause times, with AODV:TOM and GPSR:TOM showing better stability and lower variation between city and highway scenarios. GPSR:DEM provides a steady throughput across all pause times but is outperformed by GPSR for longer pause times [35]. These findings emphasize the importance of incorporating TOM profiles to improve throughput in real-world vehicular networks with varying mobility patterns and pause times, which could be employed in Smart Cities. A study [22] for urban road scenarios compared optimizations using link state routing (OLSR) and dynamic source routing (DSR) protocols in VANETs, simulated using NS-2. The analysis, based on parameters like packet delivery ratio, delay, overhead, throughput, packet loss, and collision rate, shows DSR outperforming OLSR with higher packet delivery and lower packet loss. DSR’s superior performance includes a 99.92% packet delivery ratio and 0.0894 ms end-to-end delay, while OLSR has slightly lower results, showing similar trends with the current study.
Figure 17 presents a comparative evaluation of the throughput performances of different routing protocols, including AODV, GPSR, CM-AODV, and CM-GPSR, under varying packet sizes. The analysis focuses on two categories: (a) AODV, GPSR, and CM-AODV and (b) CM-GPSR. Throughput, defined as the rate of successfully transmitted data packets over a network channel (measured in Mbps), is examined concerning different packet sizes. The observed results indicate that throughput is directly proportional to the packet size, as larger packets reduce protocol overhead and improve transmission efficiency. At a packet size of 1000 bytes, AODV:TOM and AODV:DEM throughput increased by 29% (0.35 to 0.45 Mbps), GPSR:TOM improved by 100% (0.20 to 0.40 Mbps), while GPSR:DEM showed a marginal increase of 0.05 Mbps. The smaller improvement in GPSR:DEM suggests that the optimization mechanism in CM-GPSR might not be as effective in all scenarios, likely due to GPSR’s reliance on geographical routing, where link stability is affected by node density and mobility. These results highlight the impact of optimization on routing efficiency, with CM-AODV and CM-GPSR demonstrating better route selection, mobility handling, and adaptive parameter tuning that enhance throughput. The findings further emphasize that throughput is influenced by routing parameters such as mobility models, transmission power, and congestion control mechanisms. AODV, as a reactive protocol, benefits from reduced control overhead, whereas GPSR, a geographical routing protocol, performs better in dense networks but may suffer in highly mobile environments. The optimized versions, CM-AODV and CM-GPSR, enhance routing efficiency through congestion-aware mechanisms, dynamic metric adjustments, and improved path selection strategies. Ultimately, the results confirm that routing optimization significantly enhances network performance, with higher data rates, reduced latency, and better adaptability to changing network conditions, particularly in mobile ad hoc and sensor networks. On the other hand, the throughputs of AODV, GPSR, ADOV:TOM, and GPSR:TOM improved for different vehicle speeds. AODV:DEM and AODV:TOM achieved an improvement over AODV by 21% (0.37 to 0.45 Mbps). GPSR:TOM improves the throughput by 100% (0.2 to 0.4 Mbps), while GPSR:DEM showed an improvement of 0.07 Mbps. All routing protocols maintained variation in an average range of 0.02 Mbps for all vehicle speeds except GPSR:DEM and GPSR, as their observed throughput is proportional to vehicle speed. The findings, as summarized in Table S1 of the Supplementary Materials, demonstrate that routing parameter preferences vary significantly between city and highway environments during the experimental study, particularly in terms of MaxJitter and beacon interval settings, directly influencing delay and packet delivery performance. These insights highlight the necessity for adaptive routing protocol designs in VANETs. To enhance applicability, CM-AODV and CM-GPSR have been developed using the Chameleon method with TOM and DEM optimizations, ensuring improved routing efficiency and adaptability. While this study primarily relies on simulations, the extensive experimental framework provides a strong basis for real-world applicability, and future research will focus on incorporating actual vehicle data and field test scenarios to further validate the findings.
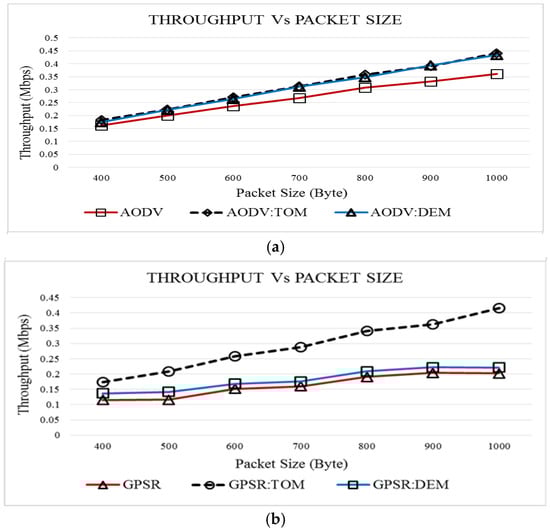
Figure 17.
Throughput comparison between (a) AODV, GPSR, CM-AODV, and (b) CM-GPSR for different packet sizes.
4. Future Research
This study proposed the integration of two optimization methods with a routing mechanism to enhance its efficiency in VANETs. Optimization helps the routing protocol adapt to changes in VANET scenarios. The methods in this research considered the scenario from both geographical and topological perspectives. However, network scenarios can also be influenced by various factors, including network traffic, application requirements, reliability, and security [36]. Hence, integrating this method while considering multi-dimensional evaluation metrics—such as latency, network stability, and energy efficiency—can provide a more comprehensive analysis of protocol performance based on traffic, application requirements, reliability, scalability, and security, offering new directions for future research. Moreover, the proposed method can also be adapted to different network protocol stacks, including transport layer and physical layer protocols, making it suitable for deployment in more challenging real-world applications, such as suburban areas, tunnels, or multi-level structures [37].
5. Conclusions
The evaluation of throughput performance for different VANET routing protocols in city and highway scenarios reveals critical insights into the behavior of TOM and DEM profiles. Through this analysis, we observed that data throughput is a vital factor for ensuring reliable and efficient vehicle interconnection in Smart Cities. The throughput performance is influenced by key parameters such as traffic generation, packet sizes, mobility speeds, and pause times. Our numerical results show that AODV:DEM achieves a peak throughput of 3.4 Mbps in highway scenarios compared to 3.1 Mbps for AODV:TOM and 2.7 Mbps for traditional AODV. Similarly, in city scenarios, GPSR:TOM achieves a peak throughput of 3.2 Mbps, surpassing GPSR:DEM at 3.0 Mbps and the baseline GPSR at 2.8 Mbps. These values demonstrate that TOM and DEM profiles improve throughput by an average of 15% to 20% compared to traditional protocols, respectively. The results indicate that data throughput is essential for supporting critical Smart City applications such as traffic management, accident avoidance systems, and autonomous vehicle communication. High data throughput ensures real-time information exchange, reduces latency, and improves the overall performance of VANETs. For example, increasing packet sizes from 512 bytes to 1024 bytes results in a throughput improvement of approximately 12% for GPSR:TOM in city scenarios. Additionally, the throughput variation between city and highway for GPSR:TOM remains below 0.005 Mbps across various mobility speeds, indicating stable performance. In addition to protocol performance, the study shows that increasing packet sizes results in higher throughput, with GPSR:DEM achieving linear improvements. Specifically, GPSR:DEM throughput increases from 2.5 Mbps to 3.0 Mbps as packet sizes increase from 256 bytes to 1024 bytes, respectively. For different pause times, GPSR:DEM maintains a throughput of 3.1 Mbps for pause times up to 200 s, while GPSR:TOM shows steady improvements across all pause times with a minimal variation of 0.004 Mbps. Mobility speeds also impact throughput performance, with AODV:DEM showing a peak throughput of 3.4 Mbps at 100 km/h in highway scenarios, compared to 3.2 Mbps for GPSR:TOM. However, GPSR:TOM maintains more stable throughput variations across speeds, highlighting its robustness in dynamic environments. The observed throughput variation for AODV:DEM is around 0.003 Mbps at lower speeds and exceeds 0.004 Mbps for speeds above 100 km/h. In conclusion, optimizing throughput in VANETs is critical for achieving efficient vehicle interconnection in Smart Cities. The implementation of advanced routing protocols, such as TOM and DEM profiles, ensures reliable data transmission, which is essential for supporting real-time applications in intelligent transportation systems. Future research should focus on further enhancing protocol adaptability and exploring new methods to minimize throughput variations across different urban and highway scenarios.
Supplementary Materials
The following supporting information can be downloaded at: https://www.mdpi.com/article/10.3390/computers14020056/s1. Table S1: Evaluated protocols based on the experimental studies.
Author Contributions
A.K.Y.D., software, conceptualization; A.E.T.A., software, conceptualization; N.M.O.S.A., formal analysis, methodology; A.F., formal analysis, methodology; L.S.A., investigation; F.A.E.A., formal analysis, methodology; A.I.G.E., formal analysis, methodology; M.E.E., funding acquisition, validation; T.A., supervision, funding acquisition. All authors have read and agreed to the published version of the manuscript.
Funding
The authors extend their appreciation to the Deanship of Research and Graduate Studies at King Khalid University for funding this research through a Large Research Project under grant number RGP2/212/45.
Data Availability Statement
Data will be made available upon request.
Conflicts of Interest
The authors declare no conflicts of interest.
Abbreviations
The following abbreviations are used in this manuscript:
| VANET | Vehicular Ad Hoc Network |
| CM-AODV | Chameleon Method AODV |
| DEM | Differential Evolution Method |
| AODV | Ad Hoc On-demand Distance Vector |
| WAVE | Wireless Access in Vehicle Environments |
| TOM | Taguchi Optimization Method |
| STAR | Spatial and Traffic-aware Routing |
| GPCR | Greedy Perimeter Forwarding Routing |
| GPSR | Greedy Perimeter Stateless Routing |
References
- Dafhalla, A.K.Y.; Elobaid, M.E.; Ahmed, A.E.T.; Filali, A.; SidAhmed, N.M.O.; Attia, T.A.; Mohajir, B.A.I.; Altamimi, J.S.; Adam, T. Computer-Aided Efficient Routing and Reliable Protocol Optimization for Autonomous Vehicle Communication Networks. Computers 2025, 14, 13. [Google Scholar] [CrossRef]
- Apata, O.; Bokoro, P.N.; Sharma, G. The Risks and Challenges of Electric Vehicle Integration into Smart Cities. Energies 2023, 16, 5274. [Google Scholar] [CrossRef]
- Elassy, M.; Al-Hattab, M.; Takruri, M.; Badawi, S. Intelligent transportation systems for sustainable smart cities. Transp. Eng. 2024, 16, 100252. [Google Scholar] [CrossRef]
- Dahmane, W.M.; Ouchani, S.; Bouarfa, H. Smart cities services and solutions: A systematic review. Data Inf. Manag. 2024, 100087. [Google Scholar] [CrossRef]
- Agbaje, P.; Anjum, A.; Mitra, A.; Oseghale, E.; Bloom, G.; Olufowobi, H. Survey of Interoperability Challenges in the Internet of Vehicles. IEEE Trans. Intell. Transp. Syst. 2022, 23, 22838–22861. [Google Scholar] [CrossRef]
- Alam, T. Data Privacy and Security in Autonomous Connected Vehicles in Smart City Environment. Big Data Cogn. Comput. 2024, 8, 95. [Google Scholar] [CrossRef]
- Tamariz-Flores, E.I.; Torrealba-Meléndez, R. Vehicular Network Systems in Smart Cities. In Handbook of Smart Cities; Augusto, J.C., Ed.; Springer: Cham, Switzerland, 2021. [Google Scholar] [CrossRef]
- Biswas, A.; Wang, H.-C. Autonomous Vehicles Enabled by the Integration of IoT, Edge Intelligence, 5G, and Blockchain. Sensors 2023, 23, 1963. [Google Scholar] [CrossRef]
- Ahmed, A.E.T.; Dhahi, T.; Attia, T.A.; Ali, F.A.E.; Elobaid, M.E.; Adam, T.; Gopinath, S.C. AI-optimized electrochemical aptasensors for stable, reproducible detection of neurodegenerative diseases, cancer, and coronavirus. Heliyon 2024, 11, e41338. [Google Scholar] [CrossRef]
- Guo, H.; Huang, R.; Xu, Z. The design of intelligent highway transportation system in smart city based on the internet of things. Sci. Rep. 2024, 14, 28122. [Google Scholar] [CrossRef]
- Villela, B.A.M.; Duarte, O.C.M.B. Maximum Throughput Analysis in Ad Hoc Networks. In Networking 2004, NETWORKING 2004; Mitrou, N., Kontovasilis, K., Rouskas, G.N., Iliadis, I., Merakos, L., Eds.; Lecture Notes in Computer Science; Springer: Berlin/Heidelberg, Germany, 2004; Volume 3042. [Google Scholar] [CrossRef]
- Naeem, M.A.; Chaudhary, S.; Meng, Y. Road to Efficiency: V2V Enabled Intelligent Transportation System. Electronics 2024, 13, 2673. [Google Scholar] [CrossRef]
- Sadaf, M.; Iqbal, Z.; Javed, A.R.; Saba, I.; Krichen, M.; Majeed, S.; Raza, A. Connected and Automated Vehicles: Infrastructure, Applications, Security, Critical Challenges, and Future Aspects. Technologies 2023, 11, 117. [Google Scholar] [CrossRef]
- Muslam, M.M.A. Enhancing Security in Vehicle-to-Vehicle Communication: A Comprehensive Review of Protocols and Techniques. Vehicles 2024, 6, 450–467. [Google Scholar] [CrossRef]
- Dutta, A.; Campoverde, L.M.S.; Tropea, M.; De Rango, F. A Comprehensive Review of Recent Developments in VANET for Traffic, Safety & Remote Monitoring Applications. J. Netw. Syst. Manag. 2024, 32, 73. [Google Scholar] [CrossRef]
- Gadalla, A.Y.; Mohammed, Y.S.; Galal, A.I.; El-Zorkany, M. Design and implementation of a safety algorithm on V2V routing protocol. Int. J. Smart Sens. Intell. Syst. 2022, 15, 1–18. [Google Scholar] [CrossRef]
- Hamid, B.; El Mokhtar, E.-N. Performance analysis of the Vehicular Ad hoc Networks (VANET) routing protocols AODV, DSDV and OLSR. In Proceedings of the 2015 5th International Conference on Information & Communication Technology and Accessibility (ICTA), Marrakech, Morocco, 21–23 December 2015; pp. 1–6. [Google Scholar]
- Muthana, S.A.; Ku-Mahamud, K.R. Taguchi-Grey Relational Analysis Method for Parameter Tuning of Multi-objective Pareto Ant Colony System Algorithm. J. Inf. Commun. Technol. 2023, 22, 149–181. [Google Scholar] [CrossRef]
- Prathviraj, N.; Santosh, L. Deshpande and Sayinath Udupa, Ad-hoc Network Experimental Design with Taguchi Method to Analyze Performance of Routing Protocols. Eng. Sci. 2022, 19, 83–88. [Google Scholar]
- Zhang, H.-F.; Ge, H.-W.; Li, T.; Su, S.; Tong, Y. Three-stage multi-modal multi-objective differential evolution algorithm for vehicle routing problem with time windows. Intell. Data Anal. 2024, 28, 485–506. [Google Scholar] [CrossRef]
- Debnath, A.; Basumatary, H.; Tarafdar, A.; DebBarma, M.K.; Bhattacharyya, B.K. Center of mass and junction based data routing method to increase the QoS in VANET. AEU-Int. J. Electron. Commun. 2019, 108, 36–44. [Google Scholar] [CrossRef]
- Safrianti, E.; Sari, L.O.; Romadan, A.; Feranita, F. Comparative Analysis of OLSR and DSR Routing Protocol Performance on Vehicular Ad Hoc Network (VANET). Simetris J. Tek. Mesin Elektro Dan Ilmu Komput. 2023, 14, 375–386. [Google Scholar] [CrossRef]
- El-Dalahmeh, M.; El-Dalahmeh, A.; Adeel, U. Analysing the performance of AODV, OLSR, and DSDV routing protocols in VANET based on the ECIE method. IET Networks 2024, 13, 377–394. [Google Scholar] [CrossRef]
- Gupta, S. Performance Evaluation of Routing Protocols in Vehicular Ad-Hoc Networks (VANETs): A Comparative Study. Turk. J. Comput. Math. Educ. (TURCOMAT) 2020, 11, 847–856. [Google Scholar] [CrossRef]
- Mahdi, H.F.; Abood, M.S.; Hamdi, M.M. Performance evaluation for vehicular ad-hoc networks based routing protocols. Bull. Electr. Eng. Inform. 2021, 10, 1080–1091. [Google Scholar] [CrossRef]
- Setiabudi, A.; Pratiwi, A.A.; Ardiansyah; Perdana, D.; Sari, R.F. Performance comparison of GPSR and ZRP routing protocols in VANET environment. In Proceedings of the 2016 IEEE Region 10 Symposium (TENSYMP), Bali, Indonesia, 9–11 May 2016; pp. 42–47. [Google Scholar]
- Ali, A.M.; Ngadi, A.; Al_Barazanchi, I.I.; JosephNg, P.S. Intelligent Traffic Model for Unmanned Ground Vehicles Based on DSDV-AODV Protocol. Sensors 2023, 23, 6426. [Google Scholar] [CrossRef] [PubMed]
- Di Maio, A.; Palattella, M.; Engel, T. Performance Analysis of MANET Routing Protocols in Urban VANETs. In Proceedings of the 18th International Conference on Ad-Hoc Networks and Wireless, ADHOC-NOW 2019, Luxembourg, Luxembourg, 1–3 October 2019. [Google Scholar] [CrossRef]
- Ahed, K.; Benamar, M.; Lahcen, A.A.; El Ouazzani, R. Forwarding strategies in vehicular named data networks: A survey. J. King Saud Univ.-Comput. Inf. Sci. 2022, 34, 1819–1835. [Google Scholar] [CrossRef]
- Ji, X.; Yu, H.; Fan, G.; Sun, H.; Chen, L. Efficient and Reliable Cluster-Based Data Transmission for Vehicular Ad Hoc Networks. Mob. Inf. Syst. 2018, 2018, 9826782. [Google Scholar] [CrossRef]
- Kour, S.; Singh, M.; Sarangal, H.; Attri, V.K.; Singh, B. Analysis of Routing Protocols in VANETs with Different Pause Times. In Inventive Communication and Computational Technologies; Ranganathan, G., Papakostas, G.A., Shi, Y., Eds.; ICICCT 2024; Lecture Notes in Networks and Systems; Springer: Singapore, 2024; Volume 23. [Google Scholar] [CrossRef]
- Liao, L.; Li, Z.; Lai, S.; Jiang, W.; Zou, F.; Yu, X.; Xu, Z. An expressway traffic congestion measurement under the influence of service areas. PLoS ONE 2023, 18, e0279966. [Google Scholar] [CrossRef] [PubMed]
- Akbar, R.Z.; Sussi, I. Performance Analysis FSR and DSR Routing Protocol in VANET with V2V and V2I Models. In Proceedings of the 2020 3rd International Seminar on Research of Information Technology and Intelligent Systems (ISRITI), Yogyakarta, Indonesia, 10 December 2020; pp. 158–163. [Google Scholar]
- Houmer, M.; Hasnaoui, M.L. An Enhancement of Greedy Perimeter Stateless Routing Protocol in VANET. Procedia Comput. Sci. 2019, 160, 101–108. [Google Scholar] [CrossRef]
- Halim, A.H.A.; Elshaikh, M.; Warip, M.N.M.; Ahmad, R.B. Validation of performance analysis for optimized vehicular ad hoc network using taguchi method. J. Teknol. 2015, 77, 6997. [Google Scholar] [CrossRef][Green Version]
- He, Y.; Huang, F.; Wang, D.; Zhang, R.; Gu, X.; Pan, J. NOMA-Enhanced Cooperative Relaying Systems in Drone-Enabled IoV: Capacity Analysis and Height Optimization. IEEE Trans. Veh. Technol. 2024, 73, 19065–19079. [Google Scholar] [CrossRef]
- Zaid, A.A.; Belmekki, B.E.Y.; Alouini, M.-S. Aerial-Aided mmWave VANETs Using NOMA: Performance Analysis, Comparison, and Insights. IEEE Trans. Veh. Technol. 2024, 73, 4742–4758. [Google Scholar] [CrossRef]


Disclaimer/Publisher’s Note: The statements, opinions and data contained in all publications are solely those of the individual author(s) and contributor(s) and not of MDPI and/or the editor(s). MDPI and/or the editor(s) disclaim responsibility for any injury to people or property resulting from any ideas, methods, instructions or products referred to in the content. |
© 2025 by the authors. Licensee MDPI, Basel, Switzerland. This article is an open access article distributed under the terms and conditions of the Creative Commons Attribution (CC BY) license (https://creativecommons.org/licenses/by/4.0/).