Abstract
As smartphones become widespread, a variety of smartphone applications are being developed. This paper proposes a method for indoor localization (i.e., positioning) that uses only smartphones, which are general-purpose mobile terminals, as reference point devices. This method has the following features: (a) the localization system is built with smartphones whose movements are confined to respective limited areas. No fixed reference point devices are used; (b) the method does not depend on the wireless performance of smartphones and does not require information about the propagation characteristics of the radio waves sent from reference point devices, and (c) the method determines the location at the application layer, at which location information can be easily incorporated into high-level services. We have evaluated the level of localization accuracy of the proposed method by building a software emulator that modeled an underground shopping mall. We have confirmed that the determined location is within a small area in which the user can find target objects visually.
1. Introduction
As smartphones become widespread, a variety of smartphone applications are being developed. The location of a person who is outside buildings can be identified by receiving signals from the Global Positioning System (GPS), and many location-dependent services are provided using the GPS. However, services that work indoors, where GPS signals cannot be received, and services that do not rely on the GPS in the first place are also provided [1,2,3,4]. These services use wireless technologies, such as Wi-Fi and Bluetooth, which are usually available in smartphones. They use reference point devices that are installed at fixed locations within a building. A smartphone within the building determines its location based on the coordinates of the reference points received from reference point devices and the received signal strength indicator (RSSI) of the signal received. In cases where Wi-Fi is used, reference point devices are wireless access points (AP) installed within a building. In cases where Bluetooth is used, dedicated reference point devices are installed. Since RSSI of the signal received from each reference point device depends on the particular indoor environment and on the wireless technology used, it is necessary to know RSSI for each indoor area and for each type of terminal in advance.
This paper proposes an indoor localization (i.e., positioning) method where the GPS is not available. We have built a software emulator and evaluated the level of localization accuracy of the proposed method. The paper presents the results of this evaluation. The proposed method has the following features: (a) a localization system can be built with smartphones whose movements are respectively confined to limited areas. No fixed reference point devices are used; (b) the method does not depend on the wireless performance of smartphones and does not require information about the propagation characteristics of the radio waves sent from reference point devices, and (c) the method determines the location at the application layer, at which location information can be easily incorporated into high-level services. In addition, building on the service concepts and basic algorithms published in literature [5], we emphasize the originality of the proposed technology, clarify the relevant technical fields, and refine the localization algorithm in this paper. Furthermore, we add the evaluation of how the number of collaborating client nodes affects the level of localization accuracy. Section 2 outlines studies related to indoor localization that uses wireless technologies and also gives reasons for selecting the proposed method. Section 3 describes the proposed localization method, and use cases in an area where there are many shops and no reliable GPS signals are available, such as an underground or indoor shopping mall. The effective level of localization accuracy is also given. Section 4 describes the developed software emulator, which models an underground shopping mall. Section 5 evaluates the level of localization accuracy using the emulator. Section 6 gives conclusions.
2. Related Studies and Reasons for Selecting the Proposed Method
There are many studies on indoor localization that uses wireless sensor networks [6,7,8,9,10,11,12,13]. Localization methods can be broadly classified into the range-base, the range-free and the fingerprint methods. The range-base method determines the location of a node by calculating inter-node distances and determining the directions in which radio waves arrive from measurements of the radio waves [6]. A variety of parameters have been proposed for estimating distances from reference points, such as Time of Arrival (ToA), Time Difference of Arrival (TDoA), Angle of Arrival (AoA), and Received Signal Strength Indicator (RSSI). The range-free method determines the location of a node without directly measuring inter-node distances or directions of radio waves. Instead, it relies on the number of hops from certain nodes whose locations are known in advance (called landmarks or anchor nodes), or on geographical relations to these nodes [7,8,9]. Several range-free methods have been proposed. They vary in the way they calculate the relative geographical relations to reference points. Some use the centroid method [7]. Others use the Distance Vector in Hop (DV-HOP) method [8], or the Approximate Point-In-Triangulation Test (APIT) method [9]. The fingerprint method measures the radio propagation characteristics of signals received from anchor nodes, and stores this information as feature values in advance. It determines the location of a node by comparing the patterns of the feature values of the signal being received with those in the database. Feature values proposed for this purpose are RSSI, ToA, TDoA, or AoA [6].
The range-base method requires a dedicated transmitter and a dedicated receiver, which are normally expensive, in each smartphone and in each reference point device. Therefore, the smartphone costs and the costs of installing and operating reference point devices are high. This method is mainly used for control of robots, control of product locations in manufacturing and in other cases where highly accurate location information is required. The range-free method requires installation of reference point devices, but the costs of installing and operating these are lower than those in the range-based method, but the level of localization accuracy is also lower. To raise the level of localization accuracy for the finger-print method, it is necessary to increase the amount of feature data. This, in turn, increases the amount of computation that is to be made by the pattern-matching algorithm.
We aim to develop a localization method that uses only smartphones, which are smart, general-purpose mobile terminals. The purpose of this method is to assist smartphone users in choosing their next movements. The level of localization accuracy required for this purpose is not as high as that for robot control. Errors in the range of several meters are acceptable. The method needs neither dedicated reference point devices nor a dedicated database server, which are required by the fingerprint method. The operational costs of this method should be low. We have adopted the range-free method because it can be implemented at lower costs than the other methods.
Unlike the normal range-free method, our method uses smartphones as reference point devices. This will be described in detail in Section 3. To minimize the power consumption of smartphones, we use the centroid method for location calculation [7]. This method can be used even in single-hop communication and does not require as much communication overhead as the DV-HOP method or the APIT method.
The localization function that uses smartphone’s Wi-Fi or Bluetooth capability is normally implemented at the Media Access Control (MAC) layer. While this allows highly independent implementation, it cannot work closely with application-layer programs. Furthermore, its radio propagation characteristics are dependent on the performance of the devices that provide the Wi-Fi or Bluetooth capability. Therefore, we have decided to implement the localization function at the application layer, where location information can be easily incorporated into a variety of services and where localization is not dependent on the wireless system used or devices that provide the Wi-Fi or Bluetooth capability.
3. Constructing Reference Point Smartphones and Indoor Localization Using the Centroid Method
An advantage of the centroid method is that its logic is clear. To use the centroid method for location calculation, it is necessary to introduce a number of reference points within a building. It is costly to develop, install and maintain dedicated reference point devices. This section describes how the proposed method uses smartphones as reference point devices, and how it applies the centroid method to calculate distances from reference points.
3.1. Using Smartphones as Reference Points
This subsection describes how the reference point function of sending location information messages can be implemented in smartphones. As shown in Figure 1, we implement the reference point function at the application layer in order to avoid the function becoming dependent on the performance of the smartphone’s components that implement the functions of the data link layer and the physical layer, the two lowest layers in the OSI reference model. We define two types of terminals: server terminals and client terminals. The reference point function is implemented in server terminals. The localization function and the location information transmission function are implemented in client terminals. These functions are implemented at the application layer so that location information can be easily incorporated into services, which will be developed and implemented in server terminals. We use only single-hop communication at the network layer. Multi-hop communication is not supported.
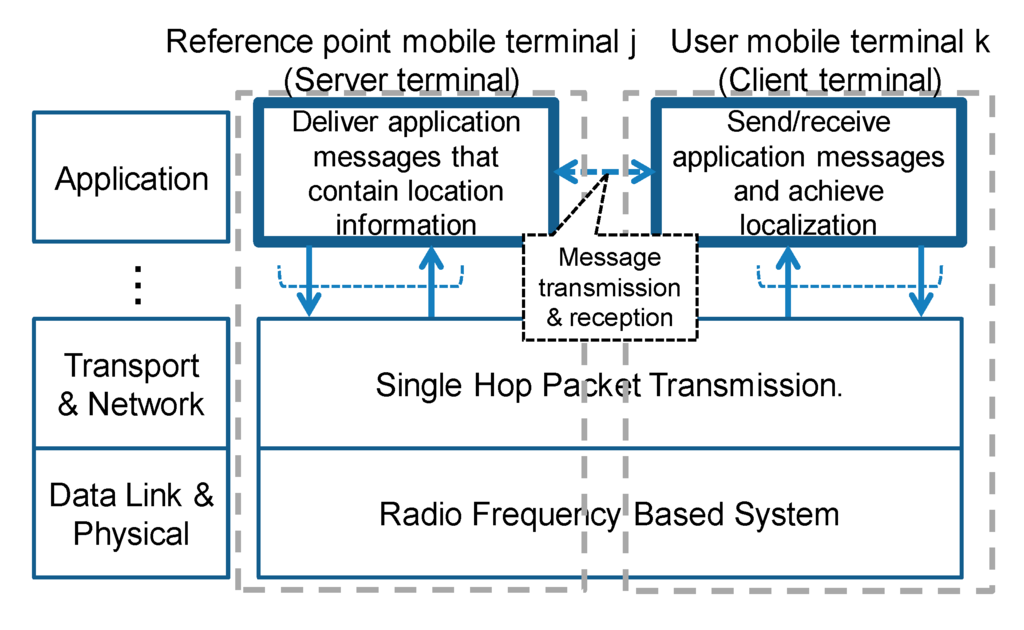
Figure 1.
Protocol stack of the proposed method.
Figure 1.
Protocol stack of the proposed method.
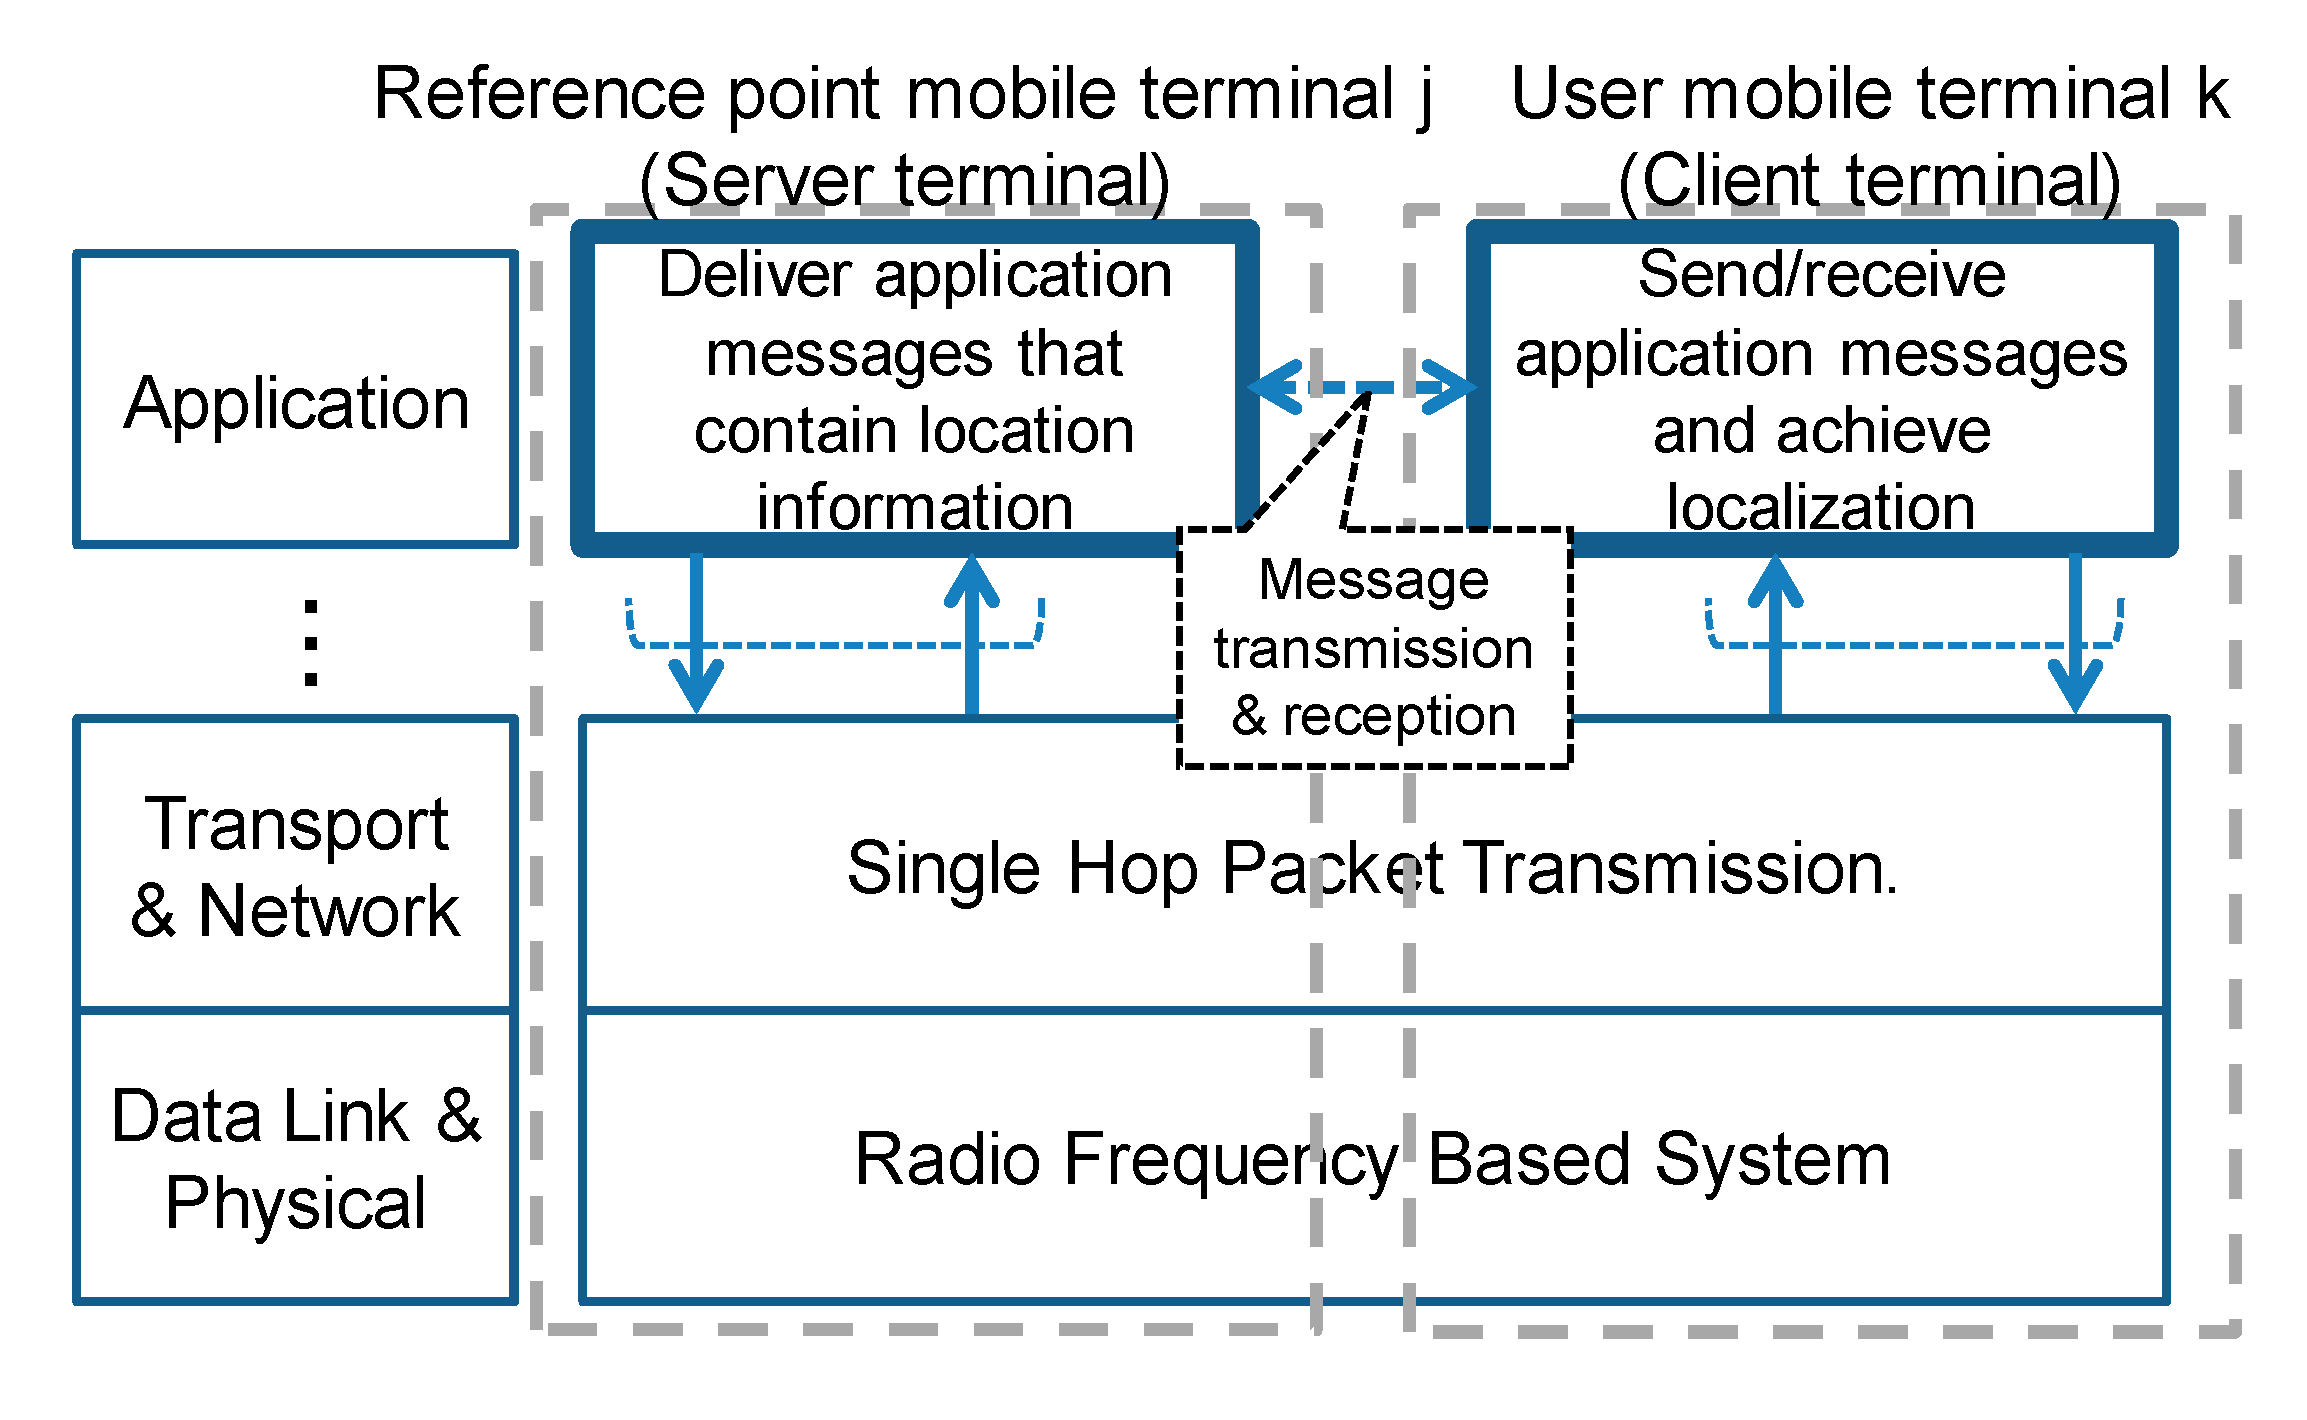
In conventional localization methods, reference point devices are fixed to the building or placed on shelves permanently. In contrast, in our proposed method, smartphones are used as reference point devices. Therefore, reference points move around. To ensure that a smartphone serves as the reference points of a rectangle, we have restricted the movements of the smartphones to within a certain rectangle. The actual reference point coordinates are the center of the rectangle. The displacement of the smartphone from the center is ignored. Figure 2 shows the center of a rectangle and the restriction on the movement of the reference point smartphone.
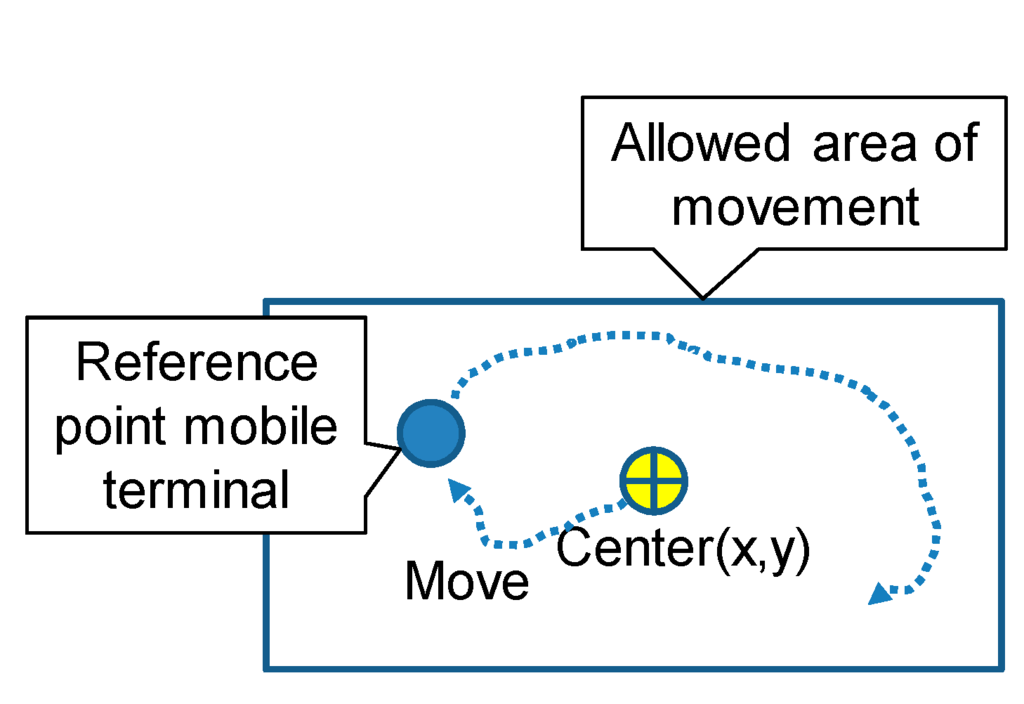
Figure 2.
Example of the coordinates of a reference point smartphone and the allowed area of movement.
Figure 2.
Example of the coordinates of a reference point smartphone and the allowed area of movement.

Reference point smartphone = {allowed area of movement: within a rectangle, reference point coordinates: center of the rectangle}
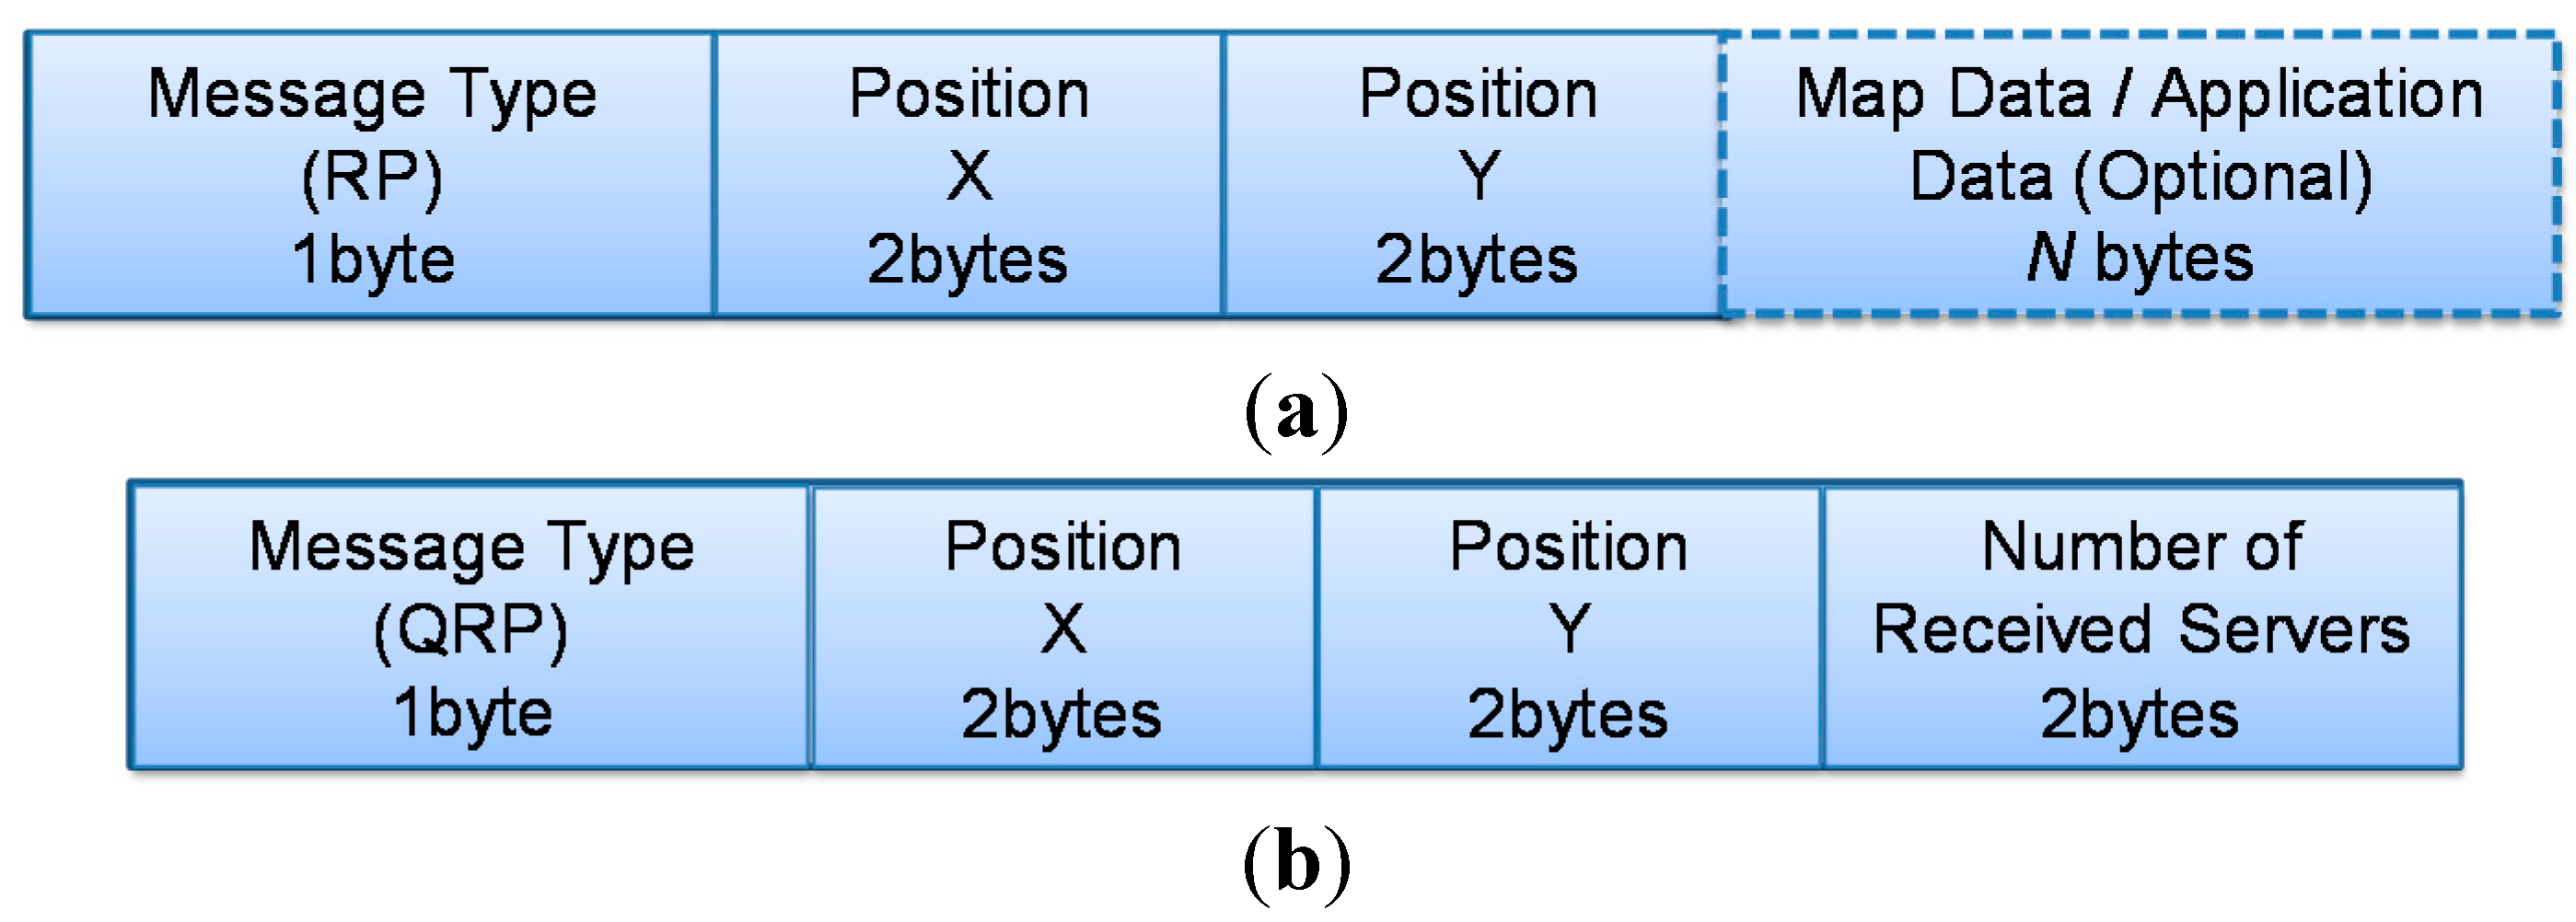
Each server terminal sets the coordinates of the center of its rectangular area in its location information message (hereafter referred to as an “RP (reference point) message”). The map data of the indoor area and service-dependent application data are not necessarily required in every message. These are optional. The location information message transmitted by a client terminal (hereafter referred to as a “QRP (quasi-reference point) message”) contains its own coordinates and the number of server terminals it has referred to determine its location. Whether the transmitter of the location information message is a server terminal or a client terminal is indicated in the message type. The formats of these messages are shown in Figure 3.
Figure 3.
Message formats. (a) RP(reference point) message format. (b) QRP (quasi-reference point) message format.
Figure 3.
Message formats. (a) RP(reference point) message format. (b) QRP (quasi-reference point) message format.
A client terminal stores RP messages over a period of T [msec]. During this period, it calculates its location from the coordinates contained in these messages using the centroid method. When a client terminal has determined its coordinates, it sends to another client terminal a QRP message. Figure 4 shows a typical message sequence between server terminals and client terminals.
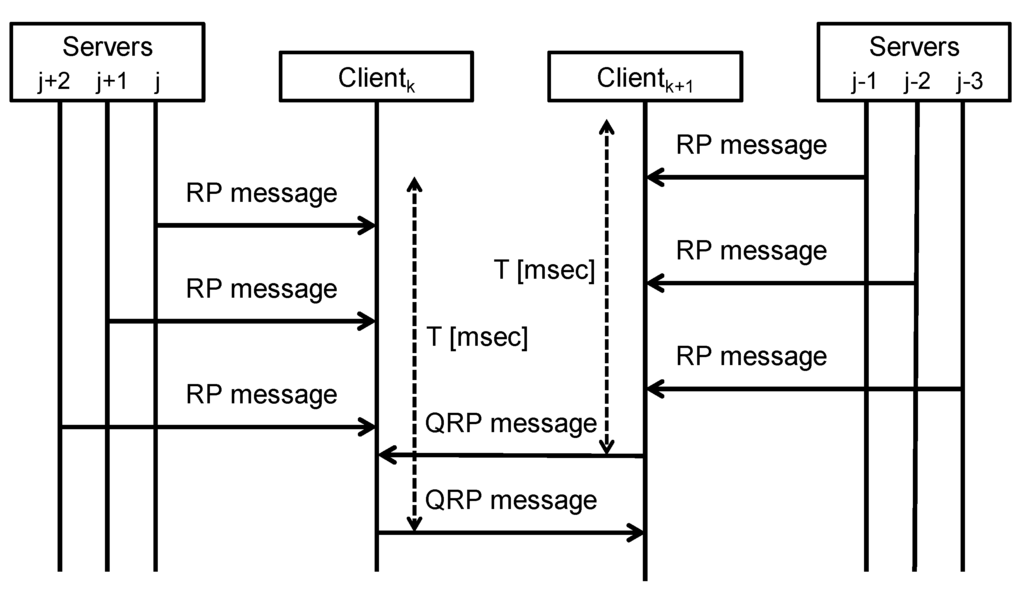
Figure 4.
Message sequence between client terminals and server terminals.
Figure 4.
Message sequence between client terminals and server terminals.

3.2. Localization Method
This subsection describes two cases in which a client terminal determines its location. The indoor area assumed is shown in Figure 5.

Figure 5.
Two cases of localization.
Figure 5.
Two cases of localization.
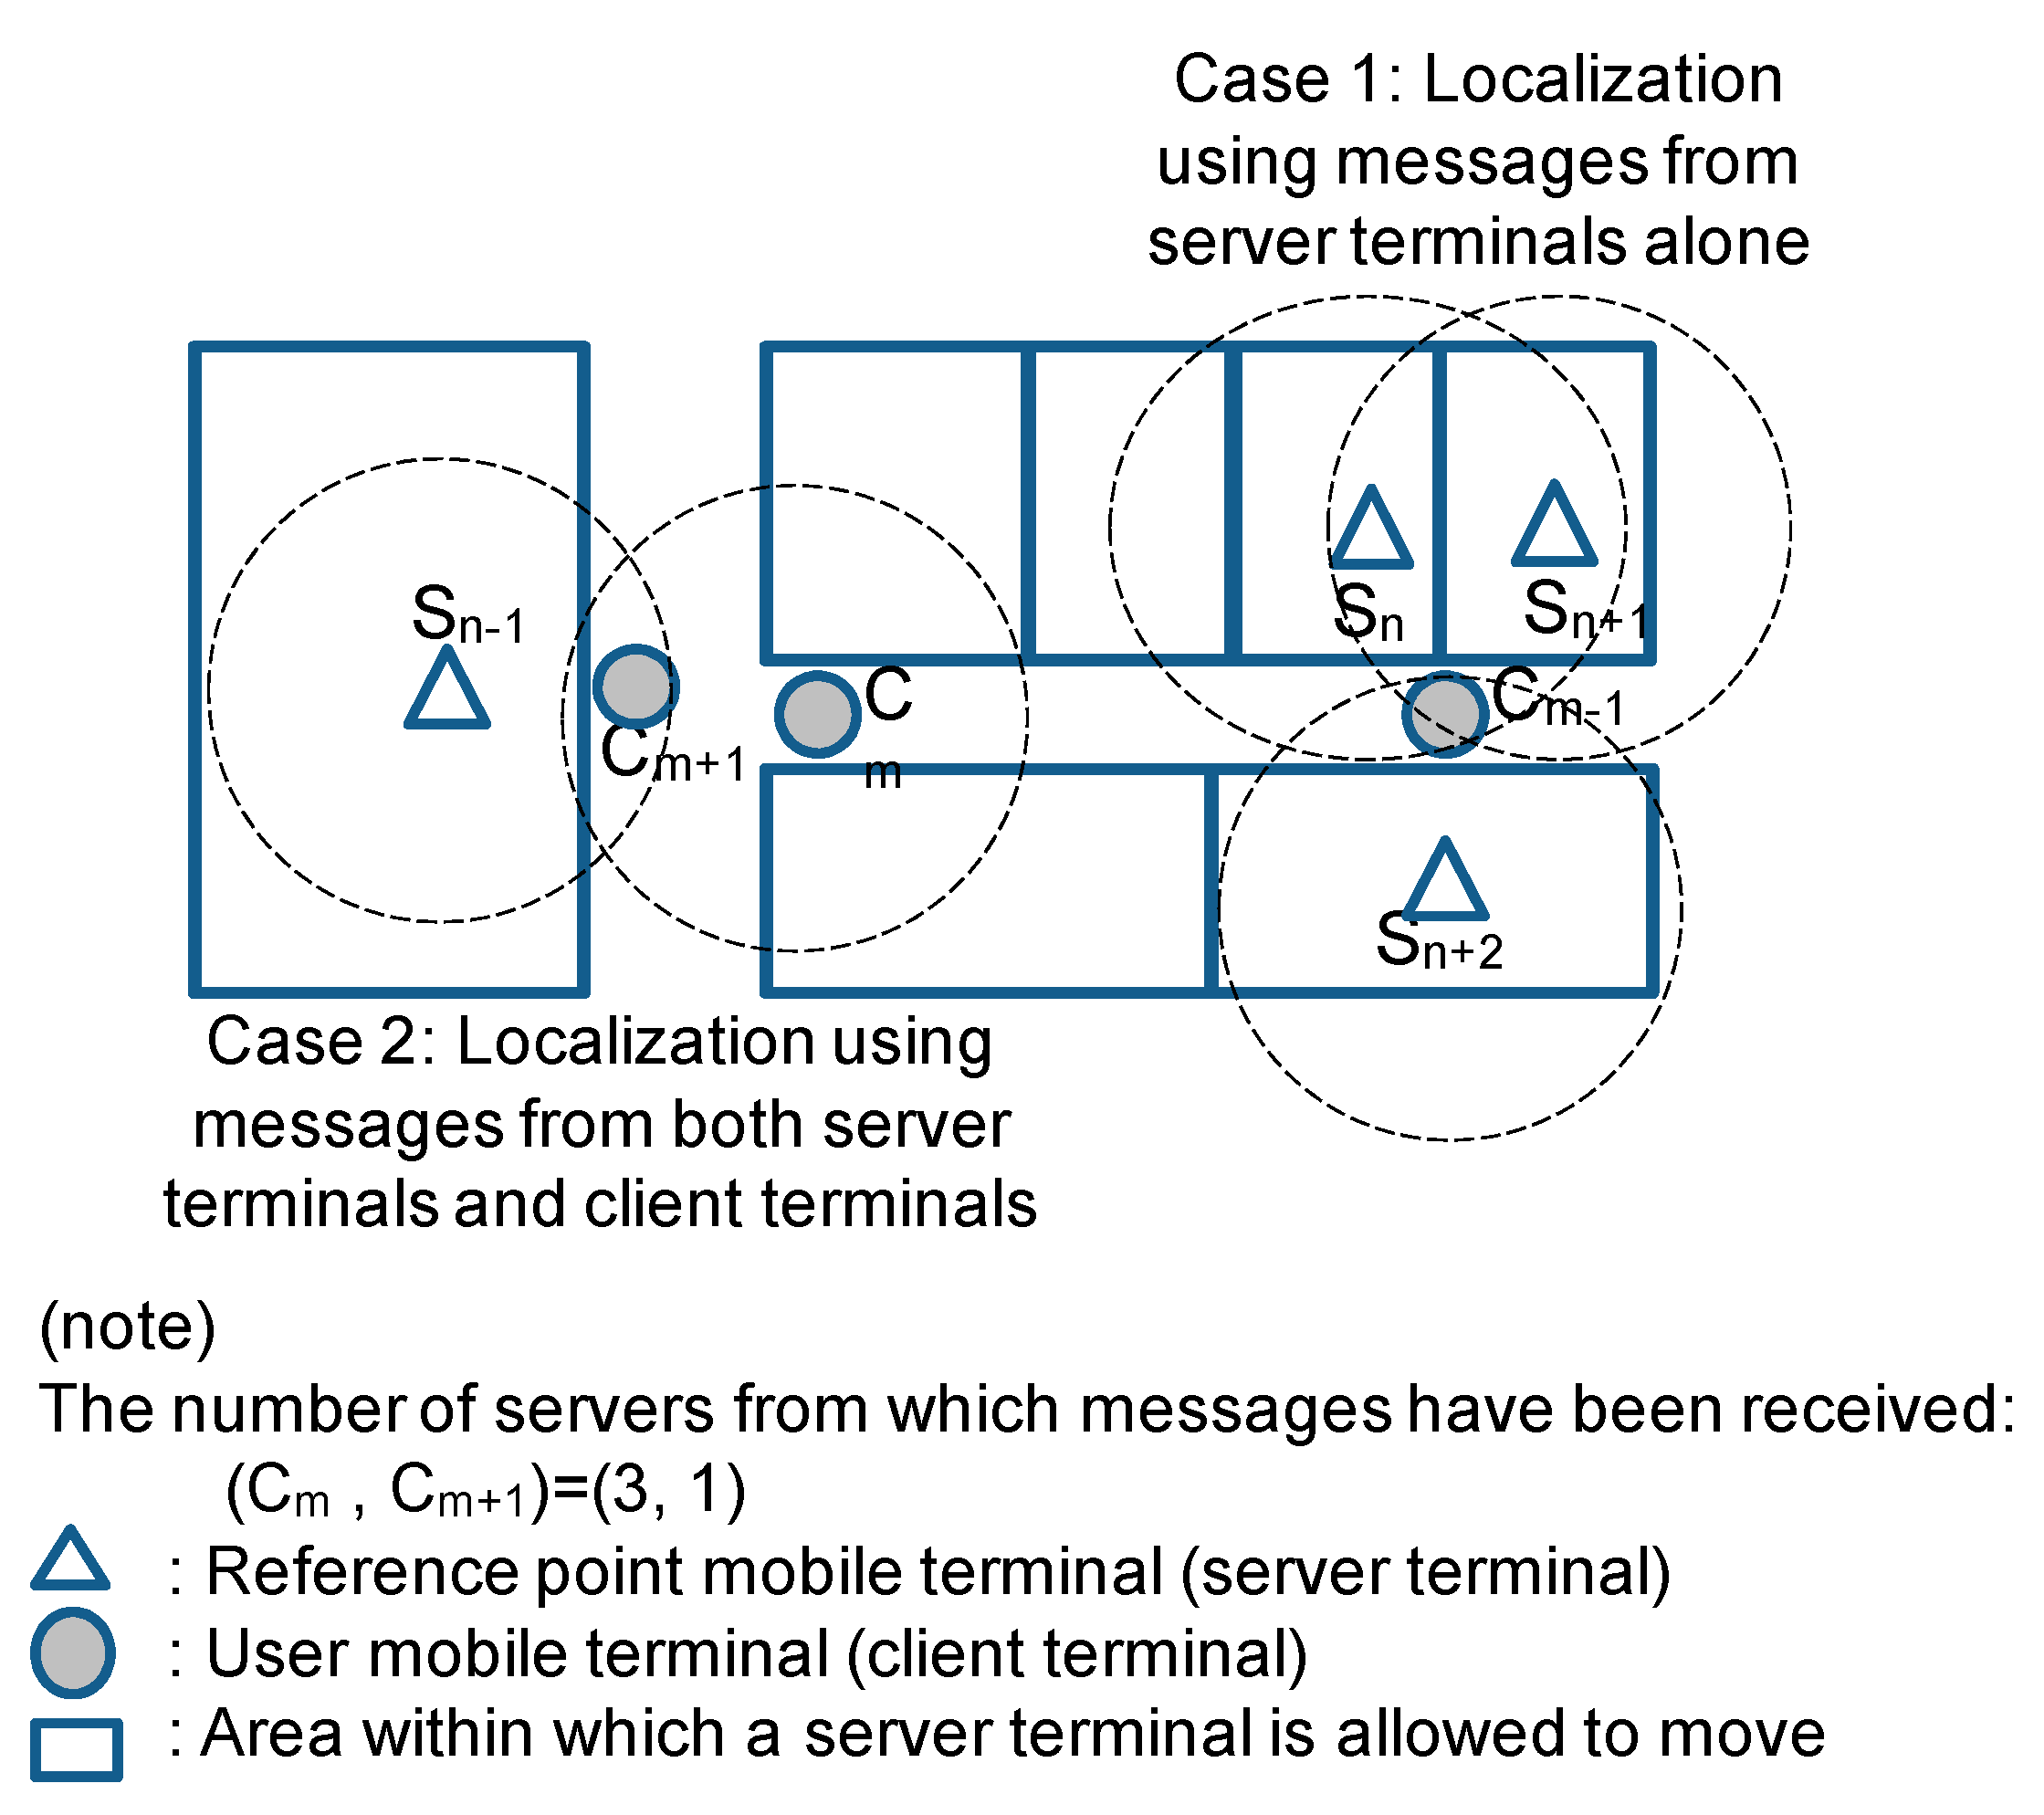
(1) Case 1: Localization using messages from server terminals alone
Client terminal Cm−1 enters a wireless area covered by server terminals Sn, Sn+1 and Sn+2, and receives RP messages from them. It determines its location by calculating the center of the coordinates contained in these RP messages. Let (xn,yn), (xn+1,yn+1) and (xn+2,yn+2) be the coordinates of server terminals Sn, Sn+1 and Sn+2. Client terminal Cm−1 determines that its coordinates are:
Cm−1(x,y) = {(xn + xn+1 + xn+2)/3, (yn + yn+1 + yn+2)/3}
(2) Case 2: Localization using messages from both server terminals and client terminals
In order to enhance the level of localization accuracy in an area where the number of server terminals is small, this algorithm additionally uses the coordinates received from other clients’ terminals whose locations have already been determined. The use of the location information of another client terminal in a situation shown in case 2 of Figure 5 is described below.
- (a)
- Client terminal Cm+1 receives RP messages from nearby server terminal Sn−1. It is receiving messages from only one server terminal.
- (b)
- Cm+1 receives QRP messages broadcast by Cm. This message contains location information and information about the number of server terminals from which Cm is receiving messages. Cm has determined its location from RP messages received from 3 server terminals.
- (c)
- Cm+1 compares the number of server terminals from which it is receiving messages with the number of server terminals from which Cm is receiving messages. If the number of server terminals from which Cm+1 is receiving messages ≤the number of server terminals from which Cm is receiving messages, Cm+1 corrects its location information based on the location information received from Cm. If the number of server terminals from which Cm+1 is receiving messages >the number of server terminals from which Cm is receiving messages, Cm+1 does not use the location information received from Cm.
In case 2 in Figure 5, the number of server terminals from which Cm+1 is receiving messages is one, while the number of server terminals from which Cm is receiving messages is three. Therefore, Cm+1 corrects its location information based on the location information received from Cm. If Cm+1 receives location information from a number of client terminals that are each receiving messages from more server terminals, than Cm+1 is, Cm+1 corrects its location information based on the weighted average of the locations of these client terminals using the number of server terminals from which a client terminal is receiving messages as a weight.
3.3. Localization Algorithm
The detailed localization algorithm that relies on exchanges of information with server terminals and client terminals and the algorithm used by a client terminal to transmit its coordinates to other client’ terminals are described below. In the following, the coordinates of a terminal are not necessarily the accurate coordinates of the terminal but the coordinates as determined from a variety of information available.
3.3.1. Localization Through Collaboration Between Server Terminals and Client Terminals
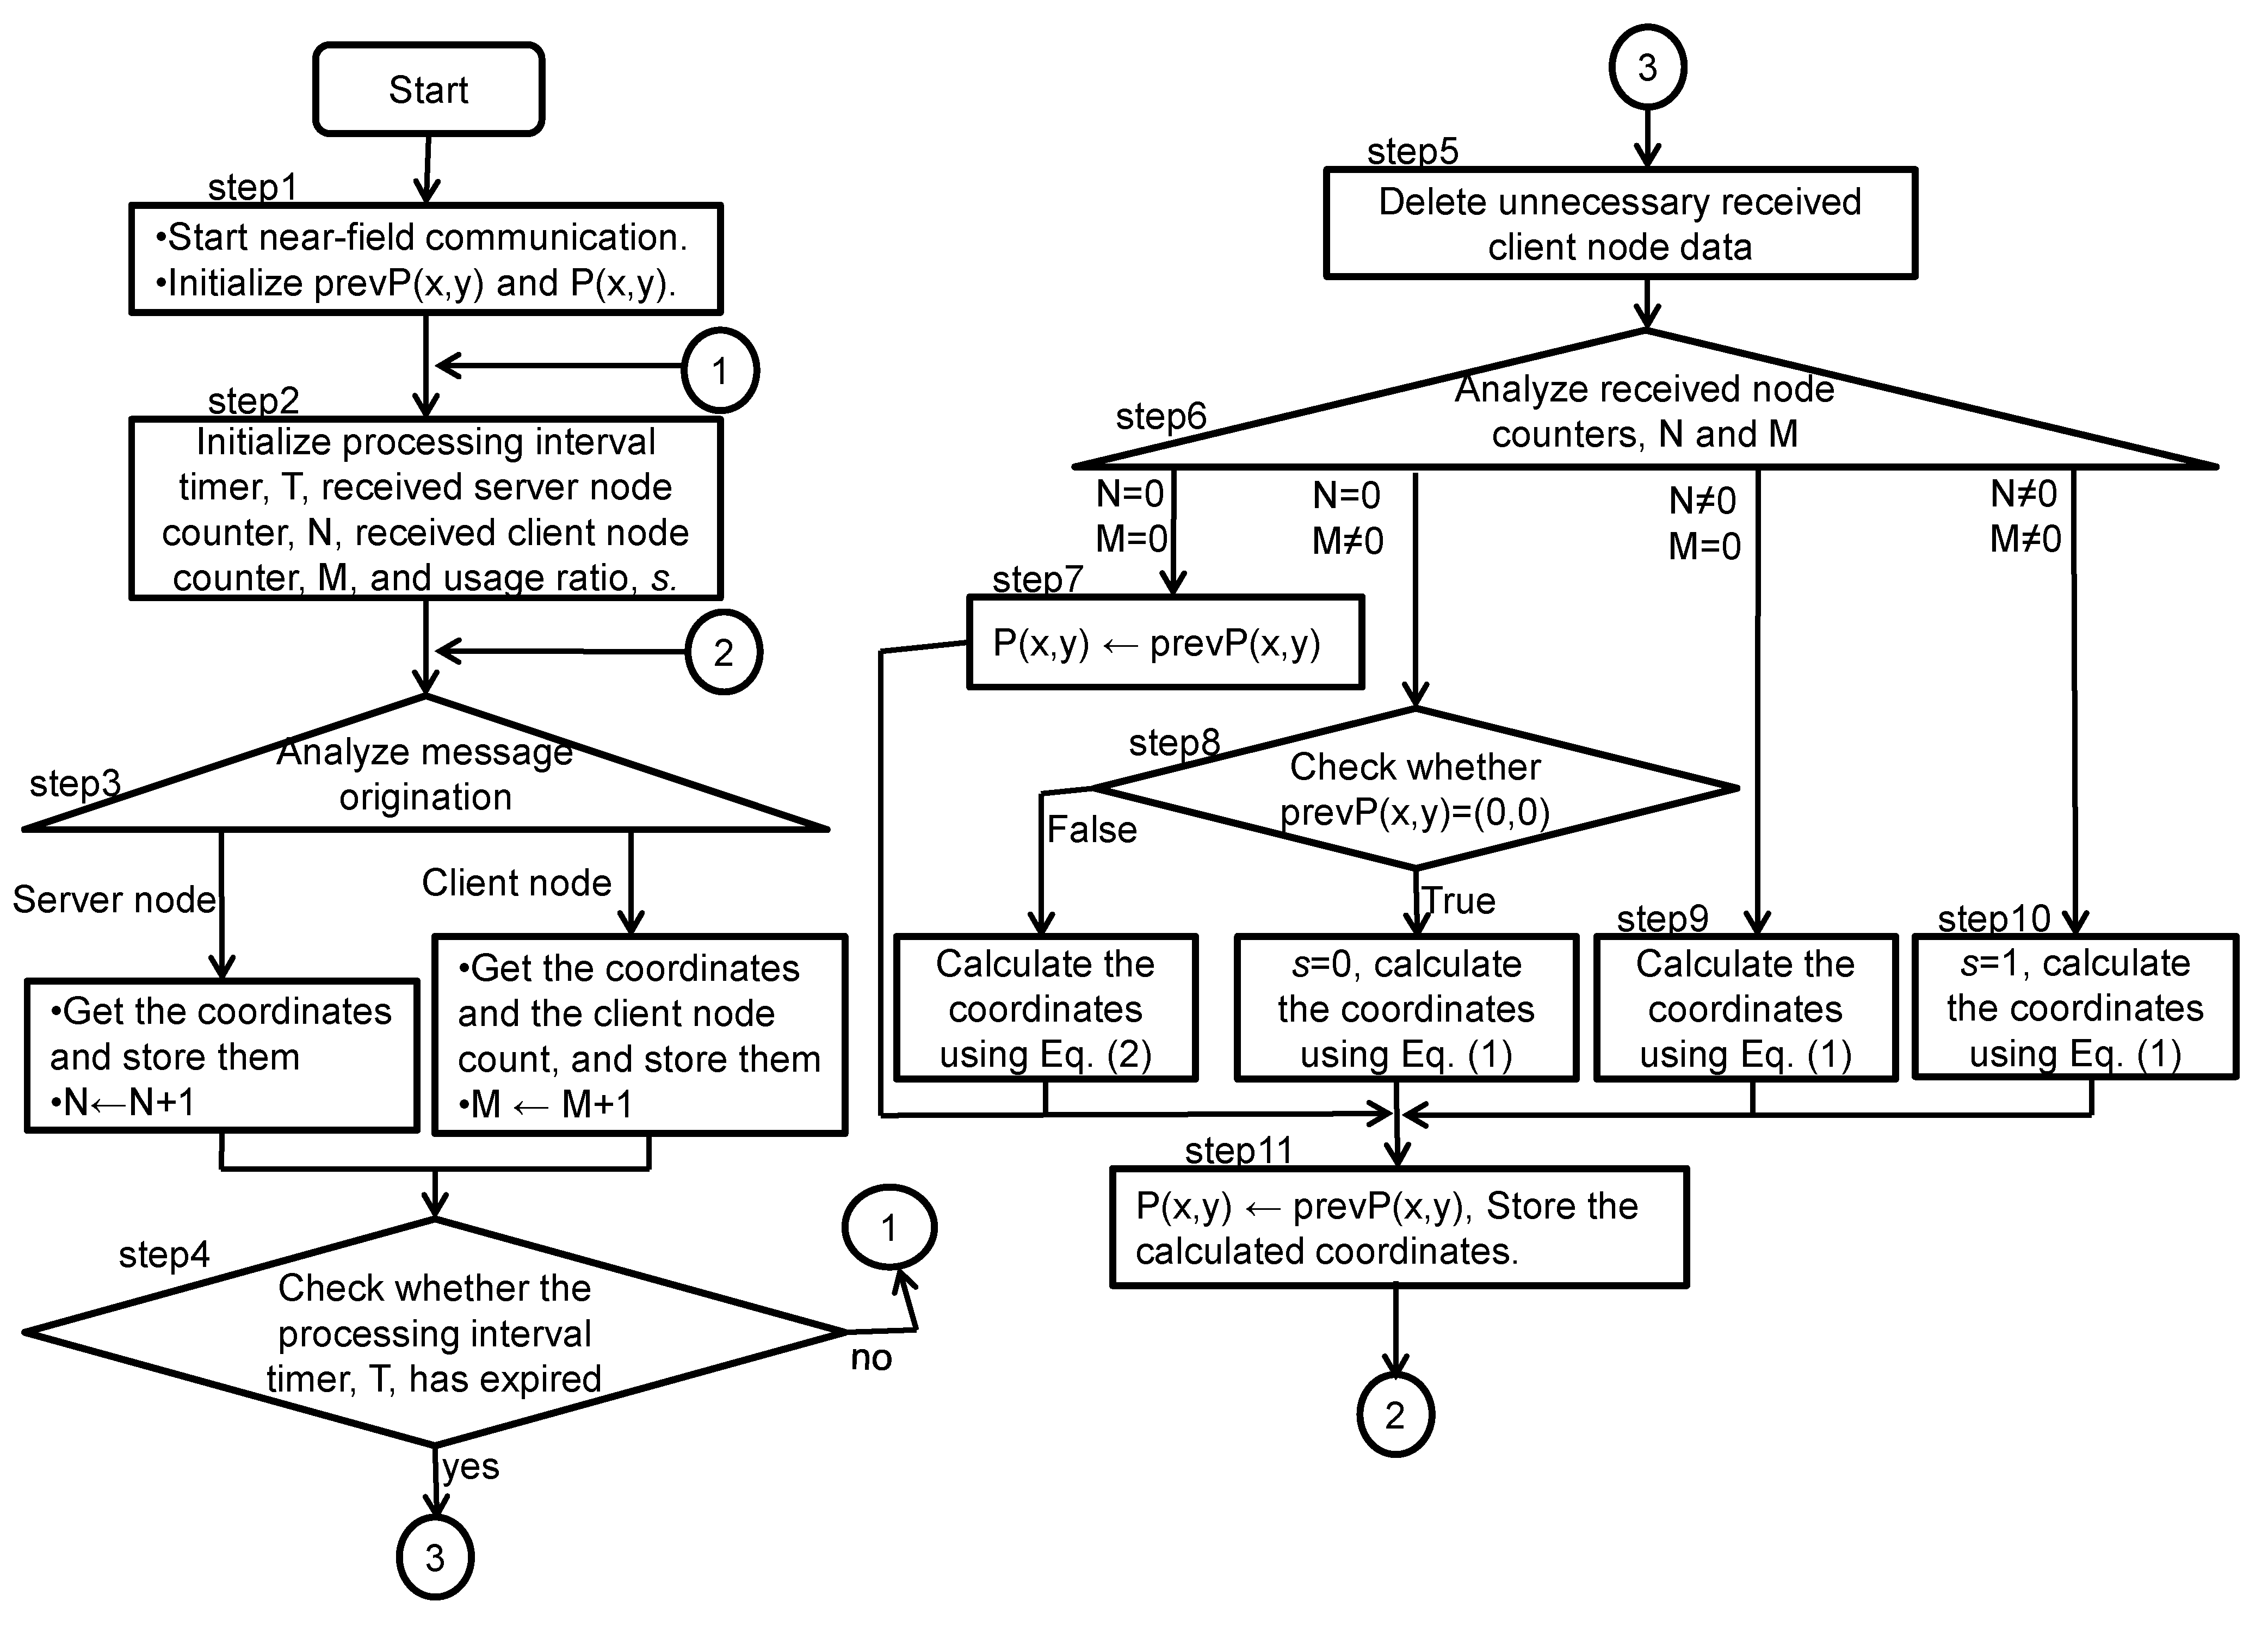
The localization is made in the following steps. The flowchart for the localization is shown in Figure 6.
- STEP 1:
- When the relevant application of a client terminal (hereafter referred to as “client node”) is activated, it begins to communicate with nearby server terminals (hereafter referred to as “server nodes”) and with passers-by client nodes using some near-field communication. Let the coordinates determined in the previous processing interval be prevP(x,y), and the coordinates determined in the current processing interval P(x,y). Coordinates are initialized so that P(x,y) will become the origin.
- STEP 2:
- Put “0” in the timer of the processing interval, T, and start counting. Initialize the count of the server nodes from which signals have been received, N, the count of the client node from whom signals have been received, M, and the ratio of N to M, s.
- STEP 3:
- The client node receives messages from server nodes, thus obtaining the coordinates of the center of each server node, and stores the x and y coordinates of these centers in an array, RecvServer[N]. N is then incremented by 1. The client node also receives messages from other client nodes, thus obtaining both the coordinates of each client node and the count of received client nodes. It stores these coordinates in an array of other clients’ coordinates, RecvClient[M], and an array of received client node count, RecvClientnum[M]. Then, M is incremented by 1.
- STEP 4:
- Check whether the processing interval, T, has expired or not. If it has, go to STEP 5. If it has not, go back to STEP 2.
- STEP 5:
- Remove, from RecvClientnum[M], the data of RecvClient[k], where k is an integer (k < M) and N > RecvClientnum[k].
- STEP 6:
- Examine the received counts, N and M.
- If N = 0 and M = 0: go to STEP 7.
- If N = 0 and M ≠ 0: go to STEP 8.
- If N ≠ 0 and M = 0: go to STEP 9.
- If N ≠ 0 and M ≠ 0: go to STEP 10.
- STEP 7:
- Substitute prevP(x,y) for P(x,y) and go to STEP 11.
- STEP 8:
- Check whether prevP(x,y) = (0,0).
- If true: put “0” in s, and calculate the coordinates using Equation (1), and go to STEP 11.
- If false: calculate the coordinates using Equation (2), and go to STEP 11.
- STEP 9:
- Put “1” in s, and calculate the coordinates using Equation (1) and go to STEP 11.
- STEP 10:
- Calculate the coordinates using Equation (1).
- STEP 11:
- Substitute P(x,y) for prevP(x,y), and store the coordinates determined in the previous interval. Repeat from STEP 2.

Figure 6.
Flowchart for the localization algorithm.
Figure 6.
Flowchart for the localization algorithm.
3.3.2. Transmission of the Coordinates of a Client Terminal to Other Client Terminals
A client node transmits its coordinates to other client terminals in the following steps:
- STEP 1:
- The client node in question begins near-field communication with other client nodes.
- STEP 2:
- Put “0” in the processing interval timer, and start counting.
- STEP 3:
- Check whether N as calculated using Equation (1) is equal to “0”.
- If N = 0, go to STEP 5.
- If N ≠ 0, go to STEP 4.
- STEP 4:
- Send its coordinates to other client nodes.
- STEP 5:
- Check whether timeout has occurred to T.
- If it has, repeat from STEP 1.
- If it has not, repeat STEP 5.
3.4. Example of a Service to Which the Proposed Method Can Be Applied
An example service to which the proposed method can be applied is a service of delivering advertisements to passers-by in an underground shopping mall. The smartphone held by a sales clerk in a shop serves as the reference point device of the shop as shown in Figure 2. If there are several sales clerks in the shop, the smartphone of just one of them serves as the reference point. This smartphone is allowed to move only within the shop. No matter where the smartphone is within the shop, the coordinates of the center of the shop are considered to be the coordinates of the smartphone. The smartphone can be placed on a shelf or some fixed location within the shop, but we assume that he/she always carries it around because he/she uses it for a variety of purposes, such as telephone calls, emails, and website browsing.
The passing-by advertisement delivery service selects and delivers advertisements that can contain a variety of information, such as the service menu, discounted products, time sales, and state of congestion. Shoppers receive that information with their smartphones. If the shop interests them, they look for the shop by referring to the mall map. When they come close to the target shop, they discover it visually. Figure 7 shows how the service is used. The service is used in the following steps:
- STEP 1:
- When the user gets lost, he/she selects the location information acquisition on the screen of his/her smartphone.
- STEP 2:
- The smartphone receives advertisements delivered by the surrounding shops, as shown in Figure 7.
- STEP 3:
- Based on the shop names and the shop locations included in the advertisements received, the smartphone determines its present location, and displays on the map on its screen.
- STEP 4:
- The smartphone also receives the coordinates from the smartphones of other users, and determines its present location.
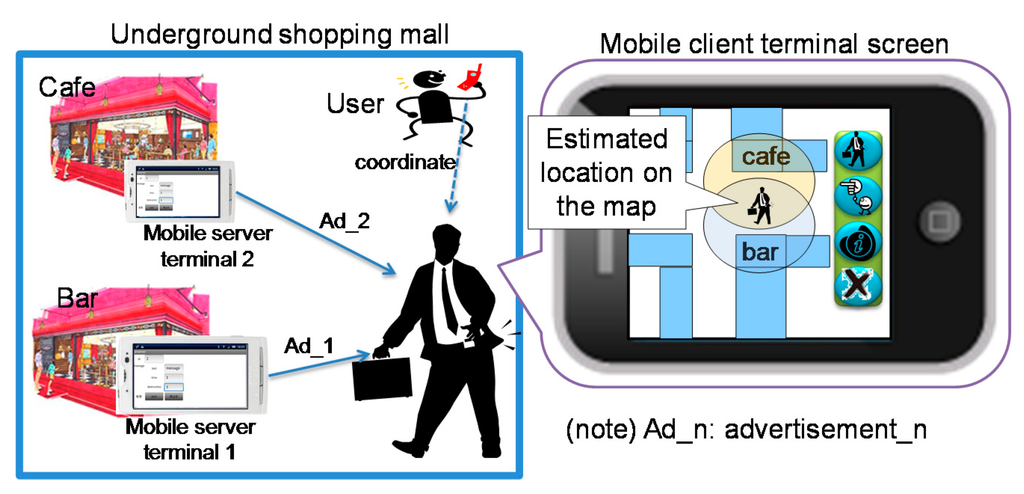
Figure 7.
How the advertisement delivery system is used.
Figure 7.
How the advertisement delivery system is used.

The practical level of localization accuracy in this type of application is a distance within which objects can be viewed at a glance. Therefore, the target range for the average error of the proposed method is three to four meters.
4. Underground Shopping Mail Simulator System
To evaluate the range of error of the proposed localization method in a realistic model, we have developed an evaluation system that uses a two-dimensional array model to simulate the floor plan of an existing underground shopping mall.
4.1. Evaluation System
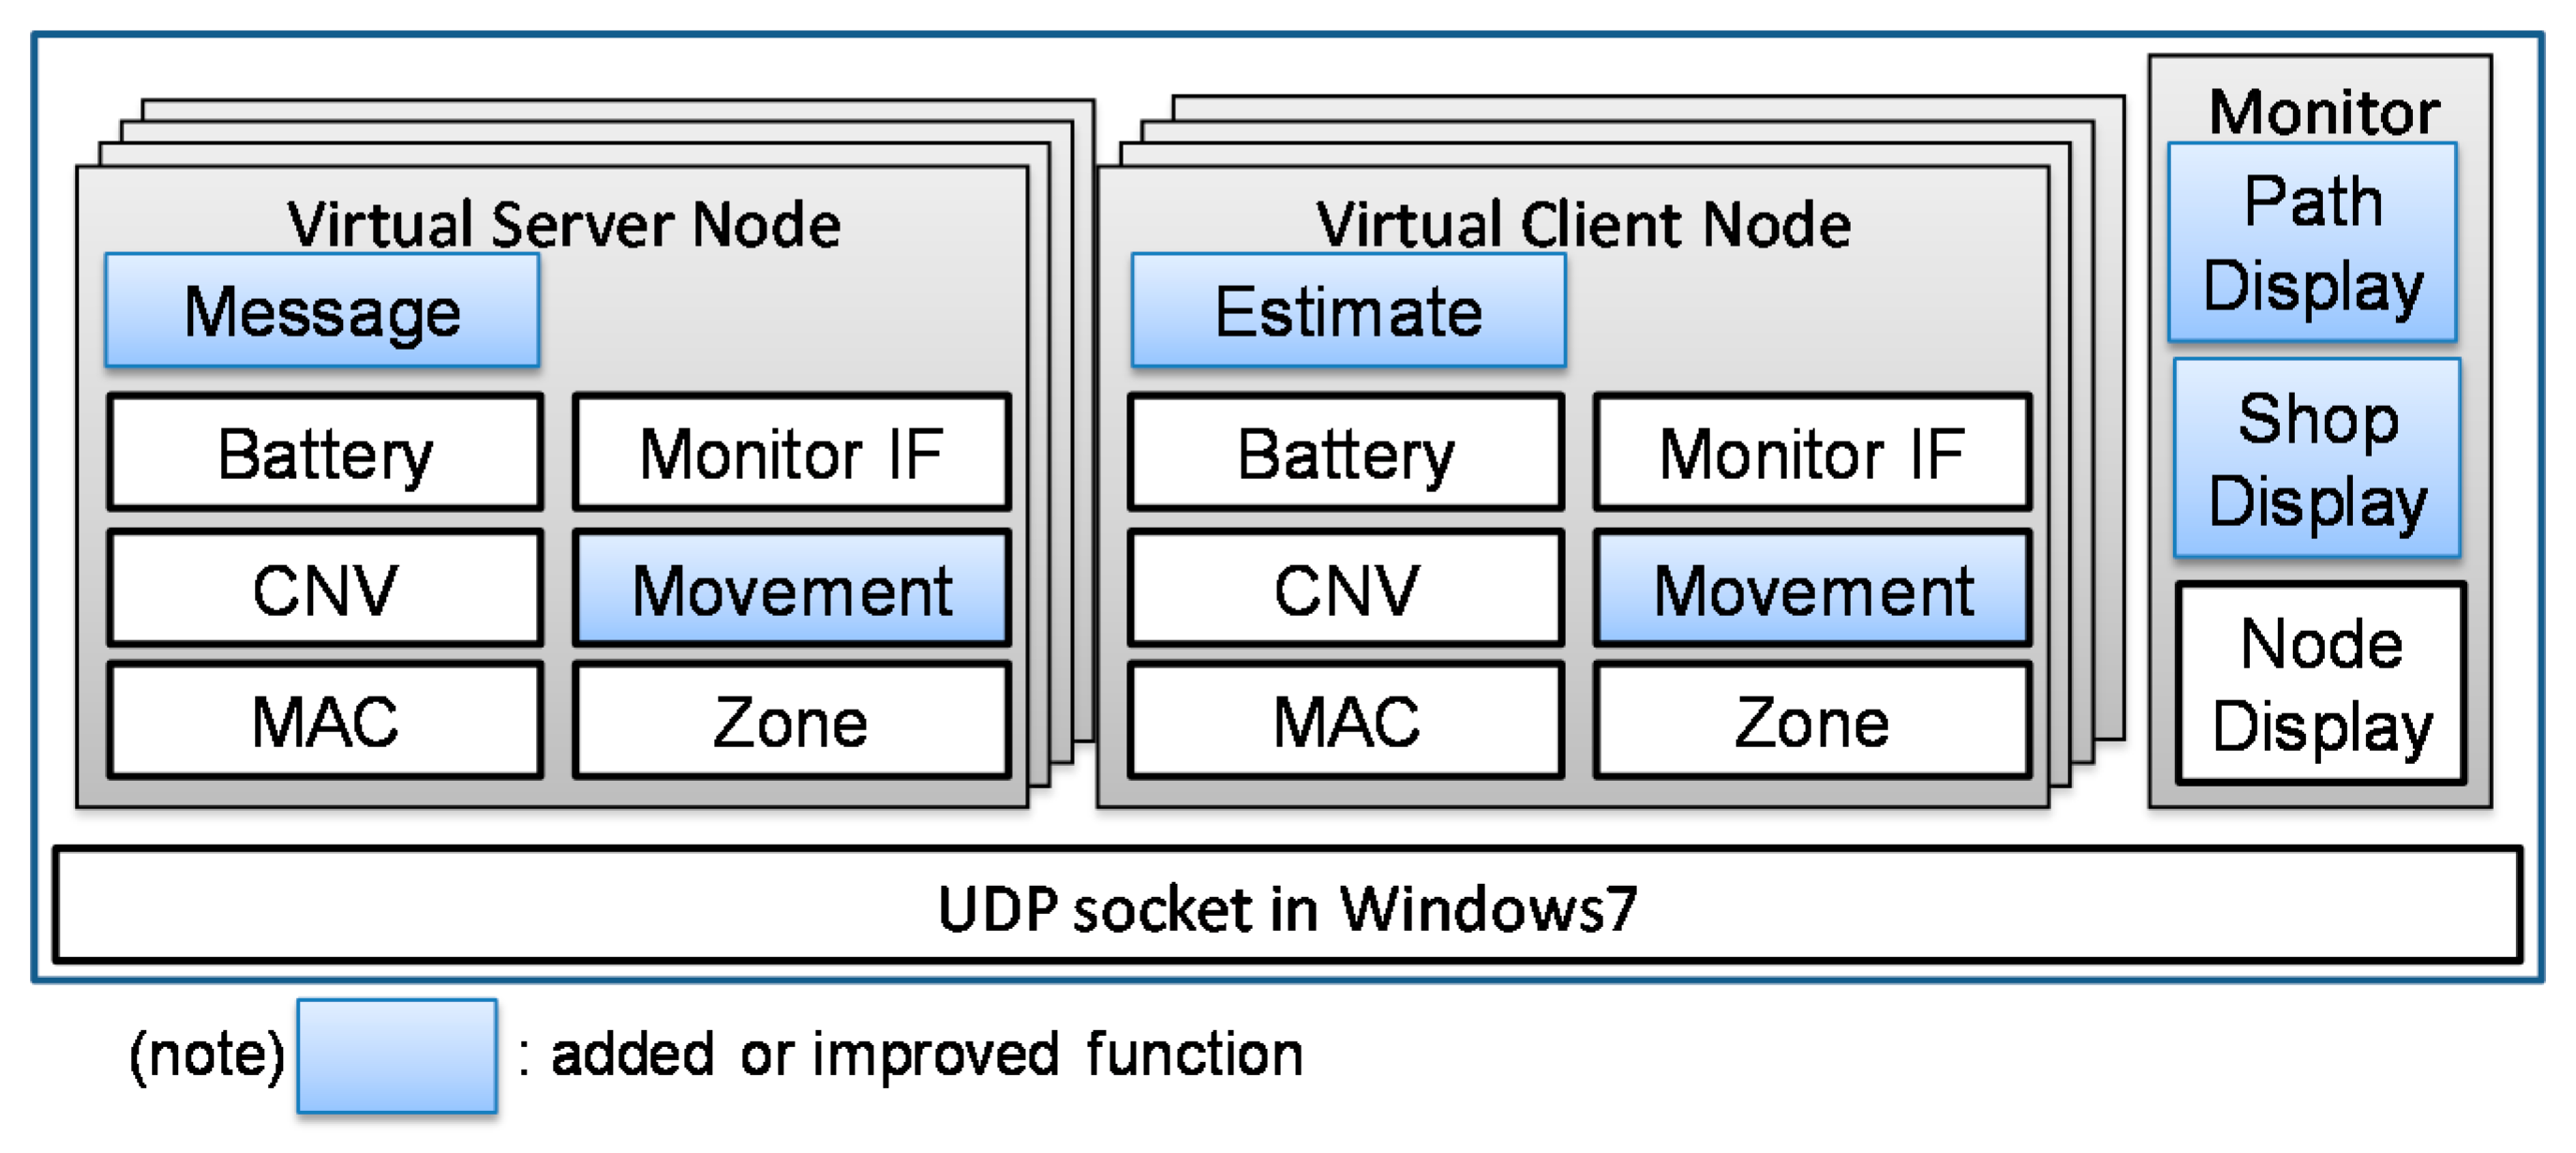
We developed an evaluation system by modifying the MANET (Mobile Ad hoc NETwork) emulator [14]. It simulates communication between multiple nodes. The configuration of the evaluation system is shown in Figure 8. The proposed algorithm and protocol were mainly implemented in the localization module [Estimate], the message processing module [Message] and the mobility model [Movement]. The emulator can additionally simulate the remaining battery level [Battery], the interface with the monitor [Monitor IF], conversion between the virtual and real IP addresses [CNV], the MAC (Media Access Control) layer [MAC], radio coverage [Zone], etc. Virtual server nodes were implemented by providing virtual nodes with a broadcasting function. Virtual client nodes were implemented by adding to virtual nodes the functions of receiving messages from server nodes, the function of determining their own coordinates from these messages, and the function of sending these coordinates to other client nodes. These virtual nodes move around and communicate with the Monitor. The Monitor monitors the virtual nodes. It can display nodes, shops and paths. This has made it possible for us to observe the movements of nodes visually in addition to tracking numerical data of node coordinates. Multiple virtual server nodes and client nodes can be activated on a PC, and their movements can be monitored with the Monitor. Since the Monitor receives the coordinates of each node as necessary, it can monitor them in real time. It can also display the radio coverage area and the links that have been established between nodes.
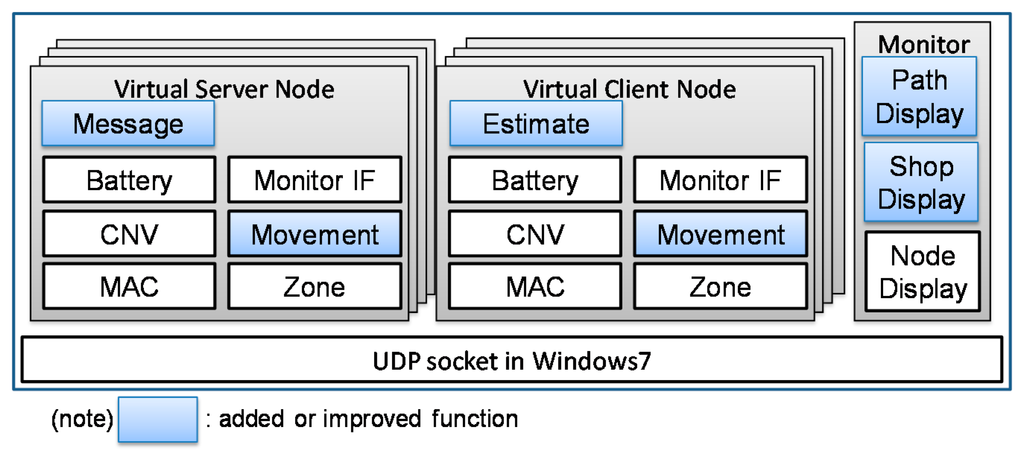
Figure 8.
Configuration of the evaluation system.
Figure 8.
Configuration of the evaluation system.
A server node begins to send messages when a client node comes into its territory. A client node begins to send messages when another client node comes into its territory. The territory of a node is a circular area of a radius of RD (radio wave propagation distance) with the node in its center. RD is treated as a parameter. A node processes messages at intervals of T ms, and determines its location. We evaluated the level of localization accuracy by comparing the paths taken by virtual client nodes as monitored by the Monitor with the paths actually taken by the corresponding client nodes.
4.2. Underground Shopping Mall Model
The model consists of m × n cells. Each cell is a K[meter] × L[meter] rectangle. A shop or a path is assigned to each cell. A matrix, S, is defined to indicate the assignment of shops, and a matrix, R, is defined to indicate the assignment of paths.
- S = {sij}: an m × n matrix in which the value of sij is the shop number if a shop is assigned to the cell, and is “0” if no shop is assigned to it.
- R = {rij}: an m × n matrix in which the value of rij is the path number if a path is assigned to the cell, and is “0” if no path is assigned to it.
To reflect the actual size of shop sij or path rij, the center of the shop or the path is identified, and its location is defined as follows on an x-y plane:
- sij = {sij(x),sij(y)}(where sij(x) and sij(y) are the x and y coordinates of the center of shop sij.)
- rij = {rij(x),rij(y)}(where rij(x) and rij(y) are the x and y coordinates of the center of path rij.)
In addition to the shop number, sij holds the shop name as follows:
sij = [{shop number},{shop name}]
The shape of a shop may not be always rectangular. It may be more complex. A realistic, detailed mall plan can be represented by assigning a number of cells to a shop or a path. The level of localization accuracy of the proposed method depends on the displacement of the reference point from the center of the area within which the reference point is allowed to move. Therefore, it depends on the shape of the shop concerned and the number of shops. If we are to evaluate the proposed method using all possible combinations of area shapes and number of shops, an enormous computation will be required, and yet it will be difficult to identify useful combinations. A reasonable approach is to build a model that reflects an actual underground shopping mall.
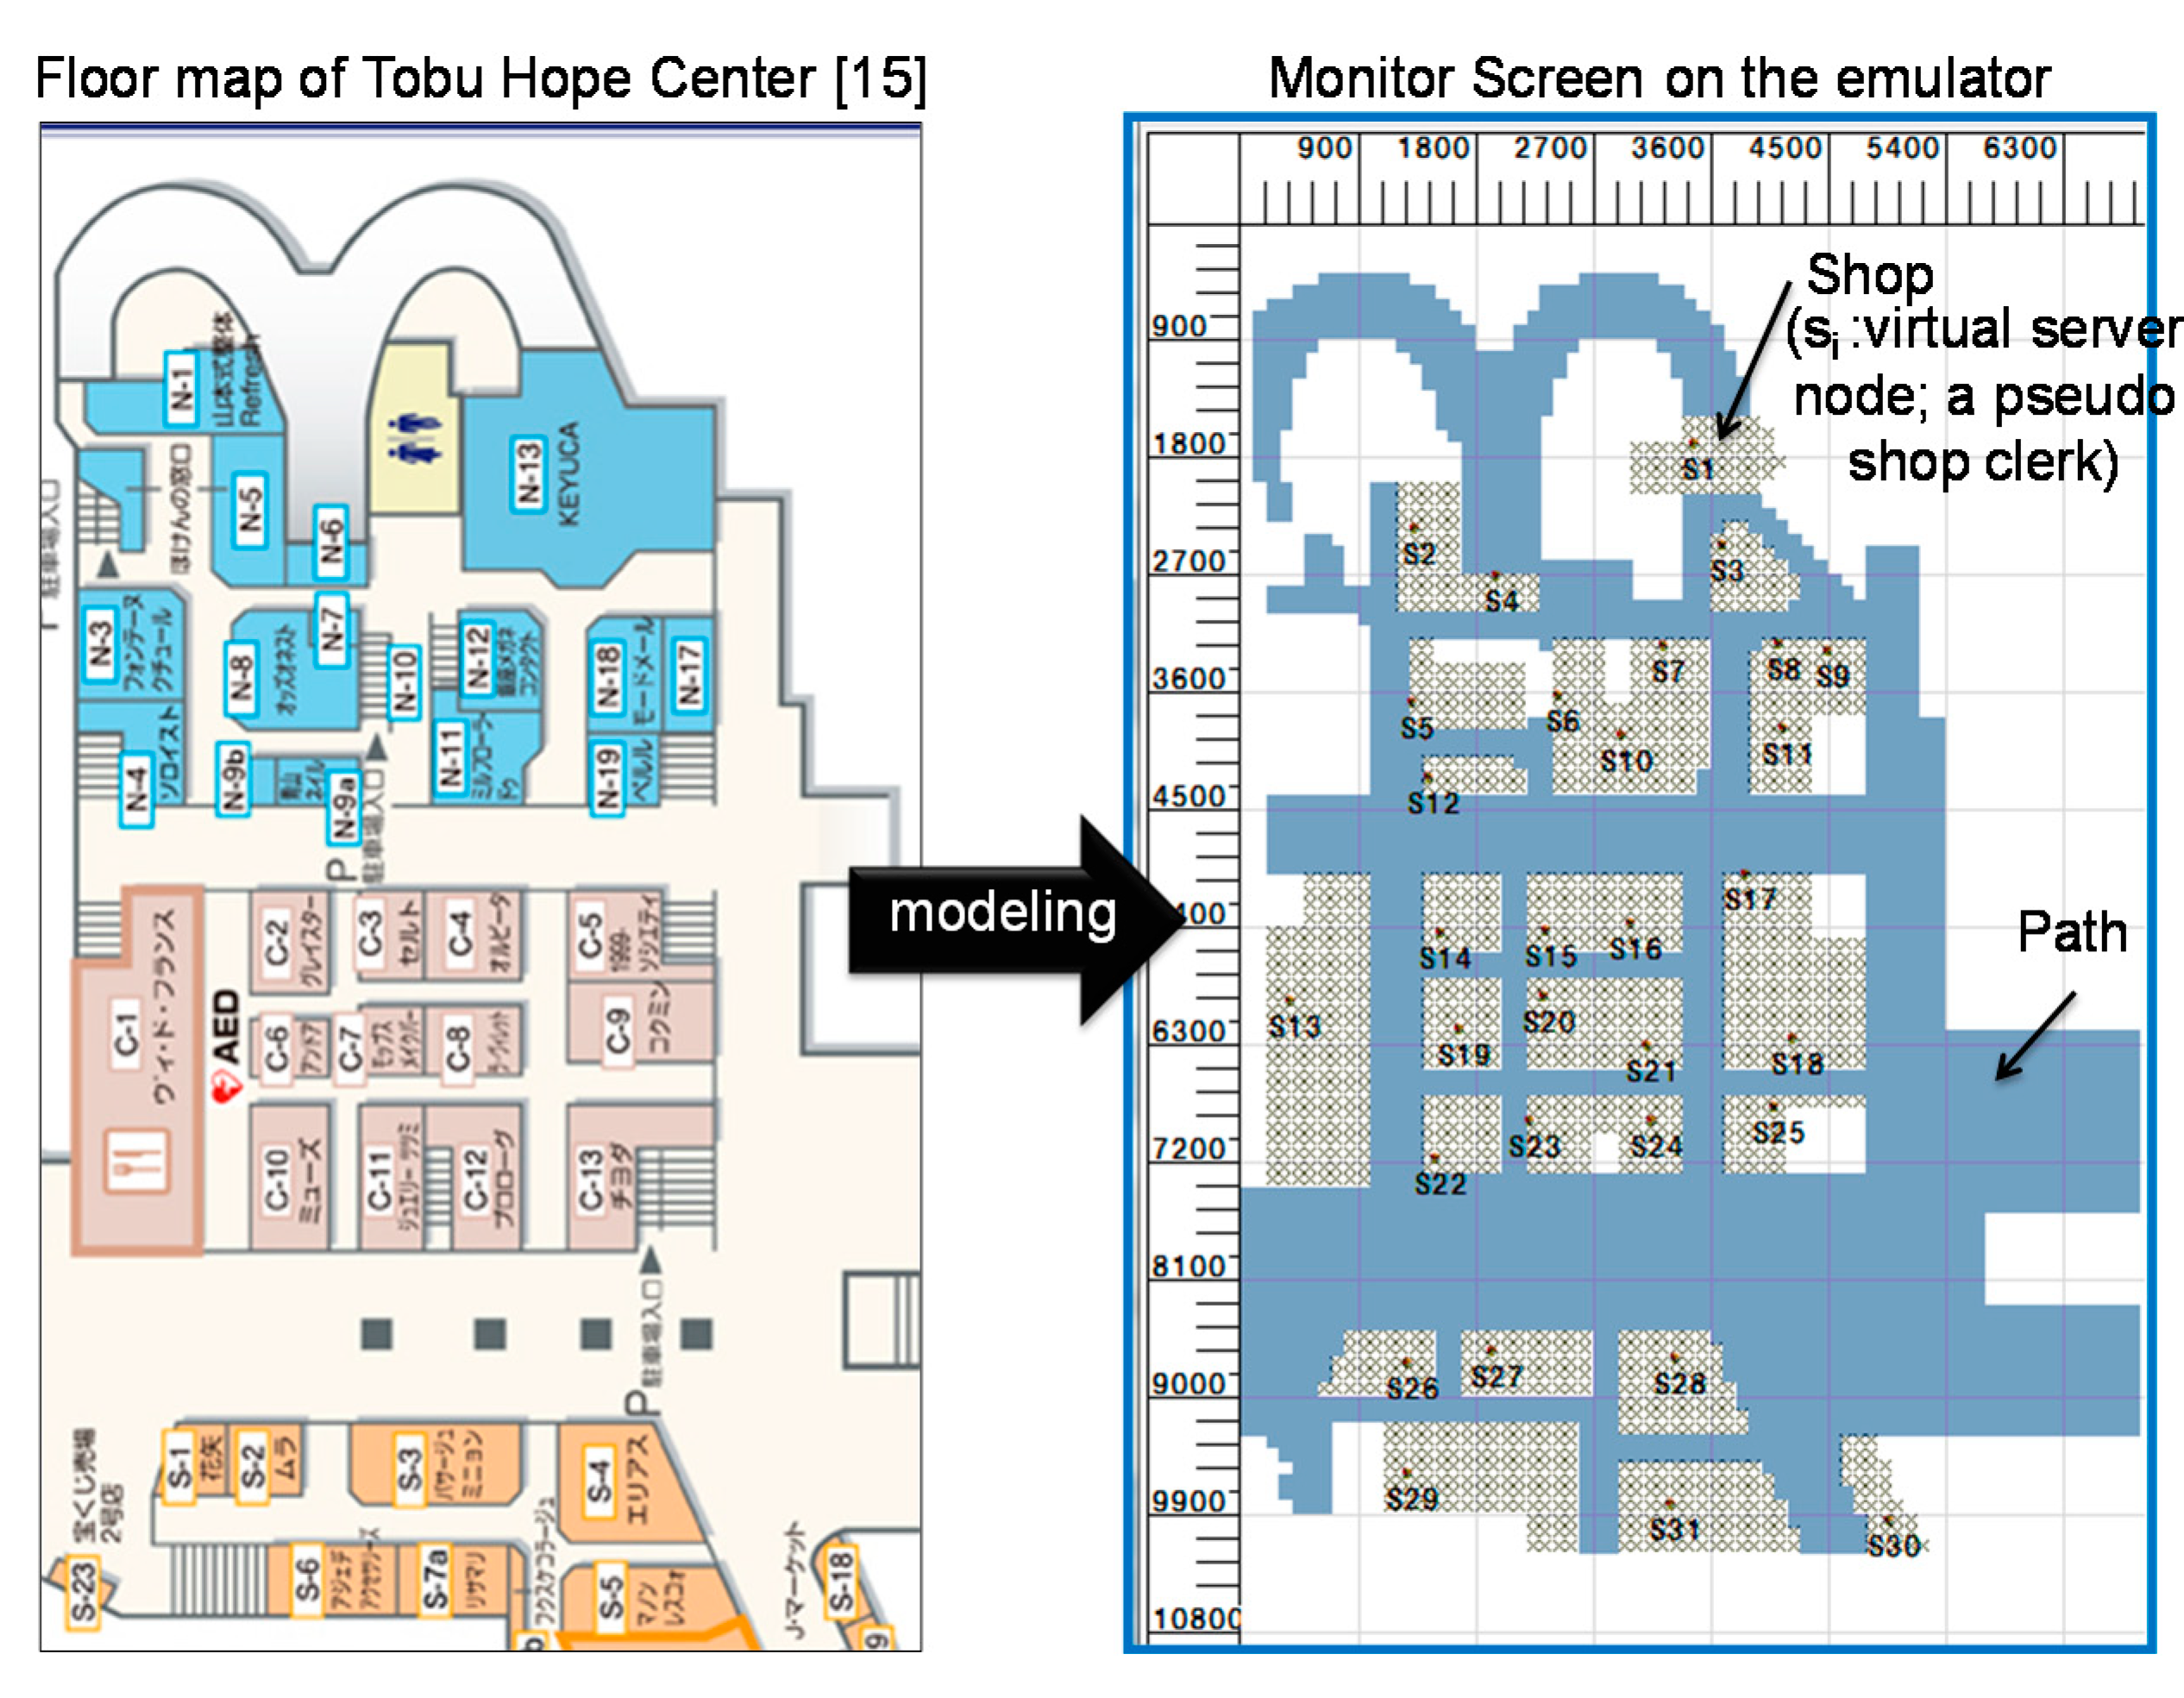
Our mall model was developed based on an existing underground shopping mall called Tobu Hope Center [15]. The 31 shops in this center have been incorporated into the emulator. The maximum, minimum and weighted average sizes of the shops are 180 m2, 18 m2 and 50 m2 respectively. The distribution of shop sizes is shown in Figure 9. The area size is 70 m × 105 m. The mall built on the emulator is shown in Figure 10.
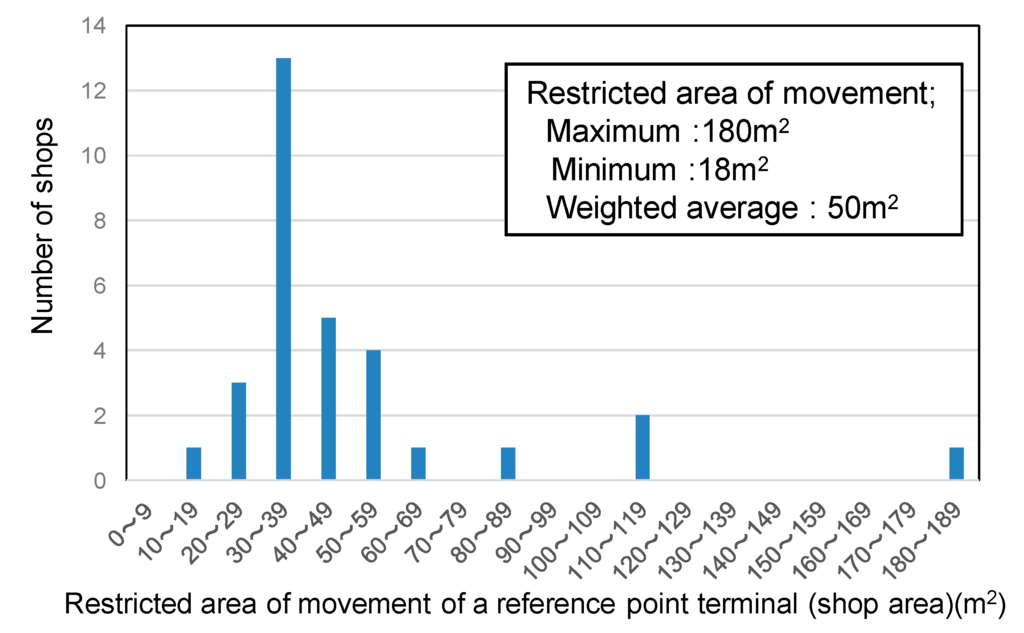
Figure 9.
Distribution of shop area sizes.
Figure 9.
Distribution of shop area sizes.


Figure 10.
Underground shopping mall model built on the emulator.
Figure 10.
Underground shopping mall model built on the emulator.
4.3. Movement Model
4.3.1. Virtual Server Node
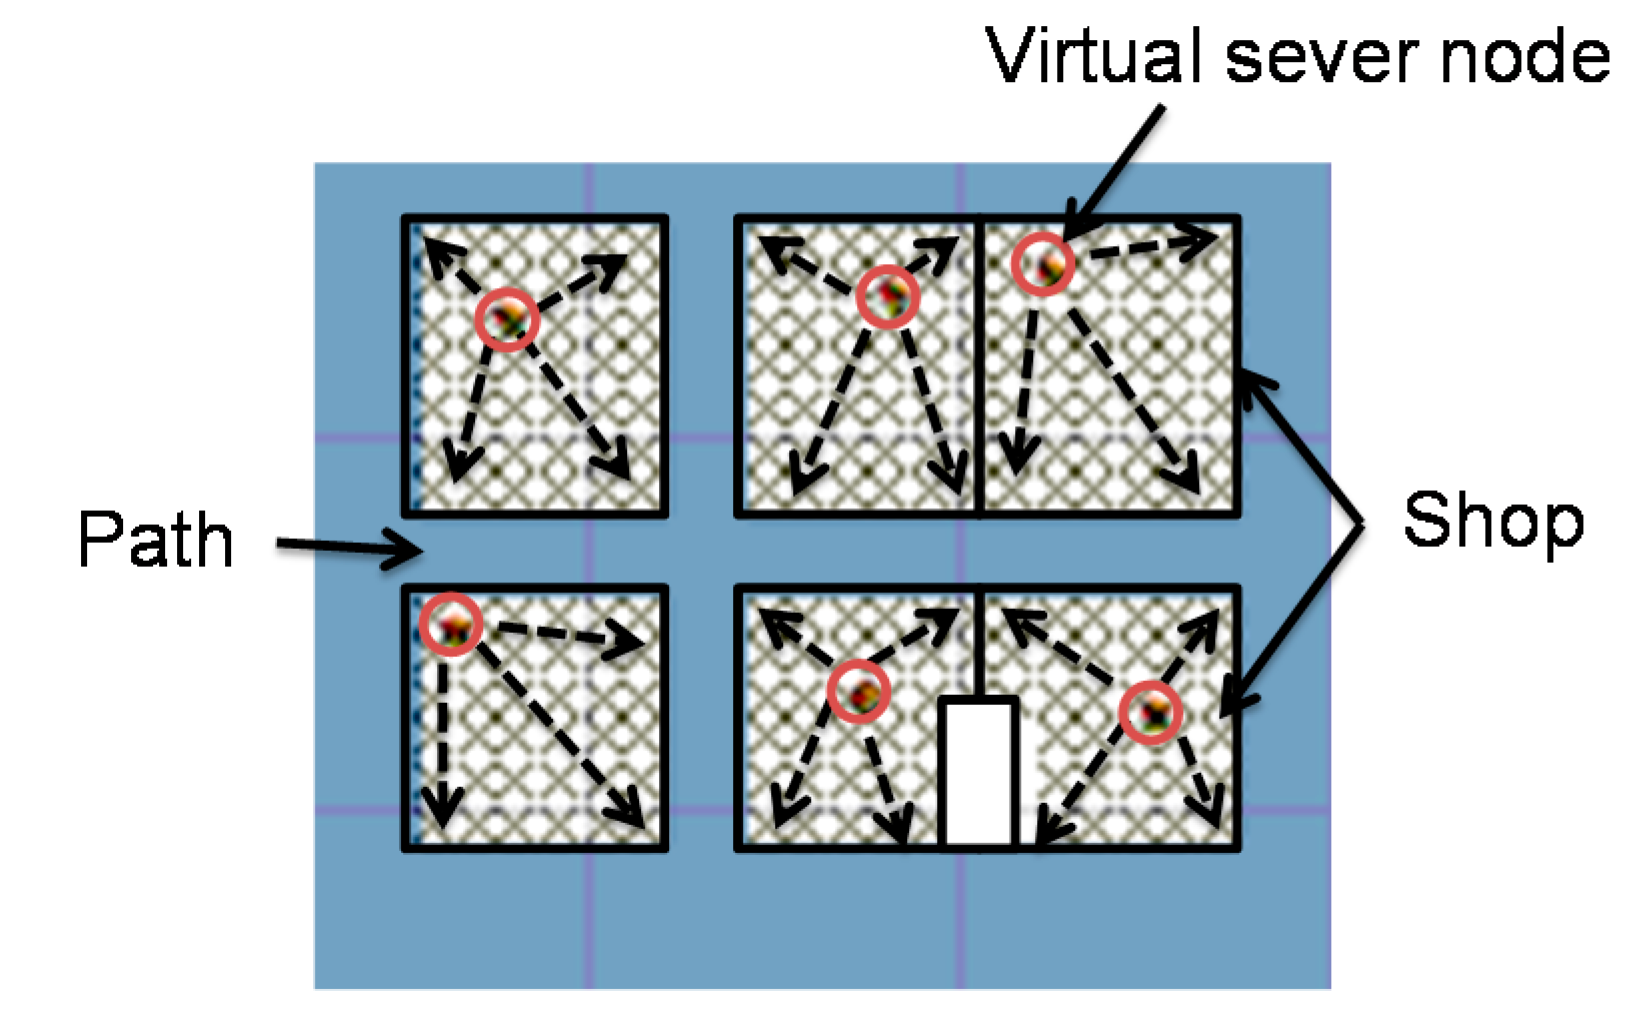
A virtual server node moves according to the random waypoint model. Examples of movement are shown in Figure 11. The virtual server node selects one of the cells of its shop at random and moves to the center of that cell at a constant speed. When it arrives at this center, it selects another cell at random and repeats the above operation. If it happens to select the same cell, it would not move. To avoid this situation, the coordinates of the previous interval are retained temporarily so that the coordinates of the next destination will not be the same as the coordinates of the previous interval.

Figure 11.
Movement examples of virtual server node.
Figure 11.
Movement examples of virtual server node.
4.3.2. Virtual Client Node
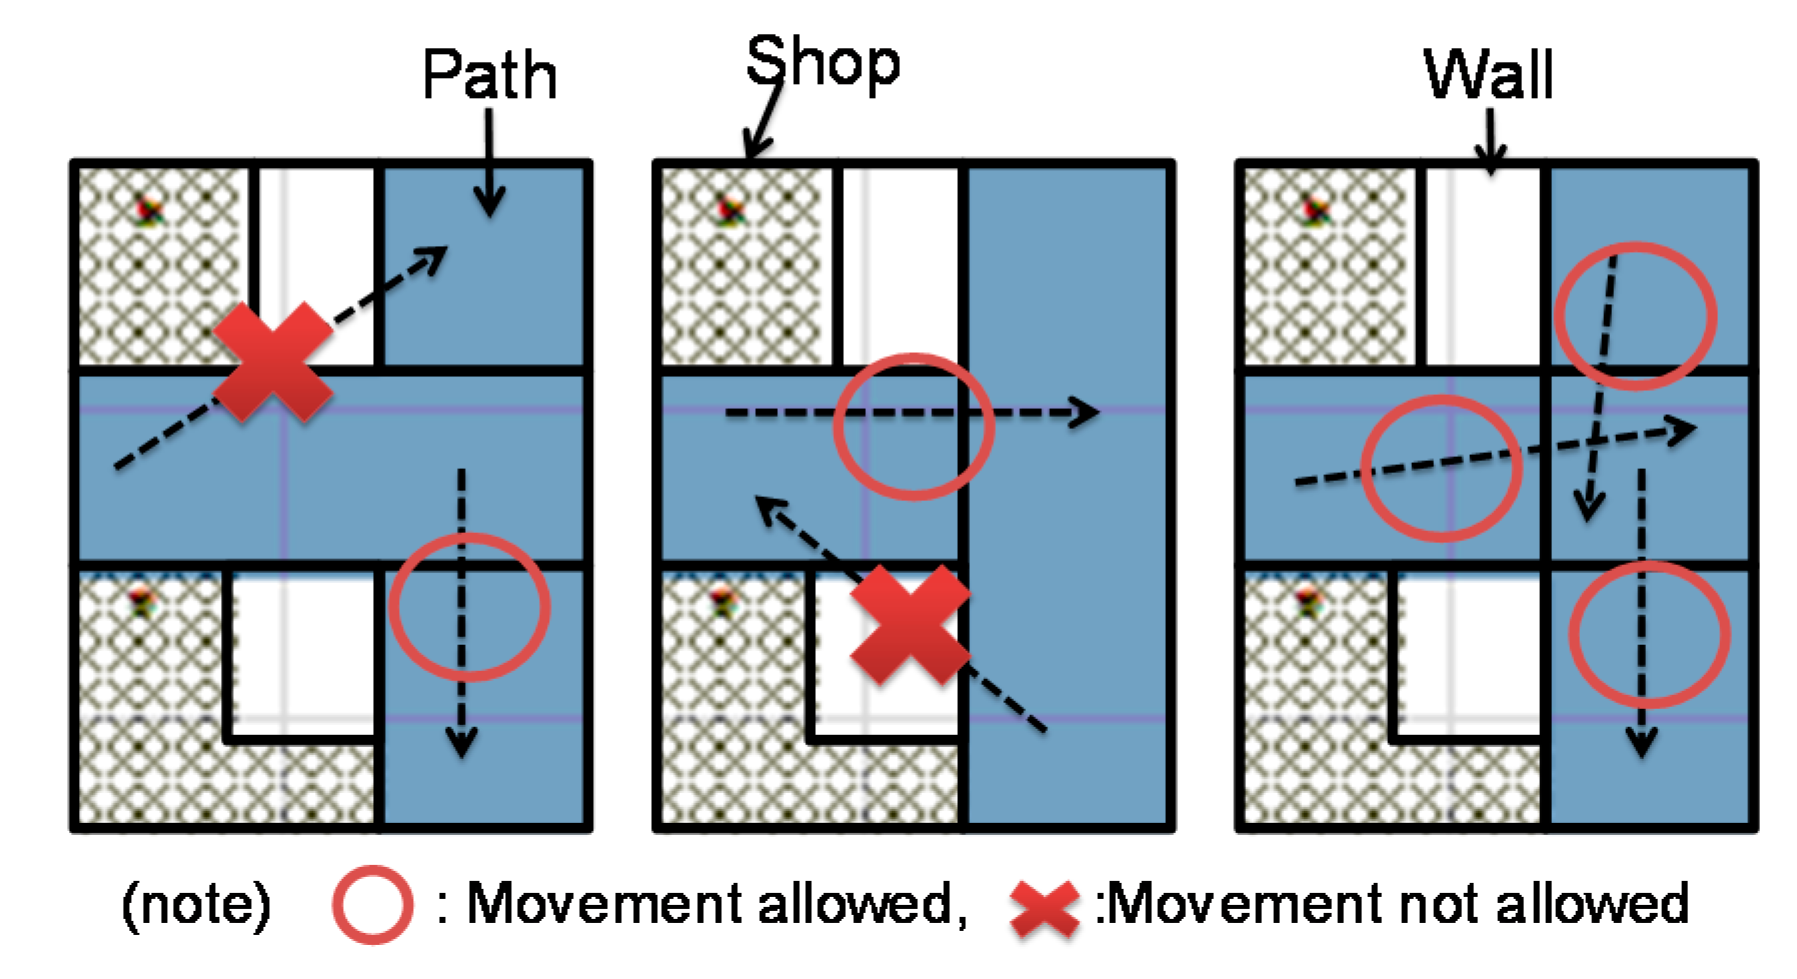
If a virtual client node should move simply according to the random waypoint model, it may go through walls of shops, which cannot occur in an actual mall. Example of the movements of client nodes are shown in Figure 12. To limit the locations from which entrance to a shop is allowed, the concept of “section” was introduced to the definition of a path. A path section is a rectangle and consists of a number of path cells. A virtual client node can move from one section to an adjacent section without going through walls or shops. Each section is created in such a way that its edges align with the extensions of the edges of shops and paths. This compels virtual client nodes to take only paths when moving from a section to an adjacent section. A virtual client node stays on paths until it reaches the entrance to the target shop.

Figure 12.
Movement model example of virtual client node.
Figure 12.
Movement model example of virtual client node.
5. Evaluation of the Level of Localization Accuracy
The level of localization accuracy has been evaluated by calculating the distance between the actual and determined locations of nodes. The evaluation conditions are shown in Table 1. The radio propagation characteristics inside an underground shopping mall are extremely complex because they depend on the materials and thicknesses of the walls and ceilings, the shape of the shopping mall, the number and shapes of shelves in shops, the number of people in the shopping mall and many other factors. It is difficult to simulate such a complex environment accurately. They also depend on the performance of the transmitters/receivers of smartphones. Since the purpose of this paper is to evaluate the level of localization accuracy when terminals that move around within limited areas are used as reference points, we have assumed that the radio wave can be detected from a distance of up to 10 m from the radio source, considering the characteristics of the latest near-field communication. We do not consider cases where smartphones run out of batteries.

Table 1.
Evaluation Conditions.
| Item | Condition |
|---|---|
| Scenario map size | 70 m × 105 m |
| Simulation time (log acquisition interval) | 600 s |
| Number of client nodes | 1, 10, 50, 100, 150, 200 |
| Number of server nodes | 31 |
| Processing interval T | 1000 ms |
| Radio coverage distance RD | 10 m |
| Initial value of the N/M ratio s | 0.8 |
| Number of rounds of simulation | 1, 10 |
| Initial locations of client nodes | Random |
| Mobility model | Random waypoint |
| Moving speed of nodes | 3.6 km/h |
The route actually taken by a user and the route selected by the localization algorithm are mapped on the mall plan in Figure 13. Although the number of client nodes is 200, this map shows information about only one client node.

Figure 13.
Actual route and determined route.
Figure 13.
Actual route and determined route.
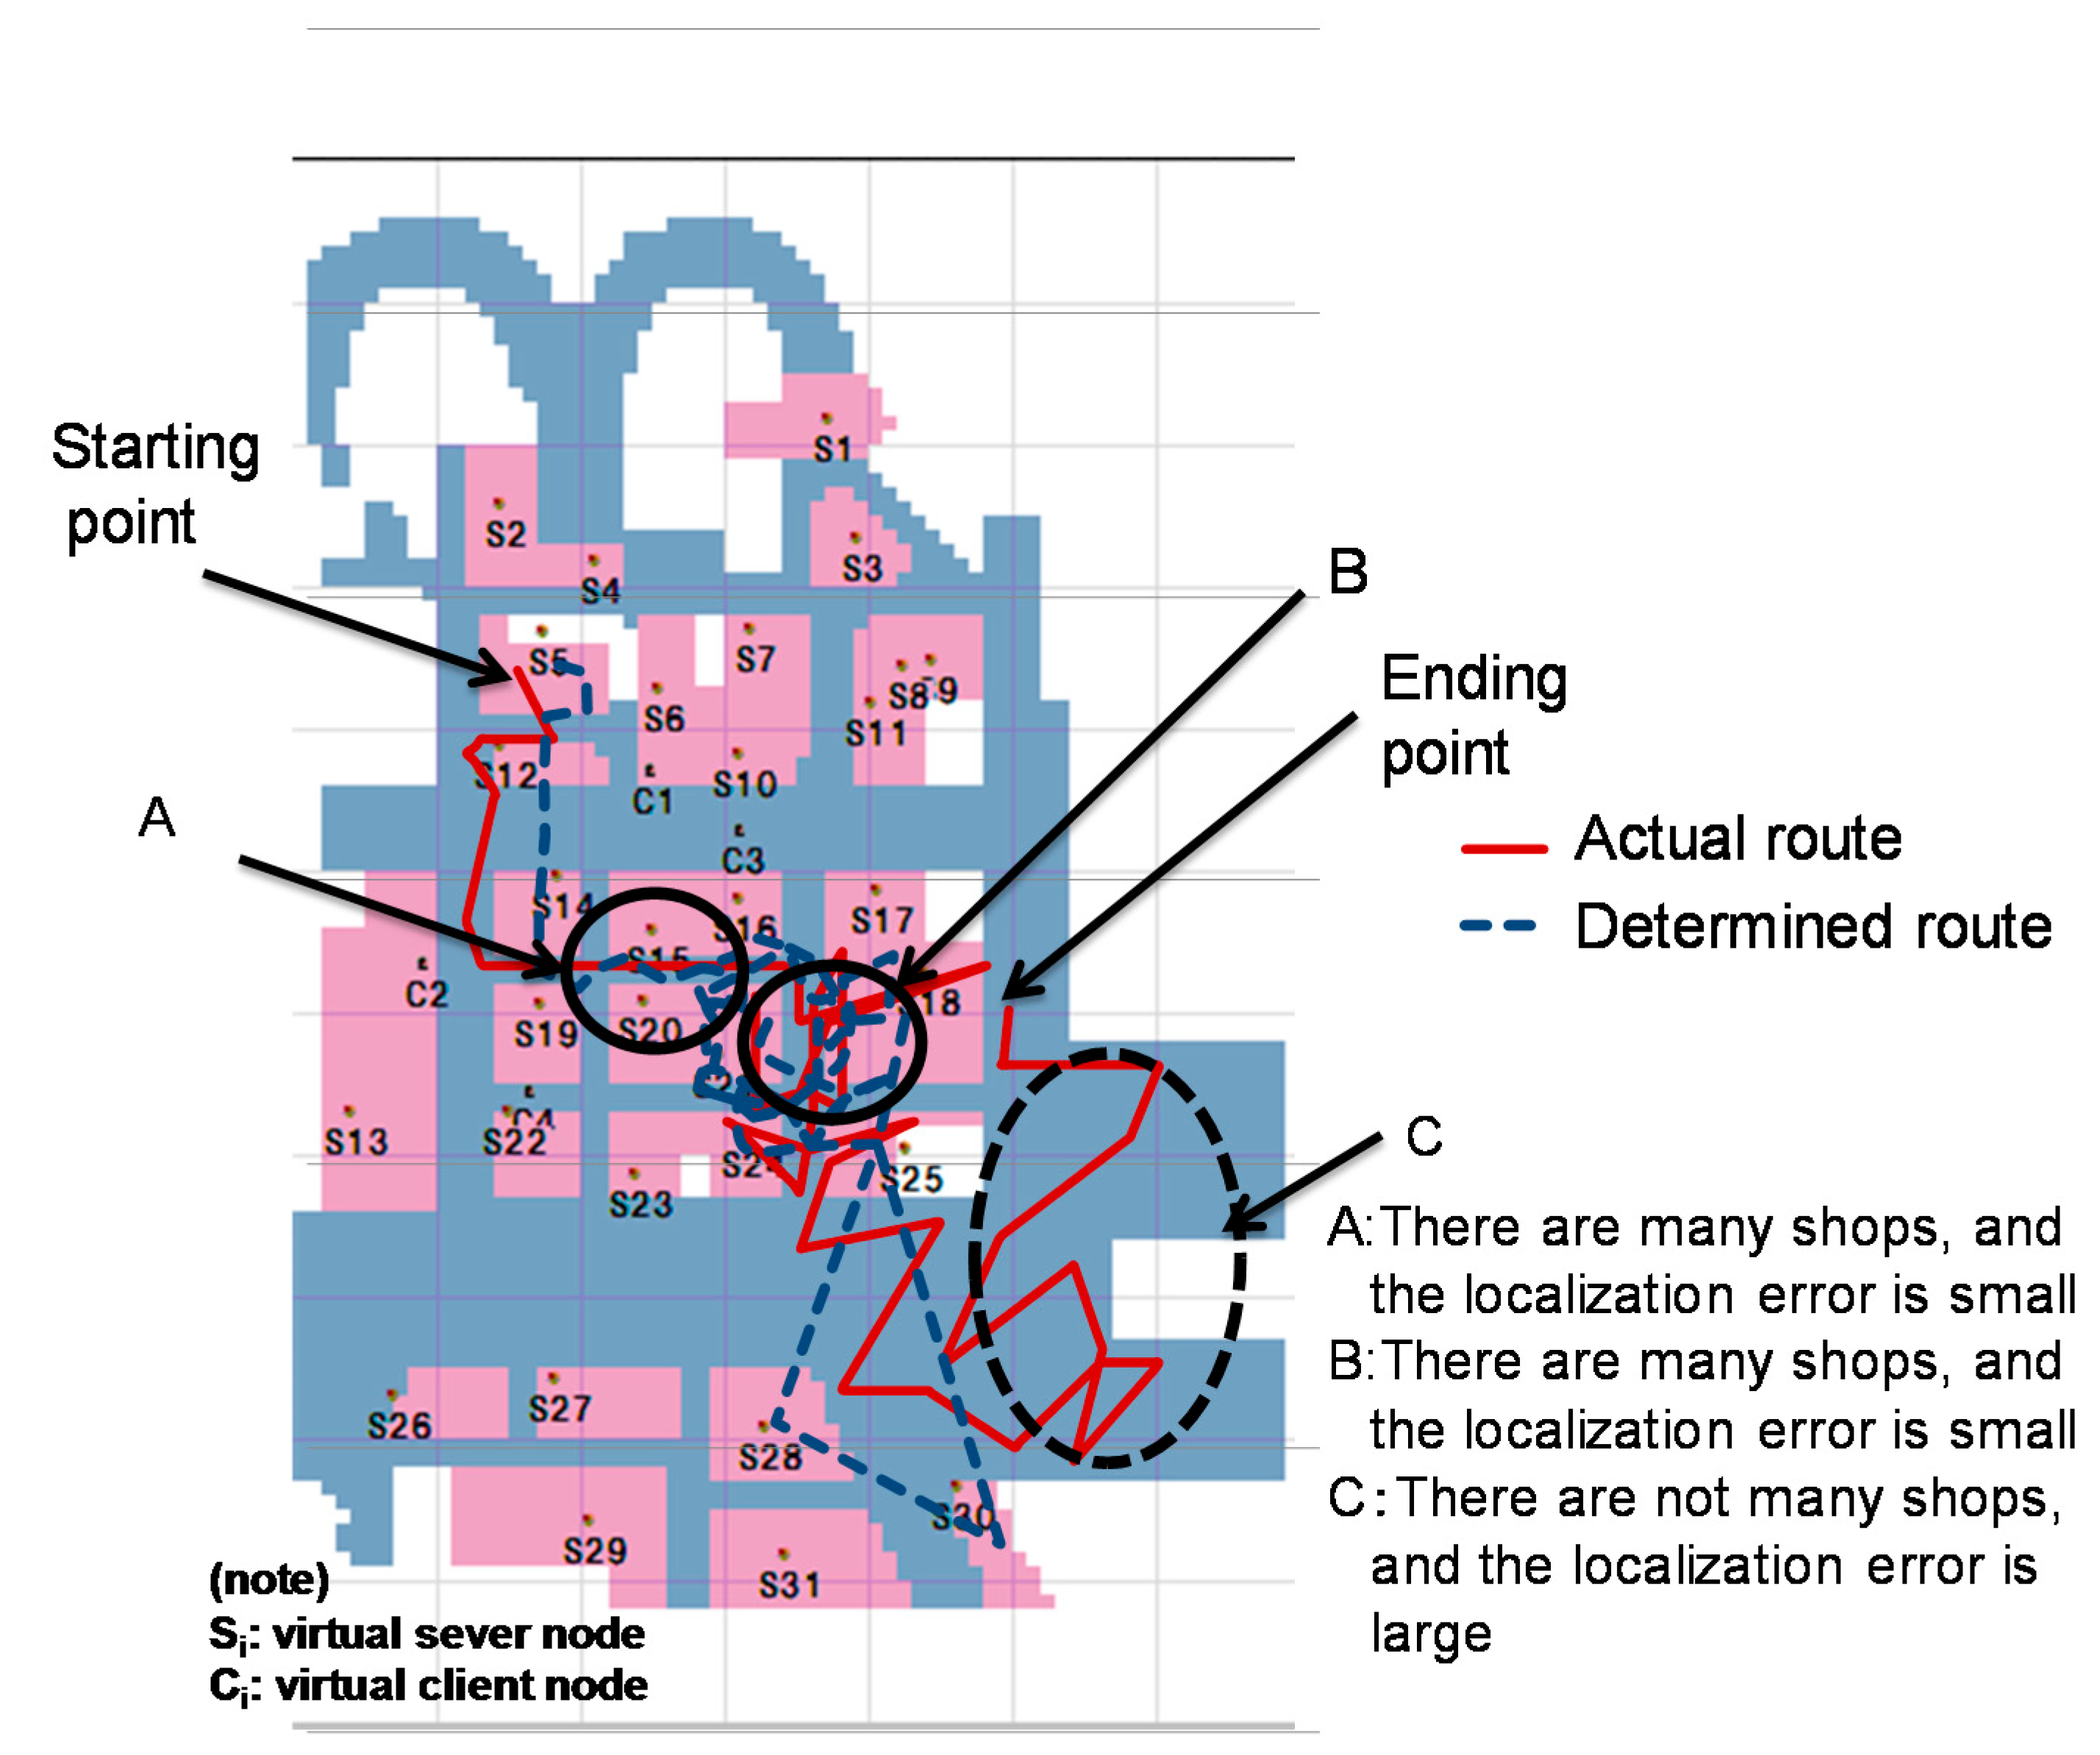
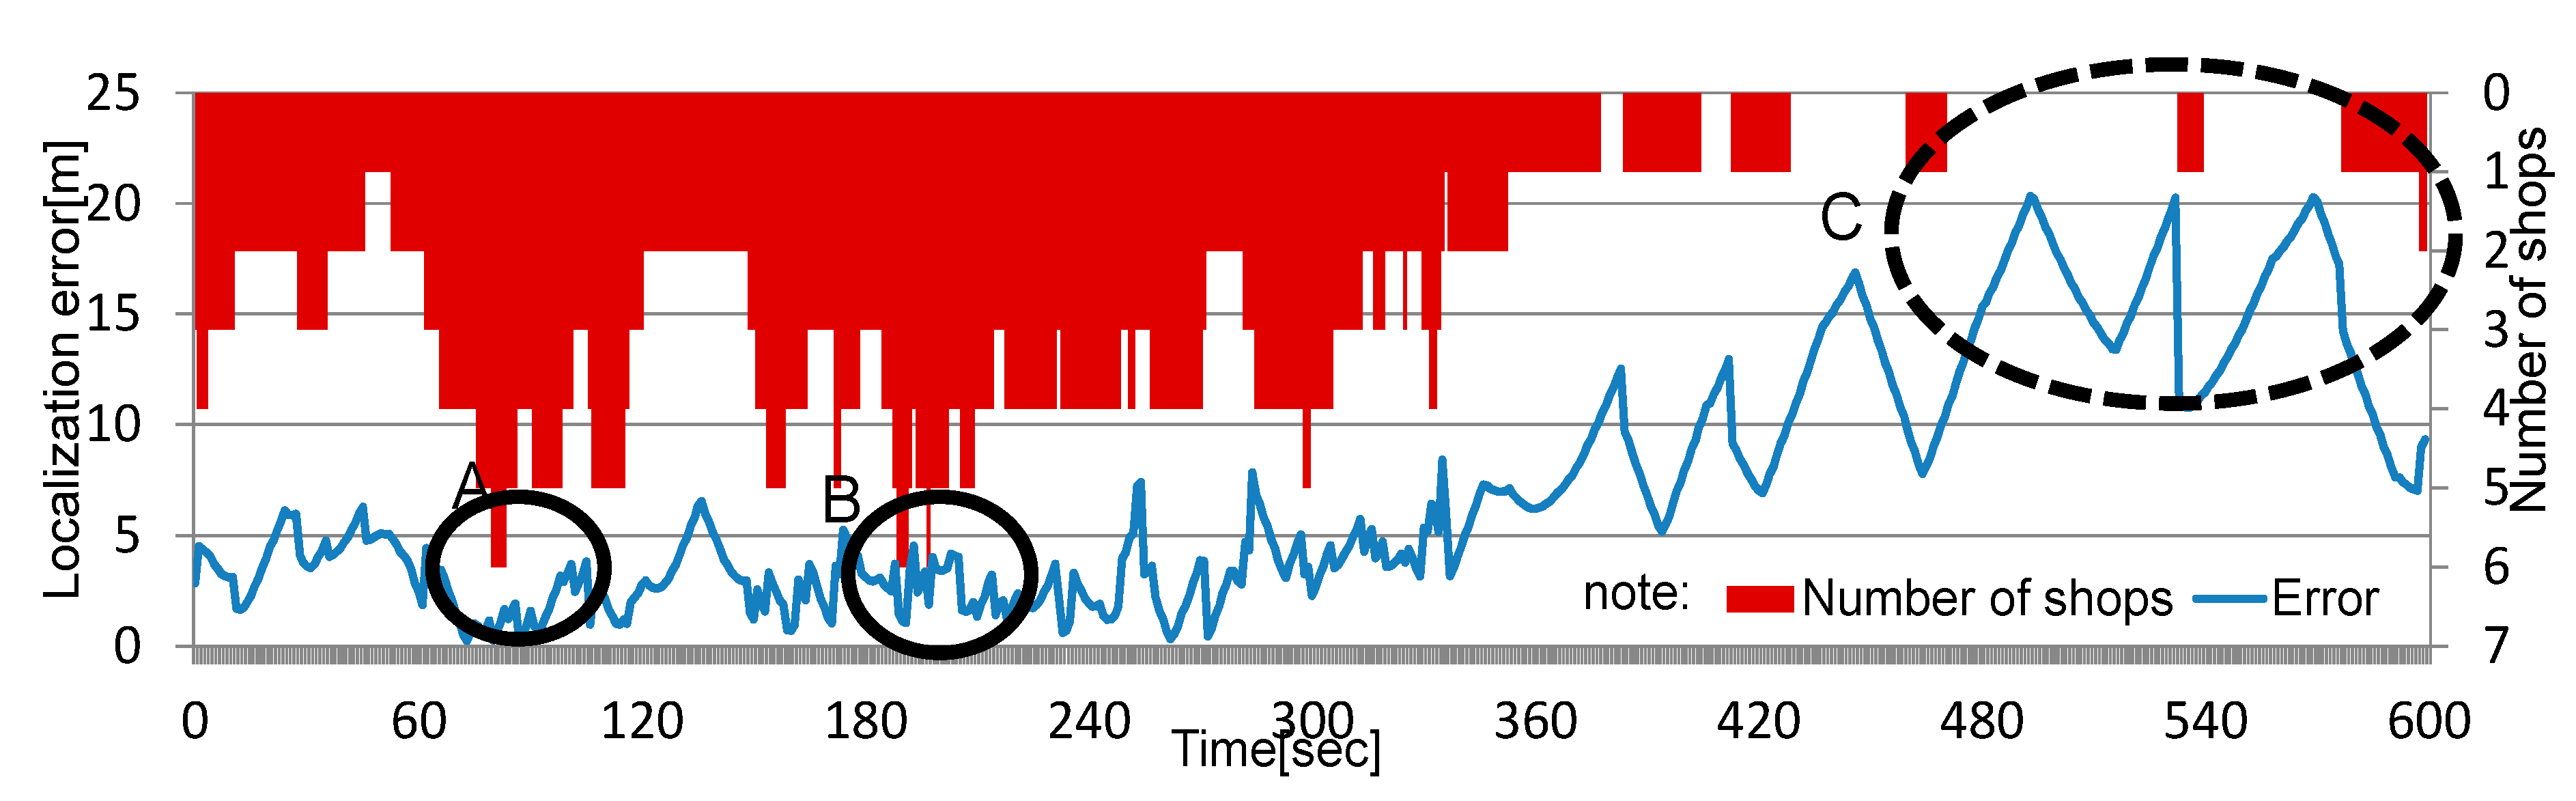
The starting point is located at the upper left point, and the ending point in the middle of the mall. The solid lines show the route actually taken, and the dotted lines the determined route. Solid circles A and B indicate areas where shops are densely located. In these areas, the differences between the actual and determined routes are relatively small. In the area surrounded by the dotted circle C, shops are less densely located. Therefore, the client node was not able to receive messages from many shops, causing the determined route to differ greatly from the actual route.
The chronological changes in the localization error and the number of shops from which messages could be received are shown in Figure 14. The localization error (LE) of each client node is calculated using Equation (3).
where xe and ye are the coordinates of the determined location, and xr and yr are the coordinates of the actual location.

Figure 14.
Chronological changes in the localization error and the number of shops.
Figure 14.
Chronological changes in the localization error and the number of shops.
5.1. Relationship Between the Number of Shops from Which Messages Are Received and the Localization Error
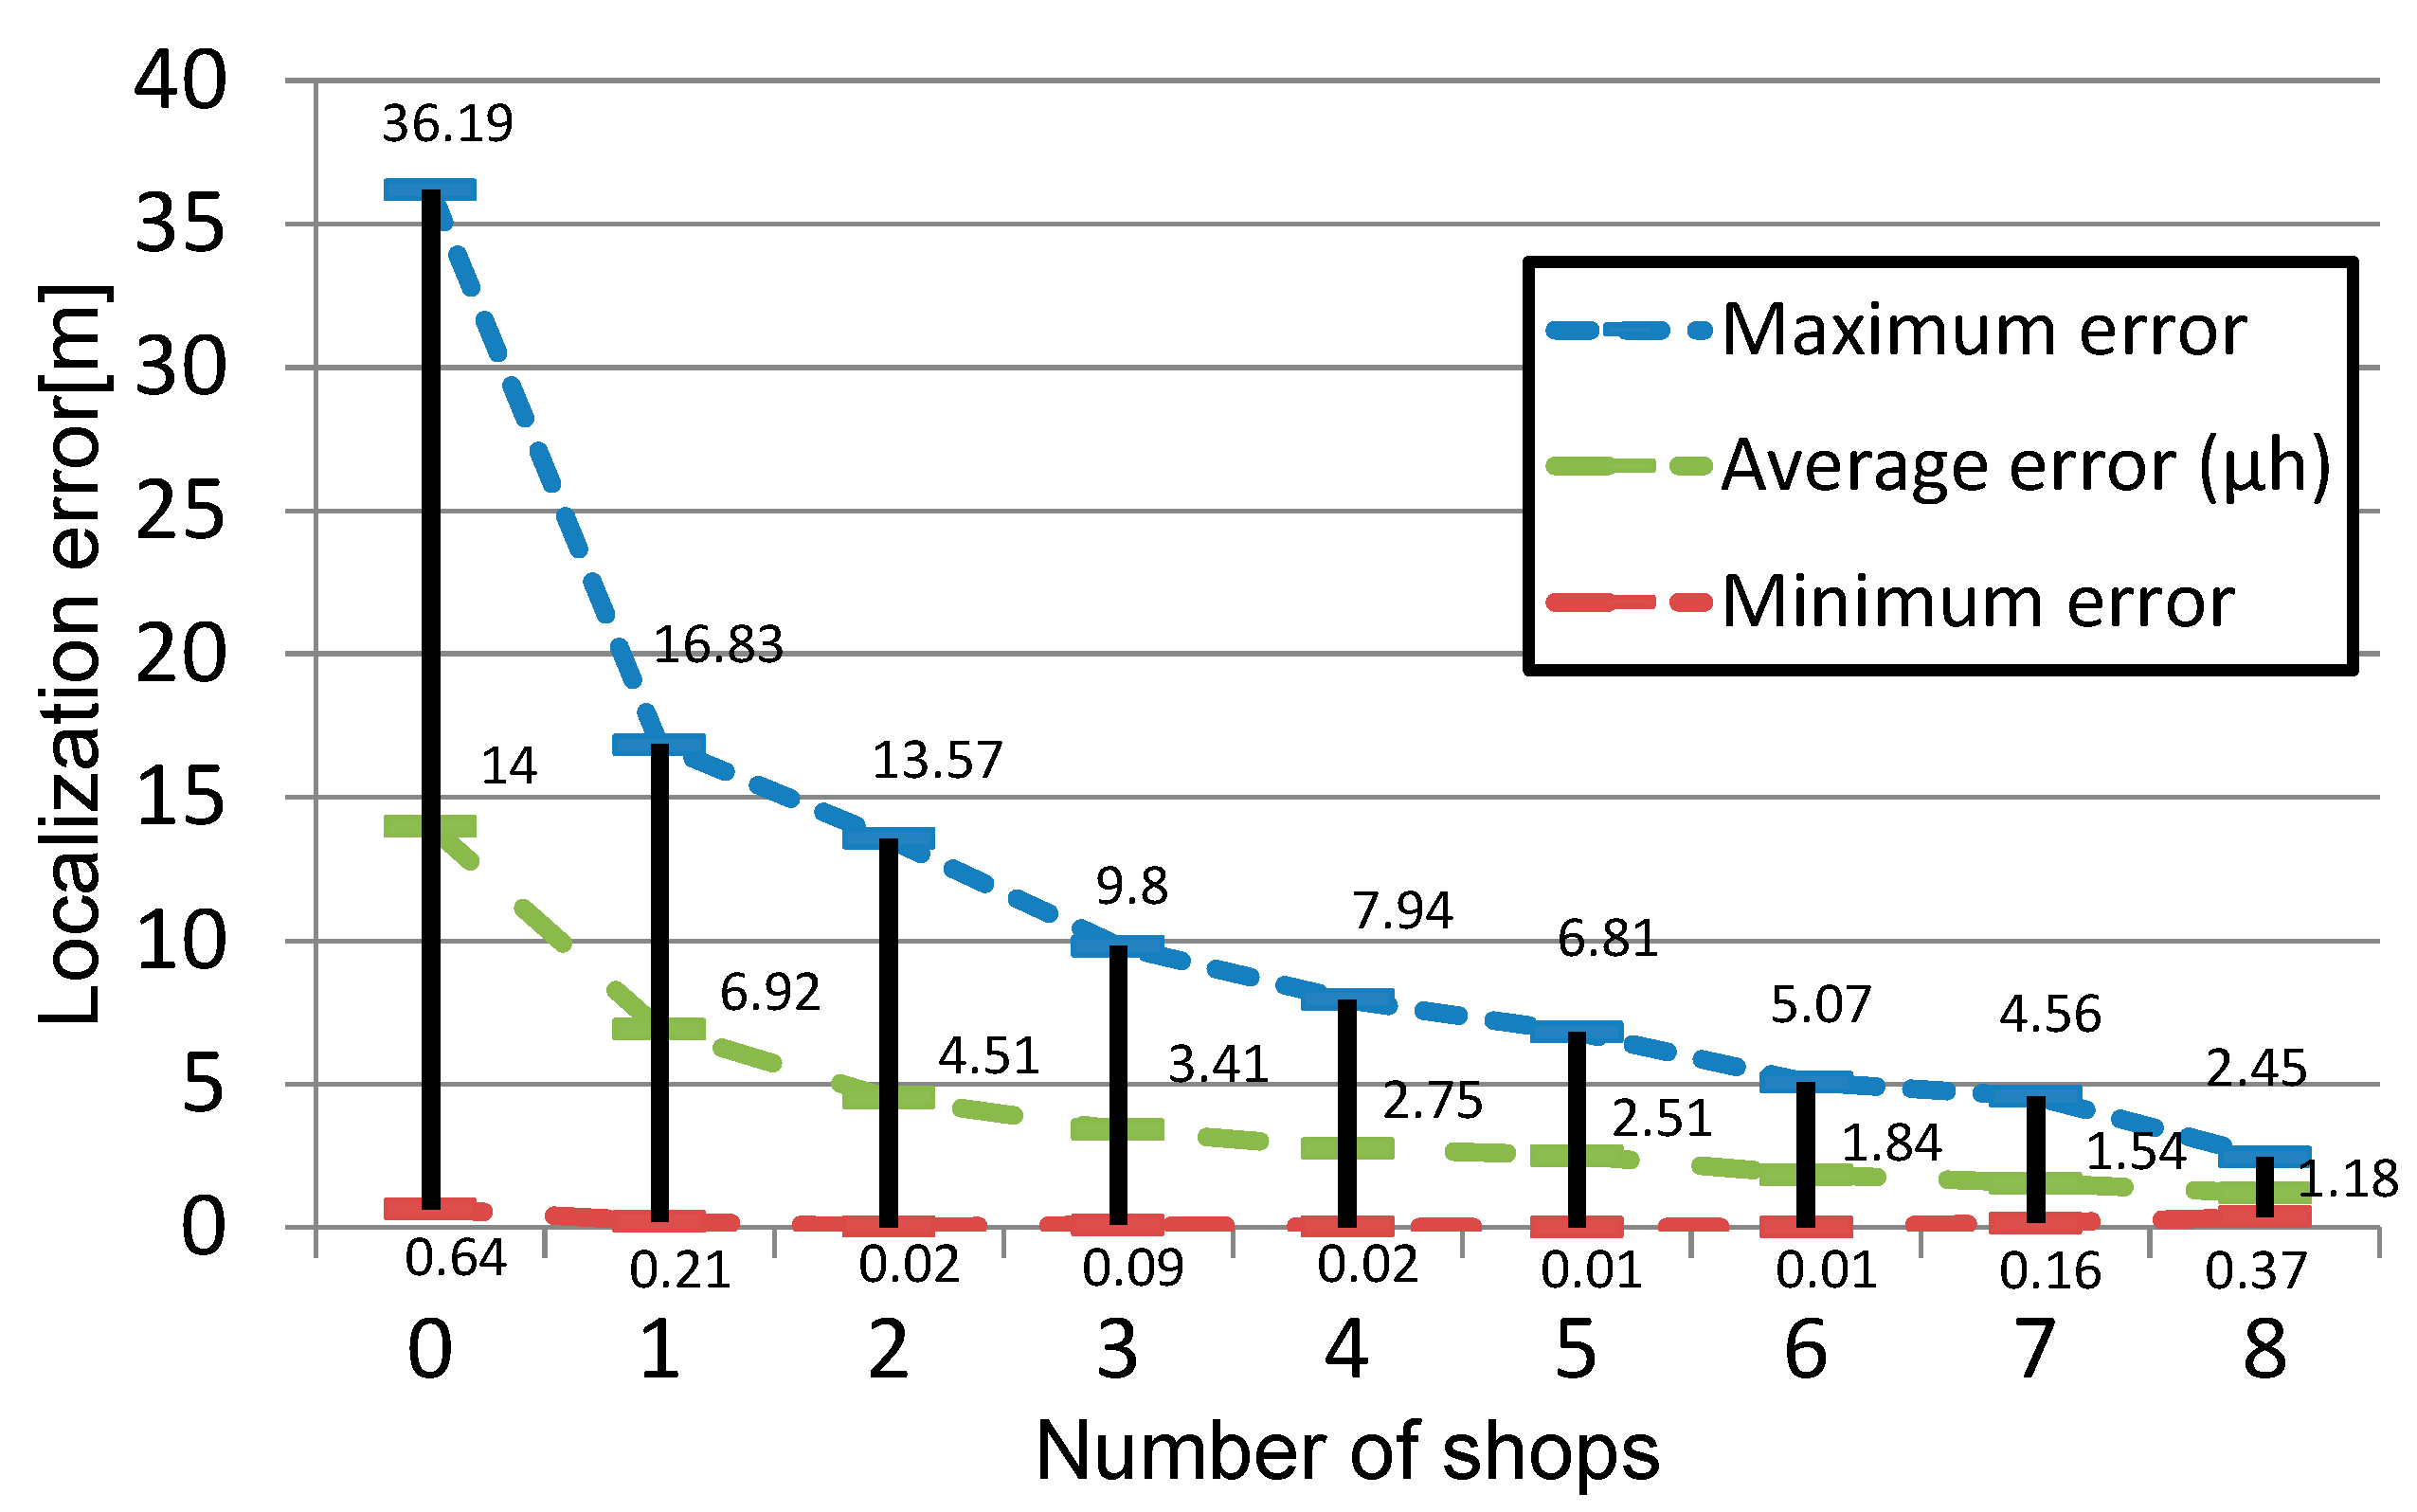
The relationship between the number of shops and the maximum, minimum and average errors is shown in Figure 15. The vertical axis shows the localization error, and the horizontal axis shows the number of shops from which messaged were received, for a case where there are 50 client nodes.
This figure shows the analysis result for a case where 50 client nodes were generated and log data were collected every second in a round of simulation that lasted 10 min. Each item of log data includes the locations of client nodes, the number of server nodes from which messages were received, the number of client nodes from which messages were received, the location calculated from the location information received from other nodes using the centroid method, etc. For example, to calculate the errors of the determined locations for a case where messages were received from three server nodes, the log data of client nodes that received messages from three server nodes are extracted. The average error of the determined locations of these client nodes was calculated using Equation (4). This is plotted in the figure along with the maximum and minimum errors. The maximum error is the LE value obtained when the location calculated is the farthest from the actual location of the client node. The minimum error is the LE value obtained when the location calculated is the closest to the actual location of the client node.
where
- LEh: Error of locations determined from the log data for cases where message were received from h server nodes.
- nh: Number of log data items for cases where messages were received from h server nodes.
- μh: Average error of locations determined from log data for cases where message were received from h server nodes (shops).
All the errors, i.e., the maximum, average and minimum errors, decrease as the number of shops increases. This is because the area in which the client node is assumed to exist becomes smaller as the number of shops from which messages can be received increases. As was explained in the discussion of Figure 13, the localization error was large where there were few shops or no shop. The reason why the maximum localization errors were larger than the radio coverage distance of 10 m can be explained as follows: since the server node, which holds the coordinates of the center of the shop, moves around in the shop, the difference between the coordinates of the centers of the shops within the radio coverage area and the locations of the virtual server nodes added to the radio coverage distance. If the number of shops from which messages could be received is three or more, locations were determined with a high level of accuracy with the average error being below four meters.

Figure 15.
Relationship between the number of shops from which messages are received and localization errors (average errors for 50 client nodes).
Figure 15.
Relationship between the number of shops from which messages are received and localization errors (average errors for 50 client nodes).
The simulation with 50 client nodes over 10 min was repeated 10 times. The average localization error for these 10 rounds is shown in Figure 16. With the 10 rounds of simulation, the number of items of determined location data amounted to 600,000. The average error of determined locations of client nodes was calculated from the above data using Equation (5). The standard deviation of the errors is calculated using Equation (6), assuming that the data follow the normal distribution. The localization error, Λh, with a confidence interval of 95% for a case where messages were received from three server nodes is calculated using Equation (7).
where
λh: Average of μh in 10 simulation rounds.
σh: Standard deviation of the localization errors as calculated from the log of 10 simulation rounds for a case where messages were received from h server nodes.
The vertical axis shows the localization error, and the horizontal axis the number of shops. If messages can be received from three shops, the average localization error with a confidence interval of 95% was 3.39 ± 0.07 m (3.39 ± 1.91 × standard deviation). This result means that, if messages can be received from three or more shops, the localization error can be below our target of 4 m.
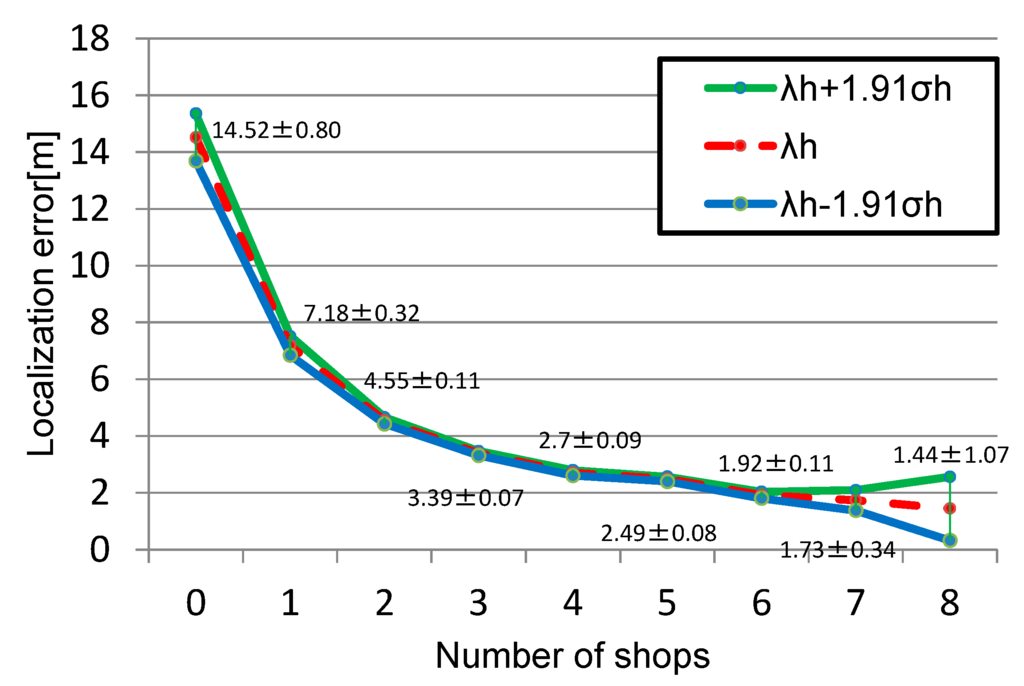
Figure 16.
Range of the average errors for 50 client nodes (confidence interval: 95%).
Figure 16.
Range of the average errors for 50 client nodes (confidence interval: 95%).

5.2. Relationship Between the Number of Client Nodes and the Localization Error
In an area, such as Area C in Figure 13, where messages are received from no shop or only one shop, the number of client nodes that collaborate with each other affects the localization error. The average localization error of a single client for one round of simulation is calculated using Equation (8). The average localization error is not calculated for each number of server nodes from which messages were received.
where
LEx: Localization error of client node x.
μx: Average localization error of client node x.
nx: Number of items of log data for client node x from a single round of simulation.
The relationship between the number of client nodes and the average localization error is shown in Figure 17.
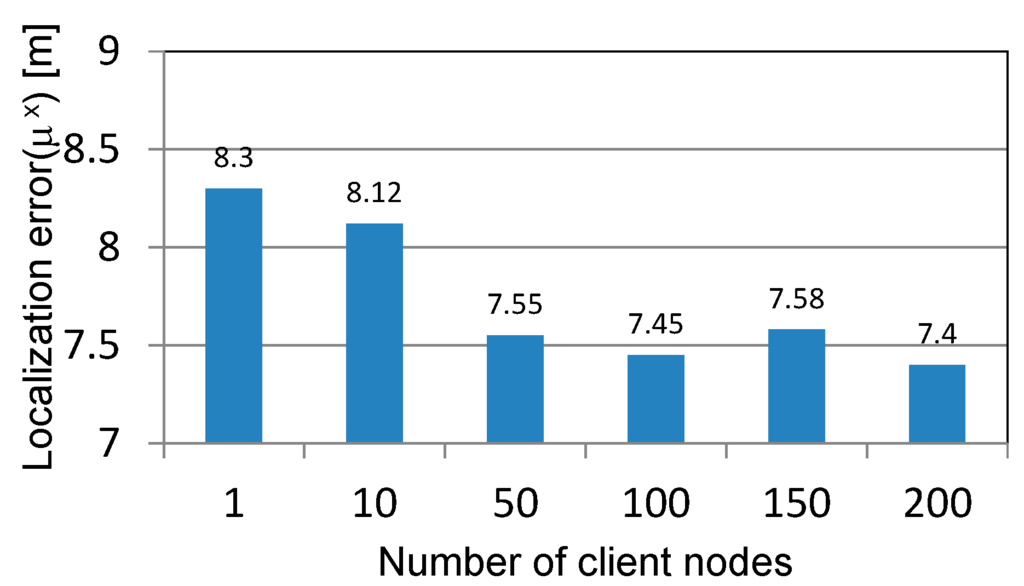
Figure 17.
Relationship between the number of client nodes and the localization error.
Figure 17.
Relationship between the number of client nodes and the localization error.

The case where the number of client nodes is one represents the case where the client node concerned has no other nodes to collaborate with. Even when the number of client nodes was increased from 1 to 10, the change in the average localization error was very small. However, when it exceeded 50, the average error began to decrease. This is because even when messages were received from only one shop or no shops at all, the localization error was averaged out by 50 or more client nodes. In the underground mall modelled in the present evaluation, about 50 client nodes can be within an area where they can collaborate with each other. Therefore, the localization error that depends on client nodes can be uniform.
5.3. Relationship Between the Ratio of the Number of Shops from Which Messages Are Received to the Number of Client Nodes from Which Messages Are Received, s, and the Localization Error
Equations (1) and (2) presented in Section 3.3.1 uses the ratio of the number of shops from which messages are received to the number of client nodes from which messages are received, s (Hereafter, s is referred to as the “usage ratio”). The usage ratio defines the extent to which information received from client nodes are used as supplementary information. To evaluate the effect of the usage ratio, the usage ratio was varied from 1:9, 2:8, 3:7, etc. (see Figure 18). The effect of the usage ratio on localization was measured using the emulator. The total number of client nodes was set to 100, and the most effective usage ratio was determined. The log of each ratio was collected over a period of 1 min. We defined the effect ratio, P(E), as in Equation (9).
where
where δ (collaboration active) is the error when the determined location is complemented by client nodes [m], and δ (collaboration inactive) is the error when the determined location is not complemented by client nodes [m]
P(E)=1 − E
E = δ(collaboration inactive) ÷ δ(collaboration active)
Note that if E ≤ 1, E = E, and if E > 1, E = 1.
The maximum, average and minimum errors were measured when the determined location was not complemented by client nodes, and the effect ratio was calculated. The average effect ratio for the above three types of error at different usage ratios is shown in Figure 18.
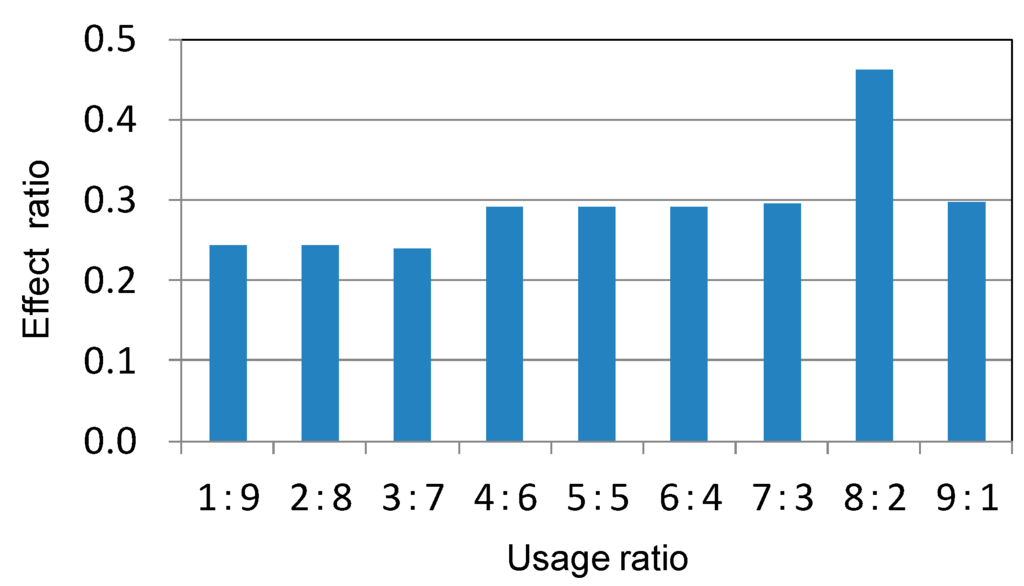
Figure 18.
The average effect ratio for the three types of errors above at different usage ratios (ratio of the number of shops to the number of client nodes).
Figure 18.
The average effect ratio for the three types of errors above at different usage ratios (ratio of the number of shops to the number of client nodes).

The effect ratio was low when the usage ratio was 1:9, 2:8, or 3:7. This is because, in most cases, the localization error was greater when the determined location was complemented by client nodes than when it was not. The effect ratio did not vary so much at other usage ratios. It was the highest at 0.46 when the usage ratio was 8:2.
6. Conclusions
This paper has shown that smartphones can be used as reference point devices for indoor localization, and proposed an indoor localization algorithm that uses the centroid method for location calculation. It has also given a passer-by advertisement delivery service in an underground shopping mall as an example of how the proposed method can use smartphones for indoor localization. An evaluation system has been built on an emulator based on an actual underground shopping mall. It has been found that the larger the number of shops with which a client node can communicate, the smaller the localization error of the client node’s location. The proposed algorithm has worked well with the average localization error being below 4 m when a client node can communicate with three or more shops. In this evaluation model, it has been found that the effect of the number of client nodes that collaborate with each other to complement the localization begins to level off when the number of client nodes is around 50 and that the effect ratio is the highest when the ratio of the number of shops to the number of client nodes used for localization is 8:2.
In the future, it will be necessary to evaluate the proposed method in a model that is based on the radio propagation characteristics of a more complex indoor environment. It will also be necessary to upgrade the model by referring to actual underground shopping malls so that the model will cover more varied shapes and more combinations of shops.
Author Contributions
Takahiro Yamaguchi designed the proposed method, developed the software prototype of the evaluation system, collected the evaluation data, and wrote the initial draft of the paper. Kazumasa Takami provided the direction for his research activities, and refined the proposed method, the analysis of the evaluation results, and the writing of the paper. Both authors have read and approved the final manuscript.
Conflicts of Interest
The authors declare no conflict of interest.
References
- Detecting iPhone and Android Smartphones by Wi-Fi and Bluetooth. Available online: http://www.libelium.com/products/meshlium/smartphone-detection/ (accessed on 27 May 2014).
- iBeacon for Developers: Apple Developer. Available online: https://developer.apple.com/ibeacon/ (accessed on 30 August 2014).
- Fisher, C.; Gellersen, H. Location and navigation support for emergency responders: A Survey. IEEE Pervasive Comput. 2010, 9, 38–47. [Google Scholar] [CrossRef]
- Place Engine. Available online: http://www.placeengine.com/en (accessed on 24 March 2013).
- Yamaguchi, T.; Takami, K. Estimation of Locations in an Underground Shopping Mall through Inter-Terminal Message Exchange. In Proceedings of the 9th IEEE International Conference on Wireless and Mobile Computing, Networking and Communications (WiMob 2013), Lyon, France, 7–9 October 2013.
- Farid, Z.; Nordin, R.; Ismail, M. Recent Advances in Wireless Indoor Localization Techniques and System. J. Comput. Netw. Commun. 2013, 2013. [Google Scholar] [CrossRef]
- Bulusu, N.; Heidemann, J.; Estrin, D. GPS-less Low Cost Outdoor Localization for Very Small Devices. IEEE Pers. Commun. Mag. 2000, 7, 28–34. [Google Scholar] [CrossRef]
- Niculescu, D.; Nath, B. DV Based Positioning in Ad hoc Networks. J. Telecommun. Syst. 2003, 22, 267–280. [Google Scholar] [CrossRef]
- He, T.; Huang, C.; Blum, B.M.; Stankovic, J.A.; Abdelzaher, T. Range-Free Localization Schemes in Large Scale Sensor Networks. In Proceedings of the 9th Annual International Conference on Mobile Computing and Networking, San Diego, CA, USA, 14–19 September 2003; pp. 81–95.
- Priyantha, N.B.; Chakrabory, A.; Balakrishan, H. The Cricket Location-Support System. In Proceedings of the 6th Annual International Conference on Mobile Computing and Networking, Boston, MA, USA, 6–11 August 2000; pp. 32–43.
- Minami, M.; Fukuji, Y.; Hirasawa, K.; Yokoyama, S.; Mizumachi, M.; Morikawa, H.; Aoyama, T. DOLPHIN: A practical approach for implementing a fully distributed indoor ultrasonic positioning system. In UbiComp 2004: Ubiquitous Computing, Proceedings of the 6th International Conference, Nottingham, UK, 7–10 September 2004.
- Huang, Y.; Tomasic, A.; An, Y.; Garrod, C.; Steinfeld, A. Energy Efficient and Accuracy Aware (E2A2) Location Services via Crowdsourcing. In Proceedings of the 9th IEEE International Conference on Wireless and Mobile Computing, Networking Communications (WiMob 2013), Lyon, France, 7–9 October 2013.
- Papapostolou, A.; Chaouchi, H. RFID-assisted indoor localization and the impact of interference on its performance. J. Netw. Comput. Appl. 2011, 34, 902–913. [Google Scholar] [CrossRef]
- Kasamatsu, D.; Shinomiya, N. Implementation and Evaluation of Emulator for Testing Service Programs in MANET. In Proceedings of the IEEE 24th International Conference on Advanced Information Networking and Applications Workshops (PAEWN2010), Perth, Australia, 20–23 April 2010; pp. 496–501.
- Tobu Hope Center. Available online: http://www.tobu-hope.co.jp/ (accessed on 12 December 2012).
© 2015 by the authors; licensee MDPI, Basel, Switzerland. This article is an open access article distributed under the terms and conditions of the Creative Commons Attribution license (http://creativecommons.org/licenses/by/4.0/).