Abstract
Most source code plagiarism detection tools only rely on source code similarity to indicate plagiarism. This can be an issue since not all source code pairs with high similarity are plagiarism. Moreover, the culprits (i.e., the ones who plagiarise) cannot be differentiated from the victims even though they need to be educated further on different ways. This paper proposes a mechanism to generate hints for investigating source code plagiarism and identifying the culprits on in-class individual programming assessment. The hints are collected from the culprits’ copying behaviour during the assessment. According to our evaluation, the hints from source code creation process and seating position are 76.88% and at least 80.87% accurate for indicating plagiarism. Further, the hints from source code creation process can be helpful for indicating the culprits as the culprits’ codes have at least one of our predefined conditions for the copying behaviour.
1. Introduction
Plagiarism occurs when a piece of work is reused with an inadequate acknowledgement toward the original author(s) [1]. It is an emerging issue in academia. To illustrate this, according to an article from The Guardian [2], the number of UK students who cheat in academia is increased by 40% in three year span; where more than half of them are related to plagiarism.
The issue becomes more complex in computing education as the assessments cover source code (i.e., electronic text created for programming) in addition to human-language text [3]. Source code plagiarism is similar to the human-language text plagiarism—which is commonly covered by Turnitin [4]—except that its domain is focused on the source code [5].
Several automated tools have been developed to detect source code plagiarism [6]. However, most of them only enlist plagiarism-suspected cases based on the similarity degree without providing any hints about which cases should be investigated further and who is the real culprit for each plagiarism case. It may consume a lot of examiner’s time and effort since high similarity does not always entail plagiarism [7]. Moreover, the culprits should be differentiated from the victims since they need to be educated in a different way. The former should be taught about academic integrity while the latter should be taught to prevent their work being plagiarised.
In this paper, a mechanism for generating those hints on in-class individual programming assessment is proposed. It relies on the culprits’ copying behaviour; where the copied source codes can have some modifications if the culprits plan to obfuscate their illegal act. Cases which should be investigated further can be filtered with the help of source code creation process and seating position. Further, the culprits can be differentiated from the victims based on their unique code creation process (such as waiting their victim to write several source code fragments first).
2. Related Works
Source code plagiarism is an act of reusing a particular code without acknowledging the original author(s) properly [5]. In computing education, this issue becomes more prevalent as the number of weekly-submitted source codes is considerably high and these codes should be compared to each other per assessment. Several detection techniques have been developed to face the issue. Based on how they detect similarity (i.e., a proof for plagiarism), these techniques can be classified into threefold: attribute-based, structure-based, and hybrid technique [8].
Attribute-based technique determines similarity based on source code attributes. The attributes can be either source code characteristics or token fragments. Source code characteristics (such as the number of operands) can be compared based on their occurrence frequencies. Works in [9,10] consider two source codes as similar to each other when these codes’ characteristics share the same occurrence frequencies. Source code token fragments can be compared by adopting techniques from other domains. Works in [11,12,13], for instances, rely on Information Retrieval techniques such as Latent Semantic Indexing [14]. Other examples are works in [15,16] that rely on a clustering technique (where the fragments act as vectors) and a work in [17] that relies on a technique from Information Theory.
Structure-based technique determines similarity based on source code structures. It commonly takes more processing time than the attribute-based technique [6]. However, its result is more aligned to human perspective [18]. Four structures can be used in this technique: source code token sequence, abstract syntax tree, program dependency graph, and low-level token sequence. Source code token sequence [19,20,21] is a sequence of meaningful “words” from source code; it is usually extracted with the help of a programming language parser. Abstract syntax tree [22] is a tree where the nodes are formed from tokens and the edges are formed from programming language grammar. Program dependency graph [23] is a graph connecting several instructions based on their execution dependencies. Low-level token sequence [8,24,25] is similar to source code token sequence except that it is extracted from executable files resulted from compiling the source codes; these files are typically more concise than the source codes.
The similarity of source code or low-level token sequences can be compared using string matching algorithms—such as Running-Karp-Rabin Greedy-String-Tiling [26] or Local Alignment [27]—that have been tuned to deal with token sequences. The similarity of other structures can be compared using domain-specific algorithms (e.g., tree kernel algorithm [28] or graph isomorphism algorithm [29]).
Hybrid technique determines similarity based on both source code characteristics and structures. In other words, it combines attribute-based with structure-based technique. This technique can be classified further to two sub-techniques. Efficiency-oriented hybrid technique assumes that attribute-based technique is more time efficient than the structure-based one [30] even though its result is less effective [6]. It is implemented as a two-layer detection technique where attribute-based technique acts as the initial filter for the input of structure-based technique [6,30]. Efficiency-oriented hybrid technique assumes that both techniques have their own benefits in terms of effectiveness. A work in [31], for instance, shows the results of both techniques at once. Works in [32,33] use the output of structure-based technique as an input (or attribute) for attribute-based technique.
Some of the aforementioned techniques have been applied as automated tools [20,34]. Four examples of them are JPlag, MOSS, Sherlock in [35], and Sherlock in [36]. JPlag [19] is an online tool which focuses on five programming languages (Java, C#, C, C++, and Scheme). It relies on structure-based technique with Greedy-String-Tiling [26] as its baseline similarity algorithm. MOSS (Measure of Software Similarity) [37] is, at some extent, similar to JPlag except that it covers more programming languages and utilises Winnowing algorithm [38] as its similarity measurement. Sherlock in [35] determines the similarity based on source code fingerprints, which are resulted from a hash function. It is different with Sherlock in [36] that compares the codes in threefold, starting from comparing their original forms, original forms without comments and whitespaces, and token sequences.
Most existing detection techniques suspect plagiarism only based on source code similarity. It may leave a lot of works for examiners; they should investigate many code pairs and determine which pairs are considered as plagiarism. As a result, a work in [39] considers saving timestamps and authentication ID for reducing the number of investigated code pairs. Only code pairs which share a high similarity degree and contain suspicious timestamp & ID pattern are investigated.
3. Methodology
This paper proposes a mechanism to generate hints for investigating source code plagiarism and the culprits from the copying behaviour on in-class individual programming assessment. Copying behaviour refers to an act of replicating other students’ work with or without modification (or plagiarism in short). Programming assessment refers to an assessment which solution should be written in the form of source code. In-class individual assessment refers to an assessment given in a physical class room, that should be completed at that time individually. Commonly, the students are seated adjacent to each other due to the room’s space limitation. Further, to mitigate the chance for cheating, at least one examiner is allocated in the room to watch over the students’ behaviour.
On in-class individual programming assessment, a plagiarist (or culprit) can only copy the works of adjacently-seated students. The works of non-adjacently-seated students are out of consideration since they are not easily accessible to the plagiarist and, when the plagiarist insists to do that, the examiner may notice their copying behaviour. Given this condition, the number of source code pairs that should be investigated further can be reduced; only code pairs which authors are adjacently-seated are suggested. In addition, by utilising source code creation process, more code pairs can be excluded from investigation; only code pairs which creation processes contain a copying behaviour are suggested. The source code creation process can also be used to determine who is the plagiarist for each plagiarism-suspected code pair; the plagiarists commonly have several unique code creation patterns.
Source code creation process is recorded by capturing source code contents periodically while the solution is being written. These contents will be submitted at the end of the assessment, along with the solution, and observed by the examiner. It is important to note that this recording mechanism may lead to ethical concern on some regions. In that case, the examiner is advised to collect students’ consent at the beginning of the course.
When compared with [39], our proposed mechanism is specifically tailored for in-class individual programming assessment. With more specific context in mind, our mechanism can generate more hints for investigating source code plagiarism and the plagiarists. Another difference is that our mechanism focuses on source code contents instead of saving timestamps and authentication ID. We believe these contents can provide more hints.
Our proposed mechanism works under two modules: student and examiner module. Student module is a plug-in pre-installed on the student’s programming workspace. It captures source code contents periodically during creation process (for convenient referencing, these contents are referred as source code snapshots in the rest of this paper), and embeds them on the assessment solution’s project along with a seating position ID. Examiner module suggest source code pairs that should be investigated further, including the potential plagiarists, based on hints obtained from the copying behaviour on in-class programming assessment. Figure 1 shows an example of how both modules interact. An examiner module takes source code projects collected from several student modules as its primary inputs.
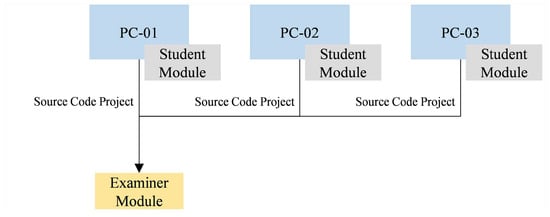
Figure 1.
The interaction between three student modules and an examiner module. The student modules are installed on the students’ programming workspaces (PC-01 to PC-03) while the examiner module collects all source code projects (with their respective source code snapshots and seating position ID) from them.
3.1. Student Module
Student module works as depicted on Figure 2. Two inputs are required in this module: a capturing period (a duration in seconds indicating how frequent the module will capture source code snapshots) and a seating position ID. Both of them are set on the student module before installed on the programming workspace. This module (as a background process) starts capturing source code snapshots periodically once the programming workspace is opened. For memory space efficiency, each of the snapshots will be compressed using Huffman coding algorithm [40] and therefore stored as a file under the project along with its respective timestamp. Upon closing the workspace, the module will merge all snapshots to a single archive for portability purpose; a large number of snapshots will slow down the transfer process between the student and examiner module.
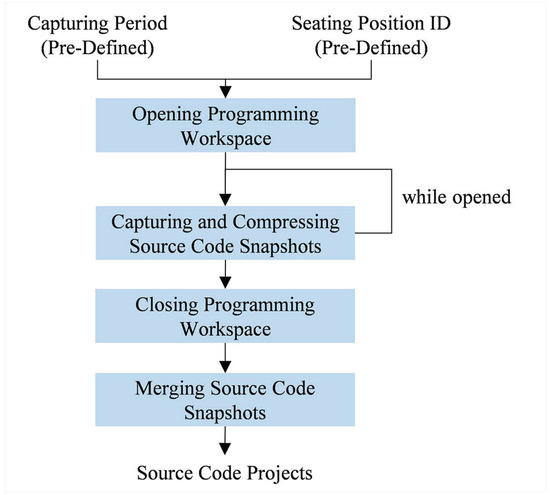
Figure 2.
How student module works as a background process on the programming workspace. Source code snapshots are periodically captured while the workspace is opened. Once the workspace is closed, these snapshots will be merged as an archive.
It is important to note that the source code snapshots are not compressed at once upon closing the workspace to avoid submission delay. The number of snapshots may be high for some assessments (especially those with a long completion time), resulting a considerable amount of time when compressed at once.
3.2. Examiner Module
Figure 3 shows that examiner module works in fourfold with source code projects, a task name, and a seating map as its inputs. At first, the projects’ source codes which correspond to a particular task are selected, with an assumption that these codes share the same file name as the task name. It is true that the assumption is susceptible to incorrectly written file name. However, the occurrence of such misnaming issue can be mitigated by applying a strict penalty (e.g., failing to write the correct file name leads to no grading).
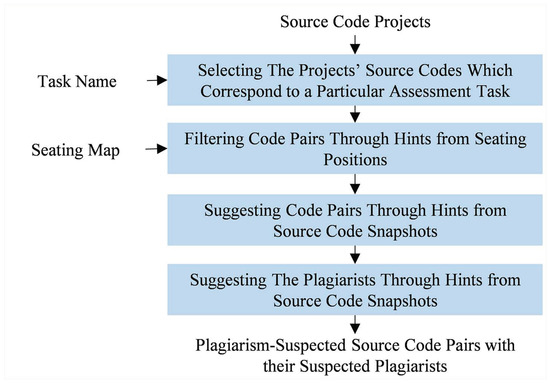
Figure 3.
How examiner module works. Four phases are required, starting from filtering the projects’ source codes which correspond to a particular assessment task to suggesting the plagiarists.
Secondly, for each assessment task, source codes which authors are adjacently seated (either horizontally, vertically, or diagonally) are compared to each other. The adjacency is defined based on a seating map containing all seating position IDs. With adjacency-based comparison in mind, the number of investigated code pairs can be reduced. To illustrate this, if a map with twenty-five seating positions arranged as a 5 × 5 matrix is used, the adjacency-based comparison will only consider 72 code pairs while the naive one (which compares all codes with each other) considers 300 code pairs.
The similarity degree for each code pair is calculated in two phases. It begins by converting the codes to token sequences (where comment and whitespace tokens are removed) with the help of ANTLR [41]. Those sequences are therefore compared using Running-Karp-Rabin Greedy-String-Tiling algorithm (RKRGST) [26] (with 2 as its minimum matching length), and normalised using either average or maximum normalisation [6,19]. Average normalisation is calculated based on (1) where A & B are the token sequences and match(A,B) is the number of matched tokens. Maximum normalisation is calculated based on (2) with similar terminologies as the average one. When compared to each other, average normalisation is sensitive to any changes while maximum normalisation is only sensitive to the shorter sequence.
RKRGST is selected as our similarity algorithm since it has been frequently used in source code plagiarism detection [6]. In fact, it can be replaced with any algorithms that measure the similarity degree between two source code token sequences.
Thirdly, source code pairs which creation processes contain a copying behaviour are indicated and suggested. A copying behaviour occurs when a pair’s codes share many similar snapshots at some periods of time; where the snapshots only differ in terms of capturing timestamp. The confidence degree for the occurrence of copying behaviour is measured in twofold. At first, for each source code, its snapshots are converted to a snapshot sequence. Snapshot sequence refers to an integer sequence which length is the number of the source code snapshots and each element is assigned with a snapshot’s token size that has been divided by 10. Afterwards, the confidence degree between those two snapshot sequences are compared using RKRGST with 2 as its minimum matching length and maximum normalisation as its normalisation technique. All code pairs which confidence degree is higher than 50% are suggested for further investigation.
Figure 4 depicts an example of how the confidence degree is measured. It is worth to note that the division of token size with 10 and the use of maximum normalisation (instead of average normalisation) are implemented to loosen up the matching condition; some differences should be spared as some plagiarists are not able to copy the whole original code at once during in-class individual programming assessment.
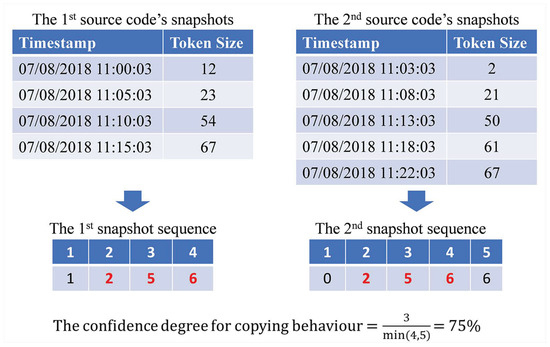
Figure 4.
An example of measuring the confidence degree for the copying behaviour’s occurrence; red size numbers on snapshot sequences refer to matched snapshots (selected with the help of RKRGST). In this case, the confidence degree for those snapshot sequences is 75%.
Fourthly, the plagiarist of each code pair is then indicated and suggested based on their copying behaviour. The plagiarist’ source code snapshots are assumed to meet at least one of three conditions toward the victim’ snapshots. These conditions are: sharing many snapshots, deleting before sharing similar snapshots, and waiting before sharing similar snapshots.
Sharing many snapshots occurs when the plagiarist continuously replicates their victim’s work. When represented as a line chart, an example of this case can be seen on Figure 5. The orange line can be used as a hint claiming that the line’s owner is the plagiarist. Most of the timestamps occur later than the red line’s even though both lines share similar pattern. It is important to note that time difference between those lines may vary.
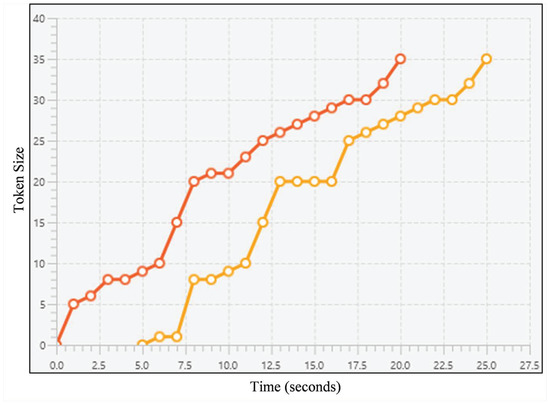
Figure 5.
A line chart representing an example of sharing many snapshots; the lines refer to snapshot sequences for both source codes, horizontal axis refers to the timestamps, and vertical axis refers to the token size. The orange one can be suspected as the plagiarist’ since most of the snapshots occur later than the first one’s while both lines share a similar pattern.
Deleting before sharing similar snapshots occurs when the plagiarist has failed to solve the task by themselves and then replaces their code with the victim’s. Figure 6 shows an example of it, represented as a line chart. The plagiarist can be indicated as the orange line’s owner; the line’s pattern is similar to the red line’s while having several steep reductions (see circled areas) as a result of deleting their code and replace it with their victim’s.
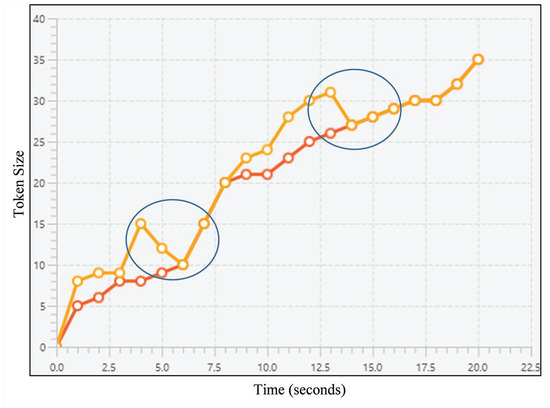
Figure 6.
A line chart representing an example of deleting before sharing snapshots; the lines refer to snapshot sequences for both source codes, horizontal axis refers to the timestamps, and vertical axis refers to the token size. Orange line’s owner is suspected as the plagiarist since the line has several steep reductions (see circled areas) while sharing a similar pattern with the red one.
Waiting before sharing similar snapshots occurs under the same condition as sharing many snapshots except that, in this case, the plagiarist intentionally waits till the victim’s code has been updated a lot prior plagiarising. As seen in Figure 7, orange line’s owner is suspected as the plagiarist since the line has several stagnant patterns (see circled areas) as a result of waiting while sharing similar pattern with the red line.
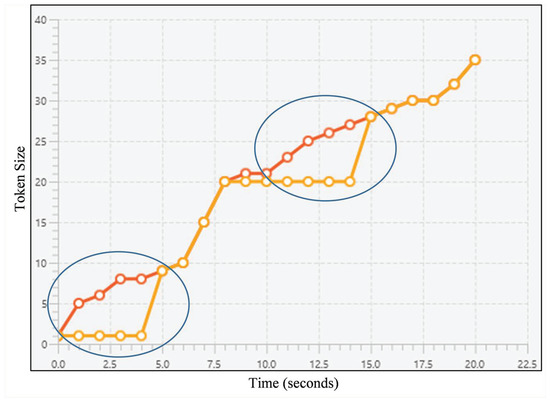
Figure 7.
A line chart representing an example of waiting before sharing snapshots; the lines refer to snapshot sequences for both source codes, horizontal axis refers to the timestamps, and vertical axis refers to the token size. Each circled area depicts a condition where the suspected plagiarist (whose line is orange-colored) waits till their victim (whose line is red-colored) has significantly updated their code.
4. The Proposed Tool
The mechanism for providing hints to investigate source code plagiarism and the plagiarists is implemented on a source code plagiarism detection tool called IC-Plag (In-Class source code Plagiarism detection) This tool’s name can be pronounced similar to “I See Plag”, which corresponds to its aim to see any plagiarism cases. IC-Plag is designed for Java programming assessments and Eclipse programming workspace (https://www.eclipse.org/). The student module acts as an Eclipse plugin while the examiner module acts as a standalone desktop application. Both modules are connected through NetSupport class room management tool (https://www.netsupportsoftware.com/complete-classroom-management/). With NetSupport, each collected source code project will be automatically labeled with a seating position ID, stored as the NetSupport-generated directory’s name.
4.1. Student Module
Considering seating position ID is handled by NetSupport, capturing period is the only thing that need to be set on the student module. It is set statically on the module’s development codes.
Each source code snapshot is stored as a text file with “.dat” as its file extension; default source code file extension is avoided to make the file inaccessible from many applications. The file is then named based on its capturing time (DD-MM-YYYY HH:MM:SS) and stored under a directory named “data”. Upon closing the workspace, all snapshot files will be archived as a Java archive (JAR) file.
4.2. Examiner Module
Figure 8 shows IC-Plag’s examiner module. The inputs can be given on the left panel while the outputs are shown on the right panel.
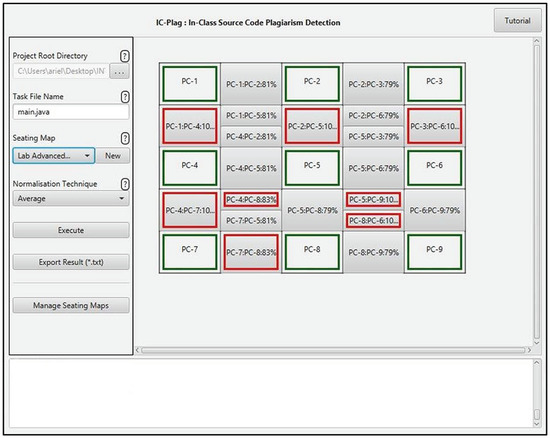
Figure 8.
The layout of IC-Plag’s examiner module. All inputs are given on the left panel while the outputs can be seen on the right one.
Four inputs are required in this module: a project root directory path, a task (file) name, a seating position map, and a normalisation technique. The project root directory is a directory containing all source code projects collected through NetSupport. Each project is located under a NetSupport-generated directory, named with a seating position ID. Figure 9 shows a sample of the structure.
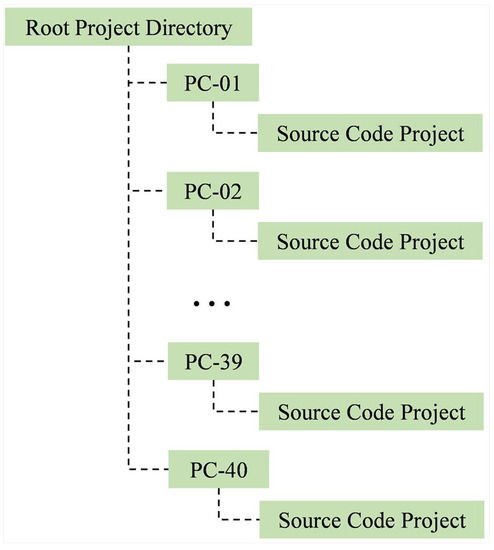
Figure 9.
An example of the directory structure generated by NetSupport. Each project is located under a directory named with a seating position ID.
As seen on Figure 10, seating position map is represented as a Comma Separated Value (CSV) where each working space is labeled with a NetSupport-defined ID, and each empty space is labeled with “PC-00”. Since some assessments are usually given on the same class room for the whole semester, IC-Plag stores all previously-inputted maps, which can be reused directly through a combobox provided on the input panel (see Figure 8). If the examiner wants to manage these maps, they can access “manage seating maps” button located at the bottom of the input panel. It will show a panel displaying all previously-inputted maps where the examiner can manage them (as seen in Figure 11).
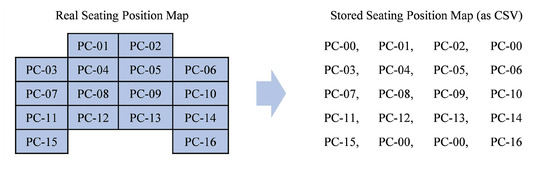
Figure 10.
How seating position map is stored as a CSV file. Each empty space is labeled with “PC-00”.
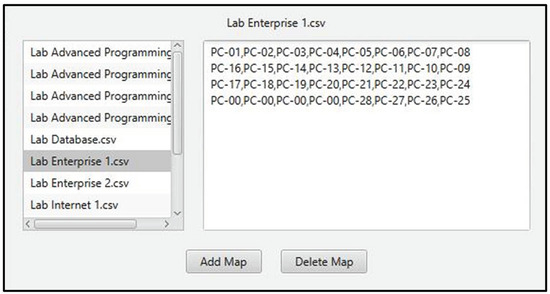
Figure 11.
The layout for managing previously-inputted seating maps. The right panel will display selected map’s content in CSV format.
Two options are available for normalisation technique: maximum and average normalisation. Maximum normalisation can be used when most plagiarised codes are the subset of their original (or vice versa). Average normalisation can be used when each modification should affect the resulted similarity degree.
As seen on Figure 8, the output is displayed in a layout similar to the selected seating position map. Comparison buttons are placed between adjacent positions; these buttons will be bordered with a red line if their involved codes are indicated to have a copying behaviour.
For each adjacent code pair, a suggestion about the plagiarist can be accessed by clicking the comparison button. It will display a line graph (see Figure 12) where the lines refer to the codes’ snapshot sequences. If two snapshots are required to be investigated further, their points on the graph can be selected and “compare selected snapshots” button can be pressed. It will display those snapshots with TortoiseSVN (https://tortoisesvn.net/), a tool for comparing two versions of a text file. In our context, those two versions correspond to two snapshots.
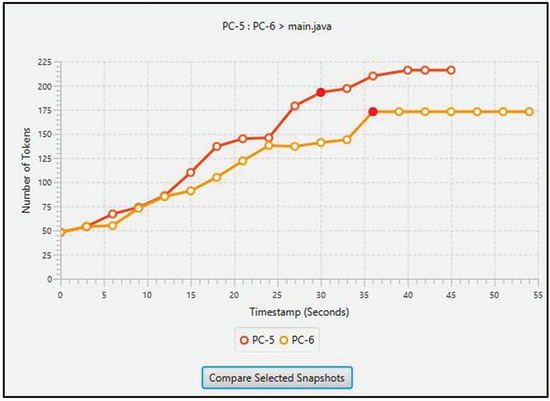
Figure 12.
The layout for displaying a line graph comparing two source code snapshot sequences. The graph is displayed in a similar manner as proposed in methodology. Two highlighted red points refer to selected snapshots for further investigation.
At the bottom of IC-Plag’s layout (see Figure 8), a textarea is provided to display any information related to IC-Plag’s current process. For example, it can enlist several error messages when the inputs are not properly given.
For examiners who are new to IC-Plag, they can learn how the tool works with a tutorial. The tutorial can be accessed by clicking “Tutorial” button at the top-right of IC-Plag (see Figure 8). It is represented as a pop-up panel explaining each process in a more elaborate way.
Two important remarks about IC-Plag should be considered. First, since students’ source code projects are mapped to a seating position map, observing the hints may become more demanding as more students’ projects and seating positions are involved. Hence, IC-Plag is recommended to be used when the number of students’ projects and seating positions are limited. From our experience, up to 40 projects or seating positions are acceptable. Second, suggesting the plagiarists may take a considerable amount of time when the number of snapshots is considerably high. Therefore, the duration for capturing the snapshots should not be set too low. From our experience, three or five seconds is acceptable.
5. Evaluation
Our proposed mechanism was primarily evaluated toward two aspects: the accuracy of source code creation process & seating position to indicate plagiarism-suspected source code pairs, and the accuracy of source code creation process to indicate the potential plagiarists.
In addition to those, four supplementary aspects were also considered: the reduced number of code pairs for adjacency-based comparison, the effectiveness of Huffman coding algorithm to compress source code snapshots, the applicability of IC-Plag, and the performance comparison between the plagiarists & the victims.
Evaluating the accuracy of seating position to indicate plagiarism-suspected source code pairs requires some findings from evaluating the reduced number of code pairs for adjacency-based comparison. Consequently, the latter evaluation will be discussed first.
5.1. Data Collection Scenario
In order to evaluate the aforementioned aspects, two scenarios were performed. The first scenario collected seating position maps from real class rooms. These maps were then used to evaluate the accuracy of seating position for indicating plagiarism-suspected source code pairs and the reduced number of code pairs for adjacency-based comparison. The scenario was conducted by mapping all class rooms (i.e., computer laboratories) in our faculty. In total, there were twelve class rooms with 28 to 41 seating positions each.
The second scenario involved sixteen participants: eight examiners (i.e., teaching assistants), four fast-paced students, and four slow-paced students. It collected source code projects (with their snapshots) and questionnaire survey results for evaluating remaining aspects. Despite their small number, the participants can generate 64 source codes, 480 code pairs (with naive comparison) and about 57,600 source code snapshots per hour (if the capturing period is one second). We would argue those numbers are sufficient for evaluation. It is important to note that both fast- and slow-paced students are involved so that our results may depict the real condition of in-class individual programming assessment.
The second scenario was conducted by following a diagram displayed on Figure 13. At first, two programming assessments were made by the first author of this paper. These assessments are related to Introductory Programming materials where each of them contains one easy task and one challenging task.
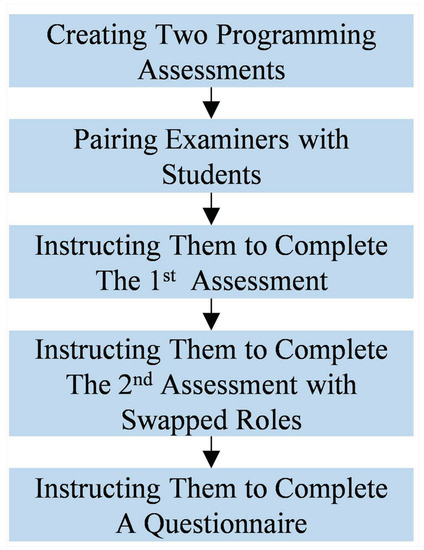
Figure 13.
Collecting evaluation data involving examiners and students. It has five phases, starting from creating two programming assessments to instructing the examiners and students to complete a questionnaire.
Secondly, each examiner was paired with one student (either fast- or slow-paced one). The examiners would act as the victims while the students would act as the plagiarists. These participants were then instructed to sit under a predefined seating position map (see Figure 14).
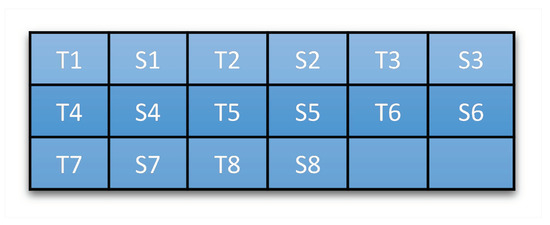
Figure 14.
Participants’ seating position map. Each examiner (either T1–T8) sits right beside one student (either S1–S8).
Thirdly, the participants were asked to complete the 1st assessment in 30 min. On completing that assessment, they should use Eclipse (where our student module—with one second as its capturing period—has been installed). Further, they were instructed to act like they are completing a real in-class individual programming assessment to get realistic source code snapshots; the plagiarists should plagiarise secretly while the victims should try to protect their codes from plagiarism if the plagiarists act suspiciously. To assure the plagiarists would plagiarise, they were not given any information related to the assessment’s tasks; they could only complete their assessment by plagiarising their victim’ work.
Fourthly, these participants were then asked to complete the 2nd programming assessment. It works in similar manner as the 1st assessment except that their roles are swapped. The examiners would act as the plagiarists while the students would act as the victims. This phase assures that each participant (either an examiner or a student) experiences two different roles in our evaluation.
Fifthly, the participants were instructed to complete a questionnaire containing twelve questions. The questionnaire collected the participants’ perspectives toward IC-Plag. In addition, it also collected their perspectives about what kinds of attempts they know for either plagiarising their friend’s code or protecting their code from plagiarism on an in-class individual programming assessment.
5.2. The Reduced Number of Code Pairs for Adjacency-Based Comparison
Adjacency-based comparison aims to reduce the number of code pairs. This subsection evaluates such impact using twelve seating position maps from our evaluation data. The reduction is resulted from ; where AC is the number of code pairs for adjacency-based comparison and NC is the number of code pairs for naive comparison (that compares all codes with each other).
As seen on Table 1 (where N refers to the number of seating positions), three findings can be deducted. First, adjacency-based comparison considers fewer code pairs than naive comparison. In average, it eliminates about 80.87% code pairs. Second, the number of code pairs for adjacency-based comparison varies based on given seating position map; C10 and C12, for example, yield different numbers of code pairs since several positions on C12 have fewer neighbours. Third, the number of code pairs for naive comparison can be calculated as since it is defined from 1 + 2 + 3 + 4 … + (N − 1).

Table 1.
The number of code pairs per class room.
5.3. The Accuracy of Source Code Creation Process & Seating Position to Indicate Plagiarism-Suspected Source Code Pairs
The accuracy of source code creation process (which captures the plagiarist’ copying behaviour from source code snapshot sequences) is defined as the proportion between the number of correctly-indicated code pairs and total code pairs when adjacency-based comparison is used. According to the seating position map given in Figure 14, there are 160 code pairs in total since there are four tasks taken from two assessments and each task results in 40 code pairs.
Figure 15 depicts that the source code creation process is 70% to 80% accurate for indicating plagiarism-suspected source code pairs. In average, it leads to 76.88% accuracy, which is a considerably high accuracy.
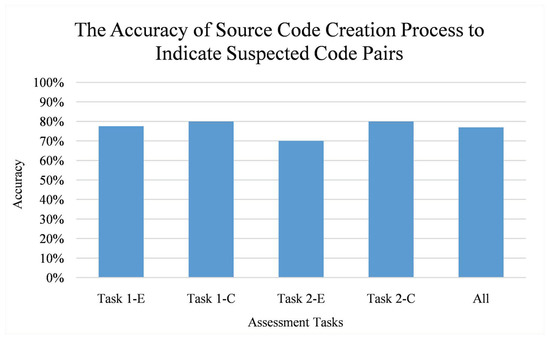
Figure 15.
The accuracy of source code creation process to indicate plagiarism-suspected code pairs. Vertical axis refers to the accuracy while horizontal axis refers to the assessment tasks. Each task is labeled as “Task X-Y” where X refers to an assessment ID and Y refers to a task type (E for easy and C for challenging).
Since the plagiarists and the victims are assumed to be adjacently seated on in-class assessment, the minimum accuracy of seating position can be defined as the reduced proportion of code pairs for adjacency-based comparison; all code pairs which authors are not adjacently-seated are considered as false results. The proportion is calculated as where AC and NC are the number of code pairs for adjacency-based and naive comparison respectively. For our evaluation data, the maps from real class rooms are considered.
As seen in Figure 16, the minimum accuracy varies among class rooms. Further observation shows that such accuracy is affected by how the students are seated. In average, seating position can be used to indicate suspected code pairs with at least 80.87% accuracy.
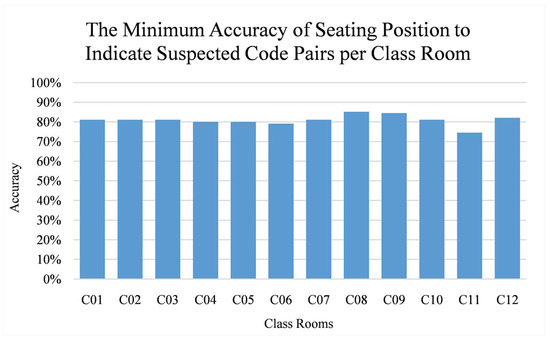
Figure 16.
The minimum accuracy of seating position to indicate plagiarism-suspected code pairs per class room. Vertical axis refers to the accuracy while horizontal axis refers to the class rooms.
5.4. The Accuracy of Source Code Creation Process to Indicate the Potential Plagiarists
From our evaluation data, for each plagiarist-victim pair per assessment task, the plagiarist’ snapshot sequence (which was recorded from the source code creation process) was observed by the second author of this paper. He checked whether at least one of the three copying behaviour’ conditions (sharing many snapshots, deleting before sharing similar snapshots, and waiting before sharing similar snapshots) occurs. In total, there are thirty-two observed source code pairs since each task contributes eight pairs.
As seen in Figure 17, sharing many snapshots (condition-1) occurs more frequently than other conditions. This finding is natural since some plagiarists want to get the highest possible score by keeping their code updated with the latest version of their victim’s. Deleting and waiting before sharing similar snapshots (condition-2 and condition-3) occur in a less frequent way.
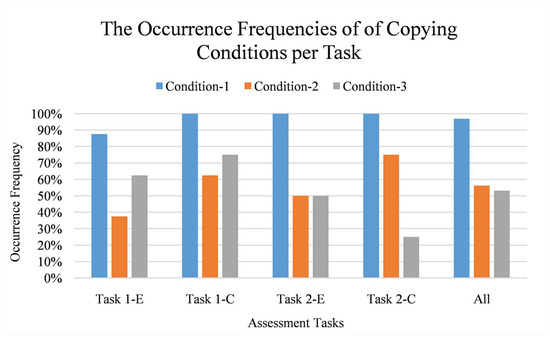
Figure 17.
The occurrence frequencies of copying conditions. Vertical axis refers to the normalised frequency (in percentage) while horizontal axis refers to the copying conditions per task. Condition-1 is sharing many snapshots; condition-2 is deleting before sharing similar snapshots; and condition-3 is waiting before sharing similar snapshots. Each task is labeled as “Task X-Y” where X refers to an assessment ID and Y refers to a task type (E for easy and C for challenging).
All code pairs have at least one of the conditions. Eighteen of them have two conditions and eight of them have all conditions. Hence, it can be stated that the source code creation process is considerably accurate for indicating the potential plagiarists; our predefined copying conditions do occur on the plagiarists’ snapshot sequences.
5.5. The Effectiveness of Huffman Coding Algorithm to Compress Source Code Snapshots
Seven capturing periods are defined for this evaluation: 1, 5, 10, 15, 20, 15, and 30. For each period, only snapshots which fits the period are taken from our evaluation data. When the capturing period is 5, for example, only the snapshots which timestamp difference with the first snapshot is the multiples of 5 are considered.
Table 2 shows that Huffman coding algorithm reduces about 25% total file size regardless of the capturing period; where the reduction is calculated as (R refers to the file size before compression and C refers to that size after compression). Further, higher capturing period leads to smaller total file size. We would argue that setting the capturing period with 10 or 15 is acceptable since the total compressed file size is still under 3 MB (which is feasible to be collected through NetSupport for 16 participants).
Table 2.
The total file size per capturing period.
5.6. The Applicability of IC-Plag
This subsection evaluated the applicability of IC-Plag with a blackbox testing and questionnaire survey. The blackbox testing was performed by the first author of this paper. Three functionalities from IC-Plag’s student module and nine functionalities from IC-Plag’s examiner modules were checked. The testing showed that all functionalities work as expected.
A questionnaire survey was conducted at the end of data collection scenario. Twelve questions were proposed; ten of them (Q01–Q10) asked the participants’ agreement while the others (Q11 and Q12) asked about what attempts they know for either plagiarising their friend’s code or protecting their code from plagiarism on in-class individual programming assessment. Prior answering the questions, IC-Plag’s functionalities would be demonstrated first to mitigate biased perspectives.
The first ten questions should be answered with 5-points Likert scale (1 = strongly disagree, 2 = disagree, 3 = neutral, 4 = agree, and 5 = strongly agree). For each question, that scale represents the participant’s agreement toward a statement related to IC-Plag. These statements are:
- Q01: Programming workspace is convenient to use even though the student module is installed.
- Q02: Source code snapshots are collected without letting the student aware about it.
- Q03: The existence of the student module is unseen by the student.
- Q04: Compressing source code snapshots and merging them as a JAR file enables the snapshots to be transferred faster through NetSupport.
- Q05: The examiner module is easy to use.
- Q06: Adjacency-based comparison fastens the investigation of source code plagiarism.
- Q07: Adjacency-based comparison mitigates the number of false results.
- Q08: The examiner module’s output panel is illustrative as it displays the source codes based on their authors’ seating positions.
- Q09: Considering source code creation process mitigates the number of false results.
- Q10: Snapshot sequence line chart display helps examiner to collect hints indicating the plagiarist.
As seen on Figure 18, all statements are responded positively by the participants. The minimum average score for these statements (which is 3.5625 on Q01) is still higher than the threshold for neutrality (which is 3).
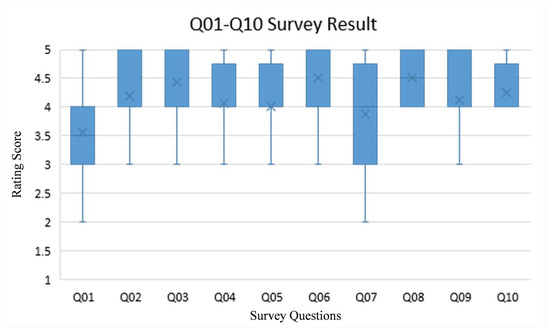
Figure 18.
Q01 to Q10 survey results. In general, all statements are responded positively; their average score is higher than 3 (neutral threshold).
Q01 yields the lowest average score (3.5625 of 5) with the highest standard deviation (0.963). Further observation shows that several participants are not used with Eclipse (our programming workspace for evaluation). They prefer NetBeans as their programming workspace. Q06 and Q08, on the contrary, yield the highest average score (which is 4.5 of 5). Both of them are related to the use of seating position for investigating source code plagiarism. Hence, it can be stated that the impact of such position is the most salient for the participants. Q10 leads the lowest standard deviation (0.447) with 4.25 average score. It can be therefore stated that the participants consistently agree toward the impact of snapshot sequence line chart display.
According to the participants, three ways for plagiarising are commonly used: seeing other students’ laptop/PC screens that are faced to them, taking a photo of another student’ laptop/PC screen, and collusion (two or more students agree to complete their individual work as a group). Since all of them can only be done when the plagiarist is located nearby with their victim, we would argue that seating position can be beneficial to provide hints about source code plagiarism.
To prevent their codes plagiarised, the participants enlisted three techniques: minimizing source code editor’s font, closing the source code editor once the assessment has been completed, and assuring that their laptop/PC screen cannot be seen by others. Even though these techniques may be considerably effective, it may put some inconvenience to the students as they cannot complete their work freely.
5.7. The Performance Comparison between the Plagiarists & the Victims
This section aims to check whether the plagiarists can get similar score as their victims as a result of plagiarising. To do so, for each plagiarist-victim pair, their source codes were assessed by the first author of this paper and the resulted scores are compared to each other.
As seen on Figure 19, the plagiarists achieved lower average score than the victims on most tasks; in average, it is 20.34 points lower. Hence, it can be stated that it may be rare for the plagiarists to have similar performance as the victims. However, the score gap can become smaller when the original code is either simple or has a high proportion of alphanumeric tokens. Task 2-E is an example case of it; there is no score differences since all plagiarists have successfully copied their victim’s work.
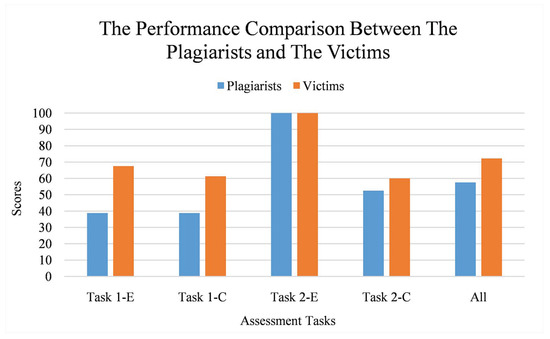
Figure 19.
The performance comparison between the plagiarists and the victims per assessment task. Vertical axis refers to the scores while horizontal axis refers to the assessment tasks. Each task is labeled as “Task X-Y” where X refers to an assessment ID and Y refers to a task type (E for easy and C for challenging).
6. Conclusions and Future Work
This paper proposes a mechanism to generate hints for investigating source code plagiarism and identifying the plagiarists on in-class individual programming assessment; the hints are collected from the copying behaviour. That mechanism is applied on a plagiarism detection tool called IC-Plag.
According to our evaluation, six findings are concluded. Firstly, adjacency-based comparison can reduce the number of investigated code pairs by 80.87%. Secondly, source code creation process and seating position can be used to suggest plagiarism-suspected code pairs; they lead to 76.88% and at least 80.87% accuracy respectively. Thirdly, copying behaviour’ conditions taken from source code creation process can be helpful in terms of determining the plagiarists; all plagiarists’ codes on our evaluation have at least one of the conditions. Fourthly, Huffman coding algorithm can reduce about 25% total file size of the source code snapshots. Fifthly, IC-Plag may be applicable based on blackbox testing and user perspective. Lastly, in most occasions, the plagiarist always performs worse than the victim; their performance is only comparable when the victim’s code is either simple or has a high proportion of alphanumerics.
For future work, four directions are planned. Firstly, a web service can be introduced as a replacement of NetSupport for collecting the snapshots. In such manner, the snapshots can be sent periodically while the student is completing their programming assessment. Secondly, more-advanced similarity algorithms—such as the one which considers term importance or excludes boilerplate (or template) codes—can be implemented on IC-Plag for higher detection accuracy. Thirdly, for re-usability purpose, IC-Plag can be designed as a framework where some of its modules (e.g., similarity algorithm module) can be updated based on the examiner’s need. Fourthly, source code snapshots can be recorded with an existing versioning system—such as the one provided by GitHub (https://github.com/)—to enable more effective and efficient storage system.
Author Contributions
Conceptualization, A.E.B. and O.K.; Methodology, A.E.B. and O.K.; Software, A.E.B.; Writing—original draft, O.K.; Writing—review & editing, O.K.
Funding
The APC was funded by Maranatha Christian University, Indonesia.
Conflicts of Interest
The authors declare no conflict of interest.
References
- Gullifer, J.; Tyson, G. Who has read the policy on plagiarism? Unpacking students’ understanding of plagiarism. Stud. Higher Educ. 2014, 39, 1202–1218. [Google Scholar] [CrossRef]
- Marsh, S. Cheating at UK’s Top Universities Soars by 40%. Available online: https://www.theguardian.com/education/2018/apr/29/cheating-at-top-uk-universities-soars-by-30-per-cent (accessed on 27 January 2019).
- Simon; Cook, B.; Sheard, J.; Carbone, A.; Johnson, C. Academic integrity perceptions regarding computing assessments and essays. In Proceedings of the Tenth Annual Conference on International Computing Education Research—ICER ‘14, Glasgow, UK, 11–13 August 2014; ACM Press: New York, NY, USA, 2014; pp. 107–114. [Google Scholar] [CrossRef]
- Dahl, S. Turnitin® The student perspective on using plagiarism detection software. Act. Learn. Higher Educ. 2007, 8, 173–191. [Google Scholar] [CrossRef]
- Cosma, G.; Joy, M. Towards a Definition of Source-Code Plagiarism. IEEE Trans. Educ. 2008, 51, 195–200. [Google Scholar] [CrossRef]
- Sulistiani, L.; Karnalim, O. ES-Plag: Efficient and sensitive source code plagiarism detection tool for academic environment. Comput. Appl. Eng. Educ. 2018. [Google Scholar] [CrossRef]
- Yang, F.P.; Jiau, H.C.; Ssu, K.F. Beyond plagiarism: An active learning method to analyze causes behind code-similarity. Comput. Edu. 2014, 70, 161–172. [Google Scholar] [CrossRef]
- Karnalim, O. A Low-Level Structure-based Approach for Detecting Source Code Plagiarism. IAENG Int. J. Comput. Sci. 2017, 44, 501–522. [Google Scholar]
- Ottenstein, K.J. An algorithmic approach to the detection and prevention of plagiarism. ACM SIGCSE Bull. 1976, 8, 30–41. [Google Scholar] [CrossRef]
- Faidhi, J.A.W.; Robinson, S.K. An empirical approach for detecting program similarity and plagiarism within a university programming environment. Comput. Educ. 1987, 11, 11–19. [Google Scholar] [CrossRef]
- Ganguly, D.; Jones, G.J.F.; Ramírez-de-la Cruz, A.; Ramírez-de-la Rosa, G.; Villatoro-Tello, E. Retrieving and classifying instances of source code plagiarism. Inf. Retr. J. 2018, 21, 1–23. [Google Scholar] [CrossRef]
- Ullah, F.; Wang, J.; Farhan, M.; Jabbar, S.; Wu, Z.; Khalid, S. Plagiarism detection in students’ programming assignments based on semantics: Multimedia e-learning based smart assessment methodology. Multimed. Tools Appl. 2018, 1–18. [Google Scholar] [CrossRef]
- Cosma, G.; Joy, M. An Approach to Source-Code Plagiarism Detection and Investigation Using Latent Semantic Analysis. IEEE Trans. Comput. 2012, 61, 379–394. [Google Scholar] [CrossRef]
- Kontostathis, A.; Pottenger, W.M. A framework for understanding Latent Semantic Indexing (LSI) performance. Inf. Process. Manag. 2006, 42, 56–73. [Google Scholar] [CrossRef]
- Moussiades, L.; Vakali, A. PDetect: A Clustering Approach for Detecting Plagiarism in Source Code Datasets. Comput. J. 2005, 48, 651–661. [Google Scholar] [CrossRef]
- Ohmann, T.; Rahal, I. Efficient clustering-based source code plagiarism detection using PIY. Knowl. Inf. Syst. 2015, 43, 445–472. [Google Scholar] [CrossRef]
- Chen, X.; Francia, B.; Li, M.; McKinnon, B.; Seker, A. Shared Information and Program Plagiarism Detection. IEEE Trans. Inf. Theory 2004, 50, 1545–1551. [Google Scholar] [CrossRef]
- Karnalim, O.; Sulistiani, L. Which Source Code Plagiarism Detection Approach is More Humane? In Proceedings of the 9th International Conference on Awareness Science and Technology, Fukuoka, Japan, 19–21 September 2018. [Google Scholar]
- Prechelt, L.; Malpohl, G.; Philippsen, M. Finding Plagiarisms among a Set of Programs with JPlag. J. Univers. Comput. Sci. 2002, 8, 1016–1038. [Google Scholar]
- Franca, A.B.; Maciel, D.L.; Soares, J.M.; Barroso, G.C. Sherlock N-overlap: Invasive normalization and overlap coefficient for the similarity analysis between source code. IEEE Trans. Comput. 2018. [Google Scholar] [CrossRef]
- Kustanto, C.; Liem, I. Automatic Source Code Plagiarism Detection. In Proceedings of the 2009 10th ACIS International Conference on Software Engineering, Artificial Intelligences, Networking and Parallel/Distributed Computing, Daegu, Korea, 27–29 May 2009; pp. 481–486. [Google Scholar] [CrossRef]
- Fu, D.; Xu, Y.; Yu, H.; Yang, B. WASTK: A Weighted Abstract Syntax Tree Kernel Method for Source Code Plagiarism Detection. Sci. Programm. 2017, 2017, 1–8. [Google Scholar] [CrossRef]
- Liu, C.; Chen, C.; Han, J.; Yu, P.S. GPLAG: detection of software plagiarism by program dependence graph analysis. In Proceedings of the 12th ACM SIGKDD International Conference on Knowledge Discovery and Data Mining—KDD ‘06, Philadelphia, Pennsylvania, 20–23 August 2006; ACM Press: New York, NY, USA, 2006; p. 872. [Google Scholar] [CrossRef]
- Rabbani, F.S.; Karnalim, O. Detecting Source Code Plagiarism on .NET Programming Languages using Low-level Representation and Adaptive Local Alignment. J. Inform. Organ. Sci. 2017, 41, 105–123. [Google Scholar] [CrossRef]
- Karnalim, O. IR-based technique for linearizing abstract method invocation in plagiarism-suspected source code pair. J. King Saud Univ. Comput. Inf. Sci. 2018. [Google Scholar] [CrossRef]
- Wise, M.J. Neweyes: A System for Comparing Biological Sequences Using the Running Karp-Rabin Greedy String-Tiling Algorithm. In Proceedings of the International Conference on Intelligent Systems for Molecular Biology, AAAI, Cambridge, UK, 16–19 July 1995. [Google Scholar]
- Smith, T.F.; Waterman, M.S. Identification of common molecular subsequences. J. Mol. Biol. 1981, 147, 195–197. [Google Scholar] [CrossRef]
- Collins, M.; Duffy, N. Convolution Kernels for Natural Language. In Proceedings of the 15th Annual Neural Information Processing Systems Conference (NIPS ‘01), Vancouver, BC, CA, 3–8 December 2001. [Google Scholar]
- Hoffman, C. Group-Theoretic Algorithms and Graph Isomorphism; Springer Verlag: Berlin, Germany, 1982. [Google Scholar]
- Burrows, S.; Tahaghoghi, S.M.M.; Zobel, J. Efficient plagiarism detection for large code repositories. Softw. Pract. Exp. 2007, 37, 151–175. [Google Scholar] [CrossRef]
- El Bachir Menai, M.; Al-Hassoun, N.S. Similarity detection in Java programming assignments. In Proceedings of the 2010 5th International Conference on Computer Science & Education, Hefei, China, 24–27 August 2010; pp. 356–361. [Google Scholar] [CrossRef]
- Engels, S.; Lakshmanan, V.; Craig, M.; Engels, S.; Lakshmanan, V.; Craig, M. Plagiarism detection using feature-based neural networks. ACM SIGCSE Bull. 2007, 39, 34. [Google Scholar] [CrossRef]
- Poon, J.Y.; Sugiyama, K.; Tan, Y.F.; Kan, M.Y. Instructor-centric source code plagiarism detection and plagiarism corpus. In Proceedings of the 17th ACM Annual Conference on Innovation and Technology in Computer Science Education—ITiCSE ’12, Haifa, Israel, 3–5 July 2012; ACM Press: New York, NY, USA, 2012; p. 122. [Google Scholar] [CrossRef]
- Combéfis, S.; Schils, A. Automatic programming error class identification with code plagiarism-based clustering. In Proceedings of the 2nd International Code Hunt Workshop on Educational Software Engineering—CHESE 2016, Seattle, WA, USA, 14 November 2016; ACM Press: New York, NY, USA, 2016; pp. 1–6. [Google Scholar] [CrossRef]
- Zakova, K.; Pistej, J.; Bistak, P. Online tool for student’s source code plagiarism detection. In Proceedings of the 2013 IEEE 11th International Conference on Emerging eLearning Technologies and Applications (ICETA), Stary Smokovec, Slovakia, 24–25 October 2013; pp. 415–419. [Google Scholar] [CrossRef]
- Joy, M.; Luck, M. Plagiarism in programming assignments. IEEE Trans. Edu. 1999, 42, 129–133. [Google Scholar] [CrossRef]
- Mozgovoy, M. Desktop Tools for Offline Plagiarism Detection in Computer Programs. Inf. Edu. 2006, 5, 97–112. [Google Scholar]
- Schleimer, S.; Wilkerson, D.S.; Aiken, A. Winnowing: Local algorithms for document fingerprinting. In Proceedings of the 2003 ACM SIGMOD International Conference on on Management of Data—SIGMOD ‘03, San Diego, CA, USA, 9–12 June 2003; ACM Press: New York, NY, USA; p. 76. [Google Scholar] [CrossRef]
- Vamplew, P.; Dermoudy, J. An anti-plagiarism editor for software development courses. In Proceedings of the 7th Australasian Conference on Computing Education, Newcastle, NSW, Australia, January/February 2005; ACM: New York, NY, USA, 2010; pp. 83–90. [Google Scholar]
- Sedgewick, R.; Wayne, K. Algorithms, 4th ed.; 2011; p. 955. Available online: https://algs4.cs.princeton.edu/home/ (accessed on 27 January 2019).
- Parr, T. The Definitive ANTLR 4 Reference; Pragmatic Bookshelf: Raleigh, NC, USA, 2013. [Google Scholar]


© 2019 by the authors. Licensee MDPI, Basel, Switzerland. This article is an open access article distributed under the terms and conditions of the Creative Commons Attribution (CC BY) license (http://creativecommons.org/licenses/by/4.0/).