1. Introduction
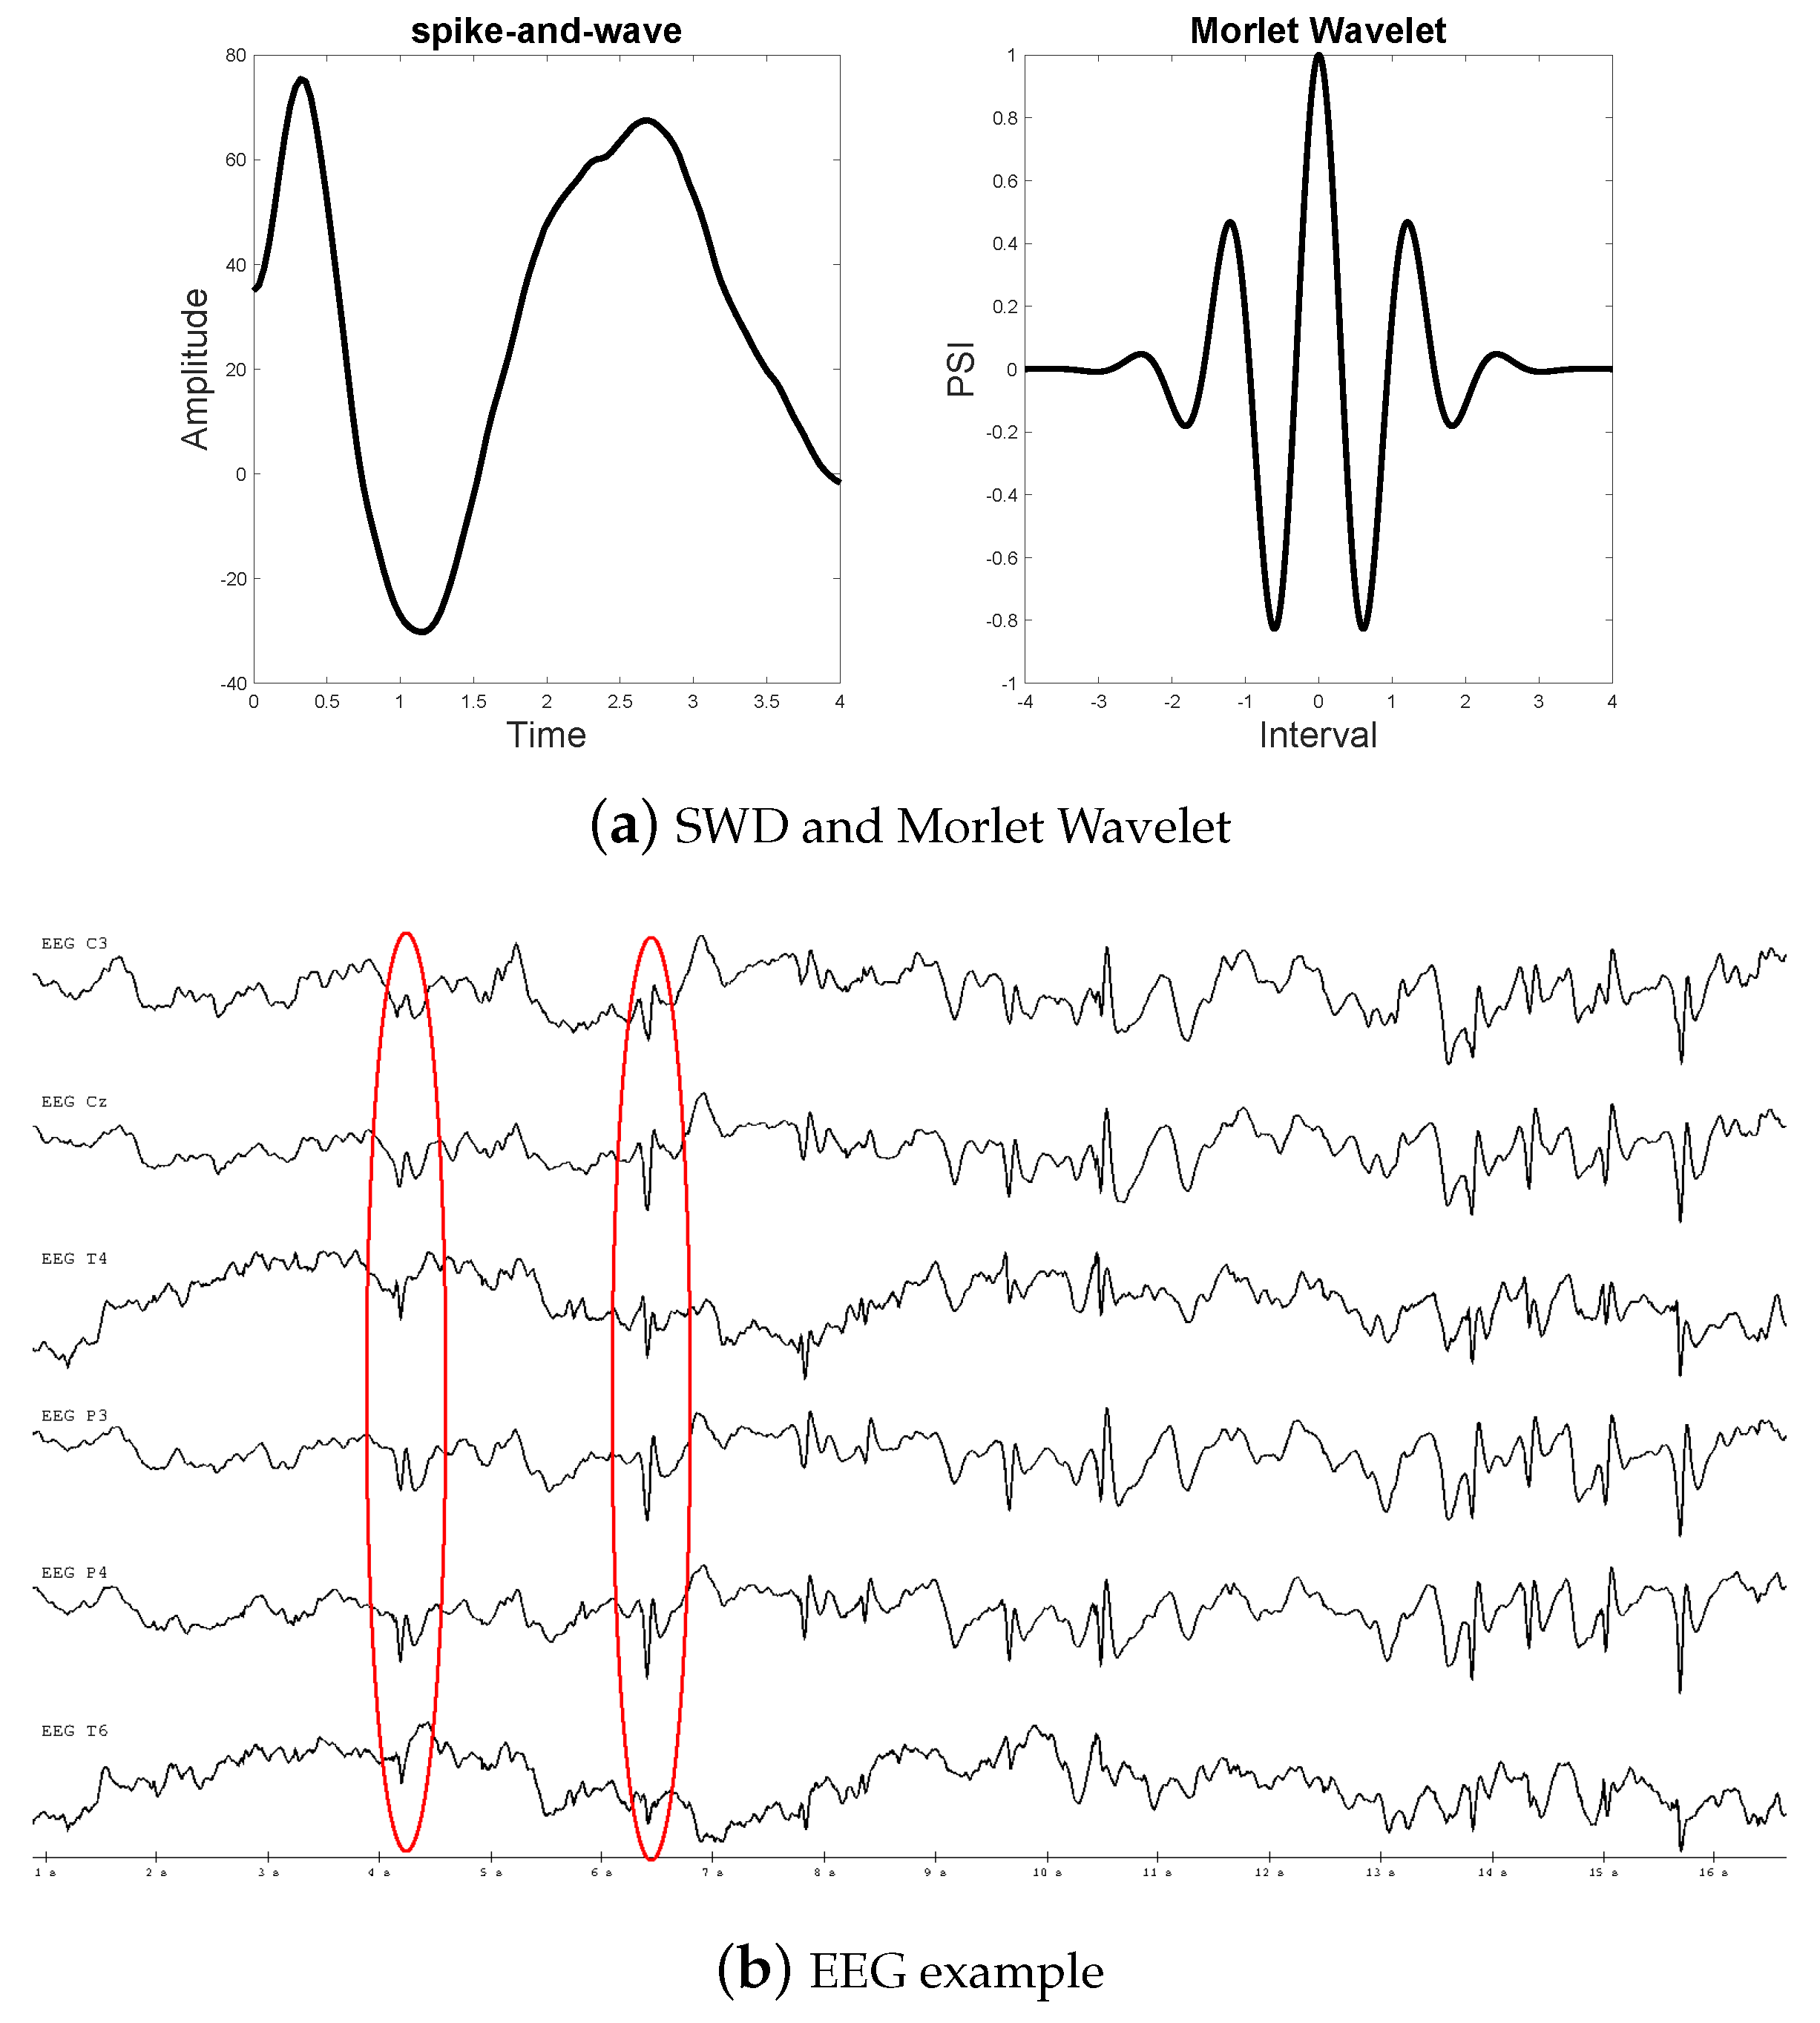
Epilepsy is a chronic neurological disorder that affects patients, causing recurrent seizures. Seizures are characterized by excessive electrical discharges in neurons. Their waveform, known as the spike, is characterized by brief bursts of high amplitude, synchronized and multiphasic activity with several polarity changes [
1]. These are exhibited close to the epileptic focus and stand out from the background EEG activity. Electroencephalography (EEG) is currently the main technique to record electrical activity in the brain. Neurologists, trained in EEG, are able to properly determine an epilepsy diagnosis by analyzing the different types of spikes in the so-called rhythmic activity of the brain.
Existing, automatic methods for detecting epileptic events in EEG signals have performance that greatly exceed visual inspection. These methods focus mostly on interictal spikes [
2,
3], seizure onset detection [
4], or waveform epileptic patterns [
5,
6]. There exists a wide variety of methods to accurately detect seizures and their patterns in EEG. Most of these methods are based on supervised machine learning techniques, such as Support Vector Machine [
7], logistic regression [
8], decision trees [
9],
k-Nearest Neighbor, Random Forest [
10], or discriminant analysis [
11]. They mainly differ according to their feature extraction and classification approaches. A large variety of features are used, including spatio-temporal analysis [
12], spectral–temporal analysis [
13], wavelet decomposition [
2], spectrogram [
14,
15], Hilbert transform [
16], neural networks [
17], Hurst exponent [
18], quadratic linear–parabolic model [
19], and statistical descriptors such as statistical modeling [
20], signal fuzzy entropy [
21], and fractal dimension [
22]. The reader is referred to [
23] for a recent state-of-the-art on methods for seizure detection in EEG.
Spike-and-wave discharge (SWD) is a generalized EEG discharge pattern, where the waveform has a regular and symmetric morphology. This morphology can be mathematically described by a Morlet wavelet transform, generating a time–frequency representation of the EEG signal [
24,
25,
26,
27]. The spike component of an SWD is associated with neuronal firing and the wave component is associated with neuronal inhibition or hyperpolarization of neurons [
28]. SWD is widely used in mice studies [
2,
14,
29,
30]; inversely, the literature reports very limited human applications. Mice have a predisposition for generalized SWD at 7–12 Hz [
15]. Typically, they have spontaneous absence-seizure-like events, but, the presence of an intact cortex, thalamus, and their interconnections are necessary to record their signals [
31,
32]. Rodent models are usually used to study the neurobiological mechanisms underlying SWD in humans. However, studies in humans and rodents differ in the way SWD is assessed and, more importantly, rodents and humans show substantial biological differences. Thus, more human studies are necessary to fully understand this phenomena. This paper fits in this general aim by studying SWD in human.
Some recent works have been proposed to estimate SWD patterns in humans using machine learning techniques. They rely on different models and features, including 1-NN with t-location-scale distribution [
20], decision-trees with cross-correlation coupled with decision trees [
9], and Bayesian classifiers with the Walsh transformation [
33].
Table 1 lists some more methods. Other existing methods implement signal analysis techniques, such as Hilbert–Huang transform to analyze time–frequency energy distribution [
34], complex network of neuronal oscillators to model SWD [
35], analyzing statistical features such as variance, the sum of wave amplitudes, slope of the wave [
36], or topographic cluster analysis based on connectivity, entropy, frequency, power, and spike amplitude [
37]. For a biological dynamic explanation of features and mechanisms generating SWD in the brain see [
38].
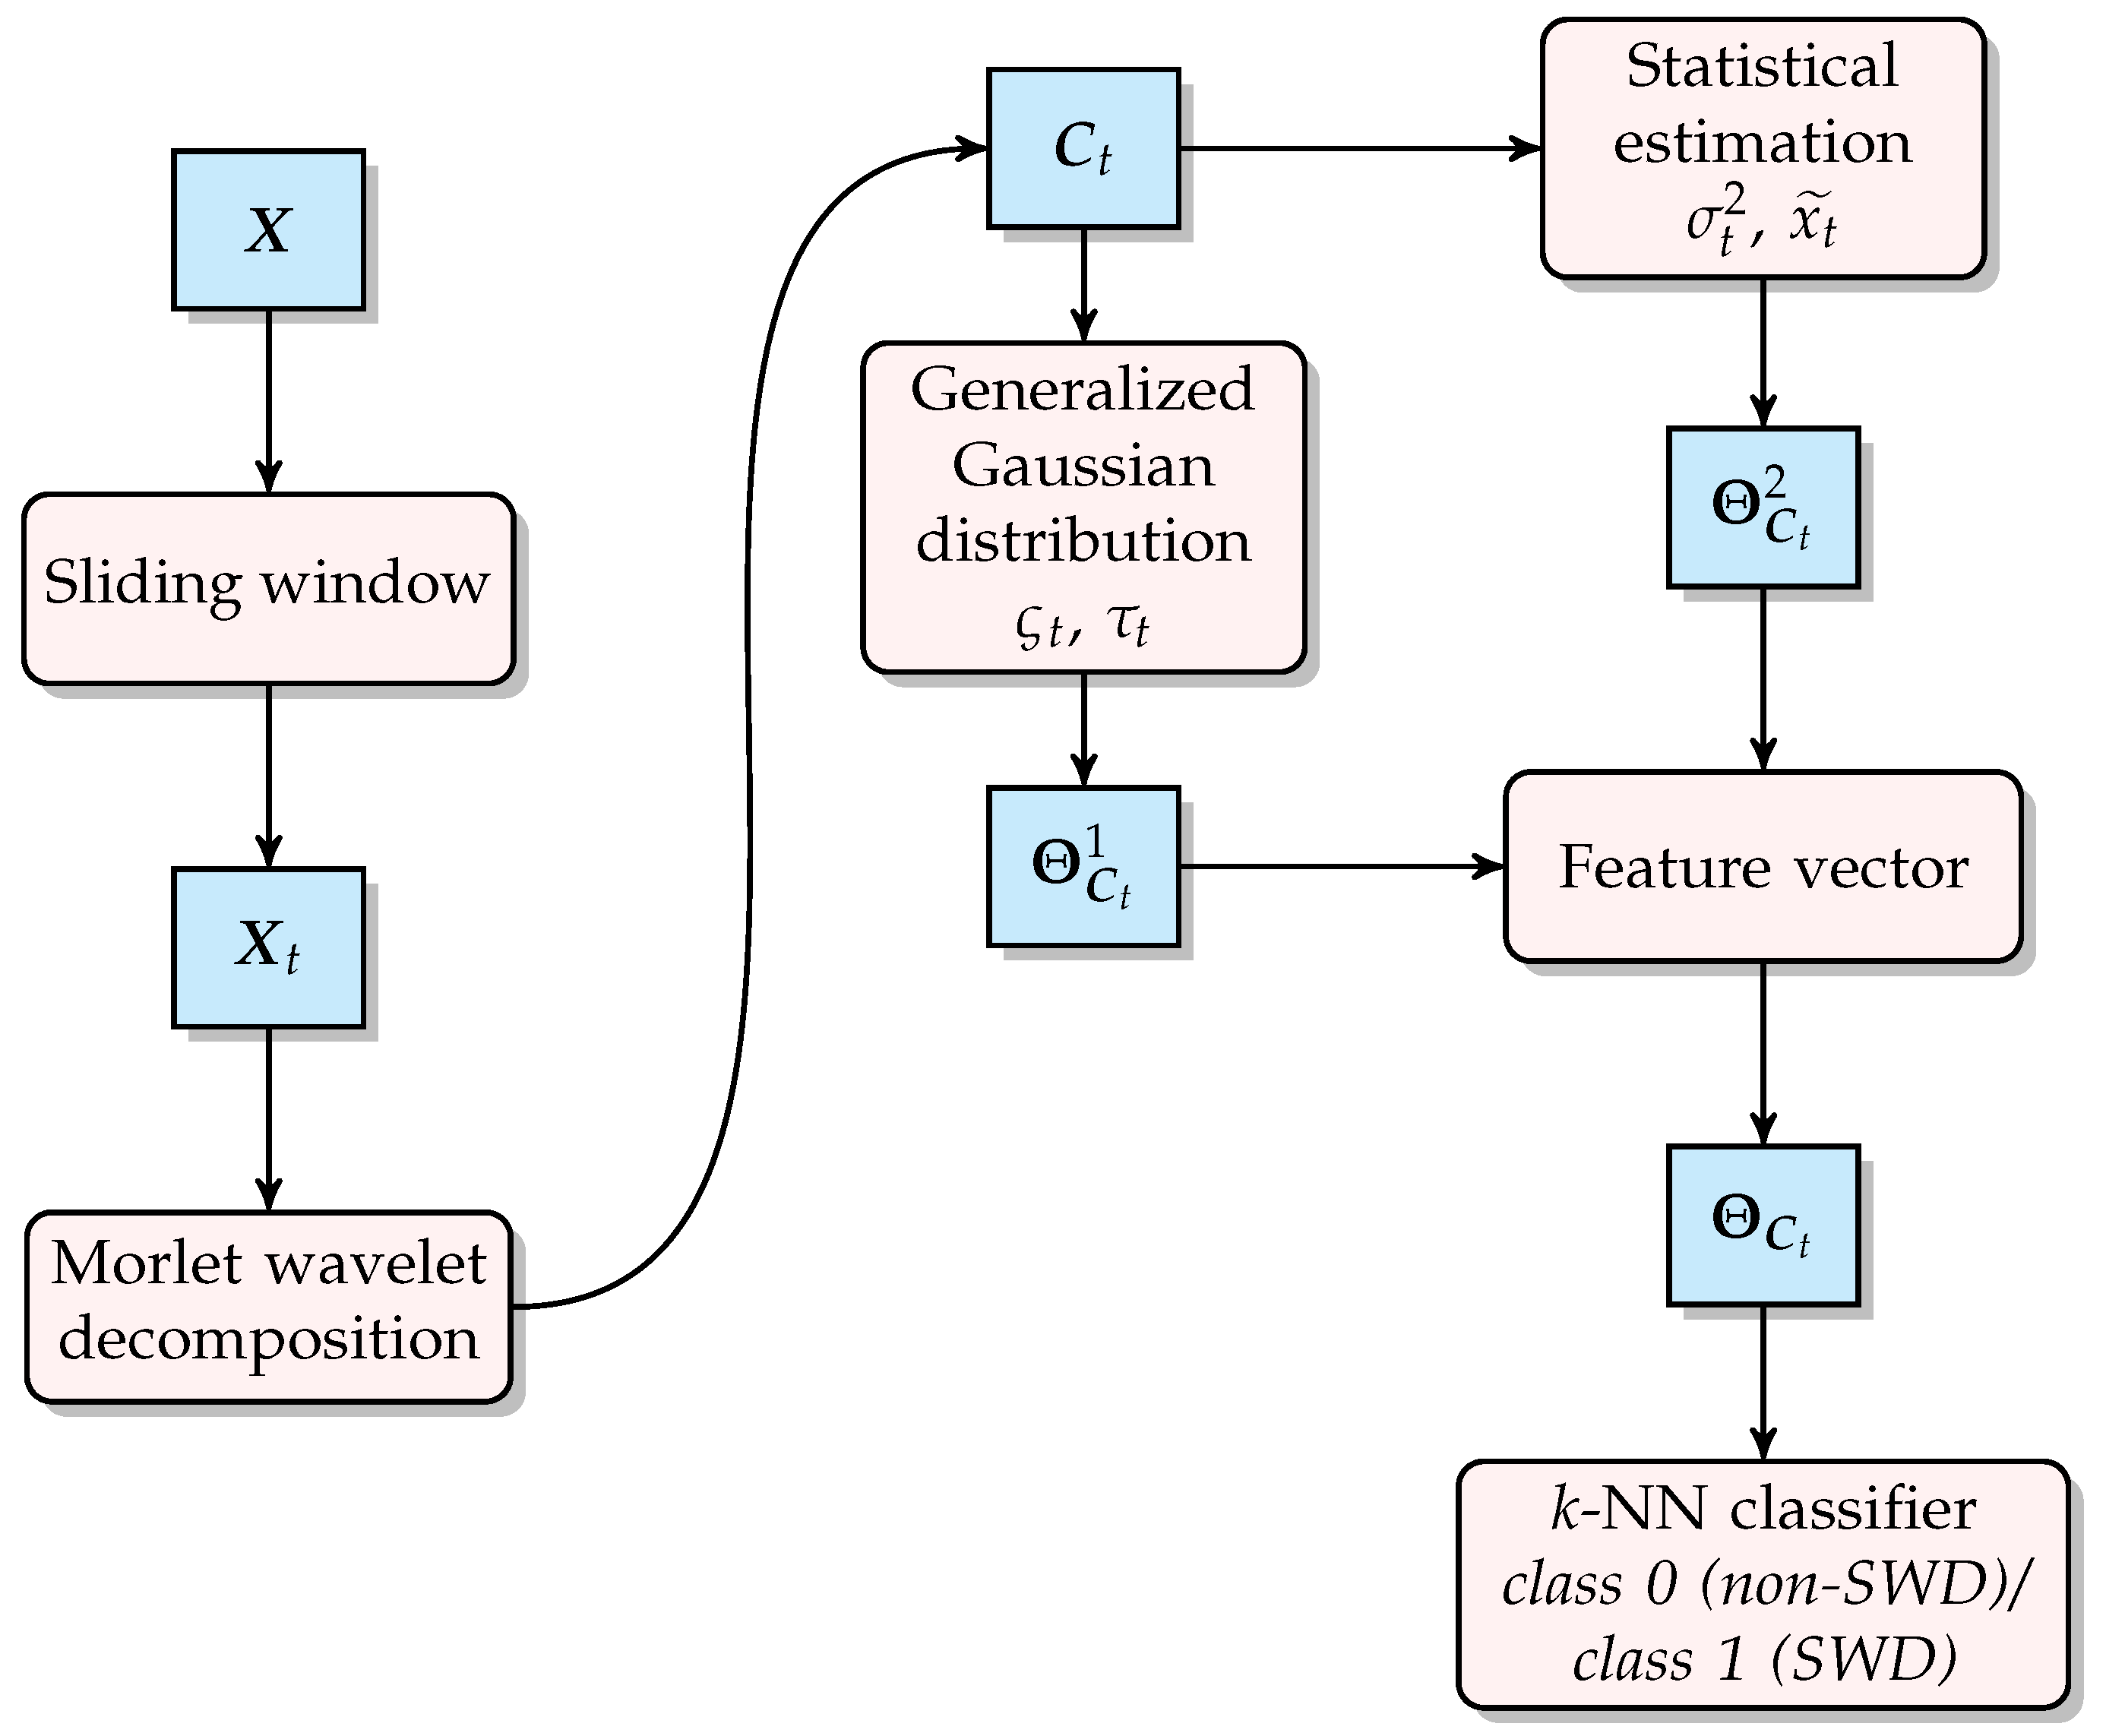
This paper presents a new SWD patient-specific detection method based on the statistical modeling of the continuous Morlet wavelet coefficients. Precisely, we fit the generalized Gaussian distribution to these coefficients and estimate the corresponding parameters. These parameters are used as features in a 10-NN classifier. Training and testing of the learning model use different EEG datasets.
The remainder of the paper is structured as follows.
Section 2 presents the EEG database, and the proposed methodology, where we explain the continuous Morlet wavelet transformation, the generalized Gaussian distribution (GGD) statistical model, and the
k-NN classifier. Experimental results using the scale parameter from the GGD and the variance and median from the continuous wavelet coefficients are reported in
Section 3, flowed by discussion in
Section 4. Conclusions, remarks, and perspectives are presented in
Section 5.
3. Results
The annotated database introduced in
Section 2.1 was used to compute the feature vector
, based on the statistical model of the coefficients of the continuous Morlet wavelet. The resulting features were used for off-line training the
k-nearest neighbor classifier. With the 212 samples,
k was set to 10 giving a
nearest neighbor.
Table 2,
Table 3 and
Table 4 show the statistical mean, standard deviation, variance and bounds values from the feature vector. One can note that, sigma (
), variance (
), and median (
are larger for SWD that for non-SWD. Therefore, despite the overlapping statistical bounds, a threshold can be determined to detect SWD patterns.
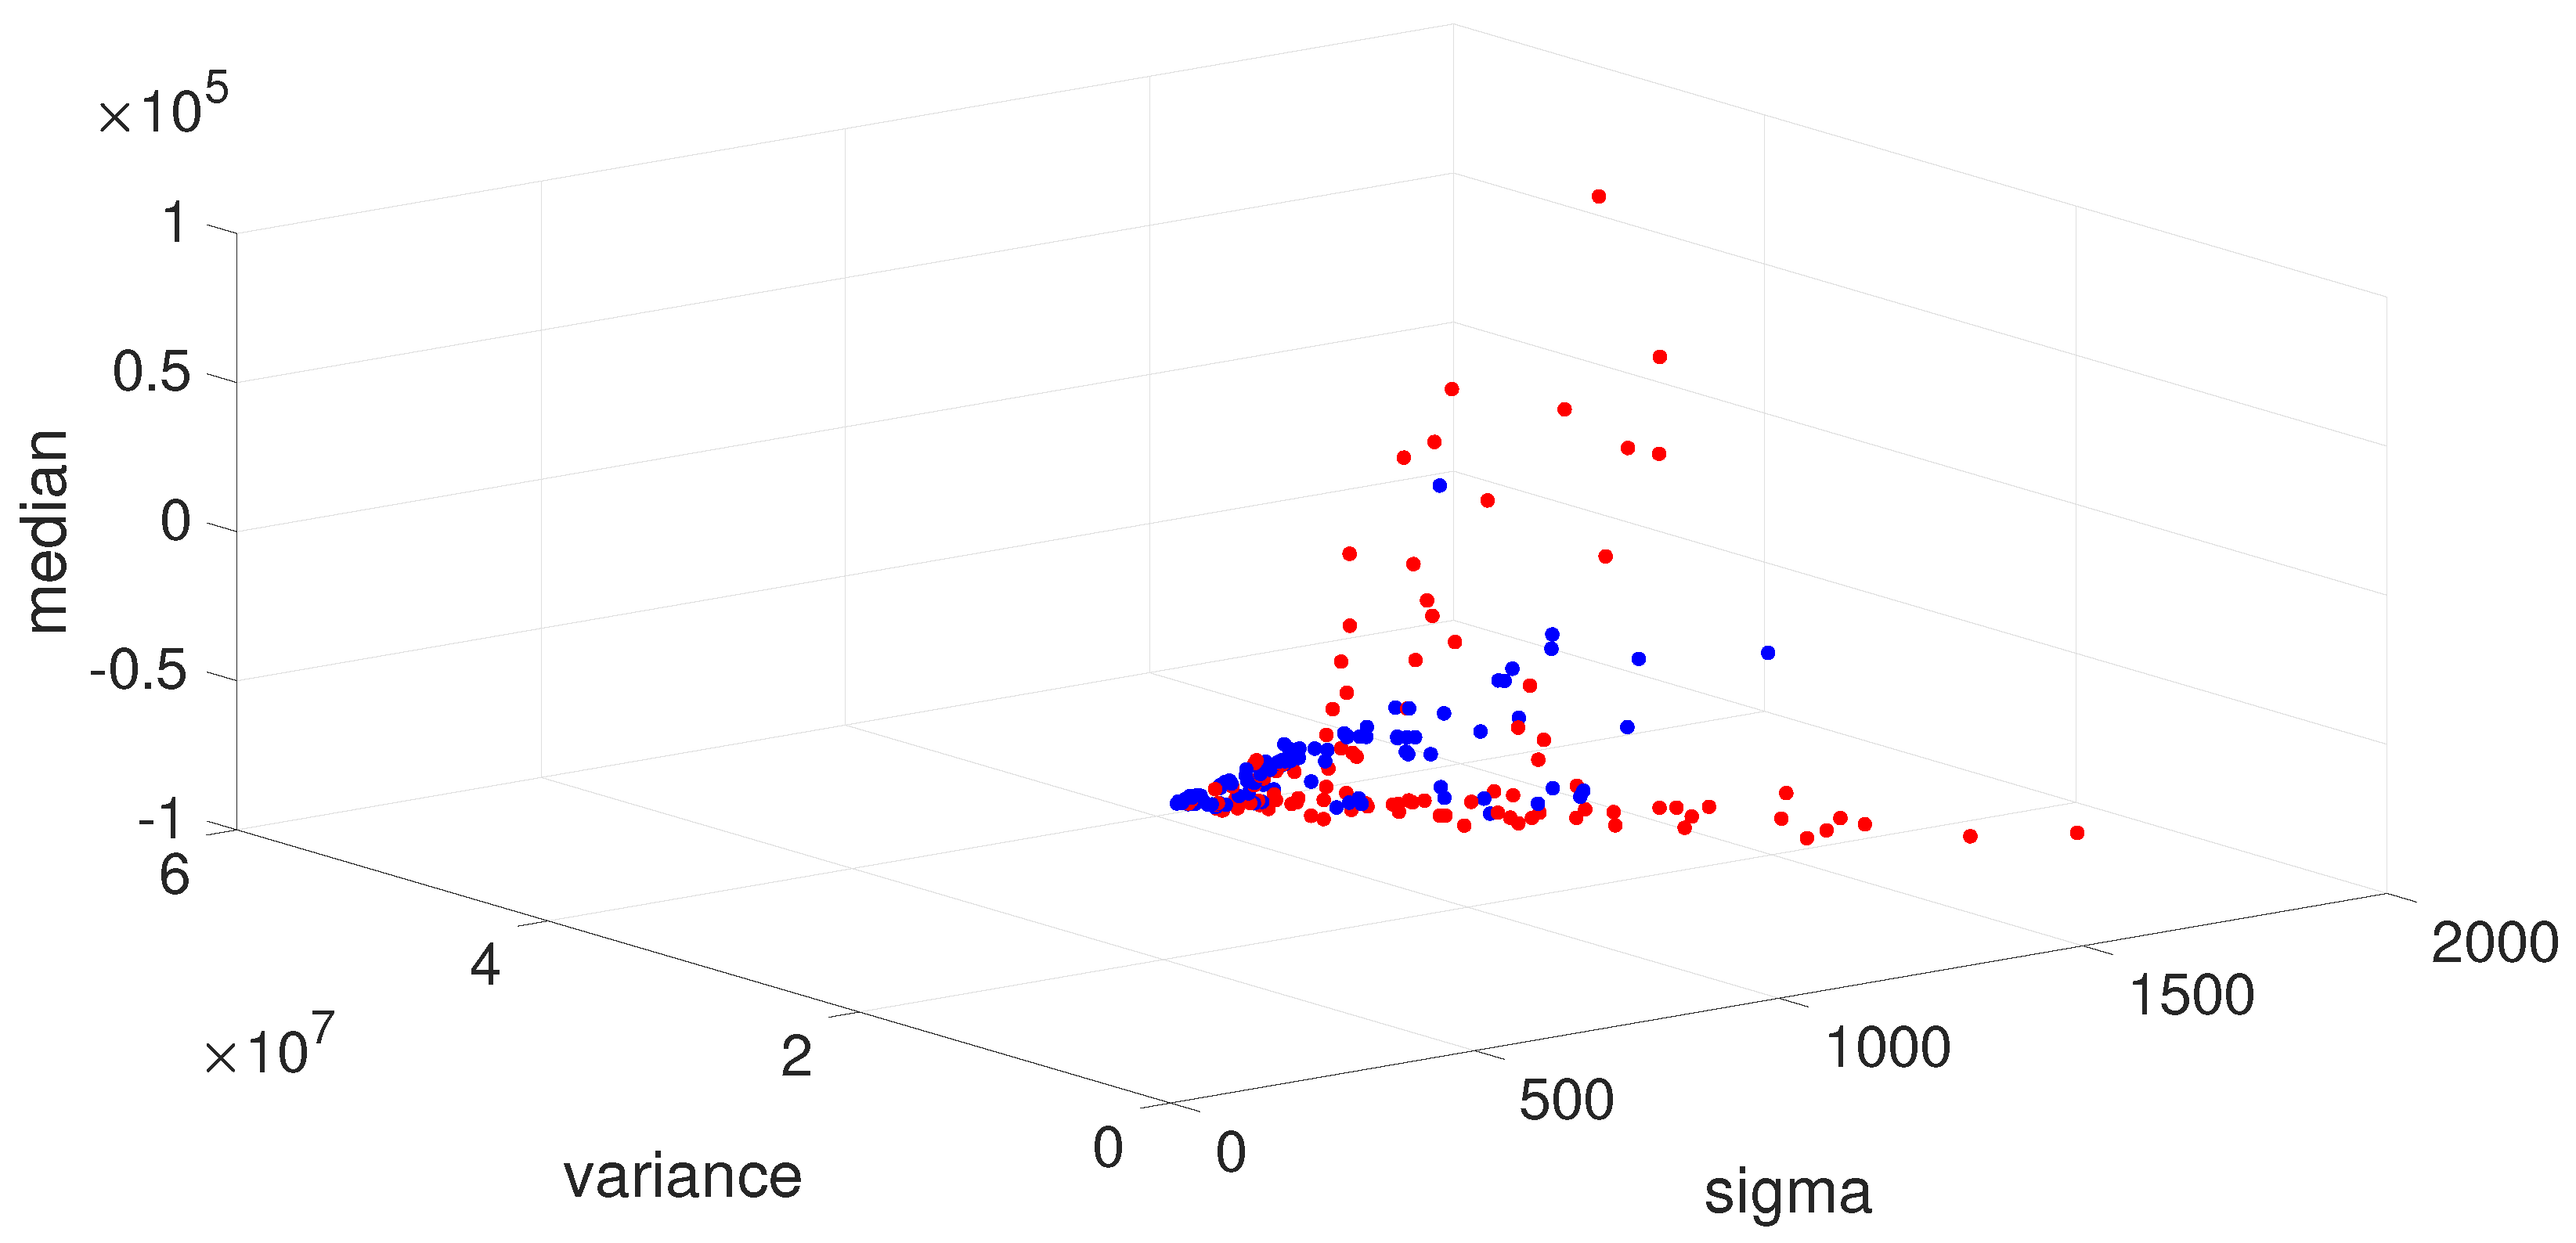
To illustrate the above point,
Figure 4 shows a 3D scatter plot of the feature vector for spike-and-wave events (SWD, class 1, red dots) and non-spike-and-wave events (non-SWD, class 0, blue dots). One observes that the SWD events tend to be more dispersed compared to non-SWD events. This is corroborated by
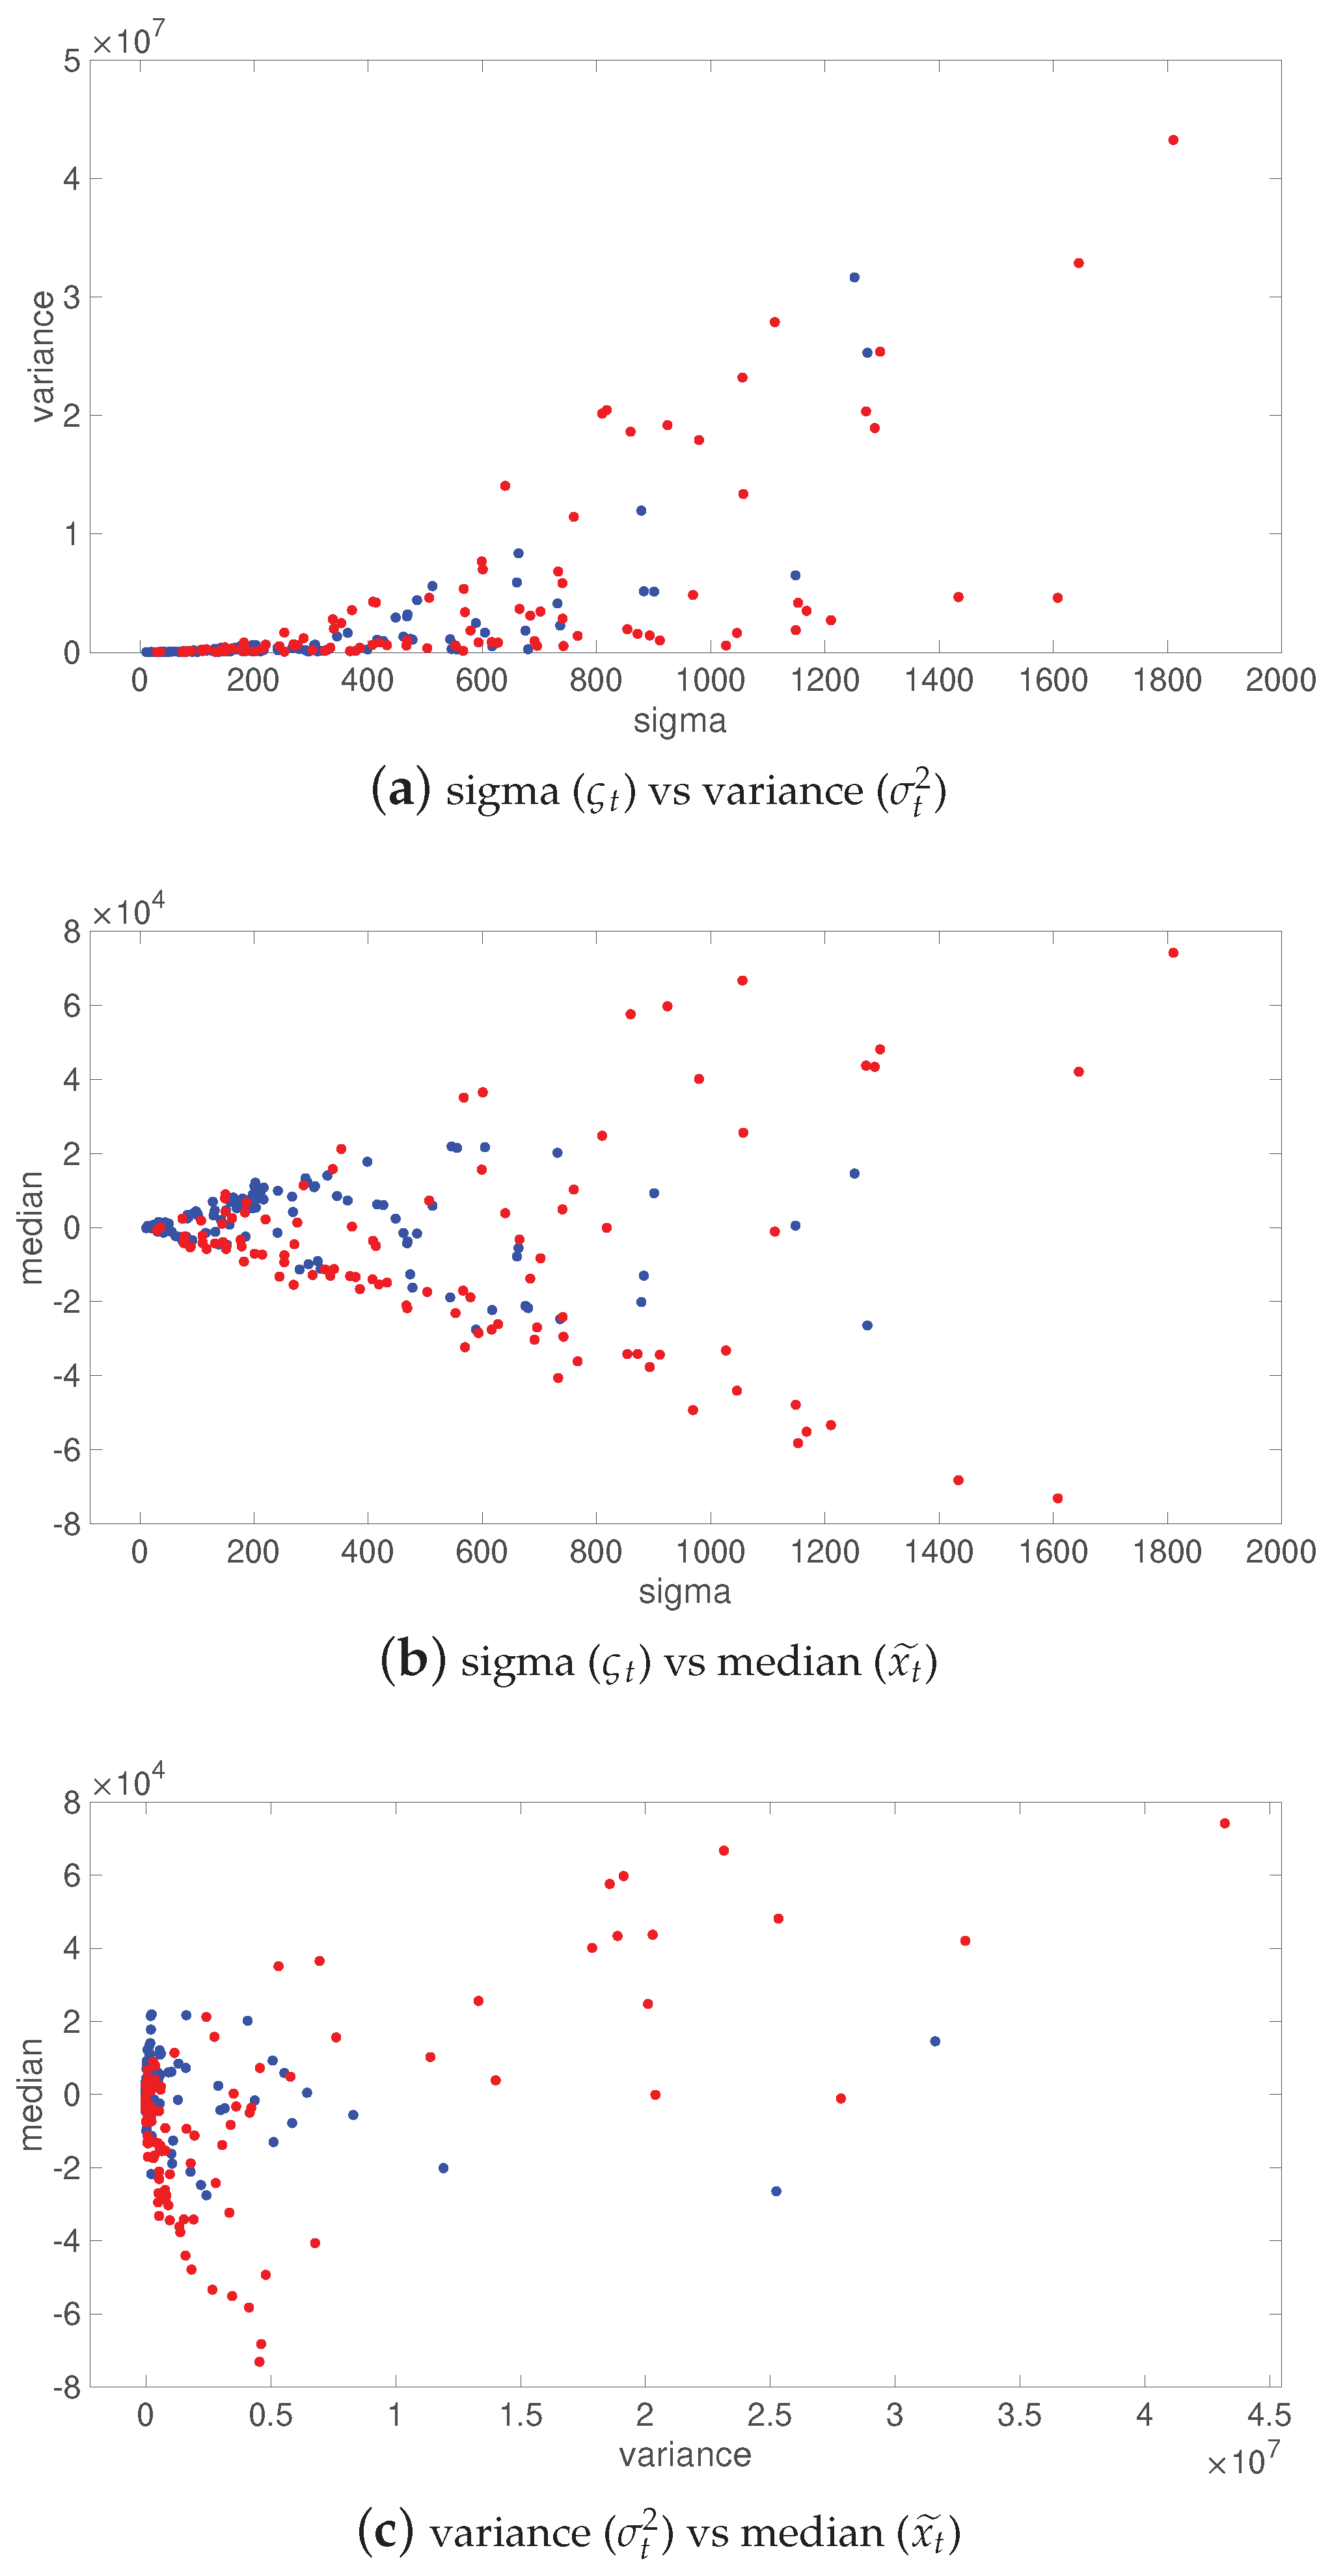
Figure 5 that shows the parameters in pairs, with the following combinations
Scale parameter vs. variance : for class 1 (SWD), one observes a direct relationship between the variance and sigma, where both parameters grow proportionally. For class 0 (non-SWD), both sigma and variance remain in a limited range of values.
Scale parameter vs. median : as sigma grows, median increases then decreases for both SWD and non-SWD, but is larger for SWD. A cone-shaped pattern can be observed.
Variance vs. median : as the variance grows, the median increases then decreases for SWD, while it remains in a small range (cluster) for non-SWD.
The performance of our 10-nearest neighbor classifier was evaluated using a dataset consisting of 96 samples, separate from the training set. These samples were extracted from six EEG signals from subjects different from those used for training. We assessed the total accuracy of the classification. The proposed method achieved a 95% sensitivity (true positive rate), 87% specificity (true negative rate), and 92% accuracy.
4. Discussion
The proposed model-based classification method to detect patient-specific spike-and-wave events in long-term EEG signals is based on three feature parameters (or predictors). These are the scale parameter from the generalized Gaussian distribution, see Equation (
6), the variance and the median, all estimated from the continuous Morlet coefficients. These features are used with a 10-nearest neighbors classifier to discriminates spike-and-wave from non-spike-and-wave events. Experimental results with real data from a hospital achieved 95% sensitivity (true positive rate), 87% specificity (true negative rate), and 92% accuracy. Based on our rule to choose
k, the value was
, but we found a better performance by choosing empirically
. Techniques used in this study are widely known in the scientific community, but they have never before been put together to detect patient-specific epileptiform patterns in EEG. Our main contribution lies in the type of features proposed to detect spike-and-wave patterns and its application to human data. From a technical point of view, the GGD scale parameter depends on the shape parameter, see Equation (
5) and
Table 2,
Table 3 and
Table 4. They can therefore not be used together as features. Using only the scale parameter would restrict the representation space leading to pour representation of natural variability in the data. We, therefore, augmented the representation space by considering the variance and the median of wavelet coefficients. This choice has proven pertinent to discriminating SWD patterns from non-SWD.
The data collection protocol consisted of a neurologist selecting ten SWD patterns for each patient to be part of the training database. Our hypothesis was that using multiple signal patterns from individual patients improves the classification. This enhances learning patient-specific patterns, leading to precise detection of epileptiform patterns compared to previous work [
39].
The collected dataset was previously used with other methods (see
Table 5). We can see that the proposed method doesn’t provide significantly more precise results. However, it has the advantage of analyzing the EEG signal in the time-frequency domain, where previous methods were based on temporal waveform characterization. On the other hand, the assumption that the data has a generalized Gaussian distribution allows a strong dimension reduction, leading to low computational solutions relying on rigorous statistical properties.
5. Conclusions
This paper presented a new model-based classification method to detect spike-and-wave events in long-term EEG signals in humans. The proposed method is based on the scale parameter of the generalized Gaussian distribution augmented with the variance and the median of the continuous Morlet wavelet coefficients from EEG data and a k-nearest neighbors classification technique.
The performance of the method was evaluated by training the model with an annotated real dataset containing 212 signal recordings consisting of spike-and-wave and non-spike-and-wave events. The classification performance was assessed by utilizing 96 segments and achieved 95% sensitivity (true positive rate), 87% specificity (true negative rate), and 92% accuracy. These results set the path to potentially new research to study the causes underlying the so-called absence epilepsy in long-term EEG recordings.
In addition to its performance, the proposed method can be implemented in online epilepsy care applications. However, due to the high dynamics of the EEG epileptic signals, some waveform might be incomplete (with part of the signal missing due to artifacts). Our method is not able to detect such situations, as confirmed by physicians using visual inspection [
39]. Future work will focus on other epileptic waveform patterns as well as on the extensive evaluation of the proposed approach and its comparison with other methods from the literature both in humans and rodents. Other techniques, such as visual data analysis with t-distributed stochastic neighbor embedding [
51] and deep learning variational autoencoders [
52] will be considered. For future clinical research, an on-line user interface will be implemented with different functionalities such as automatic SWD detection and SWD pattern counts for each brain region.

 ,
, 


