Abstract
The rising prevalence of greenwashing by firms has emerged as a major concern for regulatory authorities over the past decade. This paper examines the impact of regulation on firms’ strategic decisions regarding greenwashing and environmental quality in an oligopolistic market. We model two firms that compete on environmental quality and greenwashing levels, operating under the oversight of a regulatory authority. The authority’s policy instruments include a detection mechanism and fines imposed on firms engaging in greenwashing. Using a differential game-theoretical framework, we examine the effectiveness of regulatory interventions like detection and penalties in reducing greenwashing behavior and enhancing environmental quality. Additionally, we discuss the post-detection trajectories of both firms, providing insights into the effects on consumer perceptions and market competition. We find that while regulation can reduce greenwashing as expected, it may also reduce firms’ environmental quality efforts. Indeed, when penalties are sufficiently high, the marginal returns on investment in greenwashing exceed those from actual green quality improvements.
1. Introduction
In recent years, firms have been pushed to make their products more environmentally friendly due to rising consumer interest in sustainable products and regulatory pressures to reduce carbon emissions. However, in the race to achieve a high level of “greenness”, firms have often resorted to exaggerating the true environmental quality of products (Boncinelli et al., 2023; Szabo & Webster, 2021). This is usually referred to as greenwashing. Formally, greenwashing is “the act of misleading consumers regarding the environmental practices of a company or the environmental performance and positive communication about environmental performance” (Terrachoice, 2010).
Although greenwashing is not a novel phenomenon, its prevalence has increased significantly in recent years, impacting many industries, from energy to consumer goods. A recent UK Competition and Markets Authority review examined over 500 websites. It revealed that over 40 percent of employed green advertising strategies reviewed were misleading and potentially violated consumer protection laws (CMA, 2021). Similarly, an investigation by the European Commission found that 42 percent of the green claims assessed were either exaggerated, false, or deceptive, potentially constituting unfair commercial practices (EC, 2021).
The prevalence of greenwashing has consequently led to a rising body of academic literature addressing it, most of them over the last decade. A recent comprehensive systematic review of the greenwashing literature observed that nearly 70 percent of the 310 articles published by 2021 were concentrated in the preceding five years (2017–2021) (Santos et al., 2024). This surge in academic attention reflects the growing recognition of greenwashing as an important issue.
A substantial body of empirical research, along with a relatively lower but growing number of theoretical studies, has explored various dimensions of greenwashing (Tang, 2018). These studies span a range of topics, from the drivers and consequences of greenwashing to its impact on consumer behavior, ethics, and regulatory responses. Our paper contributes to the body of theoretical research on greenwashing.
Several papers that explore greenwashing using mathematical modeling consider strategic interaction between firms, of which we will cite only a few. A detailed literature survey is provided by Santos et al. (2024). One of the early works on greenwashing was by Shleifer (2004), who found that high competitive pressure can lead to unethical behavior like greenwashing, which can lower costs associated with green innovation or quality improvements. More recently, Wu et al. (2020) examined the interaction between a potential greenwasher and a genuinely green firm in direct price competition. They found that information transparency plays a critical role in markets where greenwashing occurs, influencing how consumers perceive environmental claims and make purchasing decisions. Subsequently, J. Zhang and Yang (2022) offered additional insights, showing that greenwashing firms may reduce prices while improving product quality in the presence of genuinely green competitors, thereby attracting greater market demand. Awasthy et al. (2022) noted that greenwashing by one firm negatively affects its competitors. However, when such negative “spillover” is minimal, the competing firm may still invest in positive environmental efforts, thereby increasing its green quality and prices. Using a two-period Stackelberg game for a dual-channel manufacturer–retailer setting, Zong et al. (2022) found that greenwashing can be profitable for manufacturers in a two-period game, though it may not benefit the overall supply chain. They argued that greenwashing, or “misreporting”, has a minimal impact on prices across the supply chain.
However, most of these papers, and several others—for example, those by Cetin et al. (2023); Ruiz-Blanco et al. (2021); and Q. Zhang et al. (2020)—examine the effects of greenwashing performed by competing firms in a market without the presence of a regulatory authority. However, most developed countries and many emerging economies have implemented regulations to address greenwashing, with regulatory bodies imposing penalties when firms are caught engaging in it. For instance, the U.S., the EU, the UK, Australia, Canada, and China have all implemented legal frameworks that explicitly prohibit greenwashing, subjecting firms that engage in deceptive environmental claims to regulatory penalties and sanctions. The presence of regulatory authorities and the threat of detection and subsequent penalties alter the incentives of the firms to greenwash.
One of the most notable cases of greenwashing detection and enforcement involved Volkswagen (VW), which faced widespread legal repercussions after the Federal Trade Commission (FTC) revealed that the company had manipulated emissions testing software in its diesel vehicles. VW falsely promoted these vehicles as low-emission and environmentally friendly, leading to substantial fines and legal actions across multiple jurisdictions (Shepardson, 2016). In a more recent case from 2021, Kohl’s and Walmart were fined USD 5.5 million by the U.S. FTC for misleadingly marketing their bamboo-based textiles as eco-friendly despite the products being manufactured with environmentally harmful chemicals—violating the FTC’s Green Guides (FTC, 2021). A similar incident occurred in Canada, where Keurig Canada was fined CAD 3 million by the Competition Bureau for making false environmental claims about its K-Cup pods, misleading consumers by advertising them as recyclable in municipalities where recycling facilities did not accept the pods (Competition-Bureau-Canada, 2022).
Given the importance of the effect of regulation on greenwashing, we try to consider how the presence of such an agency affects the incentive of firms to greenwash. The effect of some form of regulation on greenwashing has been discussed by Huang et al. (2020); Lee et al. (2018); Sun and Zhang (2019); and Wang et al. (2022). From a supply chain perspective, Lee et al. (2018) demonstrated that regulating greenwashing in competitive supply chains can sometimes undermine firms’ CSR (Corporate Social Responsibility) efforts due to high costs. Interestingly, their findings suggest that permitting some level of greenwashing may provide incentives to certain firms to invest more in genuine environmental quality, as it allows them to balance cost pressures while still competing on green attributes. However, our focus is on the effect of regulations on the profits of the firms, the welfare and perception of final consumers, and on the level of greenwashing and environmental quality. Another noteworthy study in this field was by Sun and Zhang (2019), who employed evolutionary game theory to analyze the effectiveness of government regulations in controlling greenwashing across firms with different levels of market dominance. Their findings suggest that while government-imposed penalties are effective in deterring greenwashing among dominant enterprises, tax subsidies alone may not be sufficient to prevent greenwashing, particularly among smaller or inferior enterprises. They assumed greenwashing is always detected by regulators, which is often unrealistic in practice. In contrast, our paper assumes the probabilistic detection of greenwashing by regulatory bodies, with identical firms, making no arbitrary distinction between those engaging in greenwashing and genuinely green firms. Our framework is also different in that we use a differential game theoretic framework. Later, Huang et al. (2020) used a Stackelberg game with an incumbent and an entrant firm to investigate how competitive pricing strategies are affected by greenwashing, consumer behavior, and anti-greenwashing enforcement. They found that more lax enforcement of greenwashing can sometimes paradoxically lead to higher social welfare and that greenwashing can benefit both incumbent green firms and overall customer surplus when the market’s greenness gap is small. In contrast, we consider a differential game framework where the firms move simultaneously, and the firms are symmetric, with no arbitrary distinction between green and greenwashing firms.
Another recent study that examined the effect of regulation on greenwashing was conducted by Wang et al. (2022). They employed a three-stage Bayesian game to examine how false-claims ban (FCB) regulations influence firms’ greenwashing behavior when they possess imprecise information about their products’ environmental impact. Their findings suggest that while strict FCB regulations are effective in curbing intentional greenwashing, they may also lead to uninformative non-greenwashing if the precision of greenness information acquired by firms is lower than a certain threshold level. Their model also assumes a binary state, either green or non-green. In contrast, our study assumes that the degree of greenwashing varies dynamically based on a range of model parameters.
More recently, the effect of regulation on greenwashing was studied by Mukherjee and Ghosh (2024) in a differential game context. However, they considered a duopoly market with one greenwasher and one green firm. They also assumed a constant penalty for greenwashing. In contrast, we consider a scenario where no predefined distinction exists between firms, allowing both to potentially engage in greenwashing. Moreover, we assume that the penalty is a proportion of the firm’s revenue, which is how penalties are imposed on various countries, like Canada and the EU. For example, under Canada’s new Bill C-59, corporations found guilty of greenwashing may face penalties of up to CAD 10 million for a first offense, CAD 15 million for subsequent offenses, three times the value of the benefit derived from the deceptive conduct, or if that amount cannot be reasonably determined, 3 percent of the corporation’s annual worldwide gross revenues (Competition-Bureau-Canada, 2024).
Before delving into our model, we would like to point out that, in a broader sense, our research problem examines how to control pollution under the risk of a change in regime. Although this field has a rich and extensive body of research, we will discuss only a few studies for the sake of brevity. One of the earlier works in this field was by Tsur and Zemel (1998), who, using a novel h method, examined how the threat of environmental catastrophes, ranging from reversible to irreversible events, affects decisions about pollution control. They found that reversible events consistently lead to greater conservation (lower pollution) as planners mitigate risks. In contrast, irreversible events will lead to lower pollution only under certain specific conditions. Nkuiya (2015) also contributed to the literature by examining how the risk of increased environmental damage influences the strategic emissions decisions of countries. Using a non-cooperative dynamic game framework, this study demonstrated that international cooperation in pollution control yields substantial benefits. Furthermore, it highlighted the importance of policymakers accounting for the possibility of sudden regime shifts when formulating and implementing environmental policies.
In a more recent article, Gromov et al. (2024) examined optimal pollution control problems in the context of varying environmental conditions. They provided an excellent review of the existing literature on this stream of research. In addition, they found that optimal solutions converge to a hybrid limit cycle, which balances profit maximization with environmental preservation. Their findings suggest that adjusting the discount rate can be a regulatory tool to encourage sustainable practices among firms.
In this paper, we consider two similar firms competing in a differential game framework with respect to environmental quality and the greenwashing level. The firms operate in a market governed by a regulatory body with an enforcement mechanism. If the agency detects greenwashing by a firm, it must pay a penalty in proportion to its revenue earned in the first period. Under such a situation, we examine the effect of greenwashing on each firm’s strategies, outcomes, and consumer perception. Our objective was to investigate the following research questions:
- What are the equilibrium environmental quality and greenwashing efforts of the firms?
- How do the environmental quality and greenwashing levels of each firm i vary with the penalty multiplier and likelihood of detection ?
- How do the firms’ decisions vary with consumer trust?
- Is return on investment on environmental quality higher than that on greenwashing?
In addressing our research questions, a differential game is the most appropriate because it captures the dynamic evolution of perceived quality determined by each firm’s ongoing decisions about environmental quality and greenwashing. This framework models the strategic competition over time, where each firm’s actions impact not only its own demand function but also the competitor’s. Piece-wise constant strategies reflect the reality of firms adjusting decisions periodically rather than continuously.
Our findings suggest that a high risk of exposure or a high penalty may reduce greenwashing and stop it altogether, but deteriorate the environmental quality of the products as well. However, a low penalty and market with conscious consumers can result in higher environmental quality. Lack of consumer trust may also reduce the environmental quality post greenwashing.
Our main contributions are the following:
- As opposed to static games, we model a differential game that captures the dynamic nature of perceived quality and its evolution over time, being influenced by the firms’ environmental quality and greenwashing.
- While the previous literature has focused on regulations on greenwashing, we propose and solve a model where firms compete while anticipating the risk of exposure and incorporate this risk in their decisions.
- Contrary to intuition and comporting with Lee et al. (2018) we show that too stringent regulations on greenwashing in an evolving market may be detrimental to the overall environmental quality of the firms’ products.
- We also show that the return on investments for greenwashing may be higher than that of environmental quality under certain conditions.
2. Model
2.1. Demand Functions and State Variables
We consider a duopoly market where two firms compete on the environmental quality of their products. In addition, the firms greenwash to enhance the perceived quality of their products to the consumers, thereby gaining a competitive advantage. We model the above situation using a continuous-time differential game model. The firms decide on the environmental quality of the products and greenwashing level , where is the index of the firm. The environmental quality of a product can be justified as a control variable in a differential game model because firms have direct influence over it through decisions such as investing in cleaner technologies or sourcing sustainable materials. For example, a firm can increase environmental quality by adopting eco-friendly packaging or by reducing emissions in the production process, actions that directly impact the firm’s cost dynamics and competitive positioning over time. More specifically, denotes the efforts the firms make to improve environmental quality (for example pollution control), and denotes the greenwashing efforts (for example, misleading advertising). A similar use and interpretation of these decisions can be found in the works by Dockner and Van Long (1993) and Xue and Wang (2024).
Our demand function is similar to that of Mukherjee and Chauhan (2021). Specifically, the demand function of firm i is expressed as follows:
where is the market potential, j is the index for the time period, and denotes the sensitivities to the product differentiation in terms of environmental attribute. The decision variables for the two firms in the two periods are environmental quality and the greenwashing efforts . The state variables of our model are the perceived environmental qualities of the firm given by . The state variables are positively affected by the environmental quality decisions and the greenwashing decisions . In essence, the state variable reflects consumers’ perception of a product’s overall environmental quality. This perception is shaped by both genuine efforts to improve environmental quality and deceptive practices (greenwashing) by the firms, which create a misleading impression of environmental quality. The evolution of the state variables are given by the following differential equations:
In the above equations, and are the marginal effects of environmental quality and greenwashing on the perceived environmental quality evolution of firm i in regime j. is the decay in the perceived green quality of firm i in regime j.
Detection of greenwashing: The firms anticipate that there is a risk of being exposed, and if detected at a random time , the regulatory body will impose a penalty. We assume that the time of detection is a random variable following a exponential distribution. Thus, we have an associated hazard rate , which is defined by
If the firms do not greenwash, then and , and therefore, there is only one regime. This detection time splits the decision horizon into two regimes—, where is the period when the greenwashing is not detected, and is the period when it is detected and the penalty is imposed. If greenwashing is detected, the firms do not greenwash in the second regime.
2.2. The Profit Maximizing Problems of the Firms
In noting that j is the index for the time period, the instantaneous profits of firm i in regime j are given by , where is the unit profit margin (difference between price and production cost), and denotes the other costs of firm i, like the costs of greenwashing, costs of environmental quality, or the penalty cost if the firm is caught for greenwashing. The term is constant for every regime j. It can happen that .
Penalty : The penalty for greenwashing can be in several forms. According to Forbes (McGowan, 2024), such a penalty can be a percentage of gross revenue, a fixed constant (like USD 10 million), or a multiple of the revenue made from the sales of the items with misleading advertising. While most of the literature considers a fixed penalty, in this model, we consider that the penalty is a proportion of the first period’s revenue of firm i, and this is denoted by . Therefore, the penalty , where is the profit margin of firm i in regime 1. We highlight that if the firms are exposed, in the second regime, will be known to the firms and the values of are also known. Therefore, the penalty is just a number and is treated merely as a constant term for the solution of the second period’s game.
The instantaneous profit functions of firm i in regime j () is
We consider an infinite horizon regime switching differential game where there are two regimes. The first regime is when the firms greenwash, and regime 2 starts when the firms are exposed at random time . We are interested in the long-term decisions and profits of the firms. Such games are widely used in the applications of management science and economics (Dockner et al., 2000). One standard way of solving such a game is to use backward induction as we do here. We start with the second regime’s problem. The second regime’s long-term profits are given by
and the profit maximization problem of the firms are given by
where (6) is subject to the state equations given by (2). Here, is the instantaneous profit of firm i in regime j, is the long-term profit of firm i in regime j, and is the value function of firm i in regime j.
Derivation of first period’s profit: At the beginning of the first period, the possible time of the detection of greenwashing is random, and the firms do not know ex ante the date . Consequently the net present value of profit is also a random variable, and the expected value of profit at the beginning of the planning horizon (t = 0) is given by
where the expectation is over the stochastic process of the detection of greenwashing.
To evaluate the three integrals, we integrate by parts. Starting with and letting and , we obtain , , and
The above results follows from since and . Similarly, we have
Therefore, (8) becomes
Consequently, the overall optimization problem is as follows:
Note that the first period’s state variable contains greenwashing along with environmental quality .
3. Discussion of Equilibrium Strategies
We use the Hamilton–Jacobian–Bellman (HJB) equations to solve the above problems. HJB Equations (11) and (12) are linear quadratic and such linear quadratic games have been extensively studied in the literature under different contexts. It can be shown that the value functions of such games are linear quadratic (Dockner et al., 2000). We posit that the value functions will be of the form
where , , and are the constant coefficients. The second period’s HJB equations are
From Equation (9), the first period’s HJB equations are given by
From the above equations, it is easy to see that the structure of the game is linear quadratic and the solution of the game will yield piece-wise constant strategies in the two regimes. The illustration and importance of such games can be found in Dockner et al. (2000).
3.1. Equilibrium Analysis
We assume that if there is a second regime, after the firms are possibly exposed, the firms do not greenwash anymore. Therefore, the firms’ only decisions in the second regime are the environmental qualities.
Proposition 1.
The equilibrium quality decisions of the two firms in the regime period are
and the value functions are given by and .1
Some of the important parameters in the second regime are the profit margin (), the consumer’s sensitivity to difference in environmental quality (), and the decay .
Lemma 1.
In the second regime, the environmental quality effort of each firm behaves as follows:
- (i)
- Increases with the profit margin ();
- (ii)
- Increases with the sensitivity to perceived environmental quality difference ();
- (iii)
- Decreases with lack of trust ().
Proof.
In noting that , the first-order conditions of with respect to are □
The above lemma has the following implications:
- Higher Profit Margins: When firms enjoy higher profit margins, they have a stronger incentive to invest in environmental quality because the potential gains outweigh the costs.
- Greater Sensitivity of Environmental Quality Difference (): When consumers are more responsive to changes in environmental quality, firms will invest more in quality improvements to capture a larger market share. This results in a more competitive environment where firms try to differentiate themselves through higher environmental standards.
- Higher Decay Rate (): When the decay rate of perceived quality ) is high, the benefits of environmental efforts quickly diminish. This makes such investments less attractive since maintaining quality requires constant, costly efforts. Consequently, firms may reduce their environmental investments.
Proposition 2.
The equilibrium quality and greenwashing decisions of the two firms in the first period are
and the value functions are given by and .
From the above proposition, we note that quality and greenwashing efforts are functions of several parameters. The most important among these parameters are , the hazard rate; , the decay of perceived quality; and , the penaty multiplier constant. We also note that true environmental quality can be expressed as a function of greenwashing. In the following lemmas, we discuss the effect of these parameters on the model.
Remark 1.
We note that the control variables in Equations (13) and (14) are always positive as the model parameters are always positive. Theoretically, χ, being a hazard rate, can be greater than 1, but this is unlikely as it would signify a very high hazard, and in such cases, the firms may not greenwash. Therefore, in Equation (14), it is assumed that , and hence, is positive as . In case the firms do not greenwash, the hazard rate is , and Equation (14) becomes identical to Equation (13).
Lemma 2.
The true environmental quality of each firm increases with the greenwashing efforts.
Proof.
From Proposition 2, some algebraic manipulation gives the following relationship between true environmental quality and greenwashing:
Therefore, from the positivity of the parameters, we see that
Therefore, the true environmental quality increases with greenwashing. □
The above lemma might seem counterintuitive. We emphasize that if a firm does not attain a minimum quality level, it will be reluctant to greenwash.
Lemma 3.
The amount of greenwashing of each firm is monotonically decreasing with the penalty.
Proof.
From the expression of in Proposition 2, we note that
Thus, the greenwashing efforts of any firm decrease with a higher penalty because is the multiplier of the revenue of the first period, and this determines the penalty. □
We consider that the penalty multiplier is known ex ante. Therefore, while anticipating the exposure, it is obvious that the greenwashing efforts will decrease with the penalty.
Lemma 4.
The quality efforts of each firm i in the first regime is decreasing in the hazard rate if
In other words, if the penalty rate exceeds a certain critical threshold, each firm’s actual green quality effort will decrease with the hazard rate. This result suggests an optimal level of detection rate that maximizes the true green quality provided by the two firms in such cases. Exceeding it will be counterproductive to the objective of improving the environmental quality efforts. The relationship highlights a fundamental tension in environmental regulation: policies designed to increase compliance through stricter penalties may inadvertently lead to lower environmental quality.
Lemma 5.
The greenwashing efforts of firm i decrease with , the quality decay parameter of the second regime.
Proof.
From Proposition 2, we note that
Therefore, the greenwashing of each firm i decreases with the decay of perceived quality in the second period. □
This result directly addresses one of our research questions by illustrating how the level of consumer trust influences a firm’s decisions. It shows that the incentive of any firm i to engage in greenwashing diminishes if there is a reduction in the perceived environmental quality of its product in the eyes of consumers over time. After being penalized for greenwashing, the resulting erosion of the firm’s environmental credibility in the second regime diminishes the effectiveness of further deceptive practices, thus pushing the firm toward reducing greenwashing.
3.2. Can a Penalty Prevent Greenwashing?
We ask if there is a severe enough penalty or high enough likelihood of exposure that can prevent firms from greenwashing. To examine this, we equate the greenwashing decision to zero and find the appropriate condition. From Proposition 2, by equating the level of greenwashing to 0, we observe that
From Equation (19), we notice that if the penalty is sufficiently high, the firms will not greenwash. We also notice the following regarding the threshold value of the penalty beyond which the firms do not greenwash:
- (i)
- The threshold of the penalty multiplier is decreasing with .
- (ii)
- The threshold decreases with the consumer distrust in the second regime.
Finding (i) above is intuitive because when there is a high risk of detection of greenwashing, the firms will not risk greenwashing even if the penalty is smaller. Exposure of greenwashing may result in severe consumer distrust and hence demand erosion and profit reduction. If this is a possibility and the firms foresee a very high distrust from consumers, they will not greenwash even for a low penalty. This is precisely what point (ii) above implies.
Remark 2.
Note that the expression of is strictly positive as all model parameters are positive and there is no negative sign in the expression of the solutions. For and , the solutions contain . By definition, , and we assume that . is a theoretical possibility, but that means there is an extremely high risk of getting exposed and no rational firm, in general, will greenwash under such risks. Therefore, , and hence, the solutions are positive.
4. Numerical Analysis
Our closed-form solutions of the equilibrium decisions are piece-wise constant. In our analytical results, we could derive the firms’ strategies in closed-form. However, the expressions of the value functions, which are the instantaneous profits, are complex. In this section, we show the variation in the profit with the parameters and . The main goals of this numerical analysis are the following:
- Determine when the firms greenwash or not given and .
- Explore how environmental quality and greenwashing levels vary together with .
- Find out how the returns on investment on environmental quality and greenwashing vary with and consumer sensitivity to greenwashing .
For our numerical analysis, we assume the following values of the parameters: Parameters vary.
Choice of parameter values: Positive parameter values give positive values for the control variables. It is customary in the literature to assume small values of r and , which are discounting and decay, respectively. As an example, Mukherjee and Chauhan (2021) assumed similar types of values. The other parameter values will change the scale of the solutions but will not qualitatively affect the findings.
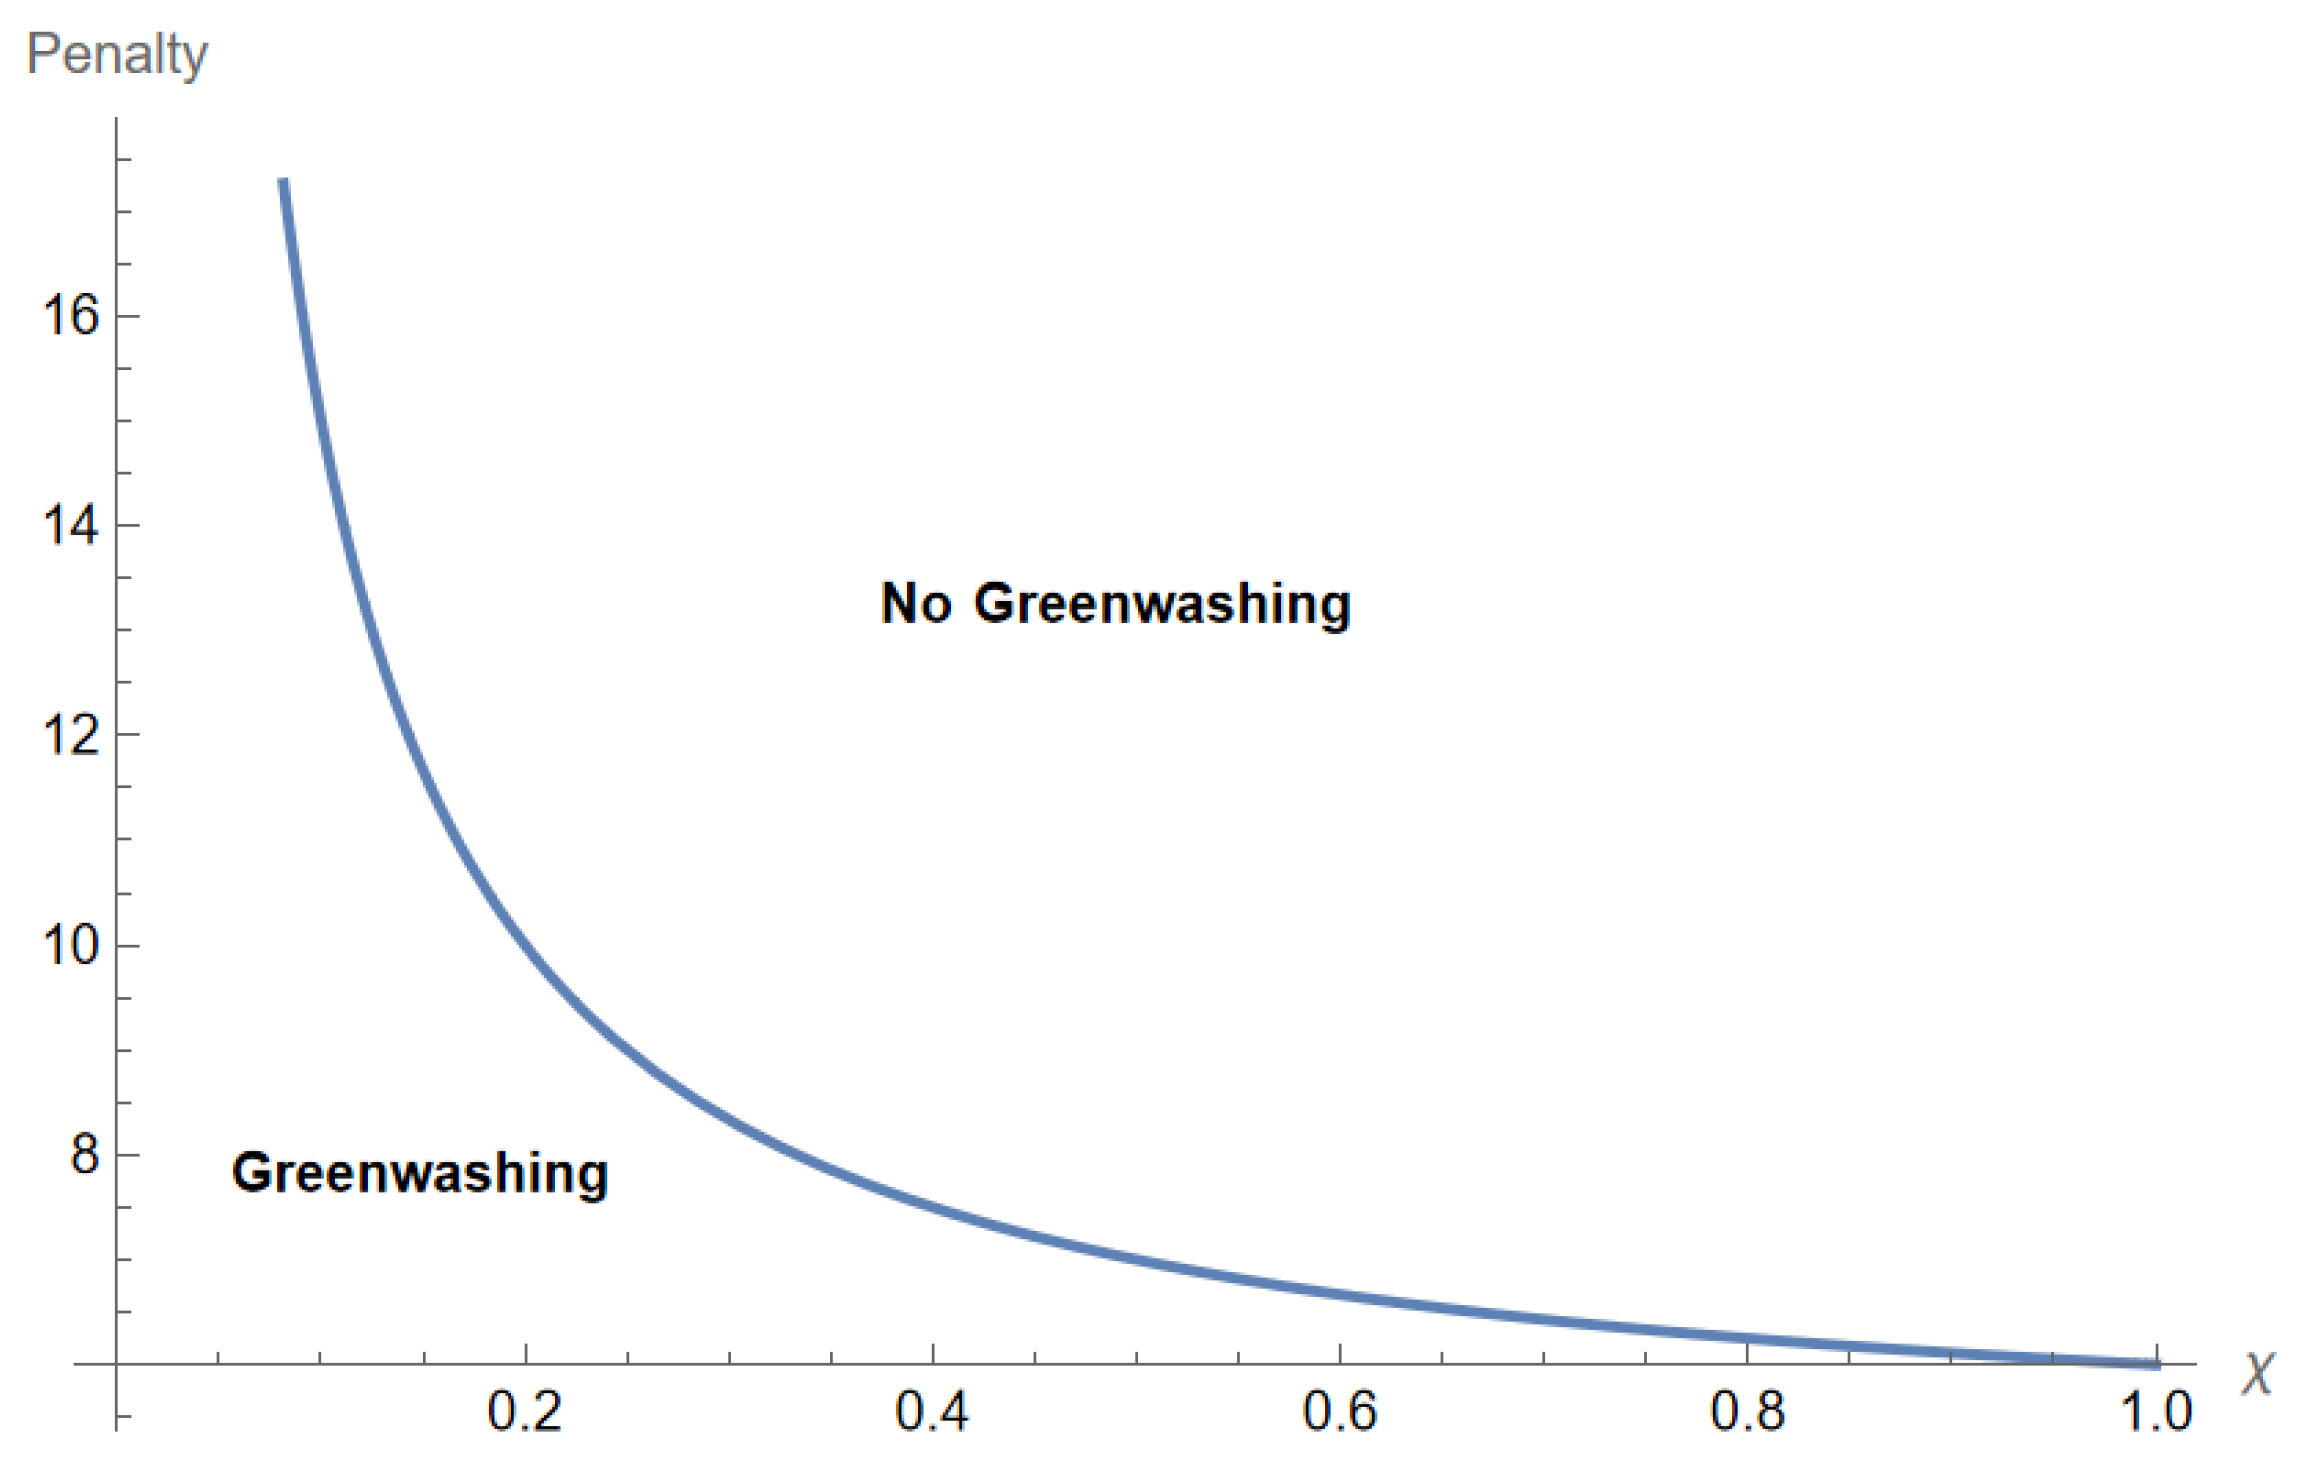
Observation 1.
A higher penalty stops greenwashing at a lower likelihood of detection.
This observation is a consequence of Equation (19). From Figure 1, we note that as the hazard rate increases, a lower penalty can successfully stop a firm from greenwashing. The above result stems from the fact that the hazard rate and penalty have a multiplicative interaction effect on the firms’ decision while anticipating risk ().

Figure 1.
Penalty vs. .
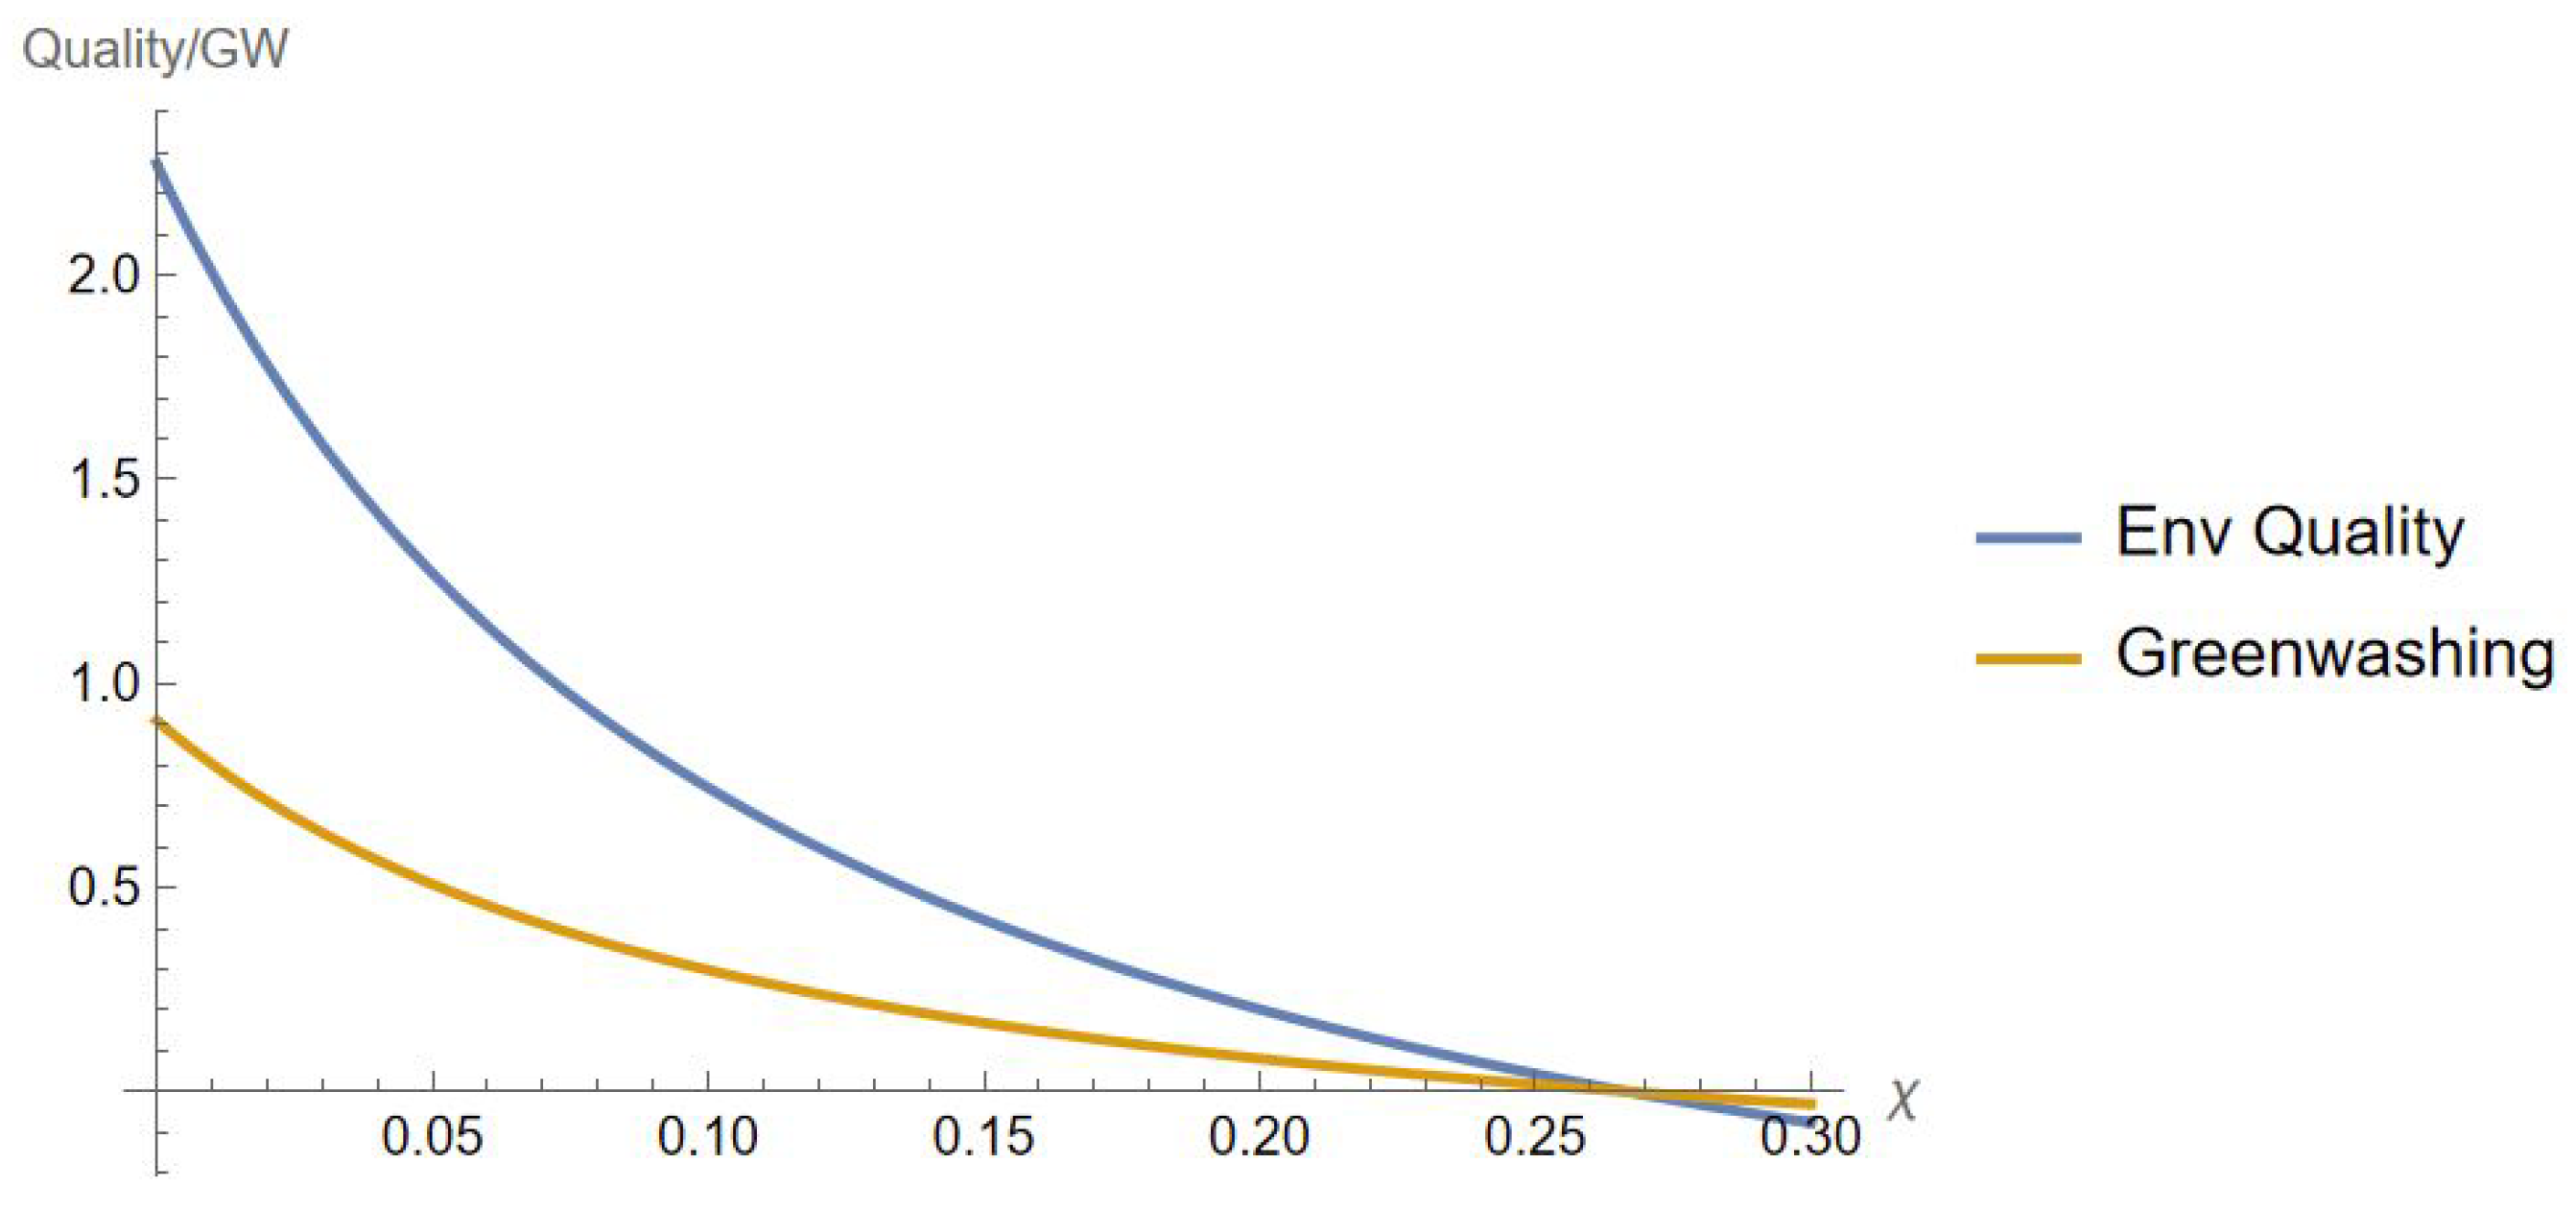
Observation 2.
A high likelihood of greenwashing exposure may deter firms from producing environmentally friendly goods.
From Figure 2, we observe that environmental quality and greenwashing become zero and subsequently negative after a certain hazard rate threshold. While practically this does not make sense, the interpretation is that given a penalty multiplier , firm i stops producing environmentally friendly products. The intrinsic message from a firm’s message is that in a competitive market, if greenwashing exposure is risky or expensive, firms will tend to adopt traditional brown products (since they do not invest in environmental quality). In the context of our model, the demand functions from Equation (1) then become constant as becomes zero in the absence of environmental quality.
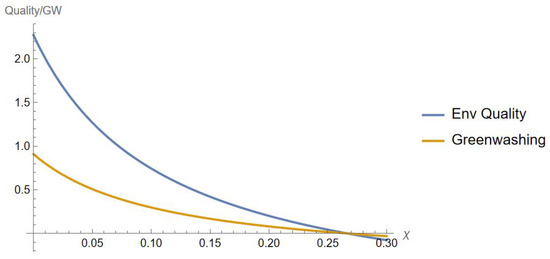
Figure 2.
Environmental quality, greenwashing vs. .
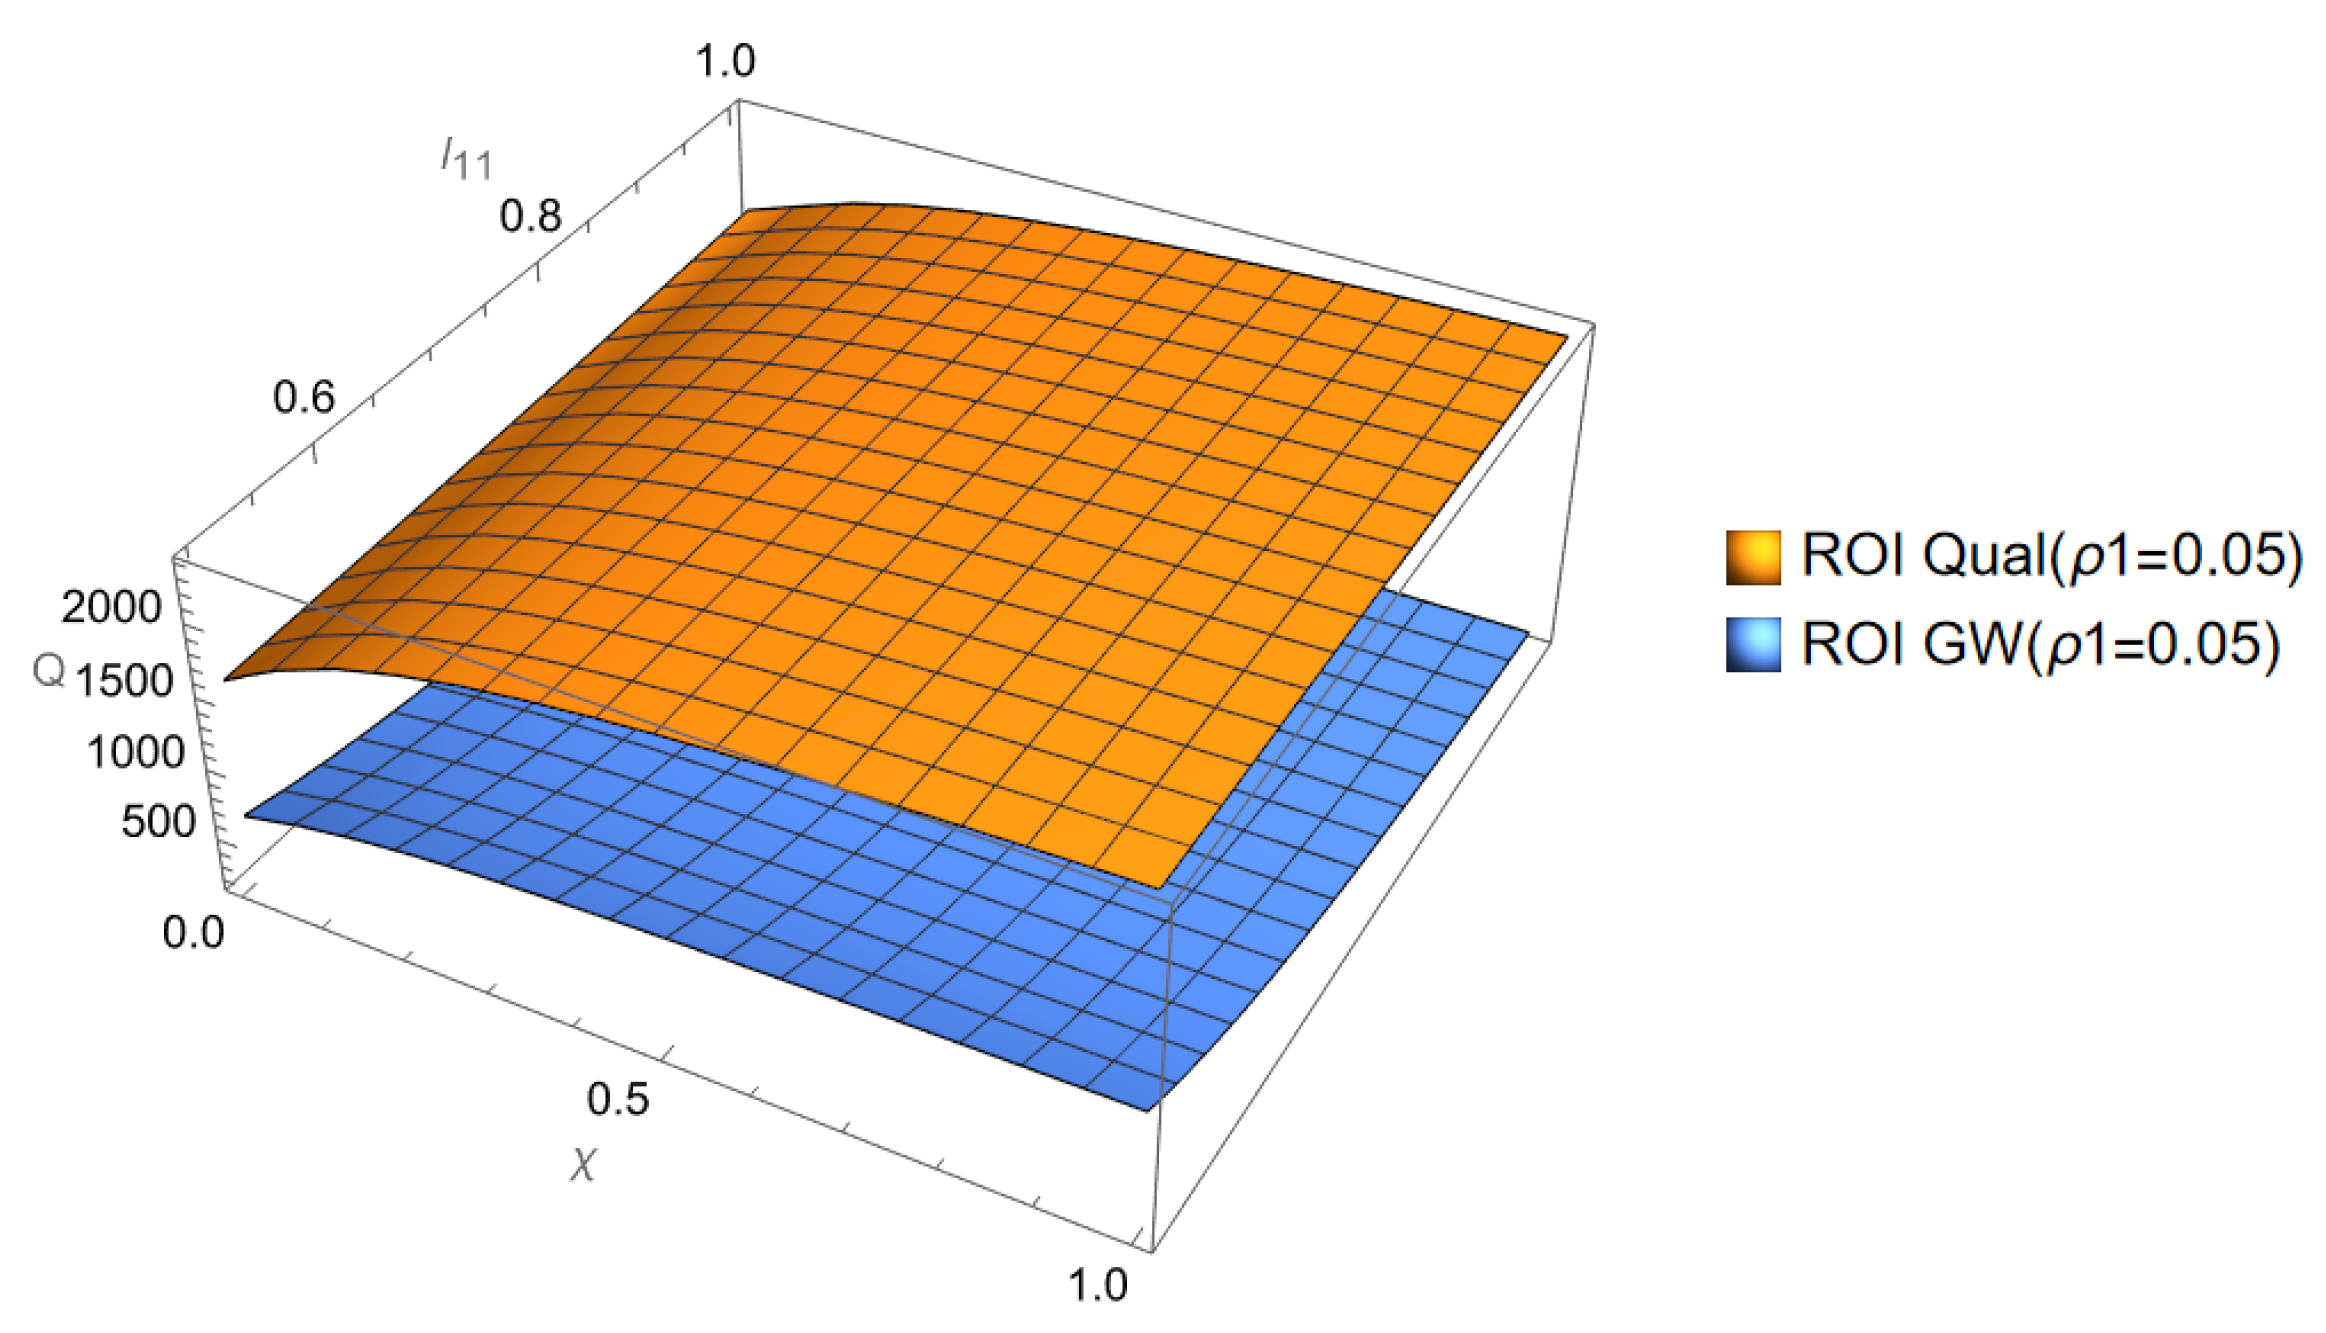
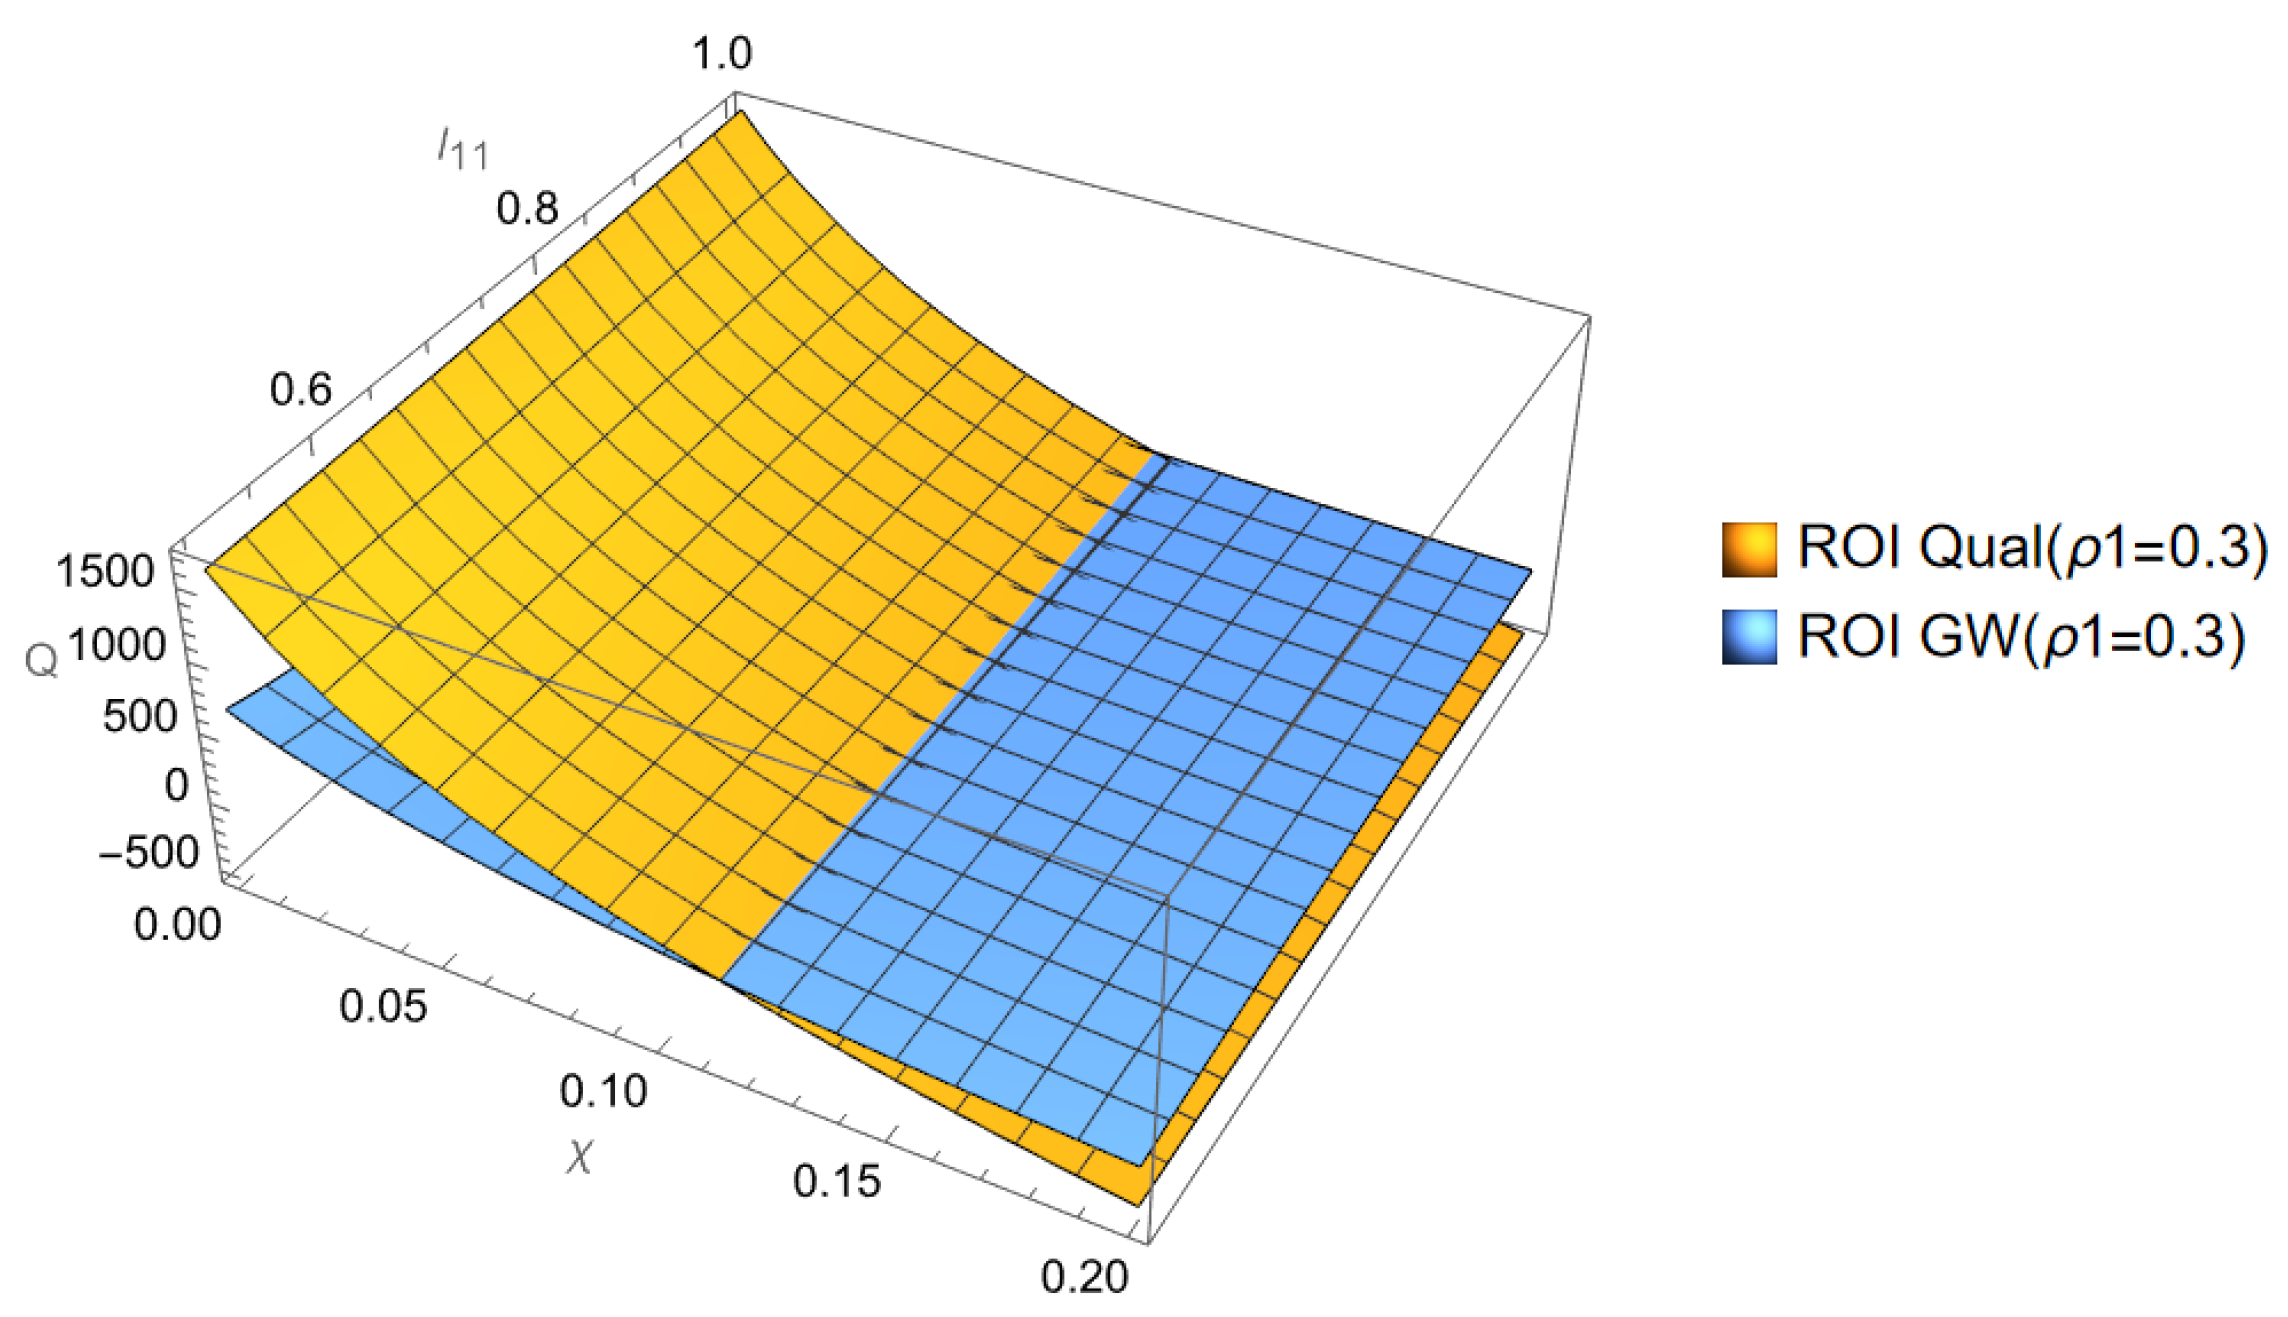
Observation 3.
For a low penalty (5%), the return on investment (ROI) on quality is higher than the ROI of greenwashing. For a higher penalty (30%), the ROI of the quality can decrease with the hazard rate, and the ROI of greenwashing may become higher.
Figure 3 and Figure 4 illustrate Observation 3. We compute the return on investments from the environmental quality and greenwashing in the following manner:
where is the value function at t = 0, and and are the costs of quality and greenwashing, respectively. Intuitively, extremely high penalties reduce a firm’s expected profits if it continues any level of greenwashing. This diminishes the return on investment (ROI) from providing higher environmental quality, given the quadratic nature of quality improvement costs. When expected profits are sufficiently low, the ROI from greenwashing surpasses that of improving quality, since, by assumption, greenwashing costs remain lower than quality improvement costs. This result is similar to the findings of Lee et al. (2018), who also reported that regulating greenwashing may not necessarily increase green products, as firms may avoid offering them if profits are insufficient or costs are too high.

Figure 3.
ROI: Greenwashing vs. Quality-Low penalty percentage.
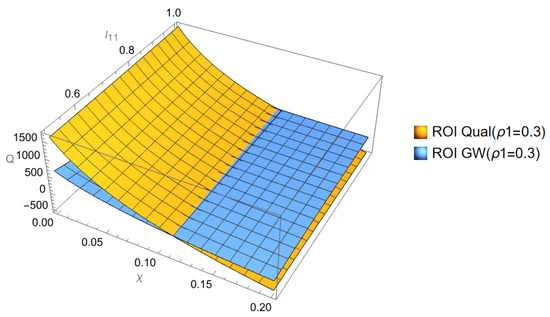
Figure 4.
ROI: Greenwashing vs. Quality-High penalty percentage.
5. Conclusions
This paper contributes to the literature on greenwashing and environmental quality competition by considering a duopoly model where both firms compete on environmental quality while also engaging in potential greenwashing under the supervision of a regulatory authority. Through a differential game-theoretical framework, we illustrated how regulatory detection mechanisms and penalties significantly influence firms’ strategic decisions regarding both true environmental quality and greenwashing efforts. Unlike most of the existing literature, which assumes competition between a greenwasher and a true green firm (e.g., Cetin et al. (2023), Wu et al. (2020)), we assume that both firms engage in greenwashing. Some of our key findings are the following. First, regulation and the risk of detection significantly impact firms’ strategies regarding both true environmental quality and greenwashing efforts. Next, we identify a threshold penalty rate above which firms will cease greenwashing activities entirely. This threshold decreases as the likelihood of detection increases, providing useful insights for regulatory policy design. Paradoxically, very high penalties or detection probabilities can potentially deter firms from producing environmentally friendly products altogether. This highlights the delicate balance regulators must strike.
The model reveals complex dynamics between greenwashing, true quality efforts, and consumer perceptions. In some cases, greenwashing efforts may correlate with higher true quality. We further find that under specific conditions, the return on investment for greenwashing can surpass that of true quality improvements, especially when penalties are high. This poses a significant challenge for effective regulation.
While our model offers valuable insights, it is important to acknowledge its limitations and potential areas for future research. The structure of the game in our model generated piece-wise constant strategies. A particularly promising extension would involve incorporating price as a decision variable alongside quality in a competitive setting, thus providing a more comprehensive understanding of firms’ strategic interactions. Future studies could explore asymmetric firms, incorporate price as a decision variable, and delve into supply chain dynamics related to greenwashing. Additionally, the empirical testing of our model’s predictions using industry data could provide valuable real-world validation.
Author Contributions
Conceptualization, S.G.; Methodology, A.M.; Software, A.M.; Formal analysis, A.M. and S.G.; Writing—original draft, A.M. and S.G.; Writing—review & editing, A.M. and S.G.; Visualization, A.M. All authors have read and agreed to the published version of the manuscript.
Funding
This research received no external funding.
Data Availability Statement
The original contributions presented in the study are included in the article, further inquiries can be directed to the corresponding author.
Conflicts of Interest
The authors declare no conflicts of interest.
Appendix A. Proof of Proposition 1
We want to prove that the equilibrium quality decisions of the two firms in the regime period are
and the value functions are given by and , where
Proof.
We assume that the value functions are of the form
From (11), the second period’s HJB equations are
By noting that is a number, substituting the demand functions, the state variables, and the derivatives in Equation (A3), and using the first-order conditions of the decision variables , we obtain
Replacing the value functions in (A3) with their linear forms in (A2), we obtain
Substituting the demand functions, the state variables, and the derivatives in Equation (A5), we obtain the following two equations.
Remark A1.
For brevity, we are dropping the time index (t) in the proofs.
Equating the coefficients of state variables and and the constant terms from both sides of the above equations, we obtain the following set of six equations:
From (A6), we obtain . From (A7), we obtain .
From (A9), we obtain . From (A10), we obtain .
Plugging these values of coefficients in Equation (A4), we obtain . Similarly, . This completes the proof of Proposition 1. □
Remark A2.
The proof of Proposition 2 is similar to that of Proposition 1.
Note
| 1 | Proofs of the propositions are provided in Appendix A. |
References
- Awasthy, P., Gouda, S., Ghosh, D., & Swami, S. (2022). Analyzing product greening spillovers in multi-product markets. Transportation Research Part E: Logistics and Transportation Review, 158, 102586. [Google Scholar] [CrossRef]
- Boncinelli, F., Gerini, F., Piracci, G., Bellia, R., & Casini, L. (2023). Effect of executional greenwashing on market share of food products: An empirical study on green-coloured packaging. Journal of Cleaner Production, 391, 136258. [Google Scholar] [CrossRef]
- Cetin, C. B., Mukherjee, A., & Zaccour, G. (2023). Strategic pricing and investment in environmental quality by an incumbent facing a greenwasher entrant. Available online: https://ssrn.com/abstract=4454279 (accessed on 10 October 2024).
- CMA. (2021). Global sweep finds 40% of firms’ green choice claims could be misleading. Available online: https://www.gov.uk/government/news/global-sweep-finds-40-of-firms-green-claims-could-be-misleading (accessed on 10 October 2024).
- Competition-Bureau-Canada. (2022). Keurig canada to pay $3 million penalty for misleading environmental claims. Available online: https://www.competitionbureau.gc.ca (accessed on 10 October 2024).
- Competition-Bureau-Canada. (2024). Guide to the june 2024 amendments to the competition act. Available online: https://competition-bureau.canada.ca/how-we-foster-competition/education-and-outreach/guide-june-2024-amendments-competition-act (accessed on 21 October 2024).
- Dockner, E. J., Jorgensen, S., Van Long, N., & Sorger, G. (2000). Differential games in economics and management science. Cambridge University Press. [Google Scholar]
- Dockner, E. J., & Van Long, N. (1993). International pollution control: Cooperative versus noncooperative strategies. Journal of Environmental Economics and Management, 25(1), 13–29. [Google Scholar] [CrossRef]
- EC. (2021). Screening of websites for ’greenwashing’: Half of green claims lack evidence. Available online: https://ec.europa.eu/commission/presscorner/detail/en/ip_21_269 (accessed on 10 October 2024).
- FTC. (2021). Ftc charges kohl’s and walmart with misleading environmental claims about textile products. Available online: https://www.ftc.gov/news-events/news/press-releases/2022/04/ftc-uses-penalty-offense-authority-seek-largest-ever-civil-penalty-bogus-bamboo-marketing-kohls (accessed on 5 September 2024).
- Gromov, D., Shigoka, T., & Bondarev, A. (2024). Optimality and sustainability of hybrid limit cycles in the pollution control problem with regime shifts. Environment, Development and Sustainability, 26(4), 10701–10718. [Google Scholar] [CrossRef]
- Huang, H., Xing, X., He, Y., & Gu, X. (2020). Combating greenwashers in emerging markets: A game-theoretical exploration of firms, customers and government regulations. Transportation Research Part E: Logistics and Transportation Review, 140, 101976. [Google Scholar] [CrossRef]
- Lee, H. C. B., Cruz, J. M., & Shankar, R. (2018). Corporate social responsibility (CSR) issues in supply chain competition: Should greenwashing be regulated? Decision Sciences, 49(6), 1088–1115. [Google Scholar] [CrossRef]
- McGowan, J. (2024). U.S. companies could face $10 million in fines for green marketing in canada. Available online: https://www.forbes.com/sites/jonmcgowan/2024/06/28/us-companies-could-face-10-million-fines-for-green-marketing-in-canada/ (accessed on 15 August 2024).
- Mukherjee, A., & Chauhan, S. S. (2021). The impact of product recall on advertising decisions and firm profit while envisioning crisis or being hazard myopic. European Journal of Operational Research, 288(3), 953–970. [Google Scholar] [CrossRef]
- Mukherjee, A., & Ghosh, S. (2024, April 2–5). Greenwashing with detection. Western Decision Sciences Institute 52nd Annual Conference, Santa Rosa, CA, USA. Available online: https://wdsinet.org/Annual_Meetings/2024_Proceedings/papers/submission_97.pdf (accessed on 23 September 2024).
- Nkuiya, B. (2015). Transboundary pollution game with potential shift in damages. Journal of Environmental Economics and Management, 72, 1–14. [Google Scholar] [CrossRef]
- Ruiz-Blanco, S., Romero, S., & Fernandez-Feijoo, B. (2021). Green, blue or black, but washing–What company characteristics determine greenwashing? Environment, Development and Sustainability, 24, 1–22. [Google Scholar]
- Santos, C., Coelho, A., & Marques, A. (2024). A systematic literature review on greenwashing and its relationship to stakeholders: State of art and future research agenda. Management Review Quarterly, 74(3), 1397–1421. [Google Scholar] [CrossRef]
- Shepardson, D. (2016). Ftc sues volkswagen over diesel advertising claims. Available online: https://www.reuters.com/article/volkswagen-emissions-idUSL2N1710R4 (accessed on 15 September 2024).
- Shleifer, A. (2004). Does competition destroy ethical behavior? American Economic Review, 94(2), 414–418. [Google Scholar] [CrossRef]
- Sun, Z., & Zhang, W. (2019). Do government regulations prevent greenwashing? An evolutionary game analysis of heterogeneous enterprises. Journal of Cleaner Production, 231, 1489–1502. [Google Scholar] [CrossRef]
- Szabo, S., & Webster, J. (2021). Perceived greenwashing: The effects of green marketing on environmental and product perceptions. Journal of Business Ethics, 171, 719–739. [Google Scholar] [CrossRef]
- Tang, C. S. (2018). Socially responsible supply chains in emerging markets: Some research opportunities. Journal of Operations Management, 57, 1–10. [Google Scholar] [CrossRef]
- Terrachoice, G. (2010). The sins of greenwashing: Home and family edition 2010 (Vol. 6, p. 11). Twosides. [Google Scholar]
- Tsur, Y., & Zemel, A. (1998). Pollution control in an uncertain environment. Journal of Economic Dynamics and Control, 22(6), 967–975. [Google Scholar] [CrossRef]
- Wang, Z., Ni, D., & Zheng, K. (2022). The role of false-claims ban regulation in greenwashing of firms with imprecise greenness information. Sustainability, 14(20), 13655. [Google Scholar] [CrossRef]
- Wu, Y., Zhang, K., & Xie, J. (2020). Bad greenwashing, good greenwashing: Corporate social responsibility and information transparency. Management Science, 66(7), 3095–3112. [Google Scholar] [CrossRef]
- Xue, L., & Wang, X. (2024). The impact of pollution transmission networks in a transboundary pollution game. Journal of Cleaner Production, 451, 142010. [Google Scholar] [CrossRef]
- Zhang, J., & Yang, J. (2022). Influence of greenwashing strategy on pricing: A game-theoretical model for quality heterogeneous enterprises (pp. 336–343). IOS Press. [Google Scholar] [CrossRef]
- Zhang, Q., Zhao, Q., Zhao, X., & Tang, L. (2020). On the introduction of green product to a market with environmentally conscious consumers. Computers & Industrial Engineering, 139, 106190. [Google Scholar]
- Zong, S., Shen, C., & Su, S. (2022). Decision making in green supply chain with manufacturers’ misreporting behavior. Sustainability, 14(9), 4957. [Google Scholar] [CrossRef]
Disclaimer/Publisher’s Note: The statements, opinions and data contained in all publications are solely those of the individual author(s) and contributor(s) and not of MDPI and/or the editor(s). MDPI and/or the editor(s) disclaim responsibility for any injury to people or property resulting from any ideas, methods, instructions or products referred to in the content. |
© 2025 by the authors. Licensee MDPI, Basel, Switzerland. This article is an open access article distributed under the terms and conditions of the Creative Commons Attribution (CC BY) license (https://creativecommons.org/licenses/by/4.0/).