Abstract
In this paper, we investigate the classical Axelrod model of cultural dissemination under an adaptive network framework. Unlike the original model, we place agents on a complex network, where they cut connections with any agent that does not share at least one cultural trait. This rewiring process alters the network topology, and key parameters—such as the number of traits, the neighborhood search range, and the degree-based preferential attachment exponent—also influence the distribution of cultural traits. Unlike conventional Axelrod models, our approach introduces a dynamic network structure where the rewiring mechanism allows agents to actively modify their social connections based on cultural similarity. This adaptation leads to network fragmentation or consolidation depending on the interaction among model parameters, offering a framework to study cultural homogeneity and diversity. The results show that, while long-range reconnections can promote more homogeneous clusters in certain conditions, variations in the local search radius and preferential attachment can lead to rich and sometimes counterintuitive dynamics. Extensive simulations demonstrate that this adaptive mechanism can either increase or decrease cultural diversity, depending on the interplay of network structure and cultural dissemination parameters. These findings have practical implications for understanding opinion dynamics and cultural polarization in social networks, particularly in digital environments where rewiring mechanisms are analogous to recommendation systems or user-driven connection adjustments.
1. Introduction
In 1997, Robert Axelrod introduced an agent-based model for cultural dissemination, in which agents have a set of features, and each feature can take one of several possible traits. These features can be thought of as agents’ beliefs, attitudes, or customs, while traits represent the possible choices for each feature. The key mechanism of the model is that similarity breeds influence: the more features two neighboring agents share, the more likely they are to become even more similar by copying each other’s traits. Despite this tendency toward local convergence, Axelrod observed that the model can exhibit global polarization, allowing multiple stable cultural regions to coexist. Such an apparent contradiction comes from the interplay between local interactions and the discrete nature of cultural traits, making the model an interesting framework to study how diversity can persist despite social influence Axelrod (1997).
Despite the success of the Axelrod model in explaining how cultural diversity and homogeneity emerge from local interactions, its conventional formulation assumes static networks where individuals interact within fixed connections. This limitation becomes evident when attempting to model real-world social systems, which are inherently dynamic. Individuals continuously form, break, and modify social ties based on various factors, including cultural similarity, geographical proximity, or personal preferences. Static network models cannot capture this evolving nature of social interactions, potentially overlooking critical mechanisms that drive cultural dissemination and fragmentation. Therefore, a rewiring mechanism is necessary to study how individuals adjust their connections according to cultural similarity, simulating a more realistic process where agents actively seek compatible connections while severing incompatible ones Guerra et al. (2010); Raducha and Gubiec (2017). Such an approach allows us to explore how network adaptation influences cultural clustering, consensus, and fragmentation, thereby offering a richer framework for understanding complex social dynamics.
Studies based on the Axelrod model have expanded the population structure to other approaches, such as random complex networks. For instance, Klemm et al. (2003) studied nonequilibrium transitions in complex networks using an Axelrod-like social interaction model, demonstrating how network topology can drive or hinder consensus. Reia and Fontanari (2016) investigated how introducing long-range interactions affects the Axelrod model’s phase transition, showing that new topological links can dramatically alter the equilibrium state. Raducha and Gubiec (2017) introduced four different rewiring mechanisms to model preferential attachment and local rewiring, finding that small-world networks retain high clustering while power-law degree distributions emerge. Other contributions include investigations into how cultural domains form and spread in both static and dynamically evolving networks Guerra et al. (2010); Singh et al. (2012), as well as analytical results concerning conditions leading to monoculture versus cultural diversity in one-dimensional and higher-dimensional settings Lanchier (2012).
In addition to exploring diverse network topologies, researchers have investigated how variations in interaction rules and other model choices influence the global behaviors of populations. For example, Castellano et al. (2000) examined phase transitions in a model closely related to Axelrod’s, revealing how small adjustments to interaction rules can lead to drastically different outcomes, such as consensus or fragmentation. More recently, Zhang et al. (2024) introduced algorithmic interventions inspired by social media platforms, demonstrating how recommendation systems can exacerbate polarization, particularly when using content-based recommendations. The interventions were based on reinforcing misinformation beliefs, opinion and social distance, and recommendation algorithms. This study shows that alterations in interaction mechanisms can have dramatic consequences on cultural diversity and homogeneity. Furthermore, Dinkelberg et al. (2021) examined how homophily dynamics influence network structure by comparing different topologies, concluding that cultural fragmentation is driven more by homophily than by the underlying network architecture. This result aligns with the general observation that homophily can outweigh the effects of network topology over long-term simulations when the number of features exceeds the number of traits.
Recent studies have also expanded the analysis of co-evolving networks and opinion dynamics by introducing frameworks that allow for more complex interactions. Qi et al. (2025) introduced a multi-dimensional, multi-option opinion dynamics model that shows how the spontaneous emergence of consensus, clustering, or polarization can occur independently of network structure. Such frameworks highlight how the complexity of interactions can drive unexpected cultural outcomes. Additionally, the impact of structural adaptations driven by homophily has gained attention in more recent models. Zhang et al. (2024) demonstrated that interventions designed to enhance homophily through content-based recommendations can exacerbate polarization, particularly when combined with misinformation reinforcement.
Research on complex networks has also expanded to include multilayer, temporal, and adaptive structures, illustrating that many real systems cannot be accurately represented by static or single-layer graphs Boccaletti et al. (2014, 2006). Studies of opinion formation and cultural dissemination on these network representations have demonstrated how emergent phenomena, such as consensus, polarization, and fragmentation can arise from multi-dimensional interactions among agents Qi et al. (2025). These frameworks have also been applied to policy diffusion Dobbin et al. (2007), sociolinguistics Hernández (2023), and contagious processes in epidemic modeling Reitenbach et al. (2024), highlighting the interdisciplinary relevance of these network-based approaches for understanding collective dynamics in social systems.
To provide a clearer comparison between different approaches related to the Axelrod model, we summarized the most relevant studies in Table 1. This table highlights the mechanisms introduced by each study, their methodologies, and their main conclusions. This table shows how our work differs from previous models, particularly regarding the introduction of dynamic rewiring mechanisms and their impact on cultural dissemination.

Table 1.
Comparison of studies related to the Axelrod model.
In this paper, we propose an evolving network model based on the original Axelrod framework, where agents are placed on the nodes of a complex network. However, unlike the static configurations commonly assumed, our network structure dynamically rewires according to cultural similarity. If two connected agents do not share at least one trait, their linking edge is removed and reconnected with other agents. The main objective is to investigate the final topology emerging from these adaptive rewiring processes and to characterize the resulting cultural configurations at the macroscopic level.
This work aligns with research on co-evolutionary game theory and games on networks, where agents’ states and the network structure evolve together Gross and Blasius (2008); Perc et al. (2013); Perc and Szolnoki (2010); Szabó and Fáth (2007). Unlike traditional evolutionary games where the topology remains static, the co-evolutionary models allow the network itself to adapt based on local interactions or global rules Gross and Blasius (2008); Perc and Szolnoki (2010). This co-evolutionary framework is particularly relevant to our study, as the rewiring process implemented in the modified Axelrod model dynamically alters the network topology in response to cultural dissimilarities. Such adaptive mechanisms are analogous to strategy updating rules found in co-evolutionary games, where interactions between agents shape not only their states but also the underlying network structure. Although we do not introduce payoffs or replicator dynamics as in traditional evolutionary games, our approach reflects the same idea of an adaptive or evolving network. Specifically, the rewiring process responds to local cultural dissimilarities, which in turn alters how future interactions occur.
2. Materials and Methods
In this section, we present the Axelrod model of cultural dissemination and our adaptive complex network variant inspired by it.
2.1. Complex Networks
In the original Axelrod model, agents were distributed on a two-dimensional lattice (often a small lattice such as agents), where each agent interacted with its immediate up, down, left, and right neighbors. Consequently, agents on the boundary of the lattice had fewer connections than those in the interior. According to Castellano et al. (2000), the absorbing state of the model can possibly be consensus (a single culture emerges) or disorder (multiple coexisting cultures), and it depends on the number of traits q.
Here, inspired by previous studies that employed the model on heterogeneous population structures, we consider agents as nodes of a graph, with the set of neighbors determined by the edges that a node has to other nodes.
In graph theory, a graph is a mathematical representation of a network, where V is the set of nodes, and E is the set of edges. Each node represents an entity (e.g., a person, a computer, or a location), and each edge is an unordered pair that indicates a connection or relationship between the two nodes i and j. When researchers began to work with random networks due to their flexibility and closer approximation to real-world problems, the term “complex networks” emerged. This designation is particularly apt when the networks are used in complex scenarios, i.e., when analyzing a single node does not yield an adequate description of the system, whereas a set of interconnected nodes can exhibit richer phenomena Boccaletti et al. (2014, 2006).
In network analysis, several key concepts describe how nodes and edges are organized. One important metric is the clustering coefficient of a node v. This coefficient measures the extent to which the neighbors of v form a complete subgraph and is given by
where is the number of edges among the neighbors of v, and is the degree of v. To characterize the overall tendency of nodes in a network to form tightly knit groups, one can compute the average clustering coefficient , defined as
where N is the total number of nodes in the network.
A path is a sequence of edges that connect a sequence of nodes, where no node appears more than once in the sequence. The average path length L quantifies how “far apart” nodes are, on average, by computing the mean of the shortest path lengths between all pairs of nodes i and j:
When looking at connectivity, a connected component is defined as a subset of nodes such that any node in the subset can be reached from any other node in the same subset. Finally, largest connected component is the connected component that contains the largest number of nodes. An important metric used to understand connectivity processes in complex networks is the relative size of the largest connected component, which is the size of the largest connected component divided by the number of nodes of G. This metric will be denoted here by .
One of the first random network models was introduced by Paul Erdős and Alfréd Rényi in 1959 Erdos and Rényi (1959). In their formulation, one considers n nodes and randomly selects e edges from the total possible connections, so that a fraction
of all potential links is actually realized in the network.
In 1998, Watts and Strogatz (1998) proposed a model that preserves the characteristic of the small average path length characteristic of Erdős–Rényi graphs but increases the clustering coefficient, thus better reflecting the features of many real social systems. Their procedure starts with a regular ring lattice, where each node is initially connected to its m nearest neighbors. A fraction p of these edges is then randomly rewired, maintaining largely local connectivity while introducing long-range shortcuts. In the special case , every edge is rewired, thereby yielding a fully random structure similar to that of the Erdős–Rényi model.
Another feature observed in many real networks is the “rich get richer” principle, whereby newly added nodes preferentially attach to those that already have a high degree. Empirical observations show that in such systems, the degree distribution often follows a power law of the form , where Albert and Barabasi (2002); Newman (2010). A distribution given by , with constants A and , is labeled scale-free.
Albert-László Barabási and Réka Albert proposed a network model based on preferential attachment Barabási and Albert (1999). In this model, the probability that a new node will connect to a node u is proportional to the degree of the node, , that is, . Here, Barabási-Albert networks are created using the number of edges that each node will connect as the only input.
There were applications of the Axelrod model on complex network structures. In Klemm et al. (2003), it is shown that, for small worlds, the rewiring probability of the generating algorithm increases the range of traits values where an ordered absorbing state is possible, while for scale-free networks, the existence of hubs increases the probability of an absorbing state. In a work studying cases where the number of features is larger than the number of traits, Dinkelberg et al. (2021) found that, while the existence of a consensus is not dependent of the topology, the velocity to reach consensus is.
2.2. The Adaptive Axelrod Model
The model proposed in this paper shares some features with the original Axelrod model. The main differences are the use of a complex network for the agent population, rather than a lattice, and the introduction of a dynamic topology whose connections change according to agents’ cultural features.
We consider a population of n agents arranged as nodes in a complex network, where each node corresponds to one agent. Each agent has F cultural traits, and each trait can take one of q possible characteristics, following the original setup of Axelrod. During each time step, a randomly chosen agent interacts with its immediate neighbors (i.e., nodes to which it is directly connected by an edge). If two interacting agents share no cultural trait in any feature (i.e., have zero cultural overlap), their connecting edge is removed, starting a rewiring process.
In the rewiring process, once an edge between nodes u and v is removed—focusing on node u’s perspective—we search for a new connection within a set . This set includes all nodes located within a maximum distance R from u, with ensuring that the search extends beyond u’s existing neighbors. The probability of u connecting to a potential neighbor is proportional to , where is the degree of node z, and is a tunable parameter ranging from 0 to 2. Expression (1) defines the probability of node u connecting to node z.
At the beginning of the simulation, each individual is assigned F integer values of cultural features randomly drawn from the interval . The networks are randomly generated using the respective parameters for Barabási–Albert and small-world models, which is connections per node for Barabási–Albert, and of rewiring probability, and for connections with neighbors per node for small world. We used the NetworkX package for Python 3.10 to generate the networks Hagberg et al. (2008).
One of our objectives is to emphasize the effects of the Axelrod adaptive dynamics on the topology of the complex network, so we choose as output variables the number of unique cultures at the end of the simulation, the relative size of the largest connected component , the clustering coefficient , and the average shortest path length .
The simulations begin by listing all possible parameter combinations of n, q, R, , and network type, with each combination being simulated 250 times. One combination simulation concludes when every node is surrounded by the neighbors of the same culture. Considering this convergence criterion, if there is a single edge where both nodes do not share any cultural traits, those nodes would be unable to rewire or exchange cultural traits, and the simulation would never end.
All parameters and output variables of the model are summarized in Table 2. The only parameters directly related to the original Axelrod model are F and q.
Table 2.
Parameter definitions, possible values, and model outputs.
The parameters q and n directly influence the time to convergence, as q increases the number of possible cultures and n expands the number of potential interactions. The chosen range of these parameters balances computational demand and model complexity. For R, the parameter range was determined after preliminary tests indicated that, within this range, the size of the neighborhoods would not exceed 50% of the network. For , the range was selected to capture the changes in topology resulting from the transition from random rewiring to weak and then strong preferential attachment.
3. Results
In this section, we present the results of our simulations to understand how the proposed adaptive Axelrod model influences network topology and cultural diversity. We begin with a simple visual analysis that evaluates the impact of individual model parameters on key output metrics such as the average clustering coefficient, average path length, and the number of unique cultures. Following this, we present a correlation analysis to quantify the relationships between input parameters and output variables, providing an overview of how various factors interact. We then analyze how specific parameters, such as R and , affect the average clustering coefficient, average path length, and cultural diversity. Additionally, we explore the combined effects of these parameters using heatmaps to illustrate complex interactions. Finally, we apply a linear regression model to obtain quantitative estimates of how the model parameters influence network structure and cultural diversity.
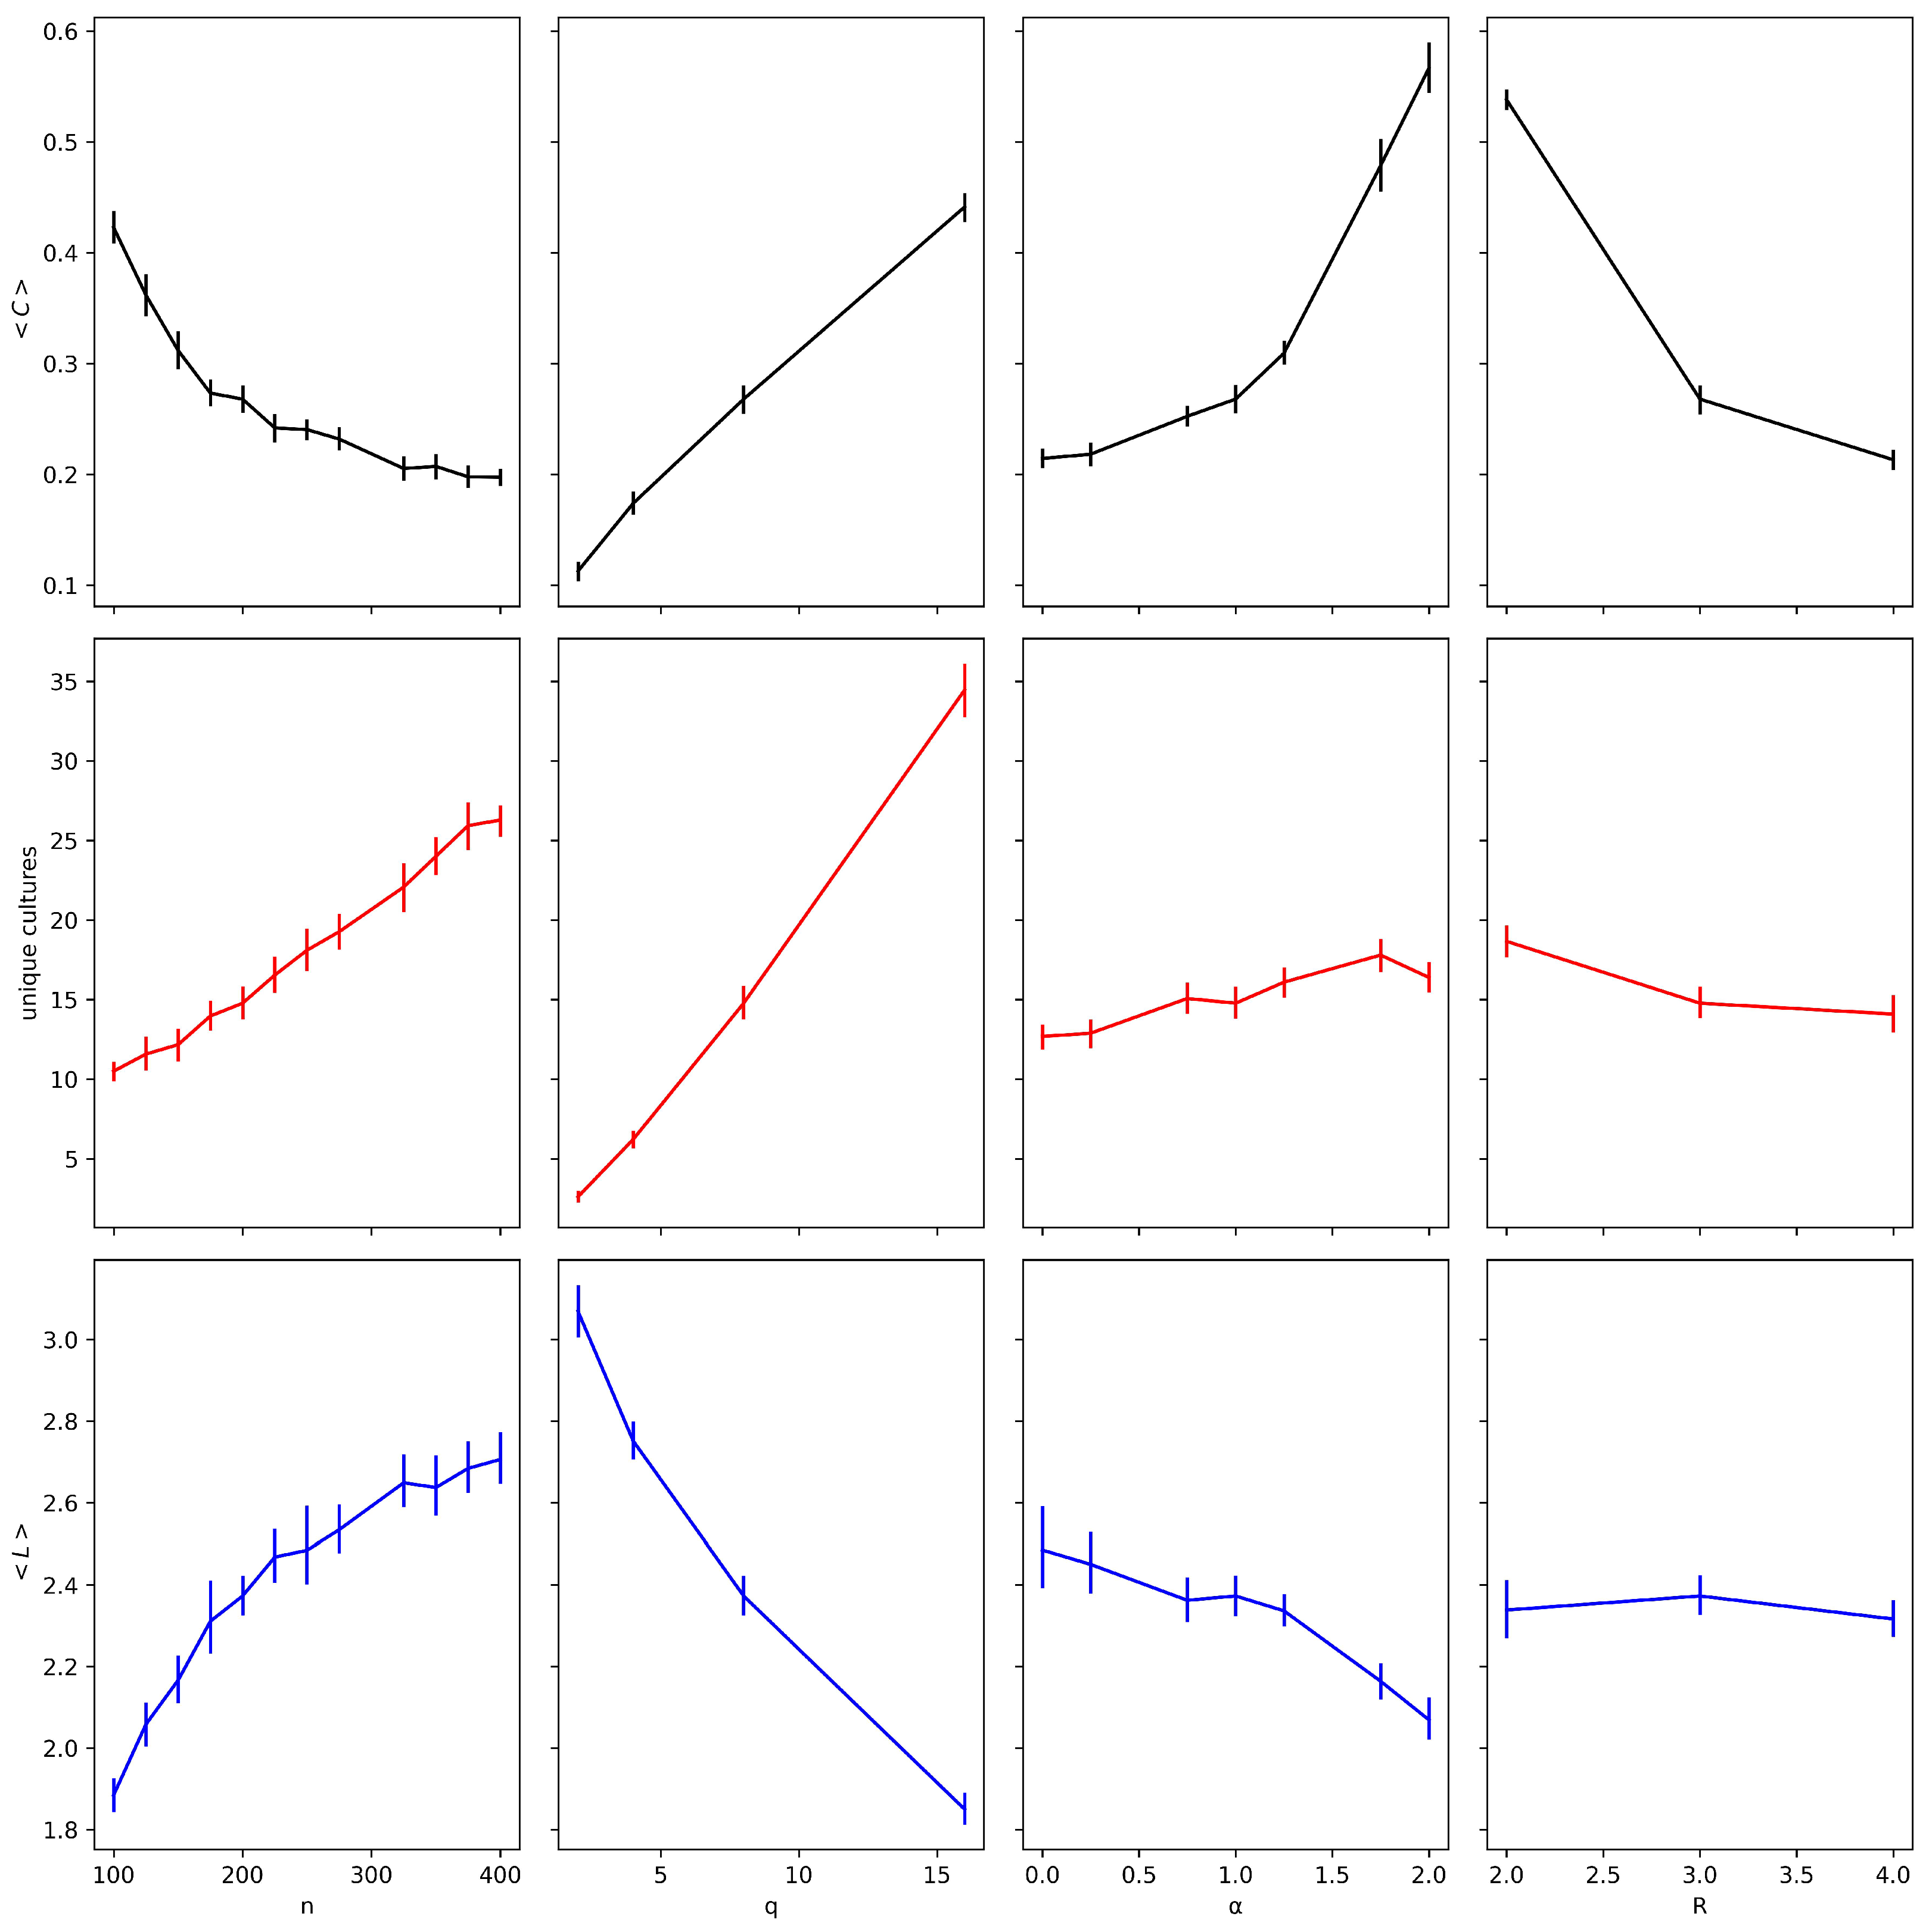
Figure 1 presents a simple visual analysis to understand how varying a single parameter affects the model outputs. For these simulations, we fixed , , , and , while varying the respective parameter according to each scenario. Increases in network size and neighborhood radius R result in a decrease of . The inverse relationship with R implies that searching far from immediate neighborhoods reduces the likelihood of forming triangles or transitivity relations. The effects of q, R, and are more pronounced than the effect of n. When considering the average path length , and R exhibit weak effects—positive and negative, respectively—while q causes the largest positive variation. Finally, for the number of unique cultures, n, q, and are the most influential parameters, whereas R has a weak, almost negligible impact on its own. It is important to note that, in our model, the parameters interact in nonlinear ways, as previously observed.
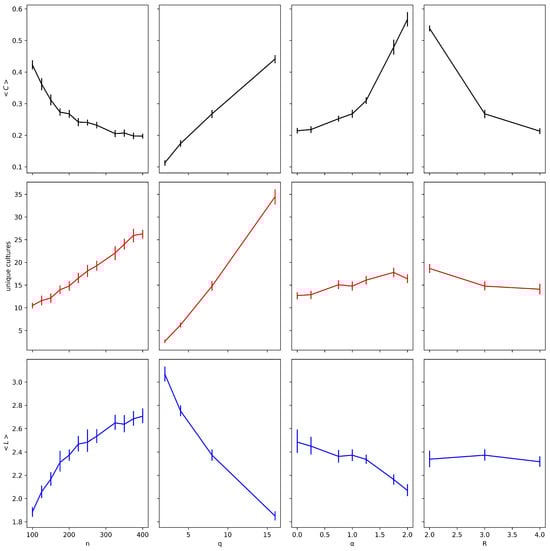
Figure 1.
Visual analysis illustrating the effect of varying individual parameters on each model output. The plots show how changes in network size n, neighborhood radius R, trait diversity q, and preferential attachment exponent influence the average clustering coefficient , average path length , and the number of unique cultures. Error bars represent 95% confidence intervals.
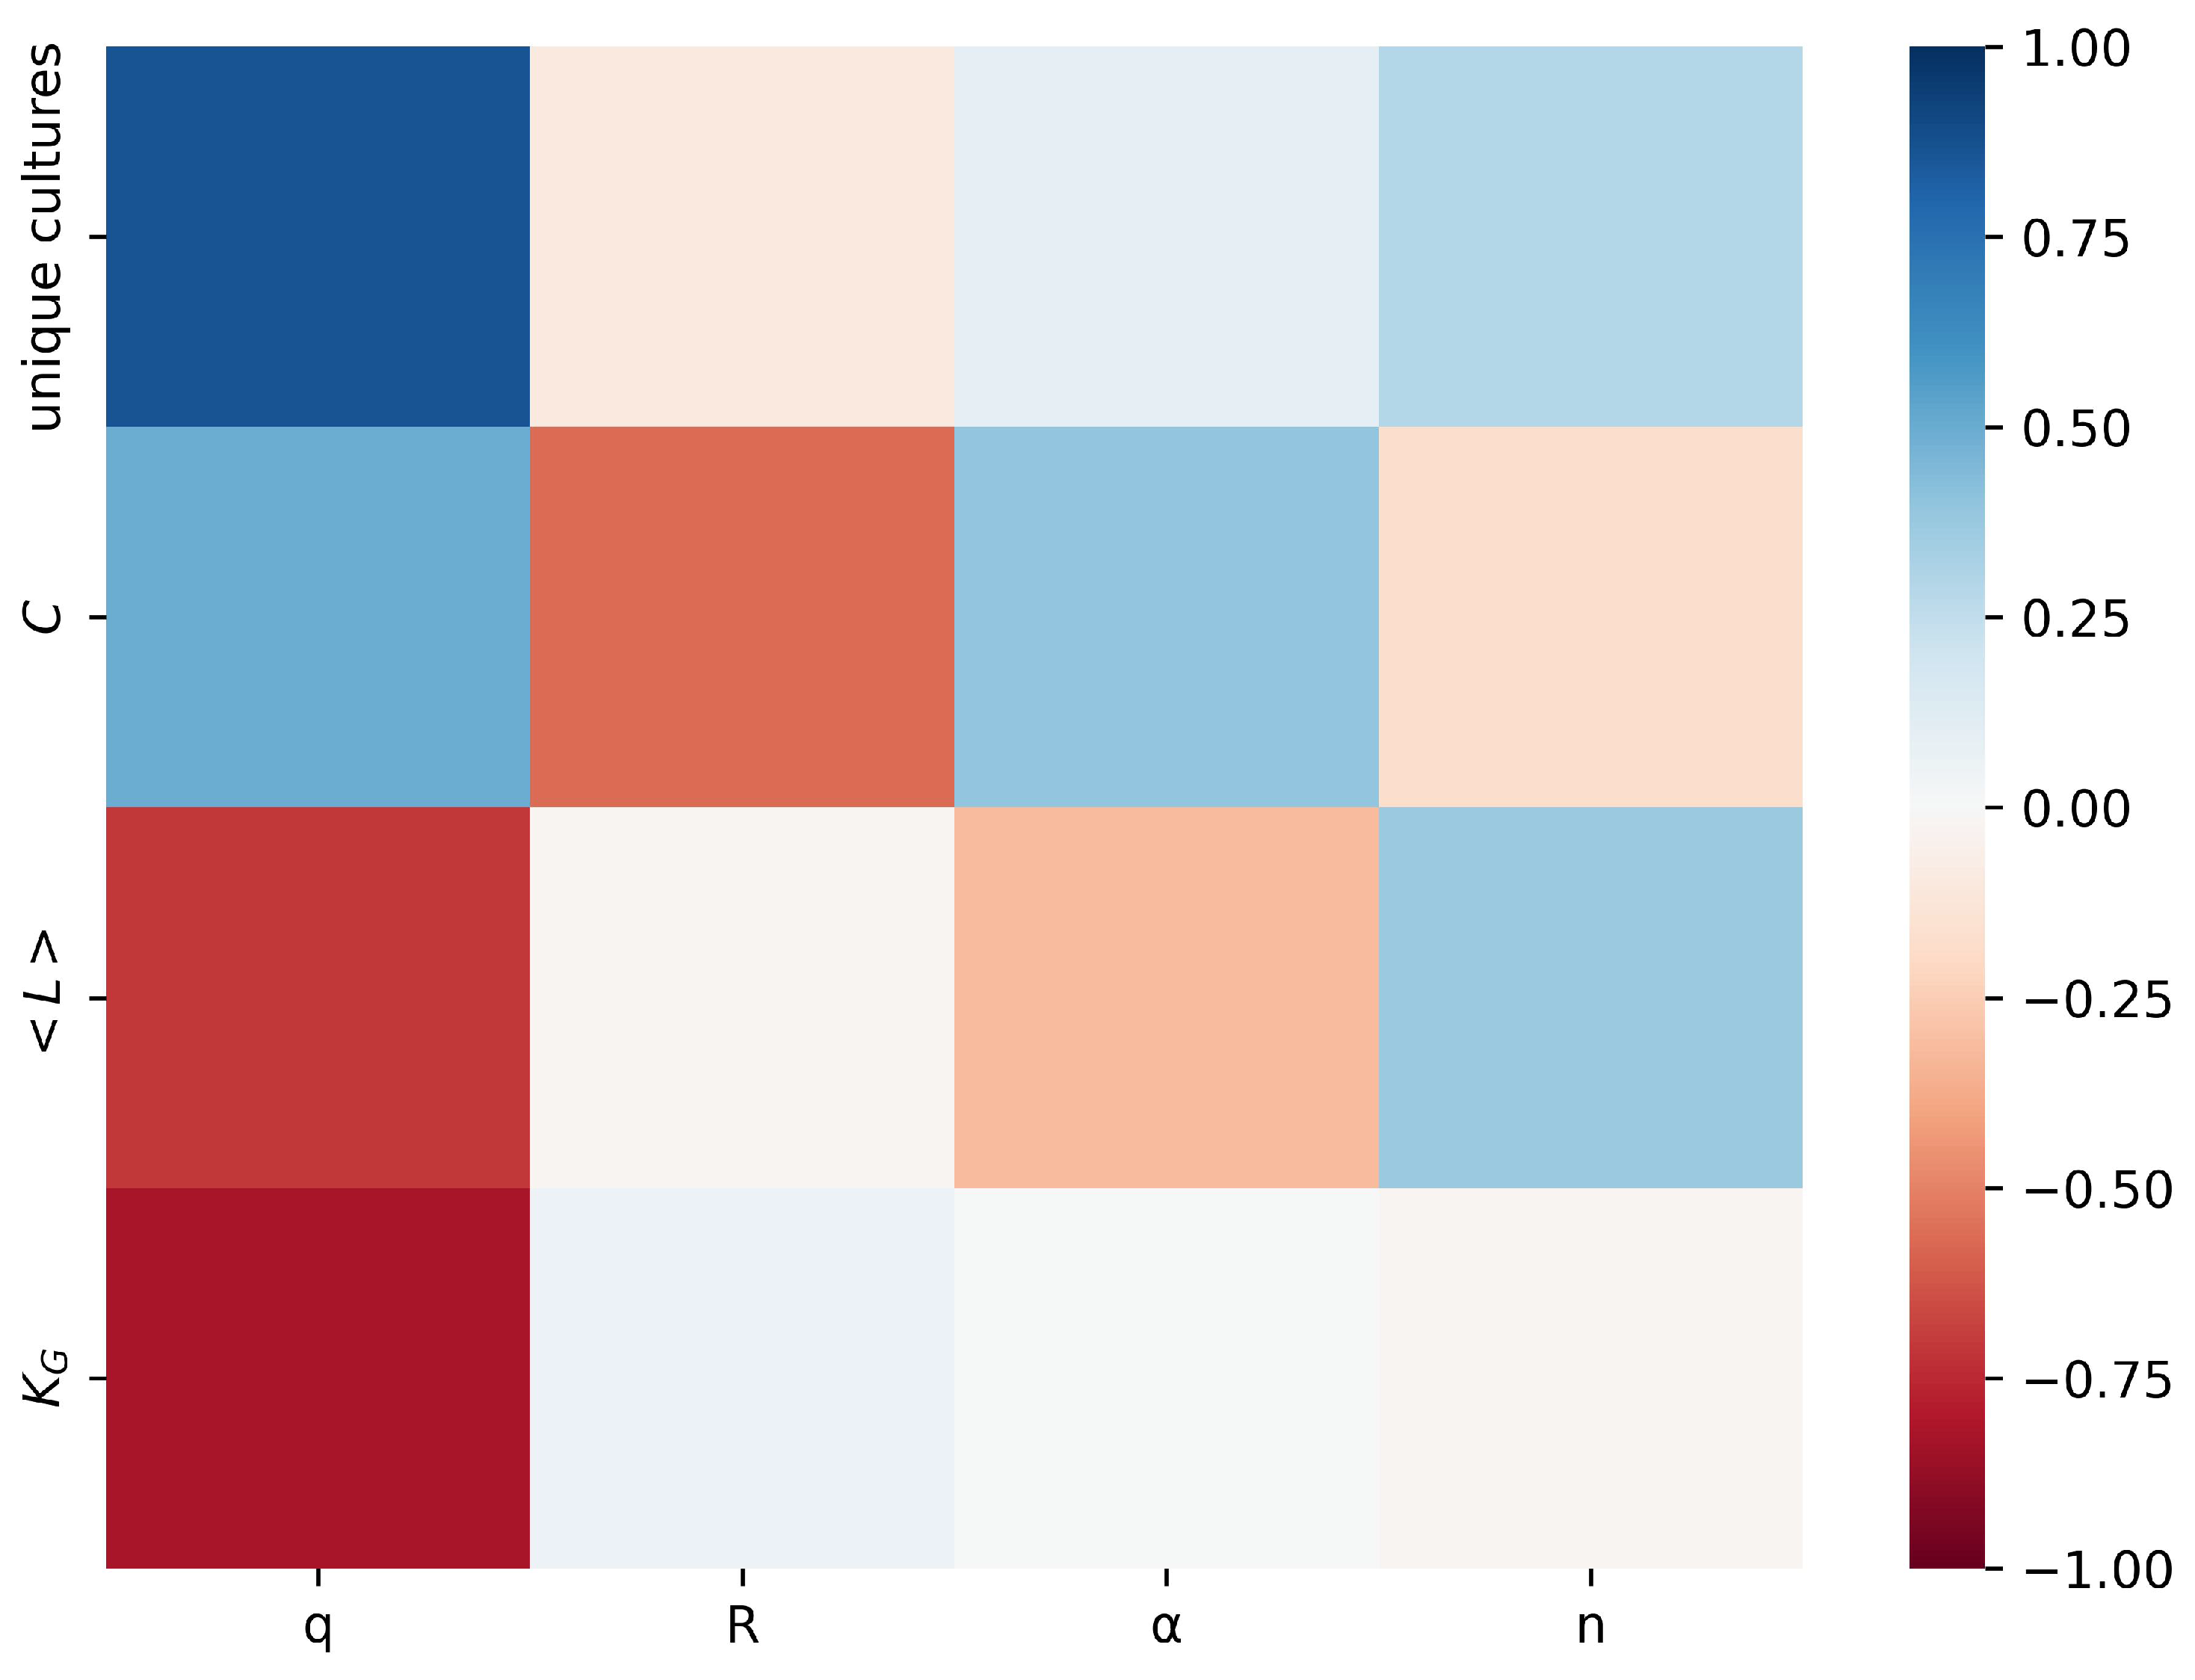
To assess how model parameters influence the resulting network topology and cultural diversity, we first a show correlation matrix in Figure 2. The correlation matrix shows the relationships between input parameters (q, R, ), and network size (n) and the model’s output variables: number of unique cultures, size of the largest connected component (), average clustering coefficient (), and average path length (). Each cell in the matrix displays the correlation coefficient between two variables, with positive correlations indicated by darker shades of blue and negative correlations by darker shades of red. The magnitude of the correlation is represented by the intensity of the color, ranging from −1 (strong negative correlation, shown as dark red) to 1 (strong positive correlation, shown as dark blue). Zero correlation is represented by white. As the correlation value approaches zero from either direction, the colors gradually transition to lighter shades of blue or red. For example, the positive correlation between q and the number of unique cultures indicates that increasing the number of traits results in greater cultural diversity. Conversely, the negative correlation between R and the average clustering coefficient suggests that a larger rewiring radius diminishes local clustering. This matrix serves as an overview of how various parameters interact and influence the model’s outcomes, providing a foundation for the more detailed analyses presented in the following sections.

Figure 2.
Correlation matrix illustrating the relationships between input parameters (q, R, , n) and model output variables: number of unique cultures, size of the largest connected component (), average clustering coefficient (), and average path length (). Positive correlations are represented by shades of blue, with darker shades indicating stronger correlations, while negative correlations are represented by shades of red. Zero correlation is displayed as white. The intensity of the colors reflects the magnitude of the correlation, ranging from −1 (strong negative correlation) to 1 (strong positive correlation).
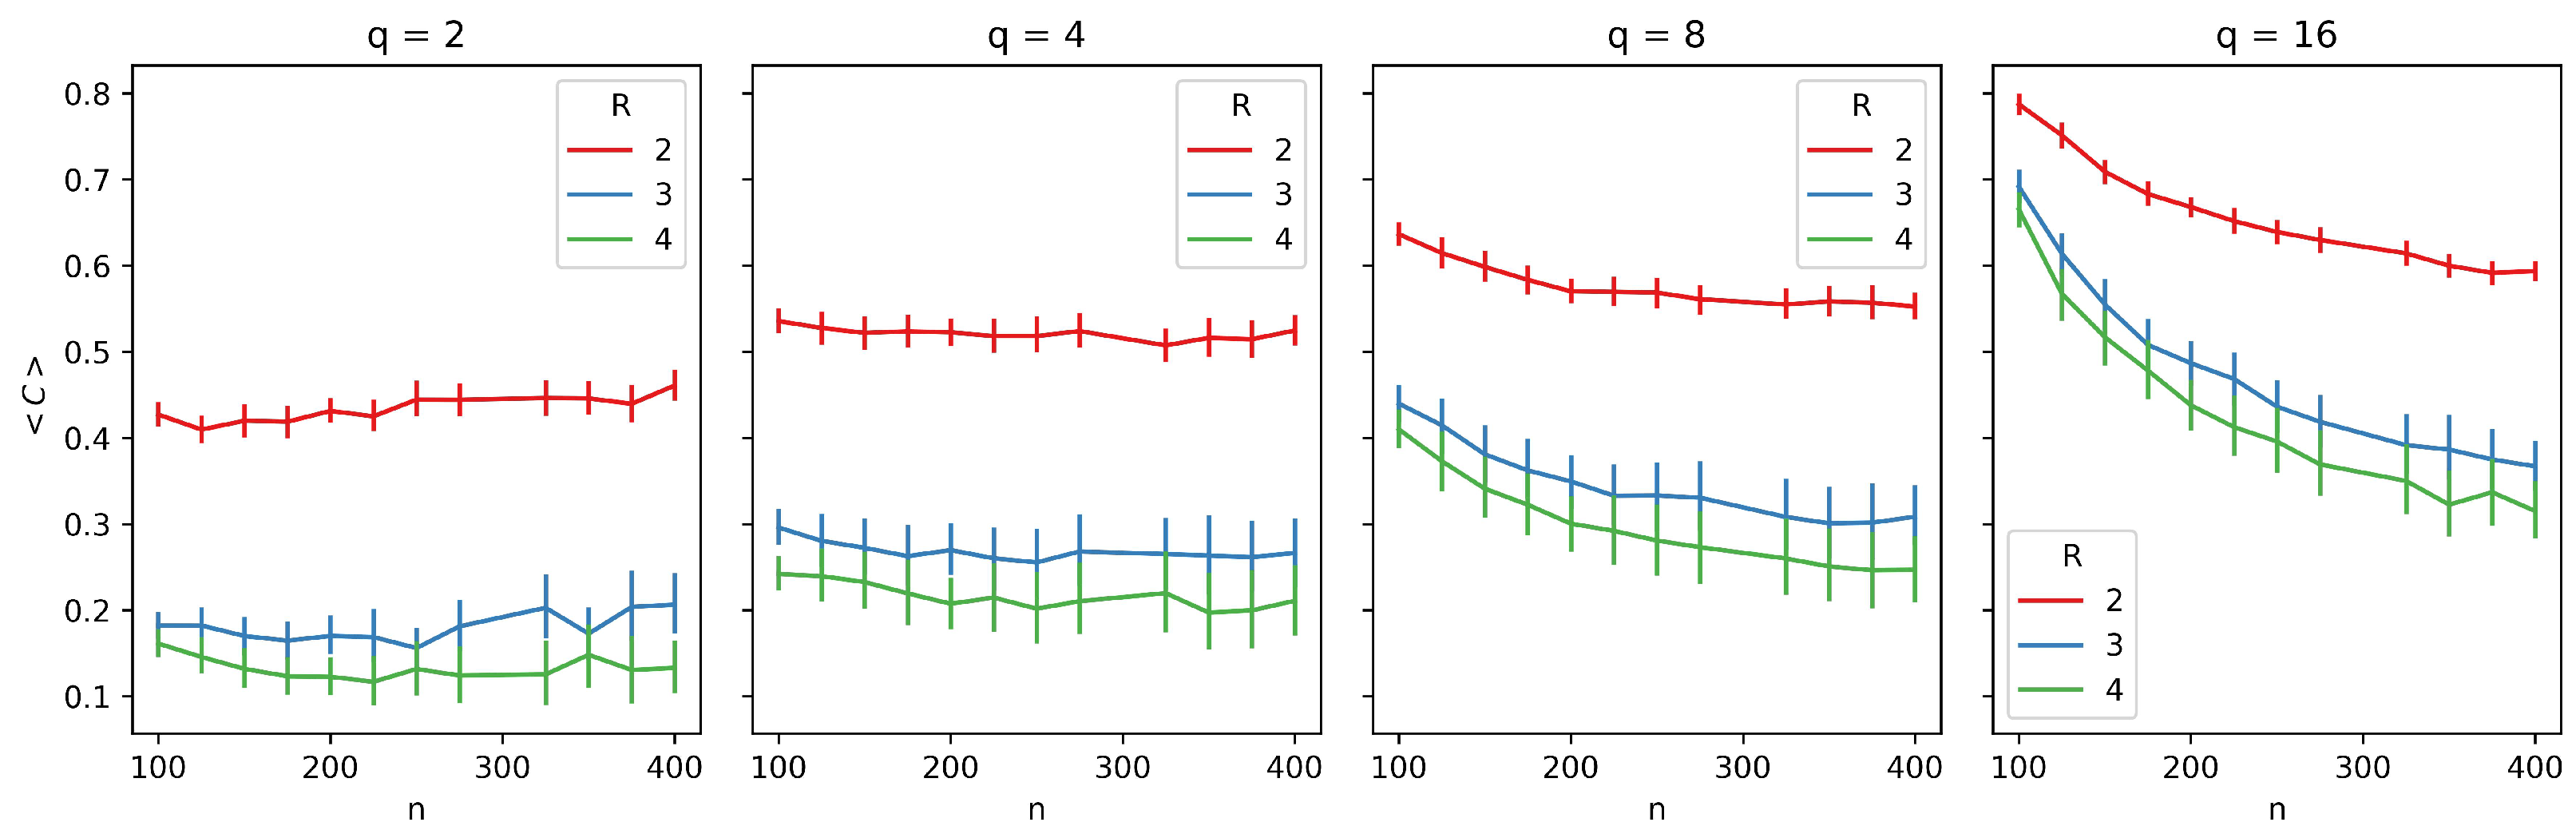
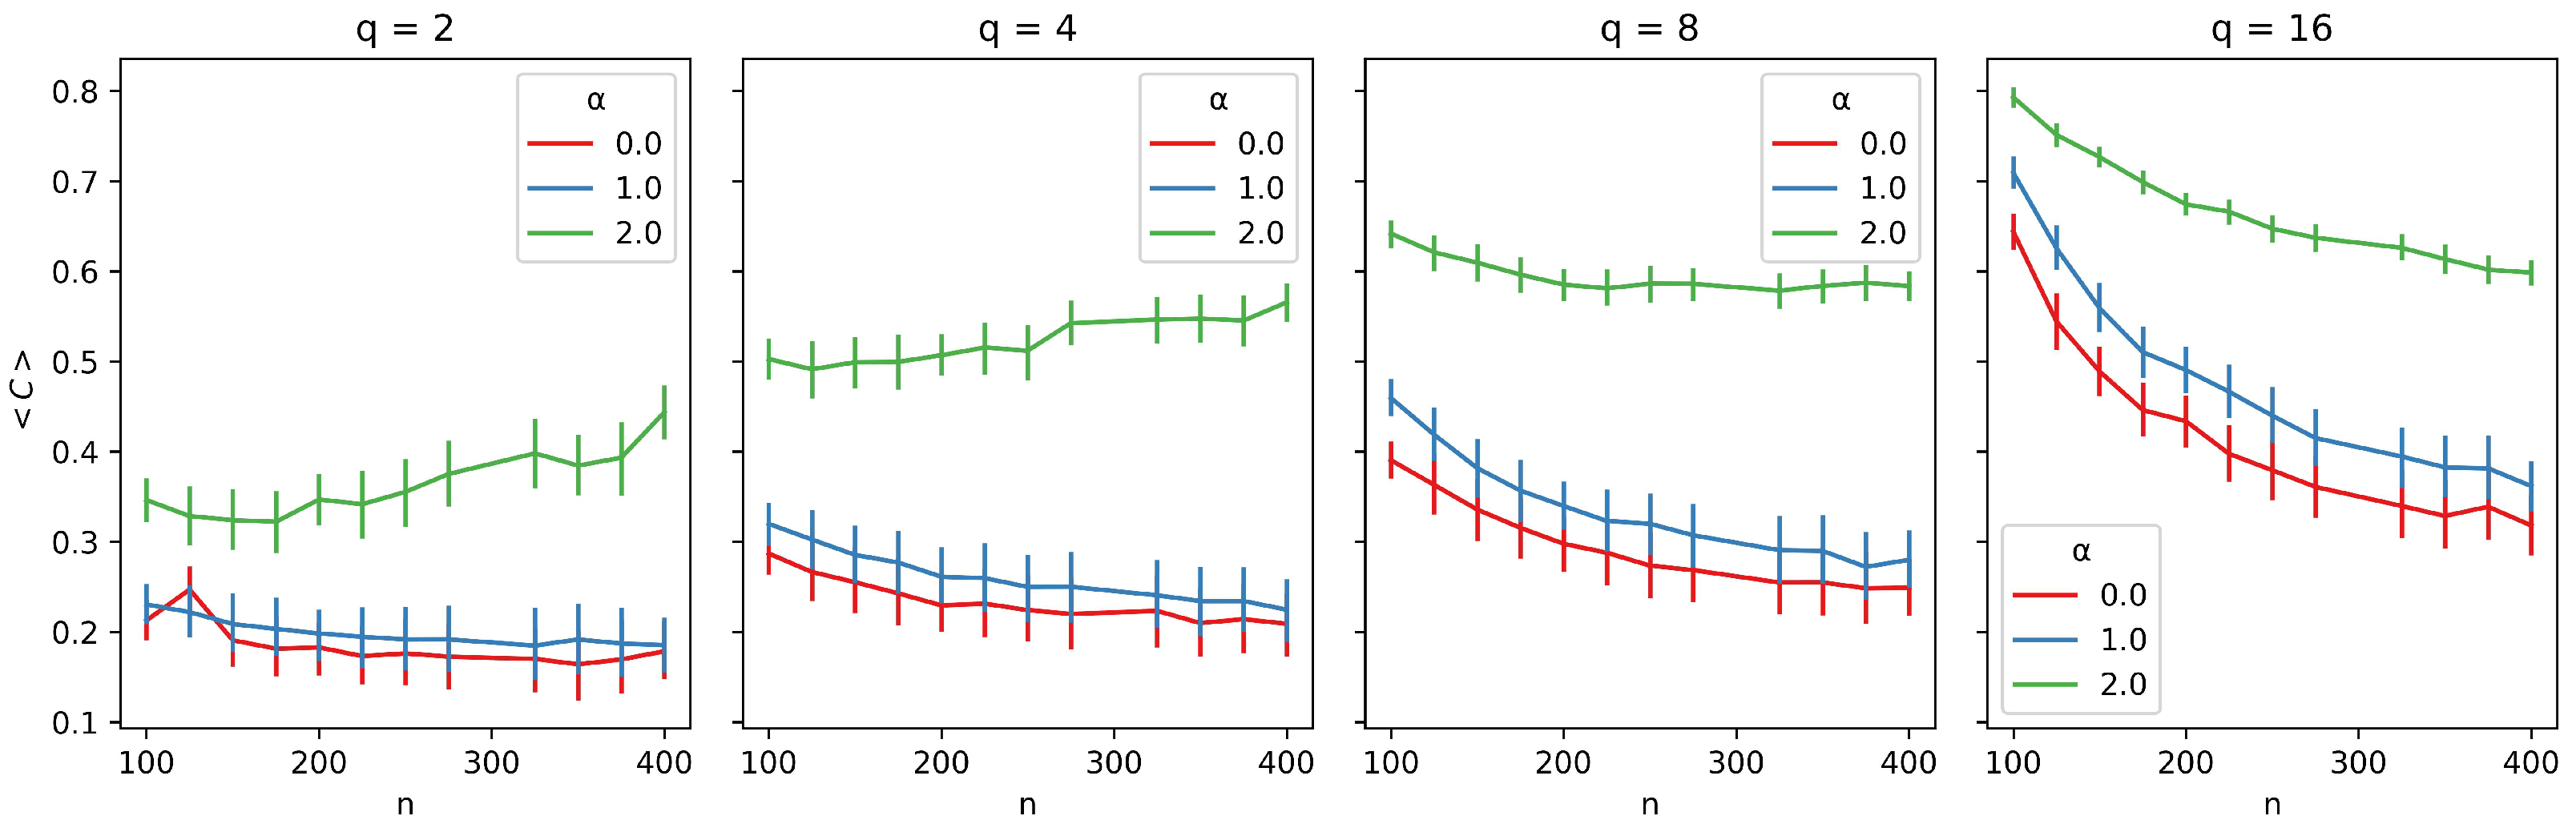
In Figure 3, we present the average clustering coefficient for different network sizes. Each plot corresponds to a different value of q, and within each plot, we present three curves, each representing a different value of R. We observe that larger values of R generally result in lower average clustering across all cases. However, the slope of the curves varies with different values of q. For and , the slope is slightly positive, while for the other R values, the curves are nearly flat. As q increases, the slopes of the curves become increasingly negative. For , cultural diversity is low, making it easier to maintain local connections. However, for larger values of q, individuals tend to rewire more frequently within their neighborhoods, searching for new acquaintances.
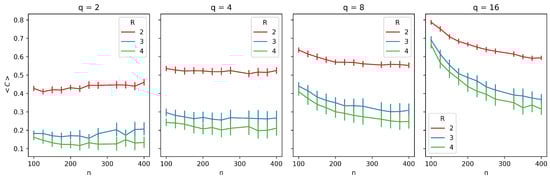
Figure 3.
Average clustering coefficient () as a function of network size (n) for different neighborhood radii (R). Each plot corresponds to a different number of traits (q), with curves representing varying values of R (, , ). Error bars represent 95% confidence intervals, providing a measure of the robustness of the observed trends.
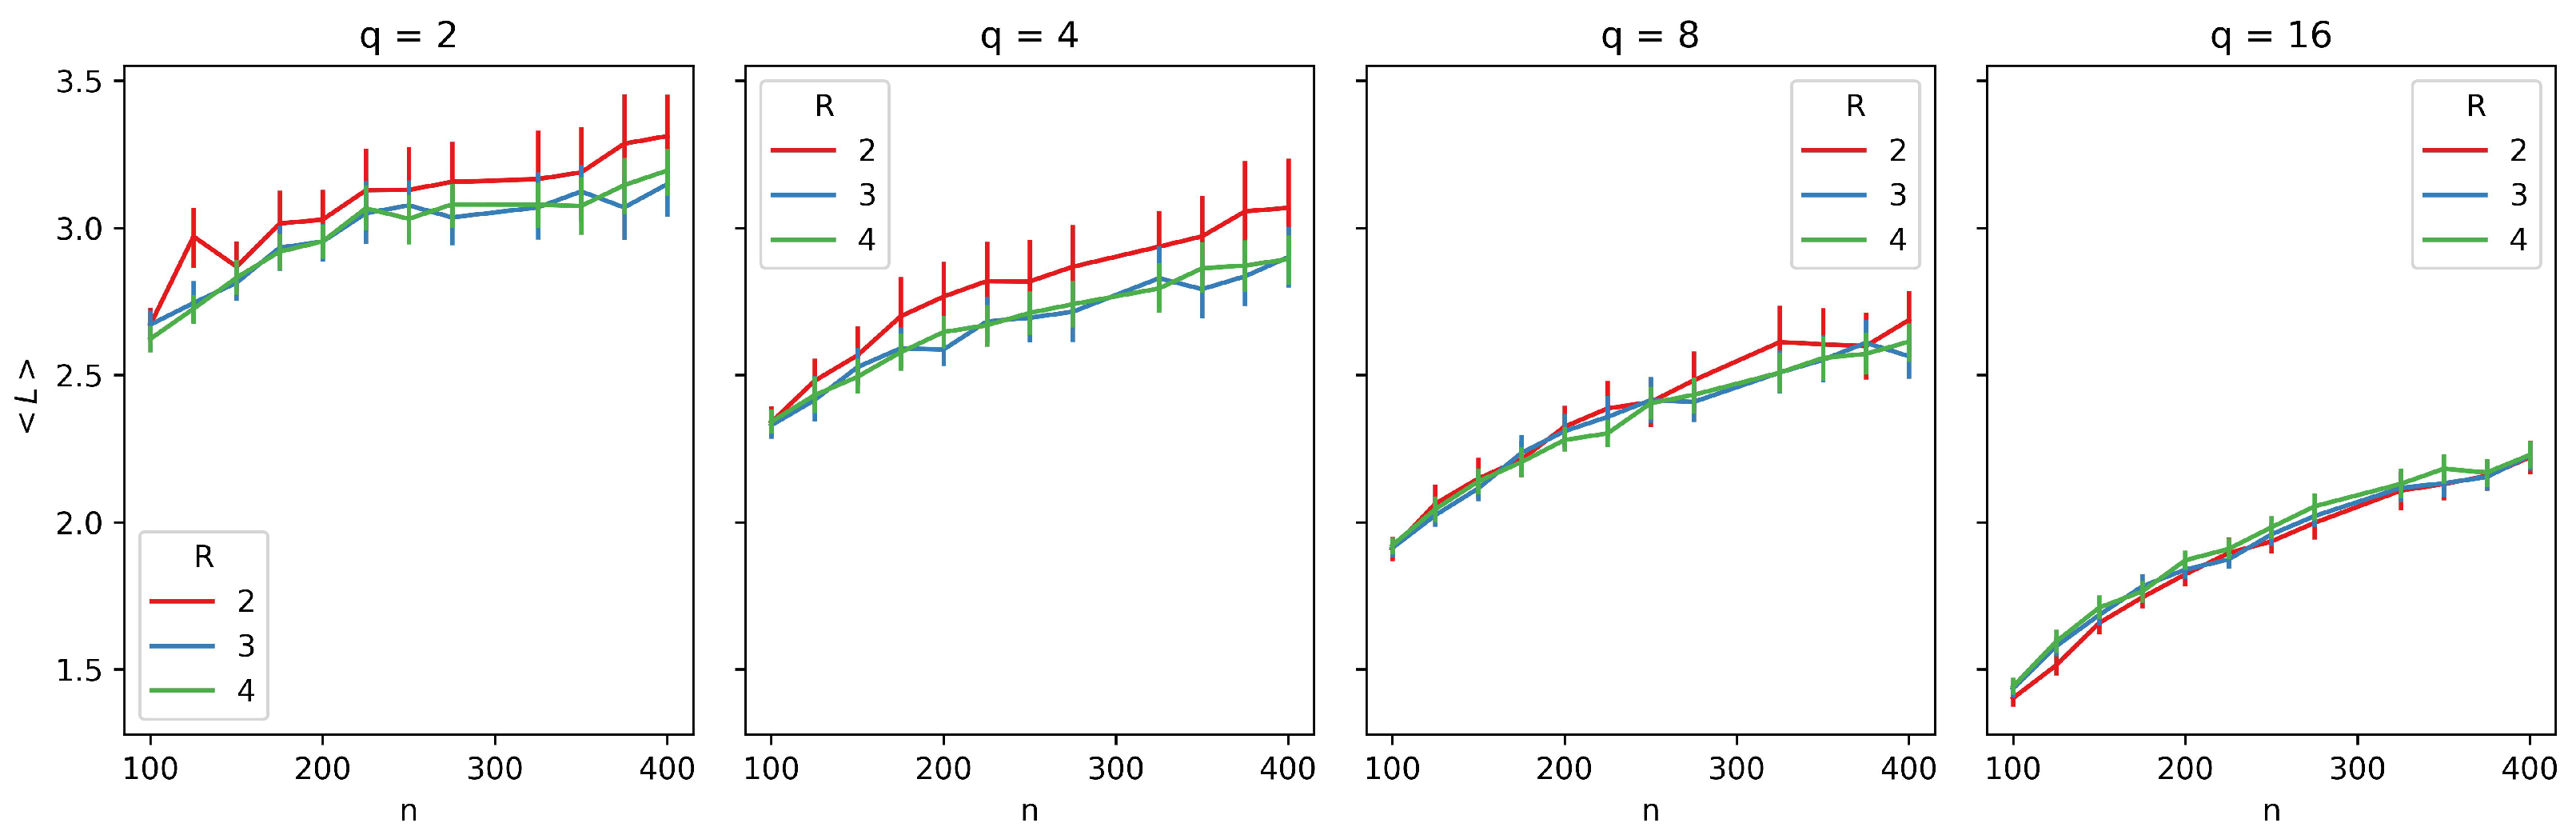
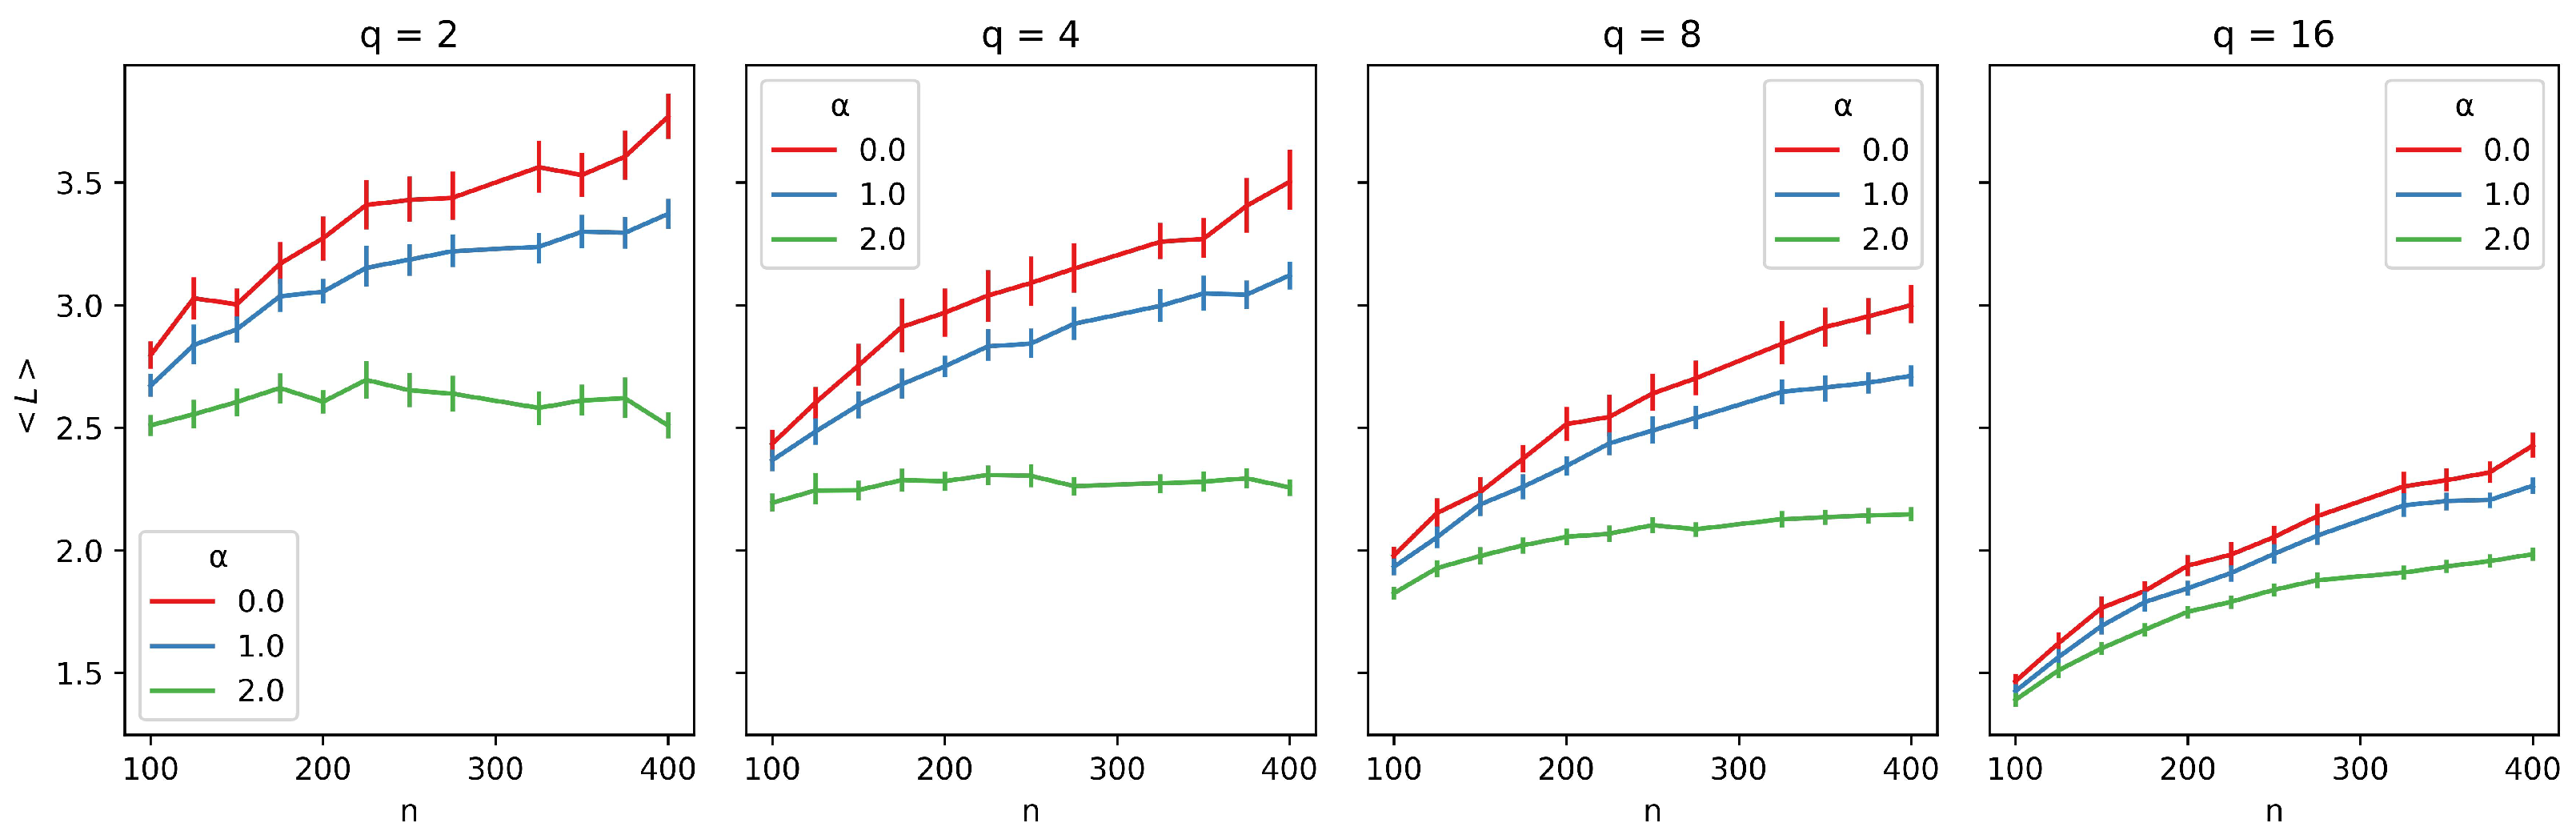
We repeat the same analysis for Figure 4. As previously suggested by the correlation analysis, R does not appear to influence the average path length as much as it influences the clustering coefficient. However, we can observe that, for , the average path length decreases because a larger R provides greater opportunities for non-local connections. The average observed values also decrease with increasing q. This effect can be explained by the fact that the average path length is calculated over all components, and as suggested by Figure 2, the largest connected component tends to shrink as q increases. Additionally, the curves seem to exhibit a logarithmic pattern.
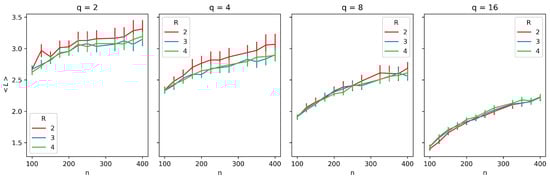
Figure 4.
Average path length () as a function of network size (n) for different neighborhood radii (R). Each plot corresponds to a distinct number of traits (q), with curves representing varying values of R (, , ). Error bars represent 95% confidence intervals, providing a measure of the robustness of the observed trends.
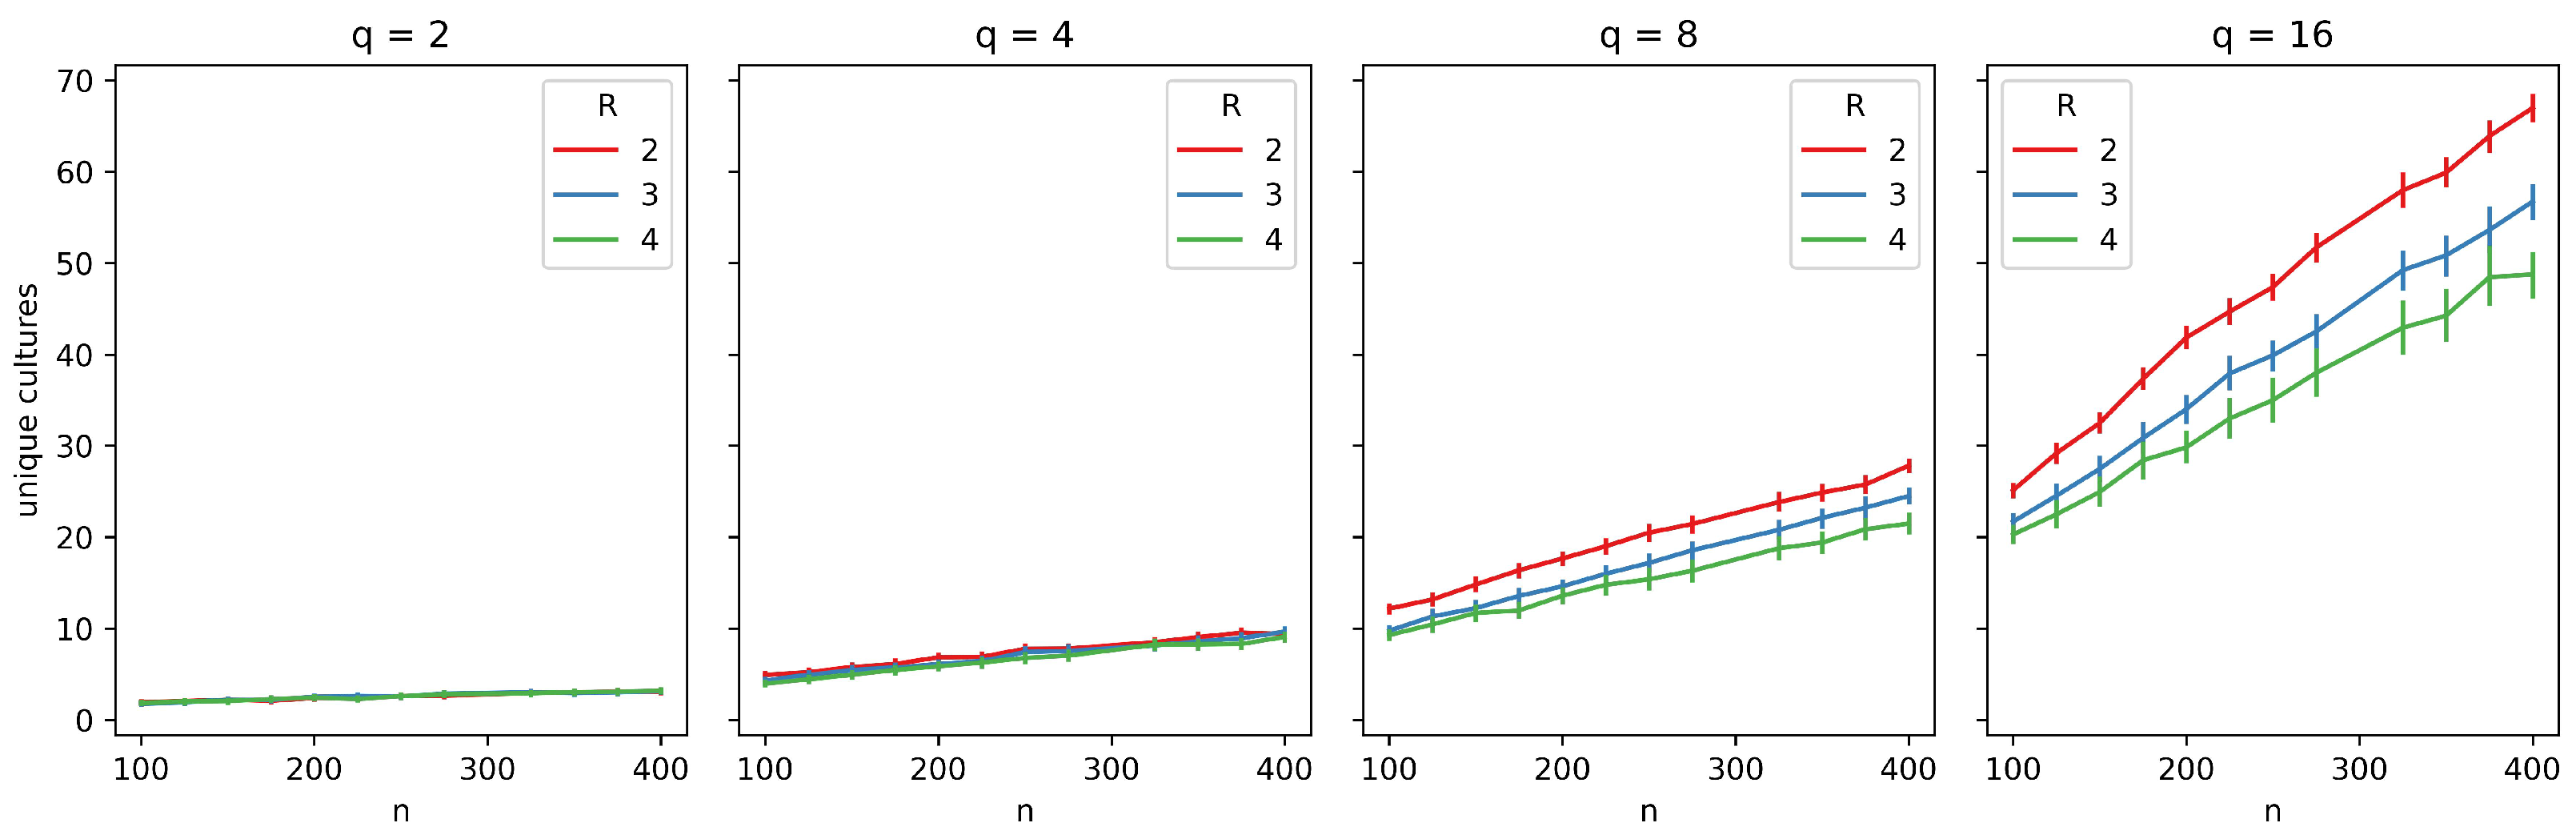
We also evaluate how the number of cultures varies with network size in Figure 5. For a small q, the number of cultures tends to converge to a single culture most of the time. However, for higher values of q, cultural diversity emerges. Additionally, the number of unique cultures is, on average, larger for smaller values of R.
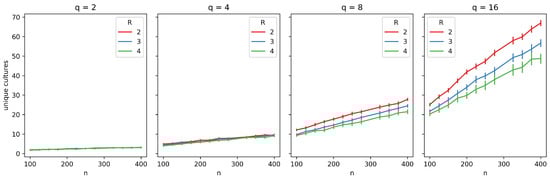
Figure 5.
Average number of unique cultures as a function of network size (n) and neighborhood radius (R). Each plot corresponds to a different number of traits (q), with curves representing varying R values (, , ). Error bars indicate 95% confidence intervals, providing a measure of variability and robustness of the observed trends.
Now, we evaluate in more detail the effects of , which represents the rewiring mechanism, as shown in Figure 6. When , the average clustering is consistently higher across all network sizes, while the average shortest path length is always smaller, as demonstrated in Figure 6.
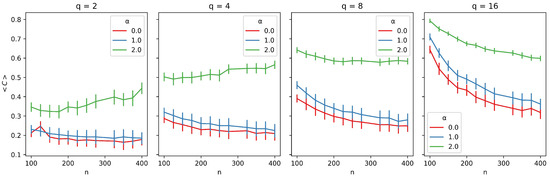
Figure 6.
Average clustering coefficient () as a function of network size (n) for different values of the rewiring exponent . The plot displays results for , , and , illustrating how stronger preferential attachment () consistently produces higher clustering across all network sizes. Error bars represent 95% confidence intervals, highlighting the robustness of the observed trends.
The positive effect between and the average clustering coefficient can be explained by the fact that higher-degree nodes usually participate in a larger number of cliques. Setting enhances the rich-get-richer effect. Higher-degree nodes also tend to exhibit larger betweenness centrality and provide more efficient paths throughout the network. Consequently, the average path length is shorter for higher values, as shown in Figure 7.
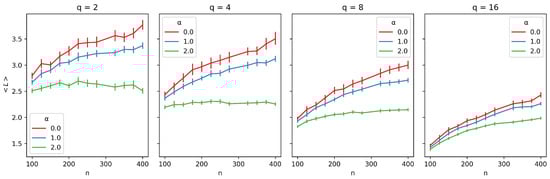
Figure 7.
Average path length for different network sizes and values. The plot contains 95% confidence interval error bars.
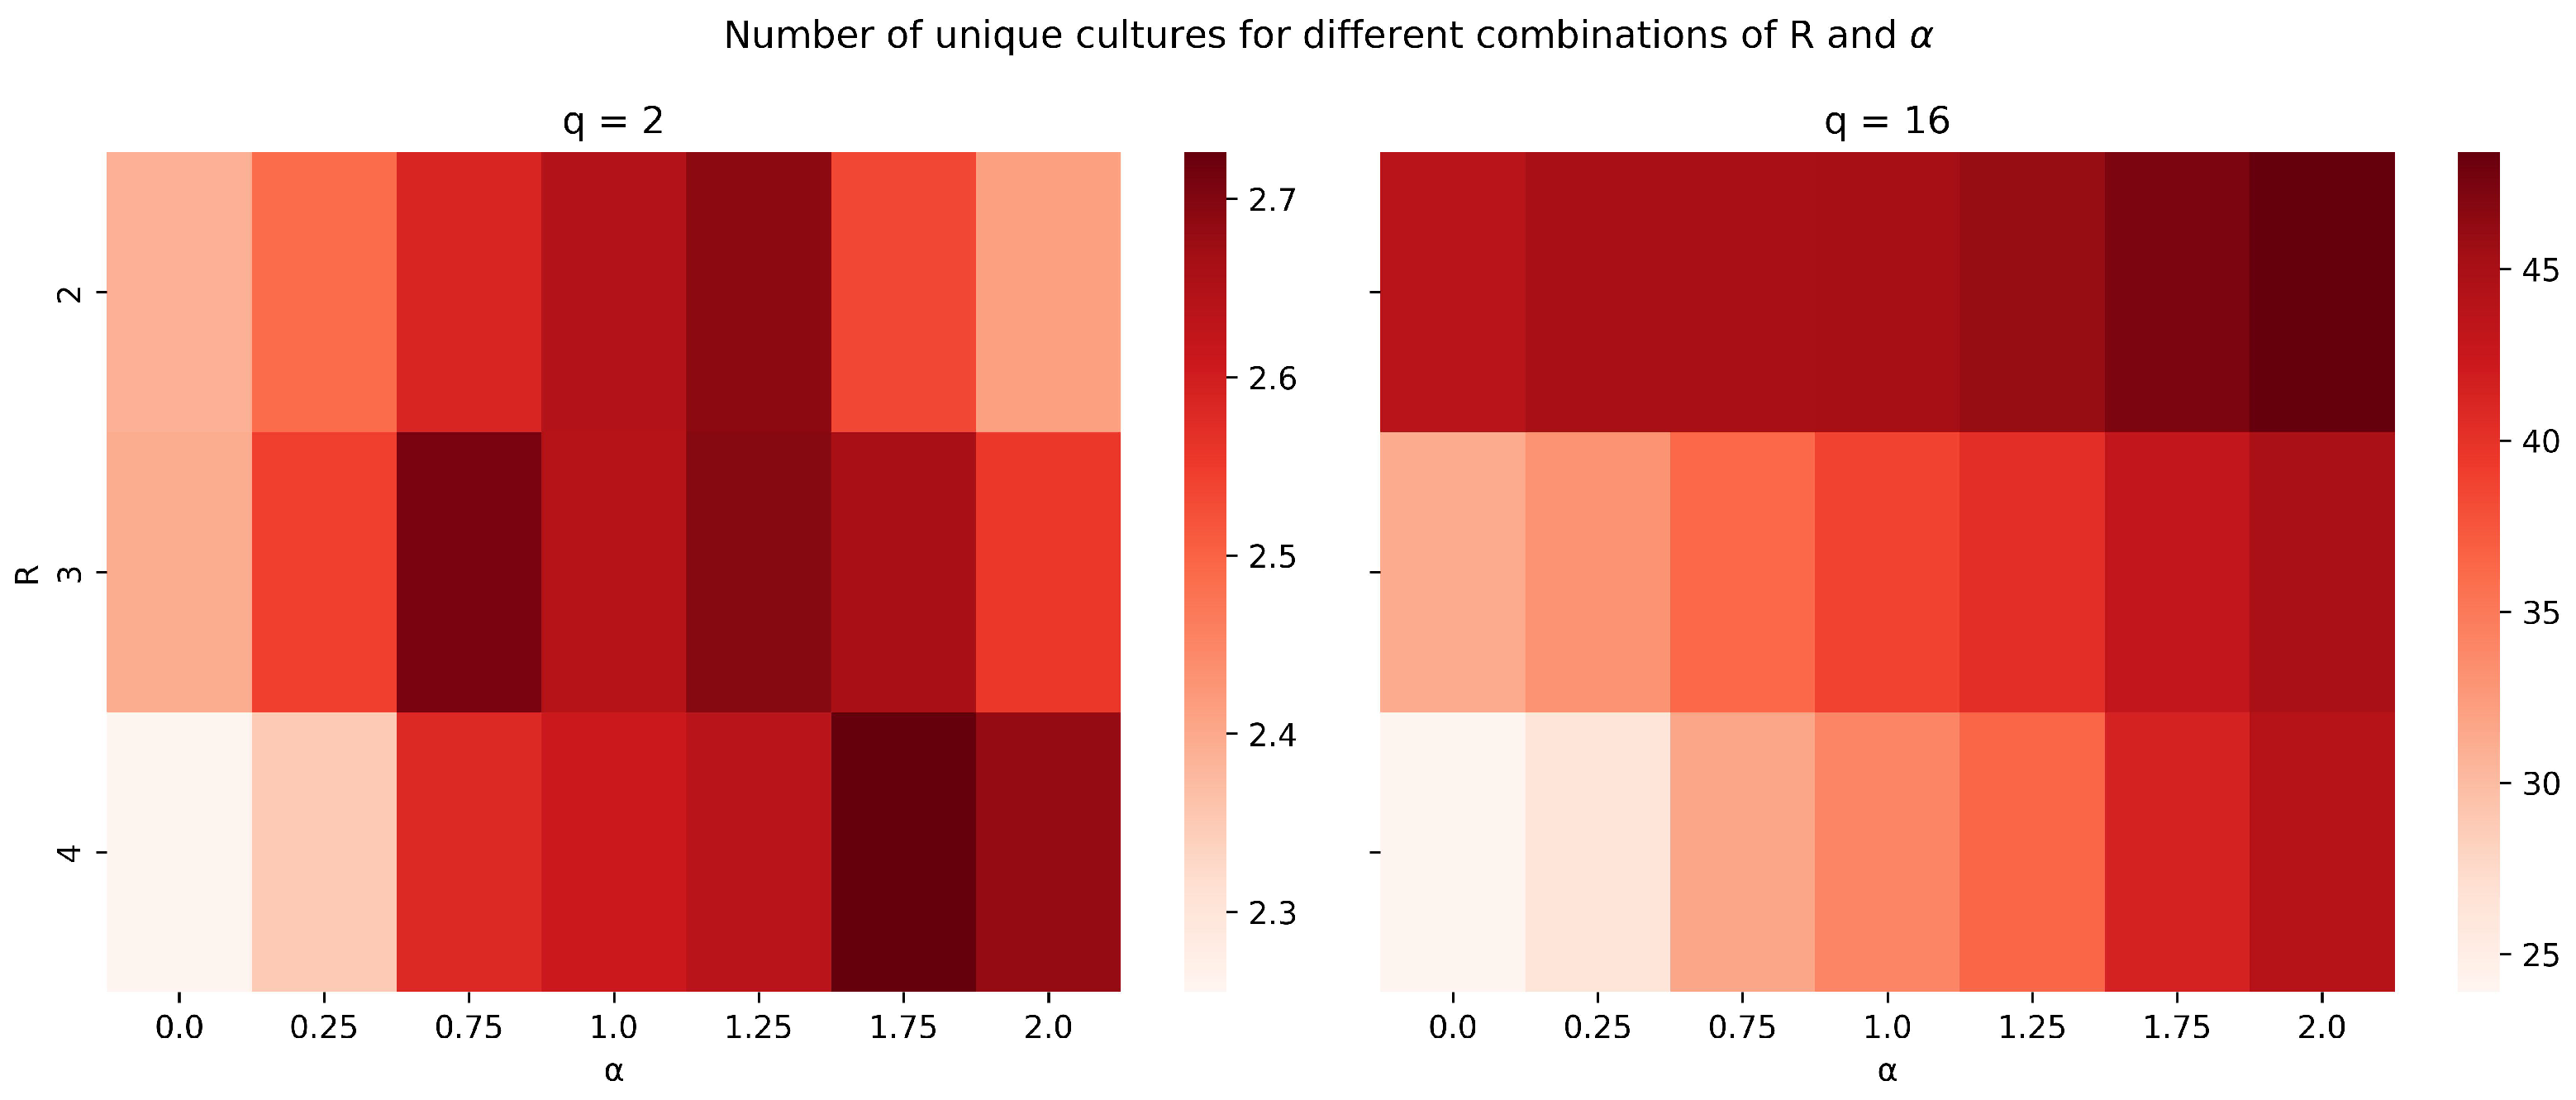
Now, with a clearer understanding of how the model parameters individually influence the network topology, we proceed to evaluate how their combined effects impact the number of unique cultures. Figure 8 presents heatmaps illustrating the relationship between the rewiring parameters and R for two different values of q (specifically, and ). Each heatmap shows the average number of unique cultures resulting from simulations under various combinations of and R. The color intensity reflects cultural diversity, with darker shades representing higher numbers of unique cultures.
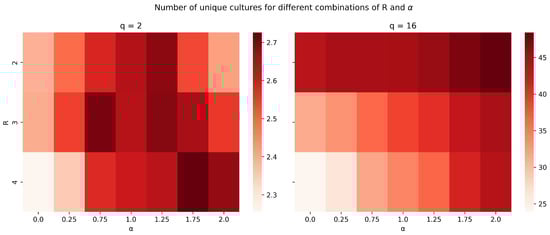
Figure 8.
Heatmaps for the number of unique cultures with different combinations of and R.
These heatmaps demonstrate that, when , the model tends to converge toward two to three cultures for most parameter combinations with a quite irregular pattern. However, for , the scenario is partially inverted. Cultural diversity is better preserved when individuals do not try finding new friendships outside their bubbles. They should instead prioritize influential individuals closer to their own circles as local cultural references.
The figure highlights how adjusting both rewiring parameters can produce different cultural landscapes, with stronger preferential attachment () generally promoting diversity, especially under conditions of limited local search (R). This visualization provides a comprehensive overview of how and R interact to influence the final number of unique cultures, supporting the interpretation of the model’s behavior presented in the correlation matrix.
All the previous steps were necessary to provide an intuitive understanding of the model results. To achieve a more quantitative understanding, we now apply a linear regression model based on ordinary least squares to obtain the estimates of how the model parameters influence network structure and cultural diversity. The outputs of the linear regression model and the coefficients for each parameter of the adaptive voter model are presented in Table 3.
Table 3.
Regression model coefficients for each output metric. All coefficients are statistically significant with p-values ≤ 0.05, indicating strong relationships between model parameters and outputs.
The regression coefficients provide valuable insights into the relationships between the model parameters and the output variables. Specifically, the positive coefficients for and q in relation to the number of unique cultures suggest that stronger preferential attachment and higher trait diversity each promote cultural heterogeneity. Conversely, the negative effect of R on indicates that a broader search radius during rewiring tends to diminish localized clustering patterns. The relatively high values across the models demonstrate that the chosen parameters collectively explain a substantial portion of the observed variation in network structure and cultural outcomes, thereby affirming the robustness of the proposed model.
4. Discussion
The adaptive Axelrod model, compared to the original Axelrod model, allows a more in-depth study of the differences between neighborhood structures (different initial topological structures) and the effects of evolving social dynamics, which are important aspects of real social networks. The role of preferential attachment, which can be associated with the role of prestige or reputation, is an important element of online social networks such as X or Instagram where digital influencers with thousands of followers encourage the discussion of hot topics, the consumption of products and the adoption of new cultural traits.
Many works around the Axelrod and other cultural diffusion models are concerned with the frozen state of the model, i.e., the state where no more change is possible because conditions for interaction are not met anymore. But the main considered aspect of the frozen state is its level of consensus, or cultural homogeneity. The studies of Dinkelberg et al. (2021) and Guerra et al. (2010) suggest that network topology is not an important parameter for the final state of the model. It is important to consider, however, that both studies use different formulations of the Axelrod model (random rewiring adaptive model and static Axelrod model, respectively), so, while comparisons may not be reliable, we can say that, given our model configuration, network initial conditions are indeed relevant for the number of unique cultures and the overall final network topology. The work presented in Raducha and Gubiec (2017) explores some of the proposed mechanisms adopted in our model, but ignores the size effects and evaluating and cases as two separated models. Figure 8 shows that parameters influence the final number of cultures differently. Table 3 also shows that, for and for the number of unique cultures, both R and present coefficients of similar magnitudes, but for , R coefficient presents the smallest absolute value.
The final network topologies obtained in our model present decreasing average path lengths and increasing clustering coefficients with q. In fact, the average clustering coefficients are very high when compared to the values observed in random networks. Our model presents two mechanisms that can enhance clustering coefficients, the one being preferential attachment based on degree and the other being restricting candidate nodes for rewiring by controlling the neighborhood radius. But R and work in the opposite directions, so the mechanisms may compete for the overall connectivity patterns. We also mention that, if we consider topology as a metric space, the neighborhood restriction is analogous to a proximity dependent model, such as the spatial preferential attachment models presented in Jacob and Mörters (2015), which imposes a radius of influence for every vertex. Models based on spatial and preferential attachment mechanisms are considered powerful representations of real networks, as mentioned in Iskhakov et al. (2018).
When the parameter R increases, the number of unique cultures decreases. When an individual finds it possible to interact with people outside their immediate circle, the number of possible acquaintances increases, increasing the possibilities of cultural exchange. In real social networks, especially in world-wide events such as wars or mass poverty, it is common for one member of the family to migrate and stabilize themselves through the aid of some government agent, for example. Then, create new social ties in the new culture and bring the family which will also adopt, partially or completely, new cultural patterns Yan et al. (2021).
An increase in will also result in more unique cultures. When , the random rewiring will allow for cultural exchange between individuals who are considered “outcasts”, who possess a low number of acquaintances. When is large, popular individuals will have more opportunities to share their culture, while peripheral cultures or subcultures will tend to be left alone will not mix with the other cultures. This interpretation is also corroborated by the negative correlation between q and . Note that preferential attachment in this model does not consider homophily, only the edge removal probability. But in real networks, recommendation algorithms and search mechanisms help users connect with individuals or entities who share similar cultural patterns. Despite the simplified approach for searching for new acquaintances, the model still reproduces the social bubble phenomena observed in real networks, as mentioned in Du and Gregory (2017).
The findings of this paper can relate cultural polarization and diversity. Our simulations reveal that higher trait diversity (q) and stronger preferential attachment () both promote cultural heterogeneity, as indicated by the positive coefficients in the regression analysis. This suggests that environments where individuals can adopt a wider range of cultural traits or where popular nodes (influential agents) attract more connections are more likely to exhibit cultural diversity. Conversely, a larger search radius (R) decreases clustering and can lead to fragmentation, particularly when individuals are allowed to form connections beyond their immediate neighborhoods. This effect is amplified when q is low, as the limited trait diversity favors rapid consensus formation. Therefore, polarization emerges predominantly when high q and strong preferential attachment () interact, fostering the coexistence of diverse cultural clusters. Meanwhile, fragmentation tends to occur when R increases, reducing local cohesion and promoting isolated cultural groups. These findings indicate that the structure of social networks, particularly the balance between local and global interactions, plays a critical role in shaping cultural outcomes.
5. Conclusions
The main objective of this paper was to investigate the final topology resulting from the proposed Axelrod model on evolving complex networks. We demonstrated that the dynamic rewiring process, driven by local cultural dissimilarity, can reshape both the network structure and the population profile, depending on how parameters such as q, , and R are configured. In particular, higher trait diversity (q) and strong preferential attachment () tend to promote heterogeneous cultural clusters, while larger search radii (R) can facilitate connections over longer distances, potentially leading to more fragmented configurations. Notably, the average clustering coefficient of the frozen-state topologies shows an intriguing shift when varying q. For small q, there is a slightly positive relationship between and the network size, which becomes an inverse relationship at higher values of q. We also observed that the network topology plays a significant role when spatial constraints are introduced into the rewiring mechanism.
This study has certain limitations. Due to computational constraints, we did not explore extensive variations in network size, R, and q. In addition, it would be worthwhile to investigate whether different forms of preferential attachment (e.g., based on centrality measures) could offer a more nuanced perspective on the impact of the initial topology. Moreover, future studies of this model could explore alternative rewiring mechanisms beyond the degree-based preferential attachment employed here. Introducing noise or considering rewiring strategies based on cultural similarity or homophily could provide deeper insights into the robustness of cultural diversity under different network evolution rules. Additionally, incorporating multilayer or temporal networks, where agents interact differently across overlapping communities or adapt their connections over time, may reveal new patterns of fragmentation or consensus formation. Another promising direction is to examine the influence of recommendation algorithms and other external interventions on cultural dissemination, particularly in digital environments where algorithms may actively promote homophily and polarization. Finally, applying this model to real-world datasets from online social platforms or political networks could provide empirical validation of the theoretical findings and offer valuable guidelines for policymakers aiming to foster diversity while mitigating harmful polarization.
Author Contributions
Conceptualization, Y.P. and P.H.T.S.; Methodology, Y.P. and P.H.T.S.; Software, Y.P.; Validation, Y.P., F.H.P. and P.H.T.S.; Formal analysis, Y.P. and P.H.T.S.; Investigation, Y.P., F.H.P. and P.H.T.S.; Data curation, Y.P., F.H.P. and P.H.T.S.; Writing—original draft, Y.P. and P.H.T.S.; Writing—review & editing, Y.P., F.H.P. and P.H.T.S.; Supervision, F.H.P. and P.H.T.S.; Project administration, P.H.T.S. All authors have read and agreed to the published version of the manuscript.
Funding
Y.P. is supported by grant #88887.718188/2022-00 of Coordenação de Aperfeiçoamento de Pessoal de Nível Superior (CAPES). F.H.P. is supported by Conselho Nacional de Desenvolvimento Científico e Tecnológico (CNPq) under the grant #313369/2023-2. P.H.T.S. is supported by grant #421779/2022-5 of Conselho Nacional de Desenvolvimento Científico e Tecnológico (CNPq) and grant #2022/16196-0 of São Paulo Research Foundation (FAPESP).
Data Availability Statement
The data supporting the findings of this study are available at https://github.com/labdinpop/axelrodculture (accessed on 12 April 2025).
Conflicts of Interest
The authors declare that there are no conflicts of interest regarding the publication of this paper.
References
- Albert, R., & Barabasi, A. L. (2002). Statistical mechanics of complex networks. Reviews of Modern Physics, 74(1), 47–97. [Google Scholar] [CrossRef]
- Axelrod, R. (1997). The dissemination of culture: A model with local convergence and global polarization. The Journal of Conflict Resolution, 41(2), 203–226. [Google Scholar] [CrossRef]
- Barabási, A.-L., & Albert, R. (1999). Emergence of scaling in random networks. Science, 286(5439), 509–512. [Google Scholar] [CrossRef] [PubMed]
- Boccaletti, S., Bianconi, G., Criado, R., del Genio, C. I., Gómez-Gardeñes, J., Romance, M., Sendiña-Nadal, I., Wang, Z., & Zanin, M. (2014). The structure and dynamics of multilayer networks (Vol. 544). Elsevier B.V. [Google Scholar] [CrossRef]
- Boccaletti, S., Latora, V., Moreno, Y., Chavez, M., & Hwang, D. U. (2006). Complex networks: Structure and dynamics. Physics Reports, 424(4–5), 175–308. [Google Scholar] [CrossRef]
- Castellano, C., Marsili, M., & Vespignani, A. (2000). Nonequilibrium phase transition in a model for social influence. Physical Review Letters, 85, 3536–3539. [Google Scholar] [CrossRef]
- Dinkelberg, A., MacCarron, P., Maher, P. J., & Quayle, M. (2021). Homophily dynamics outweigh network topology in an extended Axelrod’s cultural dissemination model. Physica A: Statistical Mechanics and Its Applications, 578, 126086. [Google Scholar] [CrossRef]
- Dobbin, F., Simmons, B., & Garrett, G. (2007). The global diffusion of public policies: Social construction, coercion, competition, or learning? The global diffusion of public policies: Social construction, coercion, competition, or learning? Annual Review of Sociology, 33, 449–472. [Google Scholar] [CrossRef]
- Du, S., & Gregory, S. (2017). The echo chamber effect in twitter: Does community polarization increase? In Complex networks & their applications V: Proceedings of the 5th international workshop on complex networks and their applications (Complex networks 2016) (pp. 373–378). Springer. [Google Scholar]
- Erdos, P., & Rényi, A. (1959). On random graphs. I. Publicationes Mathematicae, 6, 290–297. [Google Scholar] [CrossRef]
- Gross, T., & Blasius, B. (2008). Adaptive coevolutionary networks: A review. Journal of The Royal Society Interface, 5(20), 259–271. [Google Scholar] [CrossRef]
- Guerra, B., Poncela, J., Gómez-Gardeñes, J., Latora, V., & Moreno, Y. (2010). Dynamical organization towards consensus in the Axelrod model on complex networks. Physical Review E—Statistical, Nonlinear, and Soft Matter Physics, 81, 056105. [Google Scholar] [CrossRef]
- Hagberg, A. A., Schult, D. A., & Swart, P. J. (2008). Exploring network structure, dynamics, and function using NetworkX. In G. Varoquaux, T. Vaught, & J. Millman (Eds.), Proceedings of the 7th python in science conference (SciPy2008), Pasadena, CA, USA (pp. 11–15). Los Alamos National Laboratory (LANL). [Google Scholar]
- Hernández, M. S. (2023). Beliefs and attitudes of canarians towards the chilean linguistic variety. Lenguas Modernas, 62, 183–209. [Google Scholar] [CrossRef]
- Iskhakov, L. N., Mironov, M. S., Prokhorenkova, L. A., Kamiński, B., & Prałat, P. (2018). Clustering coefficient of a spatial preferential attachment model. Doklady Mathematics, 98(1), 304–307. [Google Scholar] [CrossRef]
- Jacob, E., & Mörters, P. (2015). Spatial preferential attachment networks: Power laws and clustering coefficients. The Annals of Applied Probability, 25(2), 632–662. [Google Scholar] [CrossRef]
- Klemm, K., Eguíluz, V. M., Toral, R., & San Miguel, M. (2003). Nonequilibrium transitions in complex networks: A model of social interaction. Physical Review E, 67, 026120. [Google Scholar] [CrossRef] [PubMed]
- Lanchier, N. (2012). The axelrod model for the dissemination of culture revisited. Annals of Applied Probability, 22, 860–880. [Google Scholar] [CrossRef]
- Newman, M. (2010). Networks: An introduction. Oxford University Press, Inc. [Google Scholar]
- Perc, M., Gómez-Gardeñes, J., Szolnoki, A., Floría, L. M., & Moreno, Y. (2013). Evolutionary dynamics of group interactions on structured populations: A review. Journal of The Royal Society Interface, 10(80), 20120997. [Google Scholar] [CrossRef]
- Perc, M., & Szolnoki, A. (2010). Coevolutionary games—A mini review. Biosystems, 99(2), 109–125. [Google Scholar] [CrossRef] [PubMed]
- Qi, Y., Zhuang, S., Yu, X., Zhao, Z., Sun, W., Li, Z., Qiu, J., Shi, Y., Liu, F., del Genio, C. I., & Boccaletti, S. (2025). Multi-dimensional multi-option opinion dynamics leads to the emergence of clusters in social networks. Chaos, Solitons and Fractals, 192, 115983. [Google Scholar] [CrossRef]
- Raducha, T., & Gubiec, T. (2017). Coevolving complex networks in the model of social interactions. Physica A: Statistical Mechanics and Its Applications, 471, 427–435. [Google Scholar] [CrossRef]
- Reia, S. M., & Fontanari, J. F. (2016). Effect of long-range interactions on the phase transition of Axelrod’s model. Physical Review E, 94, 052149. [Google Scholar] [CrossRef]
- Reitenbach, A., Sartori, F., Banisch, S., Golovin, A., Valdez, A. C., Kretzschmar, M., Priesemann, V., & Mäs, M. (2024). Coupled infectious disease and behavior dynamics. A review of model assumptions. Reports on Progress in Physics, 88, 016601. [Google Scholar] [CrossRef] [PubMed]
- Singh, P., Sreenivasan, S., Szymanski, B. K., & Korniss, G. (2012). Accelerating consensus on coevolving networks: The effect of committed individuals. Physical Review E—Statistical, Nonlinear, and Soft Matter Physics, 85, 046104. [Google Scholar] [CrossRef] [PubMed]
- Szabó, G., & Fáth, G. (2007). Evolutionary games on graphs. Physics Reports, 446(4–6), 97–216. [Google Scholar] [CrossRef]
- Watts, D., & Strogatz, S. (1998). Collective dynamics of small-world networks. Nature, 393, 440–442. [Google Scholar] [CrossRef]
- Yan, J., Sim, L., Schwartz, S. J., Shen, Y., Parra-Medina, D., & Kim, S. Y. (2021). Longitudinal profiles of acculturation and developmental outcomes among Mexican-origin adolescents from immigrant families. New Directions for Child and Adolescent Development, 2021(176), 205–225. [Google Scholar] [CrossRef]
- Zhang, M., Dong, Q., & Wu, X. (2024). How misinformation diffuses on online social networks: Radical opinions, adaptive relationship, and algorithmic intervention. IEEE Transactions on Computational Social Systems, 1–15. [Google Scholar] [CrossRef]
Disclaimer/Publisher’s Note: The statements, opinions and data contained in all publications are solely those of the individual author(s) and contributor(s) and not of MDPI and/or the editor(s). MDPI and/or the editor(s) disclaim responsibility for any injury to people or property resulting from any ideas, methods, instructions or products referred to in the content. |
© 2025 by the authors. Licensee MDPI, Basel, Switzerland. This article is an open access article distributed under the terms and conditions of the Creative Commons Attribution (CC BY) license (https://creativecommons.org/licenses/by/4.0/).