Article

Increasing the Efficiency of Optimized V-SBA-15 Catalysts in the Selective Oxidation of Methane to Formaldehyde by Artificial Neural Network Modelling

1
Leibniz-Institut für Katalyse e.V. an der Universität Rostock, Albert-Einstein-Str. 29a, 18059 Rostock, Germany
2
Bundesanstalt für Materialforschung und -prüfung (BAM), Richard-Willstätter-Straße 11, 12489 Berlin, Germany
*
Authors to whom correspondence should be addressed.
Catalysts 2020, 10(12), 1411; https://doi.org/10.3390/catal10121411
Submission received: 13 November 2020 / Revised: 27 November 2020 / Accepted: 30 November 2020 / Published: 2 December 2020
(This article belongs to the Special Issue Catalytic Oxidation of Hydrocarbons)

Abstract

:
The present study investigates the possibility of improving the selective oxidation of methane to formaldehyde over V-SBA-15 catalysts in two different ways. In a classical approach of catalyst optimization, the in situ synthesis of V-SBA-15 catalysts was optimized with regard to the applied pH value. Among the set of catalysts synthesized, a higher amount of incorporated vanadium, a higher content of polymeric VOx species as well as a less ordered structure of the support material were observed by increasing the pH values from 2.0 to 3.0. An optimum in performance during the selective oxidation of methane to formaldehyde with respect to activity and selectivity was found over V-SBA-15 prepared at a pH value of 2.5. With this knowledge, we have now evaluated the possibilities of reaction control using this catalyst. Specifically, artificial neural network modelling was applied after the collection of 232 training samples for obtaining insight into the influence of different reaction parameters (temperature; gas hourly space velocity (GHSV); and concentration of O2, N2 and H2O) onto methane conversion and selectivity towards formaldehyde. This optimization of reaction conditions resulted in an outstanding high space-time yield of 13.6 kgCH2O∙kgcat∙h−1.

Graphical Abstract

1. Introduction

Methane, the main component of natural gas, is the simplest and most abundant hydrocarbon with estimated global deposits of 199∙1018 m3 [1]. Due to its molecular symmetry and the high strength of the C–H bonds, high temperatures are normally required for methane activation [2] in chemical transformations. As a result of harsh reaction conditions, only few processes which transform methane directly into value-added products, such as HCN, CH3Cl, CS2 or C2H2 [3], were transferred from laboratory to industrial scale. Processes directly yielding oxygenates like methanol or formaldehyde often suffer from overoxidation towards CO and CO2, especially at high methane conversion [4]. Hence, for further improvements, process selectivity as well as production rates should be at their optimum when working at low conversions.
Among the variety of evaluated catalytic systems for the selective oxidation of methane towards formaldehyde, silica-supported vanadium catalysts are one of the most selective and most productive candidates to date [4,5,6,7]. Different methods for preparation are known in the literature, yielding catalysts with varying properties and distribution of VOx species. The most prominent ones are wet and incipient wetness impregnation [8,9] and ion exchange [10,11] of vanadium salts, grafting of molecular precursors [12,13,14] and direct preparation via in situ methods during silica synthesis. The latter was applied for different kinds of V-SiO2 materials as the successful synthesis of V-SBA-15 [5,6,15,16,17], V-SBA-3 [18], V-MCM-41 [5,19,20], V-MCM-48 [21] or V-MCF [22] catalysts for different catalytic applications demonstrates. Moreover, the choice of synthesis conditions therein plays a crucial role for the catalytic activity and selectivity. For example, Seeburg et al. [5] studied the influence of the hydrothermal ageing during V-MCM-41 synthesis and observed an increasing content of oligomeric VOx species with extending treatment time as well as a lower amount of Brønsted acid sites. A medium concentration of both was found to be beneficial for the selective oxidation of methane. Similarly, the pH value is a critical parameter during catalyst syntheses due to the influence on the forming support structure [23] as well as on the kind and amount of different V species in solution [24,25] and the resulting catalyst therewith [26,27]. Exemplarily, Gao et al. [26] varied the pH value during synthesis of V-SBA-15 catalysts between 1.3 and 3.0 and observed a decrease in crystalline V2O5 particles in favor of isolated VOx species, as well as an increase in acidity.
Besides catalyst composition and structure, reaction conditions play a crucial role in terms of yield and productivity. Due to high-dimensional parameter spaces spanned by temperature, flow, pressure, amount and kind of oxidant (O2 and/or NxOy [28,29,30]), cofeeds (H2O [6,31] or HCl [32]), dilution etc., simple testing approaches appear rather impractical for optimizations. The most desired and insightful way for the prediction of reaction outcomes lies in the combination of kinetic modelling and reaction engineering. However, these attempts often suffer from the high complexity of the reaction network which involves hundreds of elementary reactions in gas phase [33,34,35] as well as from complex interactions between the different reaction parameters. Moreover, the lack of knowledge on the nature of the active species and the fundamental reaction steps involved, both being addressed to in operando X-ray absorption spectroscopy (XAS) measurements in the future [36], makes predictions rather difficult. A practical alternative approach is achieved by black-box models, which predict reaction outcomes on the basis of previous measurements as they are obtained by response surface methodology [37] or machine learning [38]. Regarding the latter, the artificial neural networks (ANN) might be the most potent approach due to the wide range of possible applications in catalysis [39], science and even everyday life [40]. These, from biological neuron-inspired models [41], can act as universal function approximators [42] and are thus useful tools for modelling processes in which the exact functional relationships are unknown. An introduction into basic principles, different types and possibilities can be found elsewhere [43,44].
In recent years, they were applied to different topics in heterogenous catalysis, especially catalyst design [45], reaction engineering [46] and increasingly as tool for structure elucidation [47,48]. For example, Mahboub et al. [49] utilized ANN modelling to investigate the influence of catalyst composition as well as reaction conditions in the oxidation of 2-methyl-1,3-propanediol to methacrylic acid. For this purpose, they collected training data by measuring the catalytic performance of heteropoly catalysts with varying Cs, V and Cu content and with varying feed compositions. Those were used to train an optimized ANN. After the applied training procedure, they were able with the help of genetic algorithms to accurately predict a combination of catalyst composition and reaction conditions with an optimum selectivity to methacrylic acid within the parameter space.
In the present study, we investigated the influence of the pH value during synthesis on the structure of V-SBA-15 catalysts and the consequences on their performance in the selective oxidation of methane to formaldehyde. Among the set of catalysts, the most promising one was selected for ANN modelling. To the best of our knowledge, it is shown for the first time for the selective oxidation of methane to formaldehyde how different reaction parameters can alter selectivity–conversion relationships with the help of ANN modelling.

2. Results and Discussion

2.1. Catalyst Characterization

The metal loading and the textural properties of the synthesized V-SBA-15 catalysts are given in Table 1. In general, the vanadium content increases with increasing pH value of the synthesis solution from 1.1 wt% at a pH value of 2.0 up to 1.9 wt% at a pH value of 2.5. With further increase in the pH value, it stays nearly constant. The specific surface area decreases with increasing pH value from 771 to 574 m2∙g−1, and the pore volume varies between 0.92 and 1.00 cm3∙g−1 for the samples synthesized at pH values below 3.0 and decreases to 0.82 cm3∙g−1 at the pH value of 3.0.
The structural change caused by the increase in the pH value of the synthesis solution can be observed by the study of the nitrogen isotherms, BJH pore size distribution and X-ray diffraction at small angles. The nitrogen isotherms for all materials are shown in Figure 1a and can be classified as type IV (IUPAC classification [50]), typical for mesoporous materials with hysteresis type H1 for V-SBA-15(2.0), V-SBA-15(2.25) and V-SBA-15(2.5). While the adsorption and desorption curves are sharp for V-SBA-15(2.0), indicating a narrow, uniform pore size, both are broadened with for materials prepared at higher pH value. Moreover, V-SBA-15(2.0) and V-SBA-15(2.25) exhibit defined two-step desorption branches, suggesting interconnected penetrating and/or plugged mesopores, and V-SBA-15(3.0) shows a second hysteresis loop at higher pressure, representing the occurrence of larger pores. The BJH analysis (Figure S2) reveals a bimodal pore size distribution for V-SBA-15(2.0) with sharp maxima at 4 and 7 nm. The materials prepared at higher pH also show a first maxima at 4 nm, while the second peak is broadened and shifted towards smaller pore widths. Furthermore, the percentage of pores with a size of more than 10 nm increases with the pH value of the synthesis applied to the materials.
The X-ray diffraction pattern (Figure S3) exhibits only a signal around 22° from amorphous silica and no reflections which can be assigned to V2O5 crystallites. The X-ray diffraction patterns at small angles are shown in Figure S4. For the catalysts synthesized at the pH values of 2.0, 2.25 and 2.5, the reflections ascribed to the (100), (110) and (200) planes were observed with decreasing intensity. Said reflections indicate the hexagonal space group P6mm and reflect the structural order which also decreases with decreasing intensity. A further increase in the pH value to 2.75 in the synthesis solution leads to large and non-uniform mesopores, which can be derived from a high diffraction intensity without any observable reflections, which is in accordance with BJH analysis.
In order to examine the nature of the VOx species, UV–vis spectroscopy represents a powerful tool providing information on the coordination geometry and the degree of polymerization of supported vanadium oxo catalysts [51,52,53]. The UV–vis spectra of the dehydrated V-SBA15 materials are shown in Figure 1b. In general, materials prepared at a higher pH value appear red shifted, originating from different VOx species and their specific ligand-to-metal charge transfer. The corresponding edge energies, Eg, decrease from 3.59 eV for V-SBA-15(2.0) to 2.99 eV for V-SBA-15(3.0) (Figure S5). However, the samples V-SBA-15(2.25), V-SBA-15(2.5) and V-SBA-15(2.75) possess Eg values of about 3.39 eV and show no significant difference indicating a similar distribution of VOx species. The proportional contribution of the different VOx species can be further examined by deconvolution of the spectra into single bands (Figure S6 and Table S1). The experimental spectra for VOx species on mesoporous silica can be described by tetrahedral monomeric, tetrahedral oligomeric and octahedral two-dimensional units at 243–247 nm, 291–303 nm and 374–387 nm, respectively [53]. In the present case, V-SBA-15(2.0) shows the highest relative amount of monomeric and oligomeric species, 24 and 67%, respectively. Both proportions are decreasing with increasing pH value of the synthesis solution in favor of octahedral VOx species which increased from 9 to 42%.
Raman spectra of the V-SBA-15 materials are given in Figure 1c. The bands at 450, 497, 608, 800 and 978 cm−1 are ascribed to vibrations of the silica framework, namely to 5-/6-, 4- and 3-membered siloxane rings, symmetric Si–O–Si stretching and the Si–OH stretching mode [54,55,56] and are most pronounced for V-SBA-15(2.0). Bands appearing at 920 and 1060 cm−1 (shoulder) are attributed to out-of-phase and in-phase vibrations of V–O–Si bonds [57], and the signal of V=O vibrations is observed at 1035 cm−1 [58]. The remaining signals at 157, 267 and 704 cm−1 can be assigned to hydrated amorphous V2O5-like clusters [59]. These contributions are more intense from materials prepared at higher pH values portraying the higher amount of octahedral species, as shown by UV–vis spectroscopy. Finally, no signals of crystalline V2O5 (bands at 994, 518, 404, 284 and 146 cm−1 [51]) were detected by Raman spectroscopy.
The X-ray absorption near edge structure (XANES) spectra of the catalysts are shown in Figure 1d. All spectra show similar features with a pronounced pre-edge peak at 5469.49 eV. In comparison with the starting material NH4VO3 (black line), the position of the pre-edge peak (Table S2) is shifted to higher energies. In NH4VO3, the vanadium has the oxidation state of +5 and is surrounded by four oxygen atoms [60]. In direct comparison with V2O5, the pre-edge peak of catalysts is observed at a similar energy. This indicates that vanadium in all investigated samples is still in the oxidation state +5, surrounded by five oxygen atoms [60]. The pre-edge peak occurs due to the electron transition from the 1s to hybridized 3d/4p orbitals in the case of non-centrosymmetric tetrahedral coordination around vanadium. This extension of the hybridization is a combination of speciation and coordination environment. However, further disordered environments around vanadium reduce the effect of hybridization and decrease the height of the pre-edge peak. In the present case, compared to the references, the height of the pre-edge peak is decreased in spectra of all V-SBA-15 samples, indicating the disordered structure of the VOx species in the catalysts [61].
In summary, the influence of the pH value during the synthesis of V-SBA-15 catalysts became evident in three ways:
(i.) Vanadium loading: The amount of vanadium in the catalysts increased as the pH value of the synthesis solution increased. This observation is in accordance with previously described studies [26,27] and can be explained by the predominance of the pervanadyl cation (VO2+) at low pH values which cannot be incorporated into the SiO2 network by co-condensation. With increasing pH value, the proportion of different decavanadate species such as V10O26(OH)24− and V10O27(OH)5− [24,25] being capable of co-condensation with Si(OEt)4 increases, and, thus, the overall vanadium content also increases.
(ii.) Distribution of VOx species: As demonstrated by UV–vis and Raman spectroscopy, the degree of polymerization increased with increasing pH value of the synthesis solution. At a pH value of 2.0, two monomeric vanadium species can exist, the pervanadyl cation and a small amount vanadic acid (VO(OH)3) [62]. While the vanadic acid can directly be incorporated into the framework, physisorbed pervanadyl species could be an additional source of monomeric VOx species. As consequence of a higher pH value, the concentration of decavanadate ions increases, and, thus, the amount of polymeric VOx species also increases. These findings are somewhat contrary to a study by Gao et al. [26] and can be reasoned with the lower vanadium concentration in our case (10 mM vs. 140 mM) and the lower synthesis temperature of the reference study (40 °C vs. room temperature). Furthermore, because of the lower vanadium concentration, in our case, no V2O5 particles could be detected as in the mentioned study.
(iii.) Morphology of the SiO2 support: An increase in the pH value led to a less ordered SiO2 structure and a decrease in the specific surface area. Similar results were described by Aktas et al. [23].

2.2. Catalytic Tests

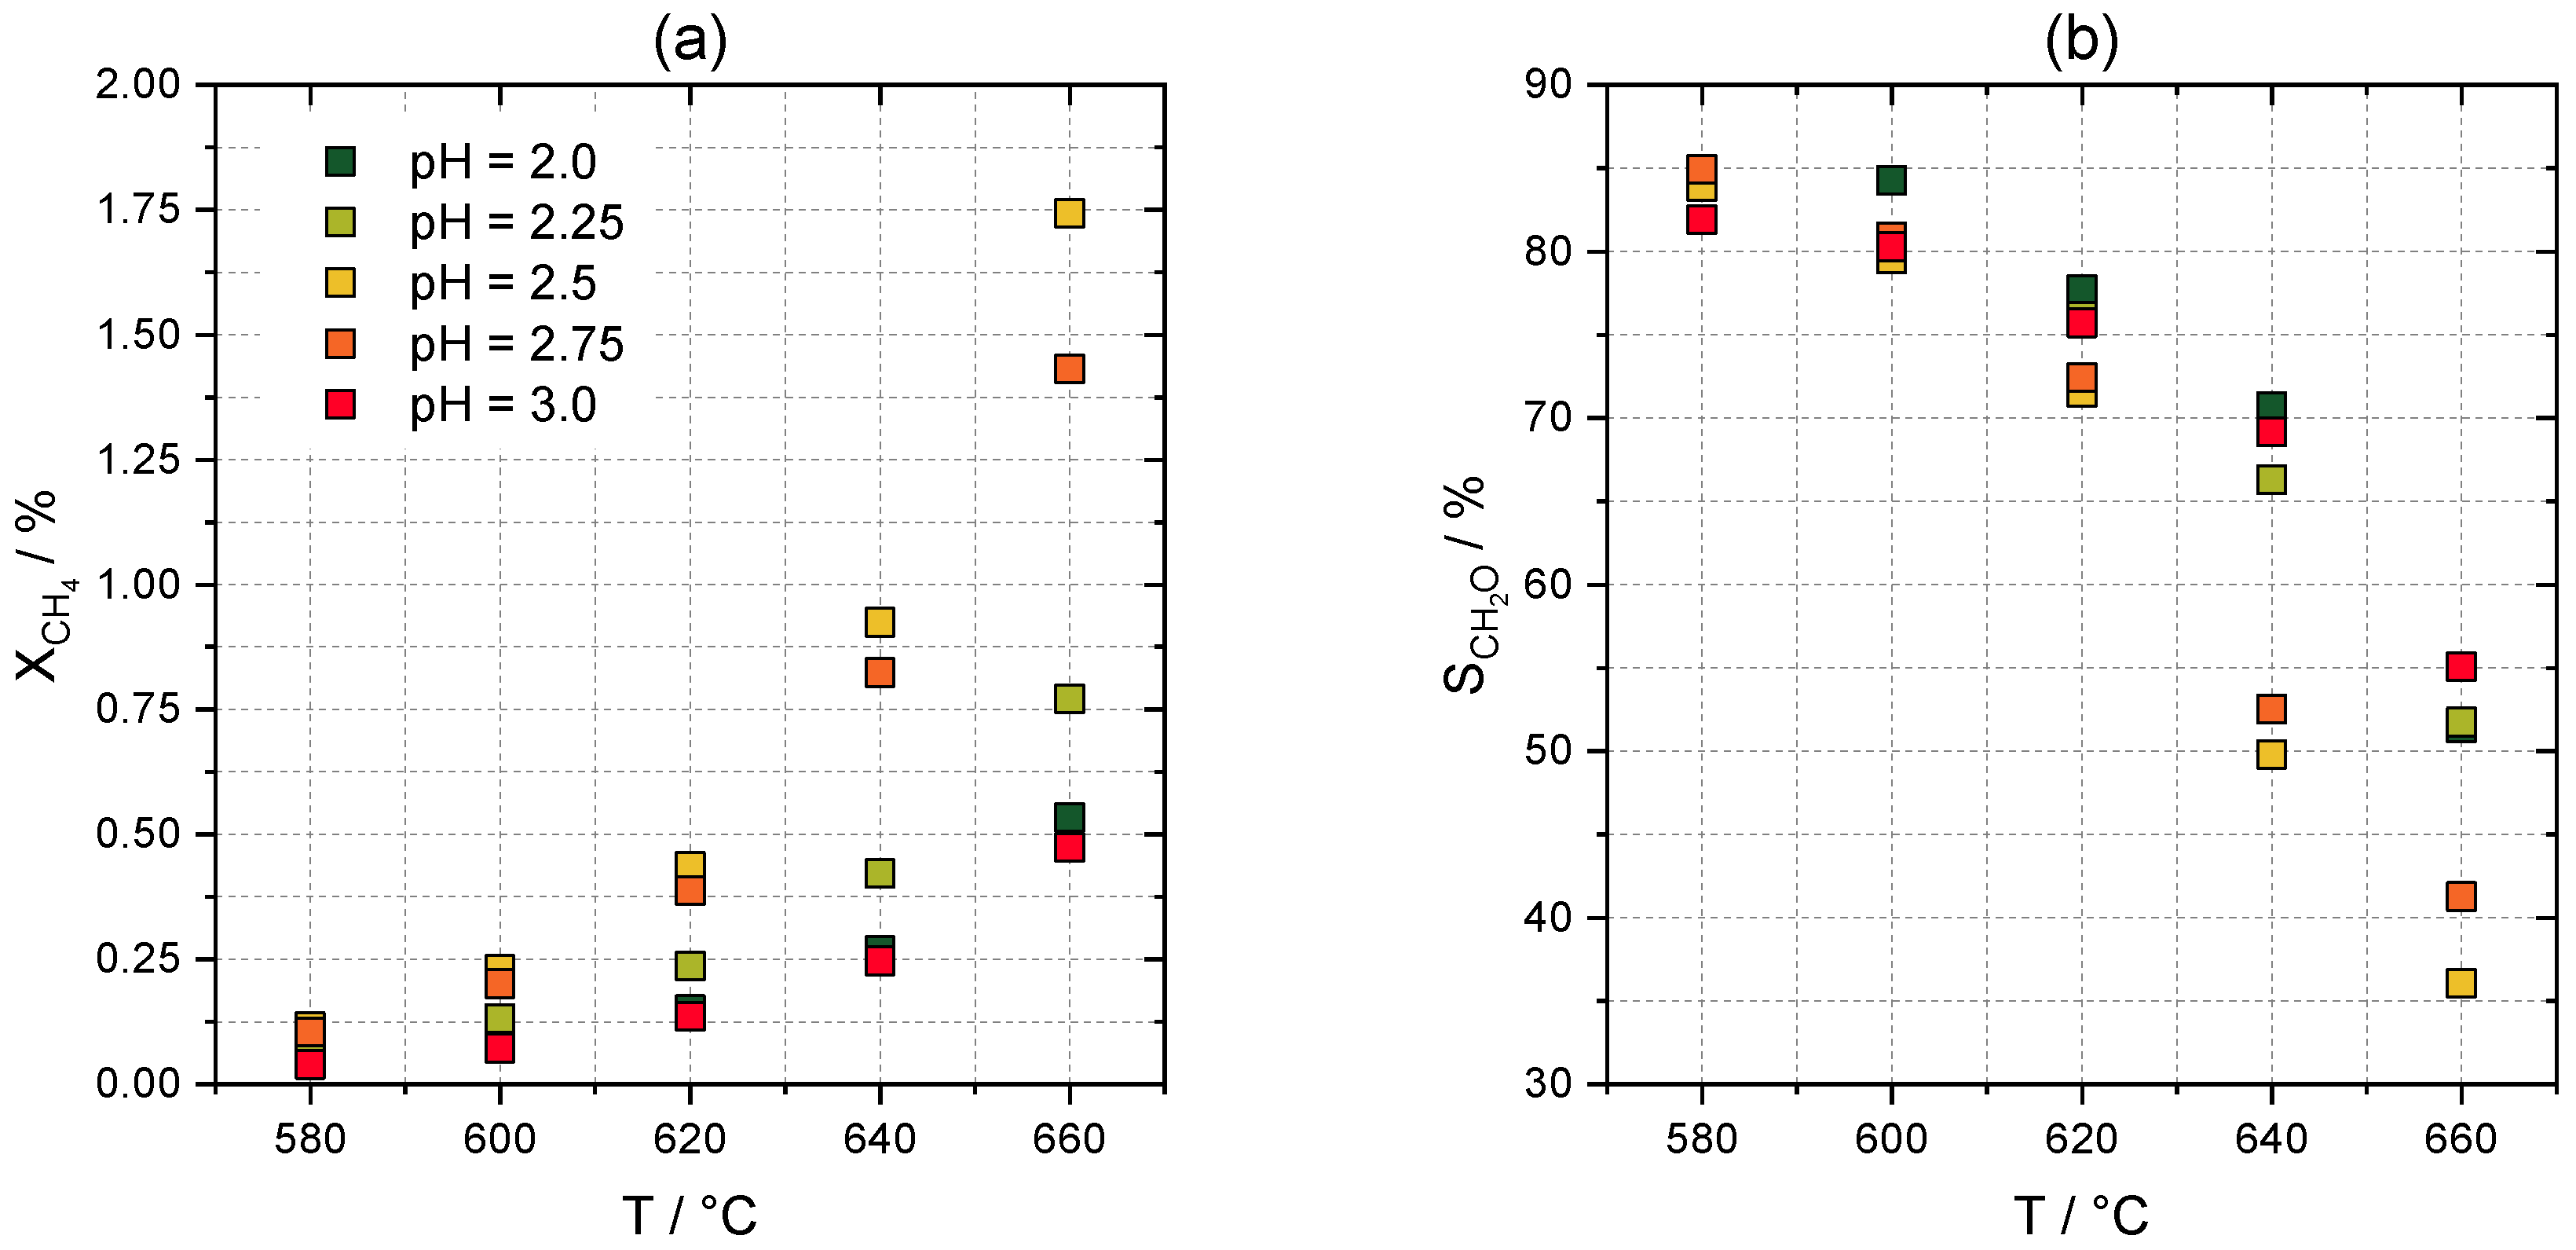
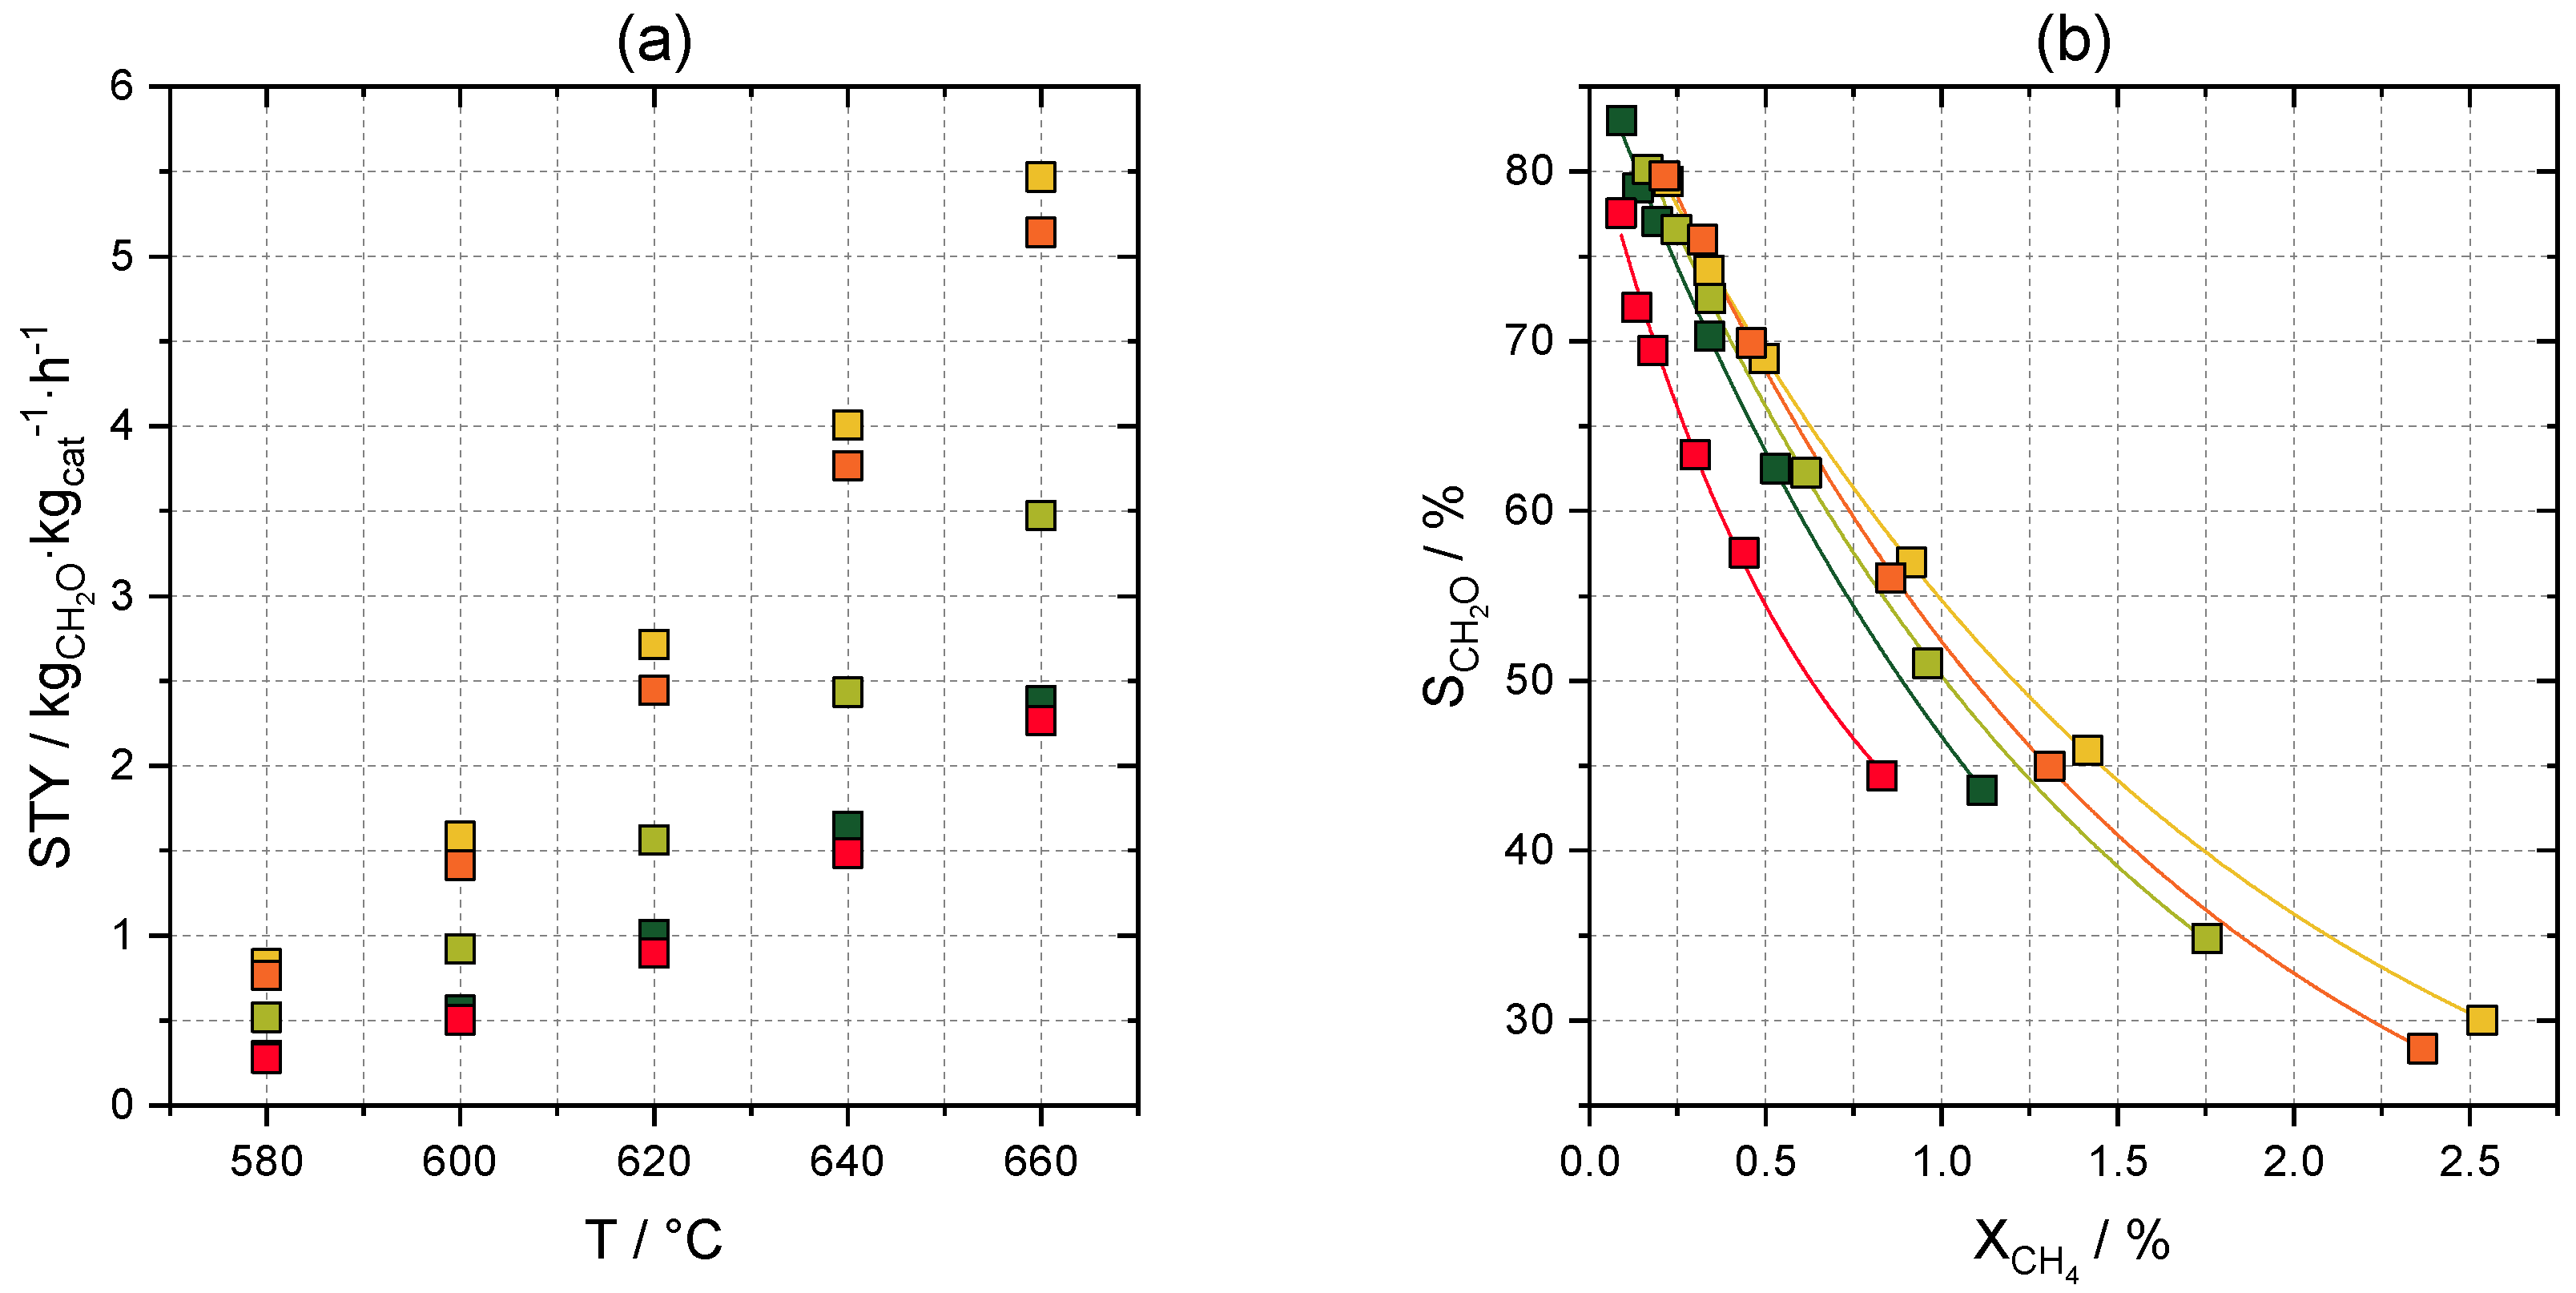
The catalytic performance of the V-SBA-15 materials in the temperature range between 580 and 660 °C at a gas hourly space velocity (GHSV) of 720,000 L∙h−1∙kg−1 measured for 30 min after stabilization of the temperature is given in Figure 2 and Figure 3. During this period, the catalytic activity remains relatively stable, but with further time on stream, a slight decrease was observed (Figure S7). In general, methane conversion increases with increasing temperature accompanied by a decrease in formaldehyde selectivity in favor of CO and CO2, as reported by previous studies on the selective oxidation of methane [4]. Besides that, small amounts of C2-products as well as traces of methanol were found in the product gas. When comparing the performances of the catalysts, methane conversion (Figure 2a) increases from V-SBA-15(2.0) to V-SBA-15(2.5), which is mainly ascribed to the higher vanadium content, followed by a decrease to V-SBA-15(3.0). This may be due to the higher degree of polymerization as shown by Raman and UV–vis spectroscopy leading to a lower reactivity of the active sites. The highest methane conversion was observed for V-SBA-15(2.5) at 660 °C with 1.7% and a formaldehyde selectivity of 36% (Figure 2b), resulting in a space-time yield of 5.5 kgCH2O∙kgcat∙h−1 (Figure 3a), which lies slightly below the previously reported V-SiO2 systems [5,6,7].
The dependency between selectivity and conversion was evaluated at 600 °C by variation of the residence time as shown in Figure 3b. Conversion and selectivity were highest for V-SBA-15(2.5) with a maximum yield of 0.76%. Below, a conversion of 0.5% V-SBA-15(2.75) shows nearly the same behavior but exhibits a faster decrease in selectivity with ongoing conversion. Despite possessing a similar amount of vanadium, V-SBA-15(3.0) was the least active with a maximum conversion of 0.83%. Figure S8 shows the selectivity-conversion plot at 620 °C, revealing the same trend within the set of catalysts up to a maximum conversion of 4.6%, while the overall selectivity was slightly decreased.
Due to the high formaldehyde selectivity and methane conversion compared to the catalysts synthesized at lower and higher pH values, V-SBA-15(2.5) was chosen for further experiments for modelling the influence of different reaction conditions on the catalytic performance.

2.3. ANN Modelling

2.3.1. Model Selection and Training Process

In the present study, the influence of five parameters on the conversion and selectivity of V-SBA-15(2.5) was modelled: temperature, GHSV, concentration of oxygen, nitrogen dilution and concentration of water as cofeed. The given input variables were chosen, since these include the complete description of reaction conditions (excluding the pressure, which was not taken into account due to experimental reasons), while the choice of selectivity and conversion as output variables enables the calculation of all further catalytic measures (yield and space-time yield).
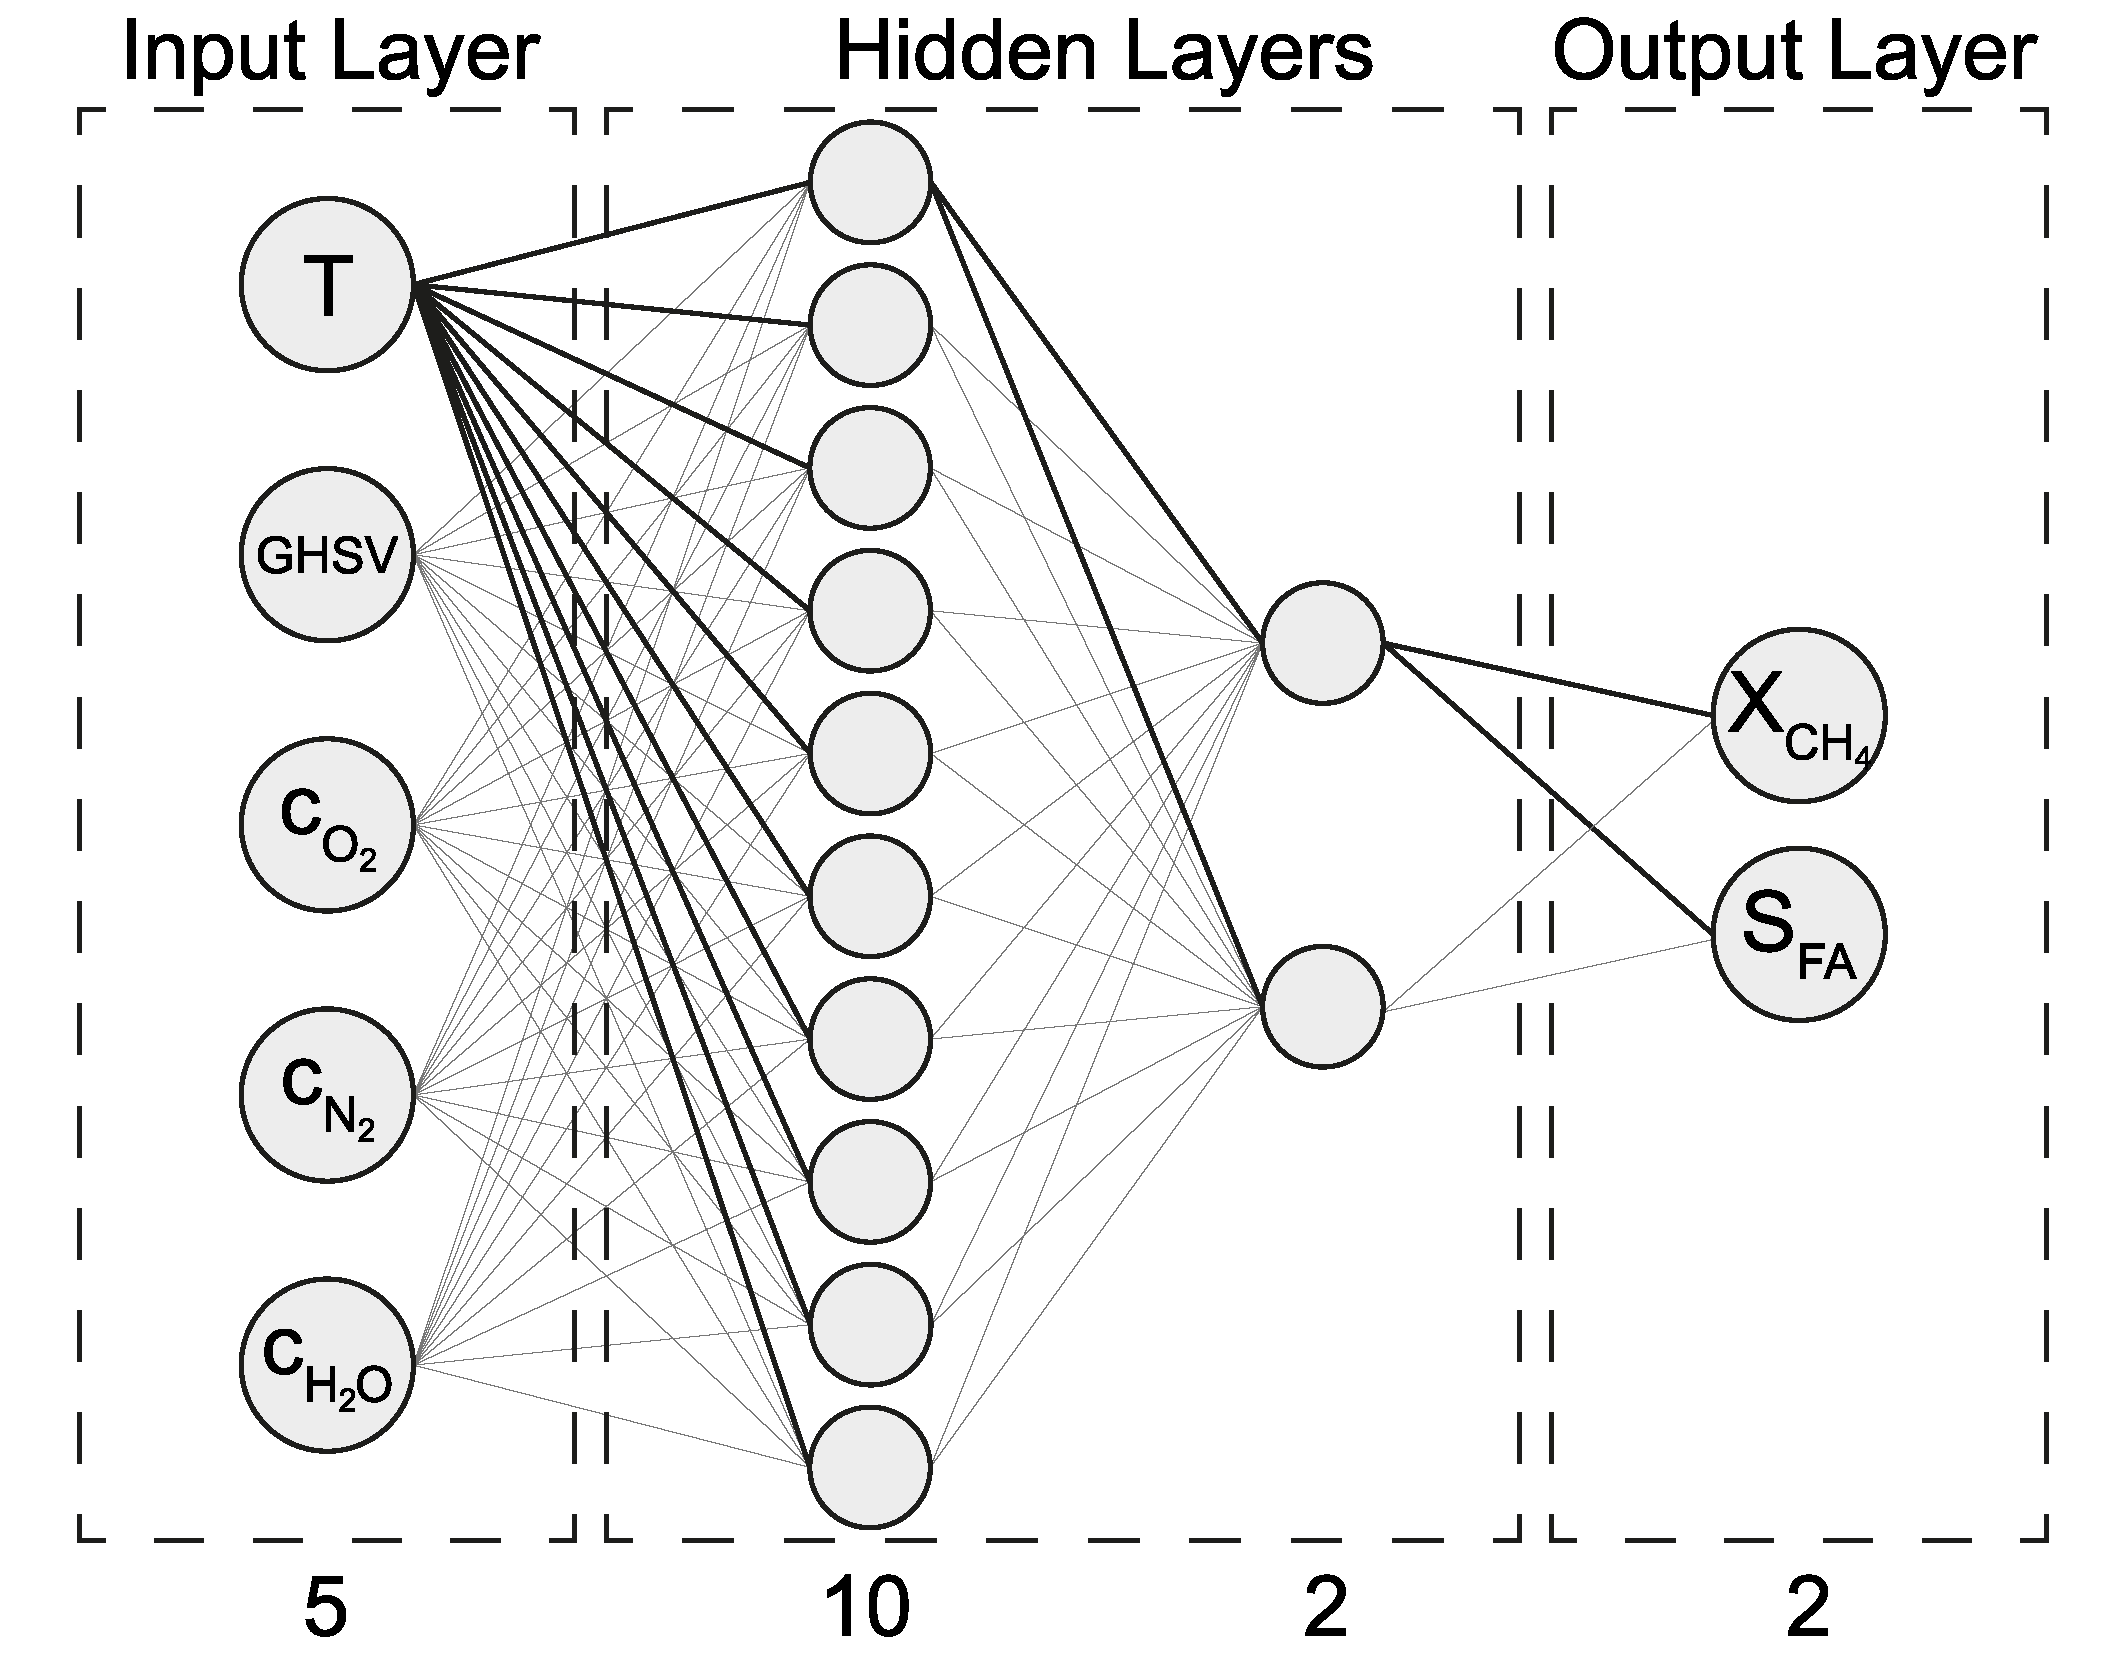
Different architectures of feedforward neural networks with one and two hidden layers were investigated as well as two different learning algorithms, namely Bayesian regularization (BR) and Levenberg–Marquardt (LM) backpropagation. In order to identify the combination of network architecture and learning algorithm with the best performance and generalization ability, a random subsampling approach was utilized. The measured 232 training samples given in Table S3 were randomly divided into two sets, 75% of the data were used to train the respective neural network, and the remaining 25% of the data were used as test set to evaluate the performance of the network on unseen data. This combination of training and performance evaluation was repeated 20 times for each network since the performance varies with exact data division. The resulting average performance and respective standard deviation on the test and training set are shown in Figure 4. BR and LM networks showed nearly the same performance on training data as well as when training networks with one hidden layer. Regarding networks with two hidden layers, BR networks exhibited an improved generalization ability and a more stable performance as demonstrated by the lower mean squared error and the lower standard deviation reflecting the differences between the two training algorithms. While LM training only aims at minimizing the errors on the training set that can rapidly lead to overlearning, BR training also minimizes the weights between the single neurons. Since no significant improvement on unseen data was observed when networks with more than 10 neurons in the first and 2 neurons in the second hidden layer were used, and to keep the number of neurons preferably low following the principle of Occam’s razor, this 5-10-2-2 neural network in combination with the BR learning algorithm was selected. In this way, the model is flexible enough to learn and predict the data while an overparameterization is prevented. The final topology is given in Scheme 1.
Based on this architecture and learning algorithm, a neural network ensemble averaging approach [63,64,65] was used in which the output of 20 separately trained networks was averaged. This approach results in a more consistent output and further decreases errors due to overlearning compared to a single neural network. Moreover, an enhanced reproducibility is achieved since depending on the starting conditions of the learning process, the final weights of a single network differ, leading to different outputs. Figure S9 illustrates this issue with the example of five randomly chosen points in the parameter space and the corresponding output of the 20 single neural networks.
Since the chosen combination of BR learning with a 5-10-2-2 network turned out to be very robust against overfitting (four example learning curves are given in Figure S10), each of the 20 networks was trained under usage of the whole data set. The correlation of the predicted and experimental values of the methane conversion and selectivity towards formaldehyde is given in Figure S11 and shows a good agreement. The identity function is plotted for comparison.

2.3.2. Effects on Selectivity and Conversion

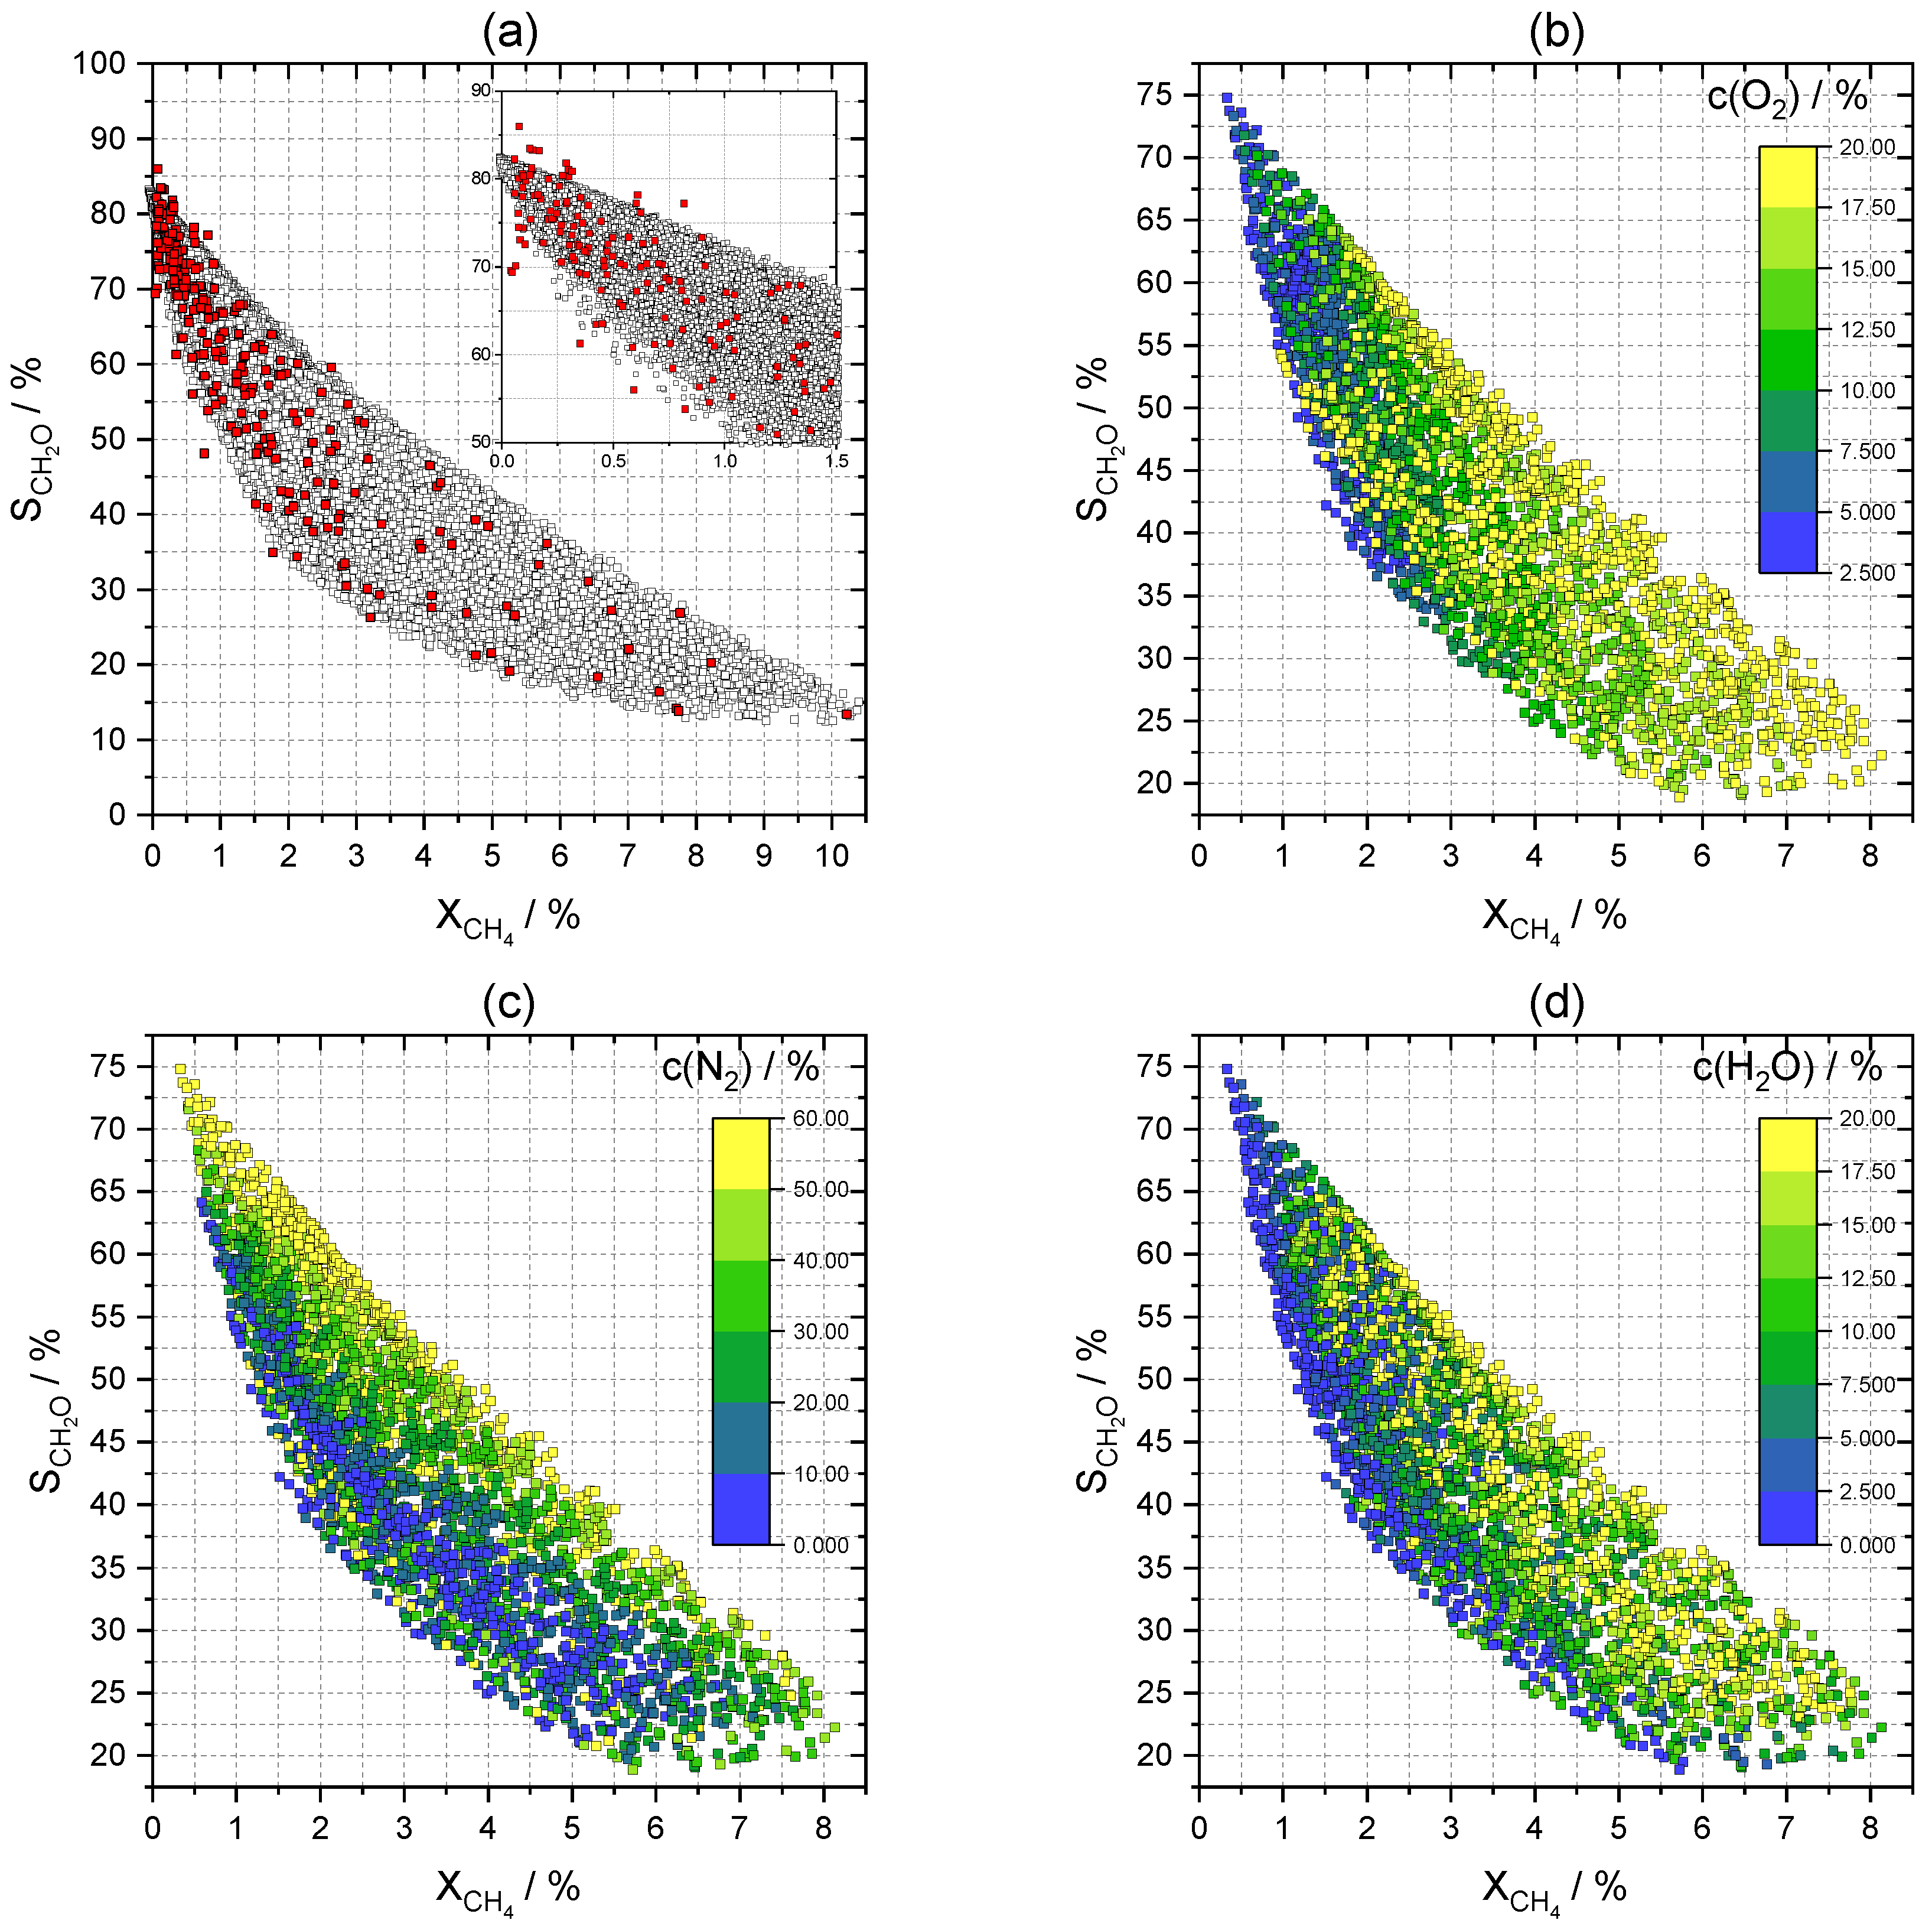
The conversion of methane and selectivity towards formaldehyde were calculated for the whole range of input data in the steps of ΔT = 10 K, ΔGHSV = 120,000 L∙kg−1∙h−1, Δc(O2) = 2.5%, Δc(N2) = 10% and Δc(H2O) = 2.5%, yielding 38,808 data points as shown in Figure 5a, which also shows a comparison with the training data. The selectivity ranges from 83 to 12%. Maximum conversion was reached at 10.4%. The data exhibit a decrease in selectivity with increasing conversion, as demonstrated by the previous catalytic tests, and cover a crescent-shaped area. Importantly, depending on the respective reaction conditions, a high variability in selectivity at a certain conversion was observed. For example, at a conversion of 4%, the selectivity varies between 22 and 49%. In contrast to that, the selectivity covers a narrow range (from 81 to 83%) close to 0% conversion.
In order to observe the influence of the single parameters, Figure 5b–d show selectivity versus conversion at 660 °C in which the single data points show the investigated concentrations of O2(b), N2(c) and H2O(d) in different color. Moreover, Figure S12 and Animation S1 show the influence of the GHSV at 660 °C and the evolution of the predicted values of conversion and selectivity over the whole temperature range, respectively.
The oxygen concentration mainly affects the conversion of methane (Figure 5b). Initially, this seems to be contrary to previous studies that suggest a reaction order of zero or close to zero [6,31,66] for oxygen. This can be explained by the lower partial pressure of methane at oxygen-rich conditions and limitation of the maximum conversion at low oxygen concentrations.
Nitrogen as diluent (Figure 5c) suggests a positive influence on the selectivity. This effect is caused by a better temperature control during the reaction, as the oxidation of methane towards CH2O, CO and CO2 is strongly exothermic (ΔRH0 = −275.8, −519.5 and −802.5 kJ∙mol−1 [67]), as well as by the reduced oxygen partial pressure, resulting in a decreased formation of CO and CO2.
Different amounts of water as cofeed show a strong influence that improved conversion as well as selectivity, as shown in Figure 5d. The impact on the conversion was already observed in previous studies and explained by the formation of highly active V–OH groups via hydrolysis of V–O–Si bonds [6,31,68]. Furthermore, Figure S13 demonstrates the influence of water at constant partial pressure of methane and oxygen at 660 °C. The conversion increases from 2.1% without water cofeed up to 5.1% with 10% water cofeed and shows only a slight further increase up to 5.8% at 20% water addition.

2.3.3. Optimization of Formaldehyde Yield

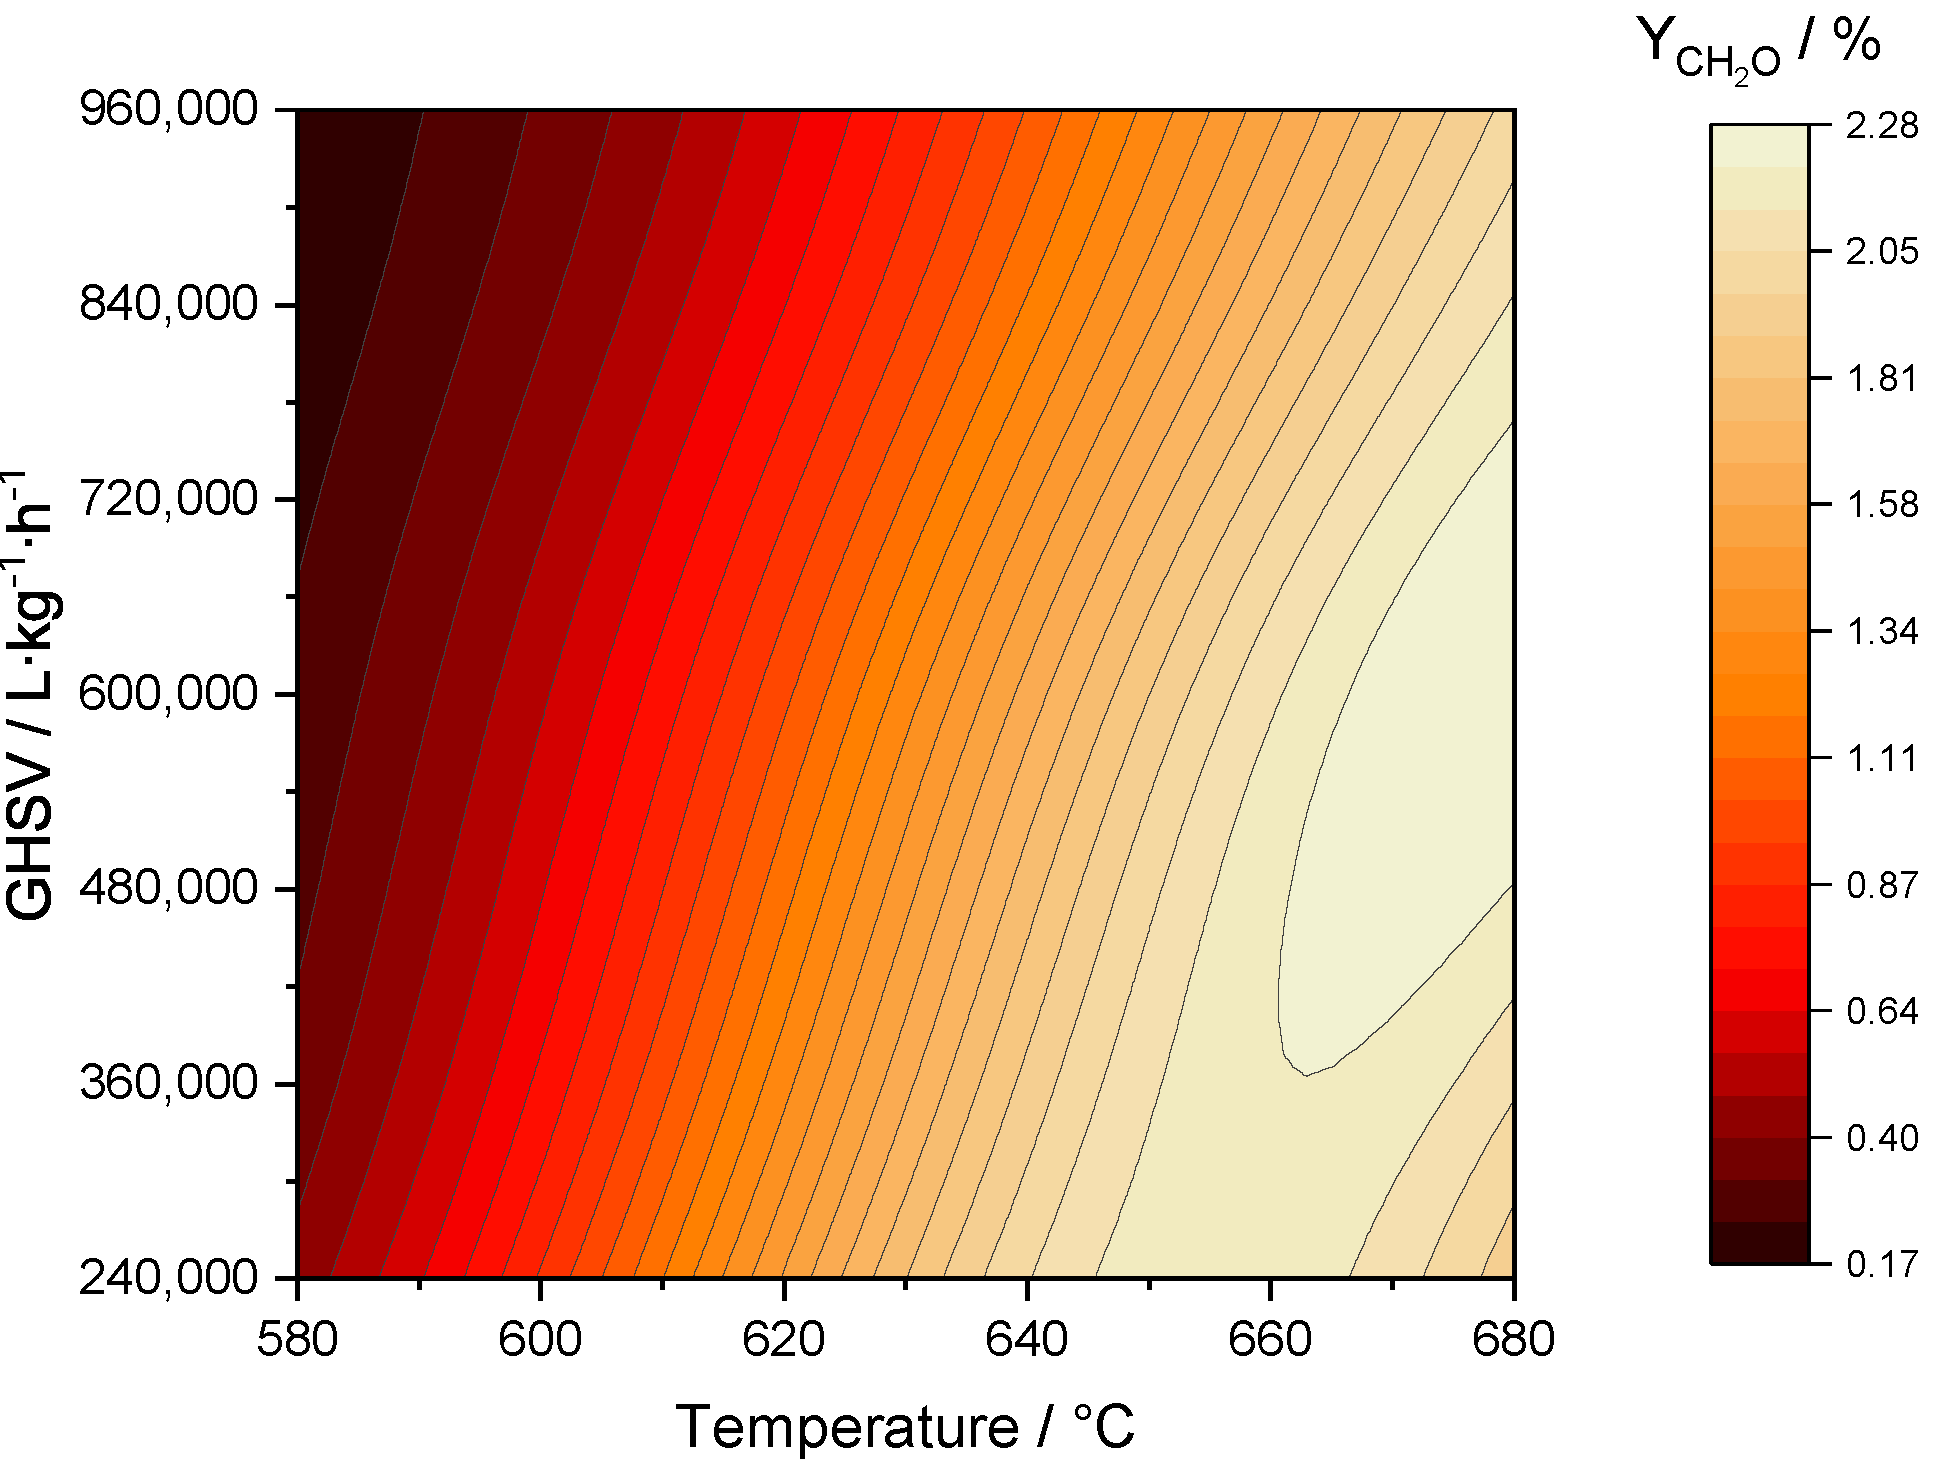
As shown in the previous section, the concentrations of O2, N2 and H2O have a positive influence on conversion and selectivity and thus improve the yield. However, the role of temperature and GHSV on the formaldehyde yield is not that clear and depends on the exact set of conditions. For example, a high temperature and low GHSV are more likely to cause overoxidation in combination with a high concentration of oxygen. In order to evaluate such influences, Figure 6 shows the dependence of the yield on temperature and GHSV at the conditions of the maximum yield, which was taken from the grid of ΔT = 10 K, ΔGHSV = 120,000 L∙kg−1∙h−1, Δc(O2) = 2.5%, Δc(N2) = 10% and Δc(H2O) = 2.5%.
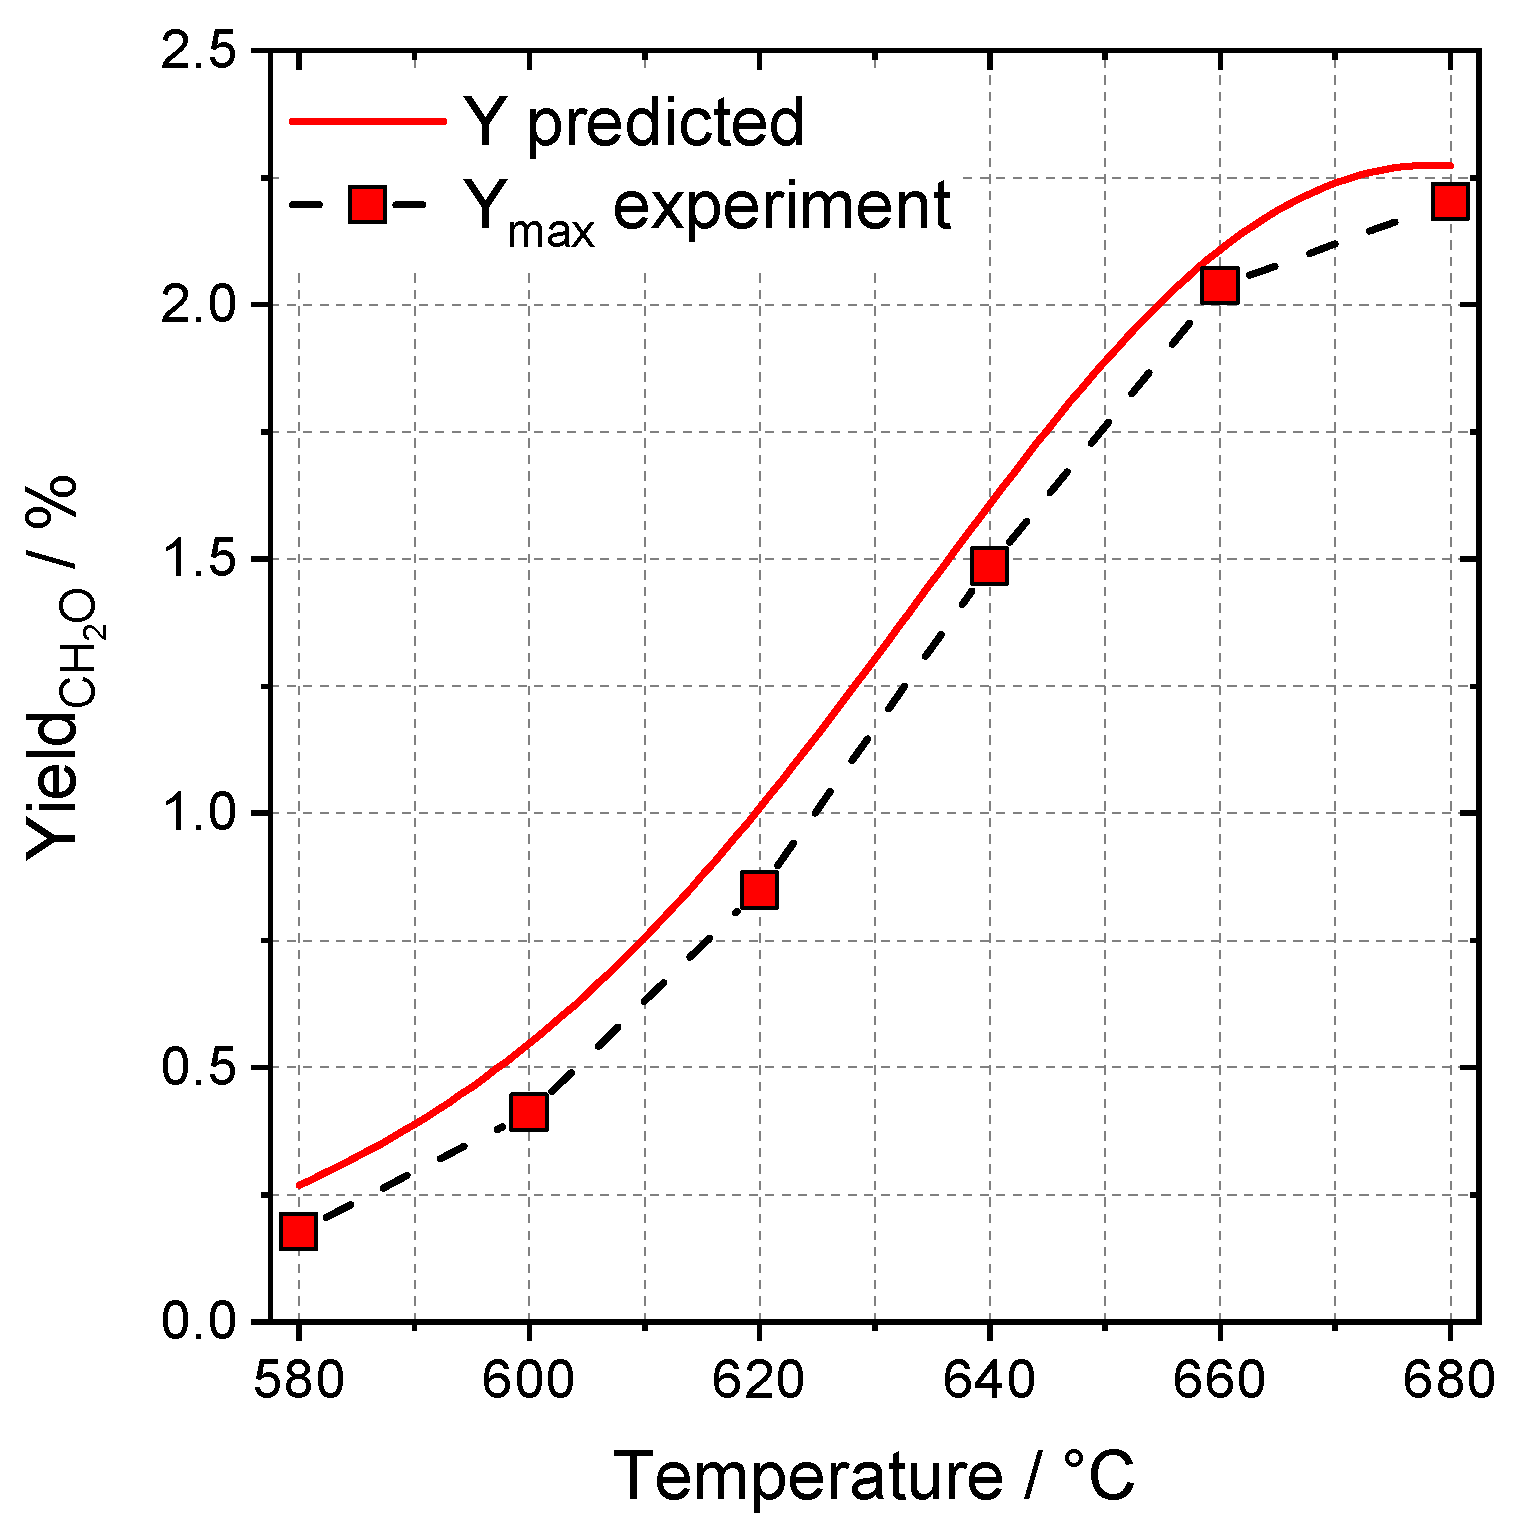
The highest yield was predicted at 680 °C, 600,000 L∙kg−1∙h−1, 20% O2, 50% N2 and 20% H2O with 2.3%. In most cases, the yield decreases with increasing GHSV and increases with increasing temperature. Only at higher reaction temperature does the yield decrease with ongoing temperature and lower GHSVs, which is due to overoxidation. A comparison of the predicted yield and the experimental one between temperatures of 580 and 680 °C at 600,000 L∙kg−1∙h−1 is given in Figure 7.
The overall dependency of the yield on the temperature is well predicted while being shifted by around 0.1% to lower values over the whole range, resulting in a maximum yield of 2.2% at 680 °C. This represents a slight improvement compared to the highest yield within the training data (2.1% at 660 °C, 240,000 L∙kg−1∙h−1, 20% O2, 60% N2 and 20% H2O). Although other authors reported higher yields (a maximum of 3.7% was reported [6]), our approach impressively demonstrates the possibility of process intensification using ANN.

2.3.4. Optimization of Space-Time Yield

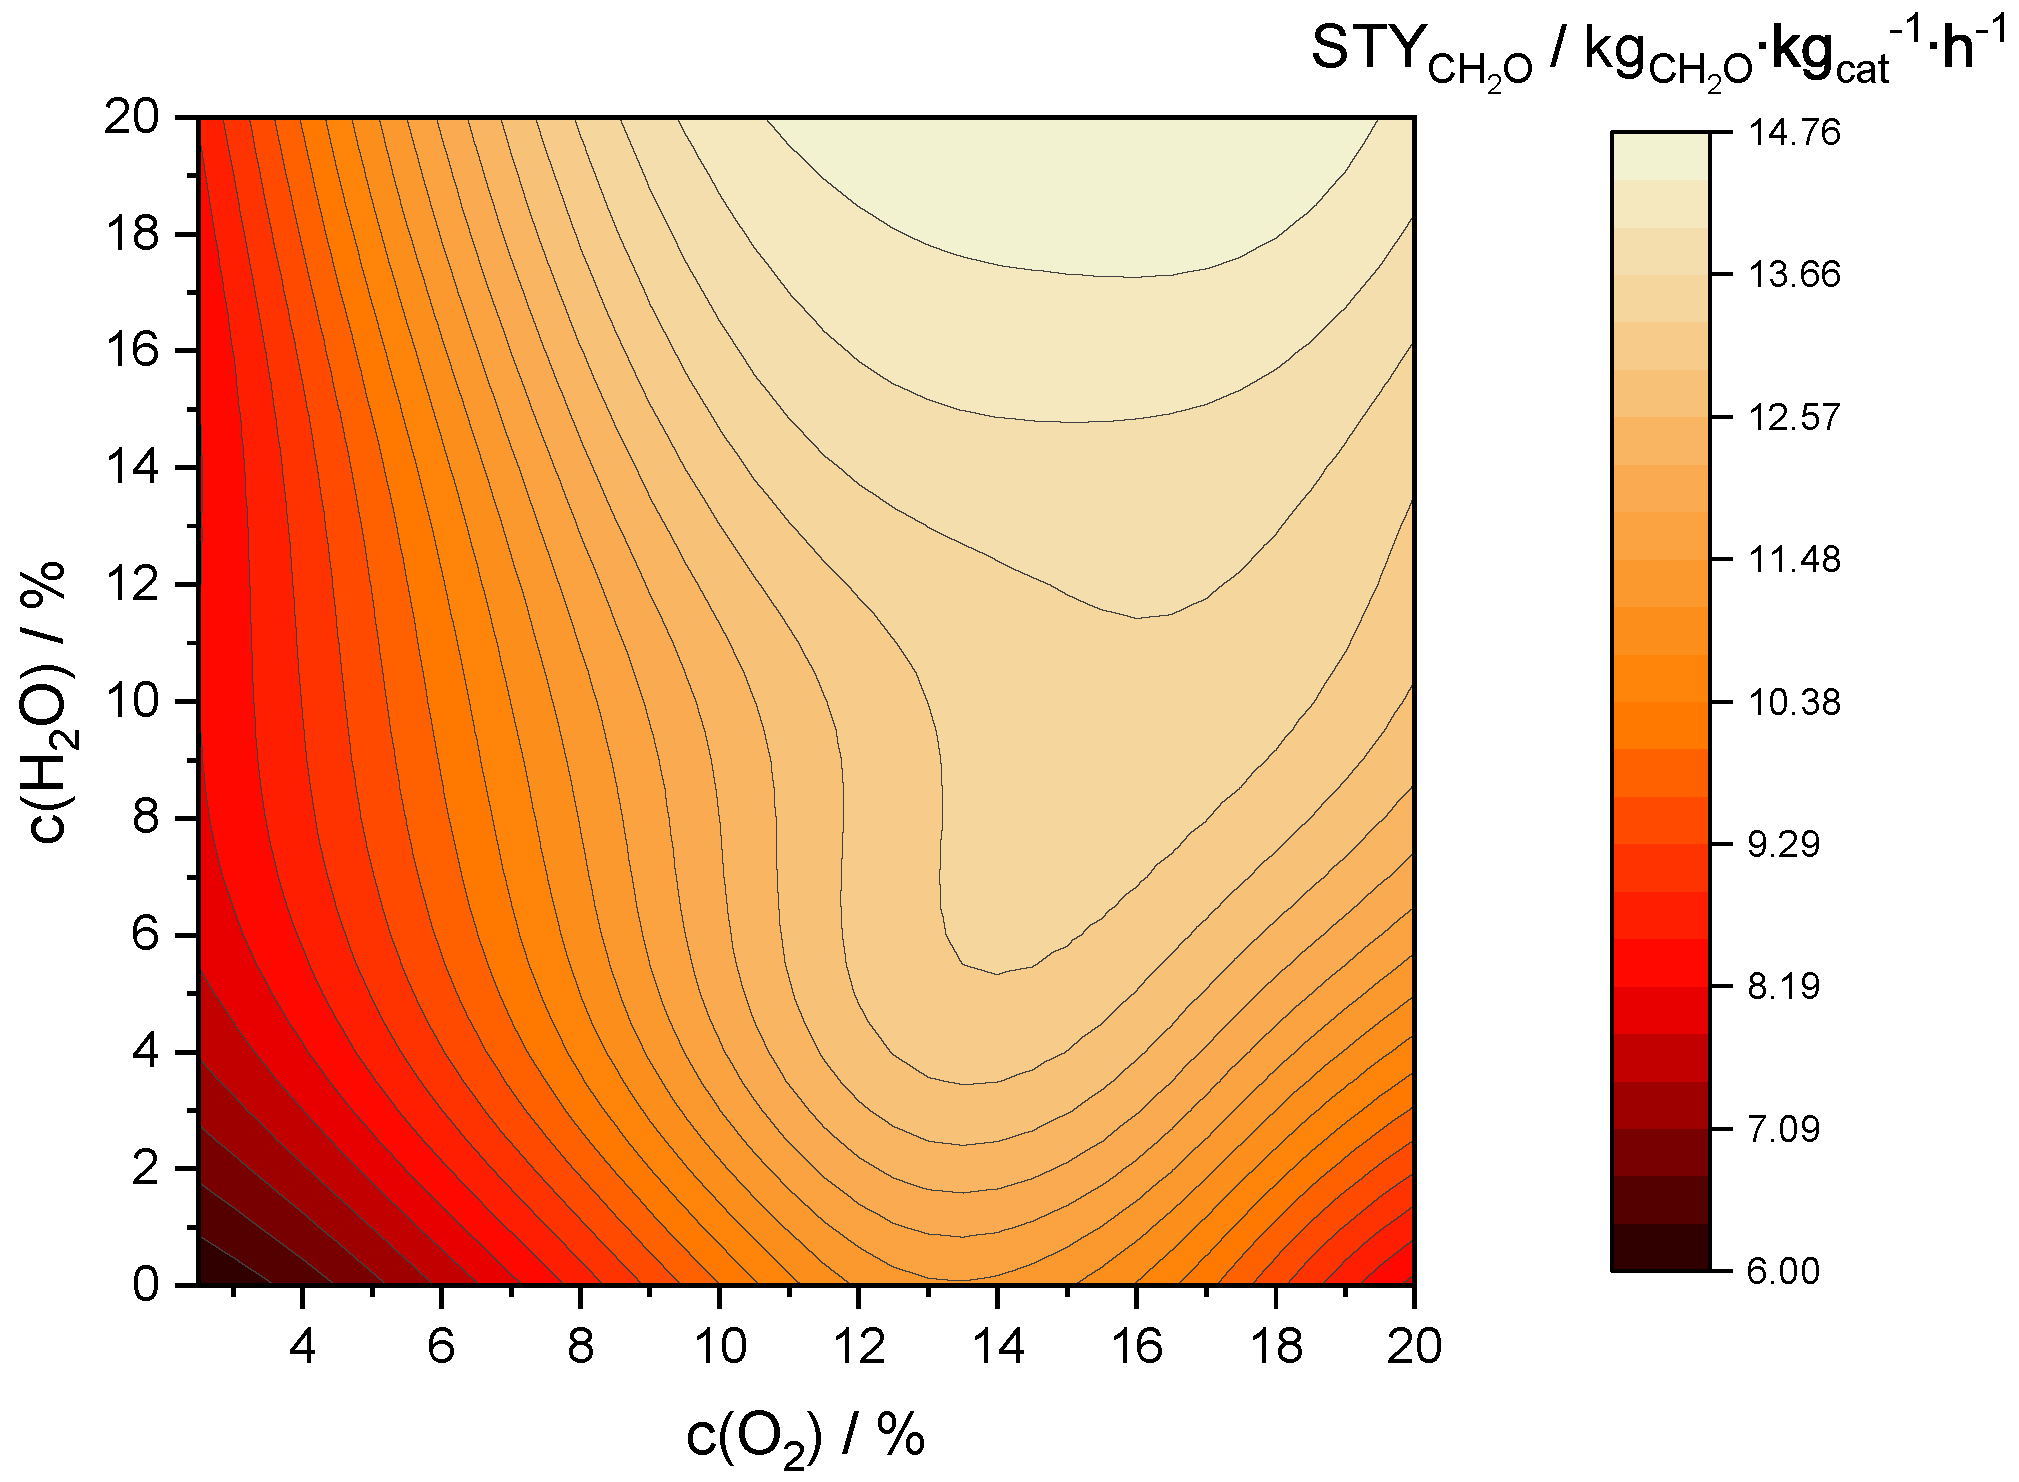
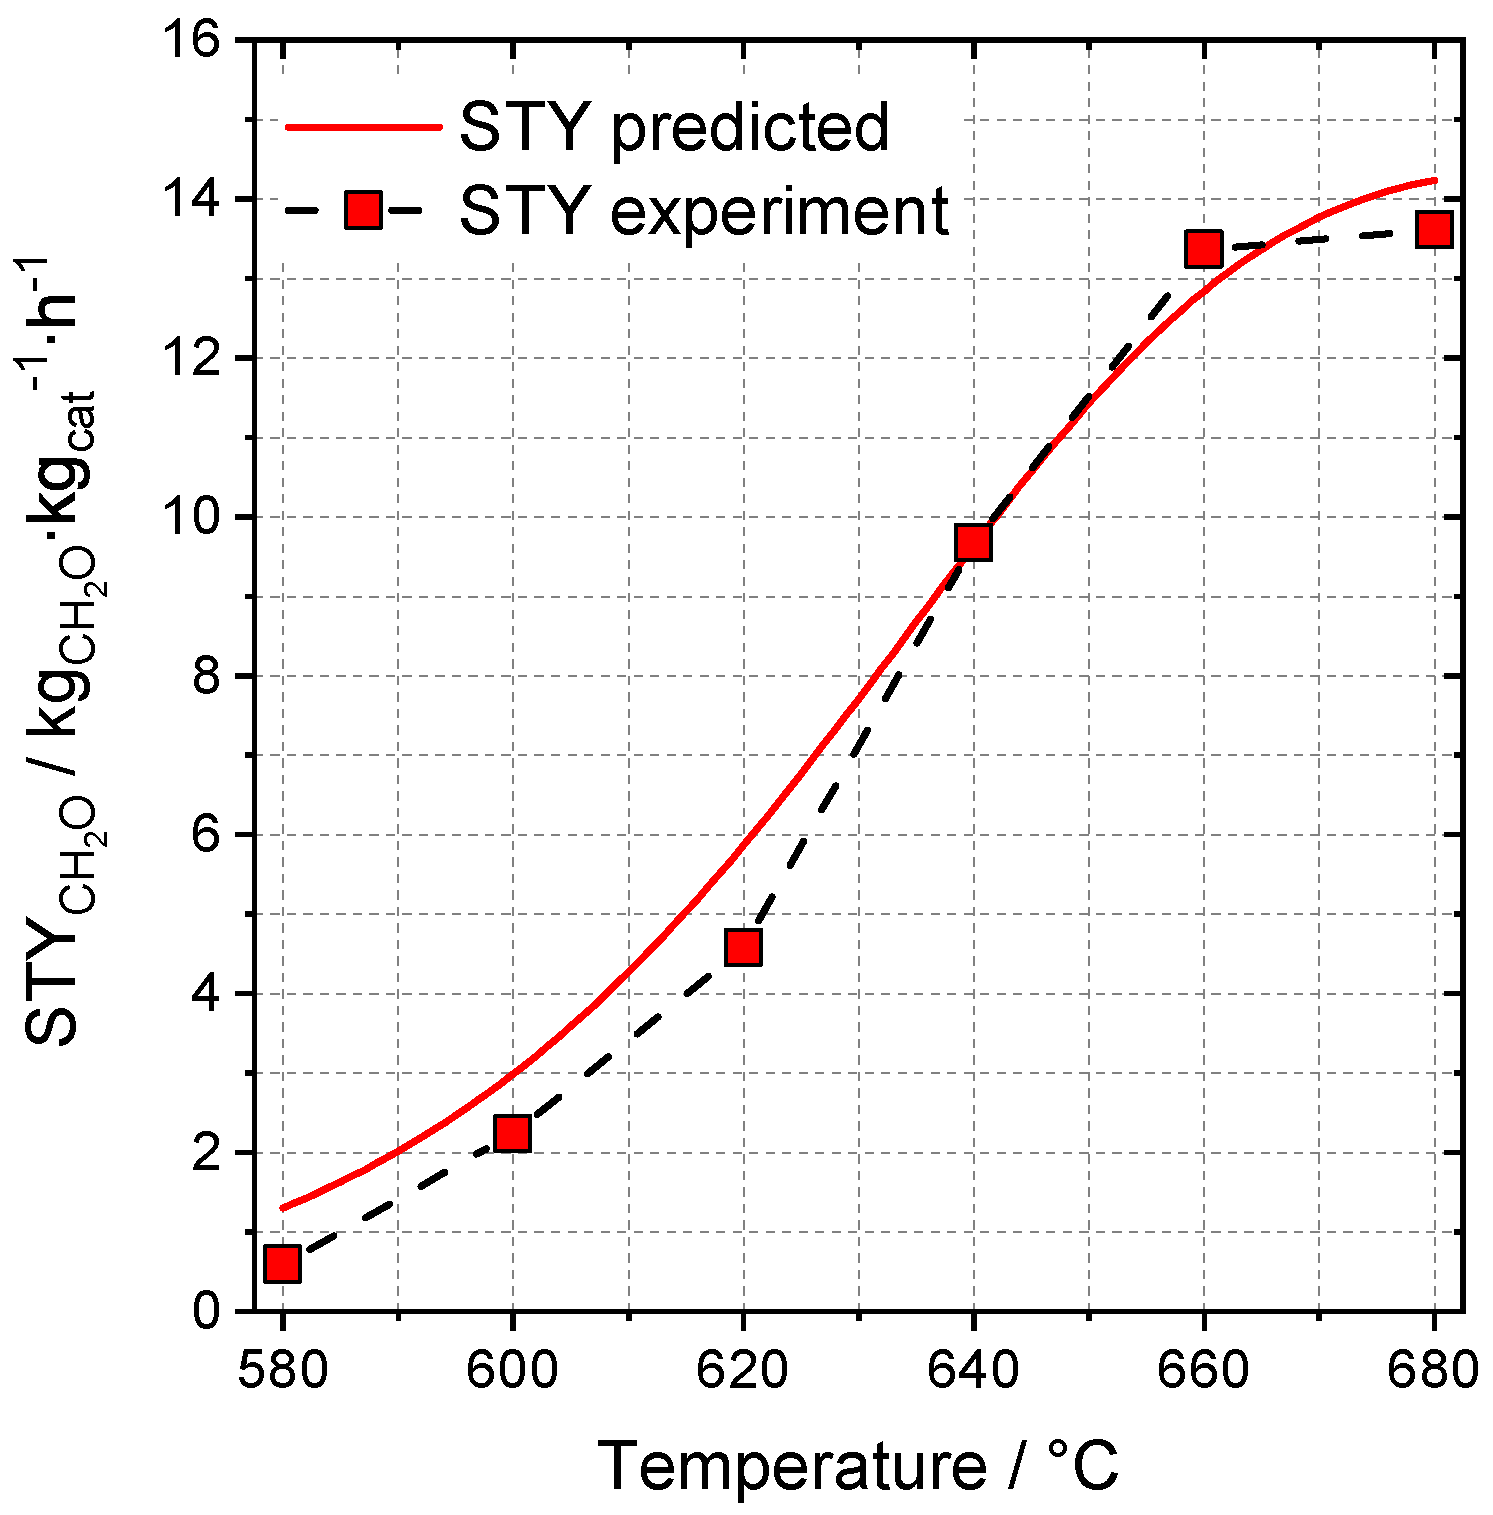
In order to maximize the space-time yield, a high flow of methane must meet a high formaldehyde yield. Hence, a minimum nitrogen dilution and a maximum GHSV are necessary since these parameters nearly linearly decrease and increase the space-time yield, as shown in Figure S14a,b. When choosing the right amount of water and oxygen, the situation is somewhat more complicated since both parameters increase the formaldehyde yield while decreasing the flow of methane. The point with the highest space-time yield within the grid is predicted at 680 °C, 960,000 L∙kg−1∙h−1, 15% O2, 0% N2 and 20% H2O with 14.7 kgCH2O∙kgcat∙h1. The influences of oxygen and water at this point are shown in Figure 8. Without water cofeed, the space-time yield increases with increasing oxygen concentration from 6.0 kgCH2O∙kgcat∙h−1 at 2.5% oxygen up to 11.4 kgCH2O∙kgcat∙h−1 at 13.5% oxygen. Upon addition of water, this maximum is broadened, increased and shifted to higher concentrations of oxygen. Due to overheating of the reactor (see Figure S1) at the point of the predicted maximum space-time yield, it was necessary to choose conditions with a lower concentration of oxygen. As shown in Figure S14c, the predicted space-time yield reaches a plateau between 10 and 18% oxygen at which only slight changes are expected. Hence, the oxygen concentration was decreased to 10% at which a space-time yield of 14.2 kgCH2O∙kgcat∙h−1 was predicted. A comparison of experiment and prediction is shown in Figure 9.
While the space-time yield is overestimated at low temperatures, predicted and experimental values are relatively close above 620 °C. The highest space-time yield was reached at 680 °C with 13.6 kgCH2O∙kgcat∙h−1. To the best of our knowledge, this is by far the highest value ever achieved. Before this work, we had previously reported a space-time yield of 6.7 kgCH2O∙kgcat∙h−1 [5].

3. Materials and Methods

3.1. Catalyst Preparation

V-SBA-15 catalysts were prepared by a co-condensation method. A total of 4 g Pluronic P123 (Sigma Aldrich, St. Louis, MO, USA) was dissolved in 120 mL deionized water at room temperature followed by the addition of 0.147 g NH4VO3 (99%, Merck, Darmstadt, Germany) and further stirring for 1 h. Afterwards, 8.67 g tetraethyl orthosilicate (Sigma Aldrich, 98%) was added dropwise. Thereafter, the pH value was adjusted to 2.0, 2.25, 2.5, 2.75 or 3.0 using 2 M HCl and controlled with a pH meter (Multilab 540, WTW, Weilheim, Germany). The solution was heated to 40 °C and stirred for 24 h. Subsequently, the resulting suspension was transferred into a PTFE inlet for hydrothermal treatment at 100 °C for 48 h. The formed solid was filtered, washed with deionized water and dried at 80 °C overnight. Finally, the sage green powder was calcinated at 625 °C for 16 h (heating rate 1 K∙min−1) in air. The resulting catalysts were denoted as V-SBA-15(x) with x representing the pH value during synthesis.

3.2. Catalyst Characterization

Powder X-ray diffraction patterns were measured by a X’Pert Pro (Panalytical, Malvern, UK) diffractometer under usage of Ni-filtered Cu-Kα radiation (λ = 1.5418 Å, 40 kV, 40 mA).
Vanadium content was determined by inductively coupled plasma–optical emission spectrometry (ICP-OES) carried out by a Varian 715-ES spectrometer (Varian, Inc., Palo Alto, CA, USA). Sample treatment consisted of microwave dissolution at 200 °C and 80 bar in a mixture of hydrofluoric acid and aqua regia.
Specific surface areas and pore size distributions were calculated from N2-sorption measurements by an ASAP2010 (Micromeritics, Norcross, GA, USA) via the BET and BJH method. Samples were treated for 4 h at 400 °C under reduced pressure for removal of water.
Ultraviolet–visible (UV–vis) measurements were performed under usage of an Ava Spec-2048 spectrometer equipped with a FCR-7UV400C-2 (Avantes, Apeldoorn, Netherlands) reflection probe. Spectra were recorded at room temperature after dehydration at 350 °C in flowing synthetic air (100 mL∙min−1) for 30 min. BaSO4 was used as white standard.
Raman spectra were recorded by a LabRAM HR 800 Horiba Jobin YVON spectrometer (Horiba, Oberusel, Germany) equipped with an BX41 microscope (Olympus, Hamburg, Germany) with an excitation wavelength of 532 nm generated by a Nd:YAG solid state laser.
X-ray absorption near edge structure (XANES) spectroscopy measurements were performed at the BAMline (BESSY-II) in backscattered fluorescence mode with a 4-Element Silicon drift detector from LLA Instruments GmbH & Co. KG (Berlin, Germany). This 4 × 30 mm2 diameter detector arrangement allows a wide solid angle acquisition of the fluorescence signal in 2π. The system allows collecting all events nearly dead-time free. The beam was monochromatized using a double crystal monochromator (DCM) in a Si(111) arrangement with an energy resolution of ΔE/E = 2 × 10⁻⁴. The incoming beam was monitored by a 5 cm-long ionization chamber filled with air. XANES spectra were collected at the V K-edge (5465 eV) for the V-SBA-15 materials, NH4VO3 and V2O5 (diluted with BN). All solid samples were placed in a 1 mm sample holder and held in Kapton™tape.

3.3. Catalytic Tests

Catalytic tests were carried out in homemade quartz fixed-bed plug-flow reactors with lengths of 35 cm (experiments in Section 2.2) or 26 cm (collection of training data). Catalyst materials (25 mg diluted with 225 mg quartz sand) were placed and fixed by quartz wool at the center of the reactor at which the diameter decreases from 8 to 4 mm. Temperature monitoring and control was carried out by a thermocouple inside the reactor at the catalyst bed. Gas flow of CH4, O2 and N2 was controlled by means of mass flow controllers (MKS-Instruments, Andover, MA, USA). H2O was led into a heated steel line (150 °C) by a mass flow controller (Mini Cori Flow ML120, Bronkhorst, Kamen, Germany) with an integrated pump (BG 45X15 SI, Dunkermotoren, Bonndorf, Germany). Product analysis was performed via IR spectroscopy under usage of a Matrix MG01 (Bruker, Ettlingen, Germany) for experiments in Section 2.2 or a CX4000 (Gasmet, Karlsruhe, Germany) for the collection of training data. Both devices possess a heated gas cell (180 °C, 10 cm path length) and use reference spectra of CH4, CO, CO2, H2O, CH2O, CH3OH, C2H6 and C2H4 for the analysis of the experimental product spectra. Example IR spectra at 200, 580 and 660 °C are given in Figure S15.
Formulae for the calculation of methane conversion, selectivity of the respective products and formaldehyde space-time yield are given in the Supplementary Materials.

3.4. ANN Modelling

Artificial neural network modelling was performed under usage of the neural network toolbox in MATLAB R2018b. An overview of input and output variables is given in Table 2.
Bayesian regularization backpropagation and Levenberg–Marquardt backpropagation were utilized as training algorithms via trainbr and trainlm functions within the neural net toolbox in MATLAB. Stopping criteria were a µmax value of 1010 for trainbr and a gradient of 10−6 for trainlm. Input values were internally normalized by MATLAB between −1 and 1, and methane conversion and formaldehyde selectivity were normalized between 0 and 1 via
x N = x i x m i n x m a x x m i n
with xi, xmin, xmax and xN denoting the unnormalized value, minimum and maximum value and the normalized value of quantity x. The hyperbolic tangent (tansig) was used as transfer function for the hidden layers, while a linear function (purelin) was used for the output layer, which offers an unrestricted output range.

3.5. Collection of Training Data

For the collection of training data, 40 random points in the parameter space, which is obtained by the combination of the values given in Table 3, were selected. For each point, the catalytic performance was measured in the temperature range of 580 to 680 °C. At some oxygen-rich conditions, an ignition of the reaction mixture occurred, resulting in an overheating of the reactor and an enhanced methane conversion for several minutes, which was accompanied by a decrease in activity thereafter (an exemplarily measurement is given in Figure S1). Data collected after such an event were not involved in the training process. The conditions and the catalytic performances of the obtained 232 training samples are given in Table S3.

4. Conclusions

In the present study, five V-SBA-15 materials were synthesized at pH values of 2.0, 2.25, 2.5, 2.75 and 3.0 and thoroughly characterized by various methods. Within the set of catalysts, the overall amount of vanadium can be increased with the pH value until pH = 2.5. Furthermore, the higher loading resulted in a higher proportion of polymeric VOx species. Both findings are related to the higher amount of decavanadate ions in solutions of higher pH values compared to low concentrated pervanadyl and monovanadate species at lower pH. In the course of the affected species distribution and support morphology, the synthesis pH value also altered the performance of the received V-SBA-15 catalysts in the selective oxidation of methane to formaldehyde. The conversion of methane and the selectivity towards formaldehyde were highest for the catalyst synthesized at an intermediate pH value of 2.5. Hence, this catalyst was chosen for ANN modelling. For this purpose, methane conversion and selectivity towards formaldehyde were measured at 232 different reaction conditions in order to obtain a proper amount of training samples. We utilized an ensemble averaging approach in which the predictions of 20 single neural networks of the architecture 5-10-2-2 were combined. The obtained model was used to calculate the reaction outcome for a variety of reaction conditions, and it could demonstrate how the interplay between oxygen content, nitrogen dilution and water cofeed can positively alter the selectivity-conversion relationship. Finally, the model was used for locating the points of the highest yield and space-time yield within the parameter space. The predictions and experimental measurements at these points showed a good agreement and resulted in a formaldehyde yield of 2.2%. Most importantly, the space-time yield could now be increased to a value of 13.6 kgCH2O∙kgcat∙h−1, which is well above the current state of research.

Supplementary Materials

The following are available online at https://www.mdpi.com/2073-4344/10/12/1411/s1, Figure S1: Temperature at the catalyst bed and oven and methane conversion over time; Figure S2: Pore size distribution of V-SBA-15 catalysts from BJH analyses; Figure S3: Wide-angle X-ray diffraction patterns of V-SBA-15 catalysts; Figure S4: Small-angle X-ray diffraction patterns of V-SBA-15 catalysts; Figure S5: Tauc plots for UV–vis spectra of V-SBA-15(2.0), V-SBA-15(2.5) and V-SBA-15(3.0); Figure S6: Deconvoluted UV–vis spectra of V-SBA-15(2.0), V-SBA-15(2.5) and V-SBA-15(3.0); Figure S7: Methane conversion and carbon balance while heating up from 580 to 660 °C and maintaining 660 °C; Figure S8: Formaldehyde selectivity vs. methane conversion plot at 620 °C; Figure S9: Output of the 20 single neural networks at five different conditions; Figure S10: Learning curves of 5-10-2-2 neural networks in combination with Bayesian regularization (BR) learning; Figure S11: Correlation of predicted and experimental methane conversion and formaldehyde selectivity; Figure S12: Predicted selectivity and conversion at 660 °C over the whole input range; Figure S13: Predicted selectivity and conversion at 660 °C, 720,000 L∙kg−1∙h−1, 15% O2 and 20% (N2 + H2O); Figure S14: Predicted space-time yield at 680 °C, 960,000 L∙kg−1∙h−1, 15% O2 and 20% H2O with varying nitrogen dilution, GHSV or oxygen concentration; Figure S15: Example IR spectra of the product gas at 200, 580 and 660 °C; Table S1: Position and ratio of the areas of the deconvoluted gaussians for UV–vis spectra of V-SBA-15(2.0), V-SBA-15(2.5) and V-SBA-15(3.0); Table S2: Pre-edge peak position of V-SBA-15 materials and reference compounds; Table S3: Training data for the neural network; Animation S1: Formaldehyde selectivity vs. methane conversion at various temperatures.

Author Contributions

Conceptualization, B.K. and S.W.; methodology, B.K.; software, B.K.; validation, B.K.; formal analysis, B.K.; investigation, B.K. and A.K.; resources, S.W. and A.G.B.; data curation, B.K.; writing—original draft preparation, B.K. and A.K.; writing—review and editing, B.K., A.K., A.G.B. and S.W.; visualization, B.K.; supervision, S.W.; project administration, S.W.; funding acquisition, S.W. and A.G.B. All authors have read and agreed to the published version of the manuscript.

Funding

This research was funded by the Deutsche Forschungsgemeinschaft (DFG), grant number 351914377.

Acknowledgments

The authors would like to thank Reinhard Eckelt, Karoline Charlotte Laatz, Henrik Lund, Martin Radtke, Kathleen Schubert, Anja Simmula, Philip Stoer and Kirill Yusenko for analytical support. The authors are thankful for advices concerning machine learning by Nikolaos Moustakas.

Conflicts of Interest

The authors declare no conflict of interest.

References

  1. Company BP. BP Statistical Review of World Energy; British Petroleum Co.: London, UK, 2020. [Google Scholar]
  2. Horn, R.; Schlogl, R. Methane Activation by Heterogeneous Catalysis. Catal. Lett. 2015, 145, 23–39. [Google Scholar] [CrossRef] [Green Version]
  3. Baba, T.; Miyaji, A. Catalysis and the Mechanism of Methane Conversion to Chemicals; Springer Nature Singapore Pte Ltd.: Singapore, 2020. [Google Scholar]
  4. Kondratenko, E.V.; Peppel, T.; Seeburg, D.; Kondratenko, V.A.; Kalevaru, N.; Martin, A.; Wohlrab, S. Methane conversion into different hydrocarbons or oxygenates: Current status and future perspectives in catalyst development and reactor operation. Catal. Sci. Technol. 2017, 7, 366–381. [Google Scholar] [CrossRef]
  5. Seeburg, D.; Bentrup, U.; Kunkel, B.; Vu, T.T.H.; Dang, T.T.H.; Wohlrab, S. Influence of hydrothermal ageing time on the performance of in situ prepared VMCM-41 catalysts in the selective oxidation of methane to formaldehyde. Microporous Mesoporous Mater. 2019, 288, 109581. [Google Scholar] [CrossRef]
  6. Nguyen, L.D.; Loridant, S.; Launay, H.; Pigamo, A.; Dubois, J.L.; Millet, J.M.M. Study of new catalysts based on vanadium oxide supported on mesoporous silica for the partial oxidation of methane to formaldehyde: Catalytic properties and reaction mechanism. J. Catal. 2006, 237, 38–48. [Google Scholar] [CrossRef]
  7. Ruddy, D.A.; Ohler, N.L.; Bell, A.T.; Tilley, T.D. Thermolytic molecular precursor route to site-isolated vanadia-silica materials and their catalytic performance in methane selective oxidation. J. Catal. 2006, 238, 277–285. [Google Scholar] [CrossRef]
  8. Pirovano, C.; Schonborn, E.; Wohlrab, S.; Kalevaru, V.N.; Martin, A. On the performance of porous silica supported VOx catalysts in the partial oxidation of methane. Catal. Today 2012, 192, 20–27. [Google Scholar] [CrossRef]
  9. Liu, Y.M.; Feng, W.L.; Li, T.C.; He, H.Y.; Dai, W.L.; Huang, W.; Cao, Y.; Fan, K.N. Structure and catalytic properties of vanadium oxide supported on mesocellulous silica foams (MCF) for the oxidative dehydrogenation of propane to propylene. J. Catal. 2006, 239, 125–136. [Google Scholar] [CrossRef]
  10. Wang, Y.; Zhang, Q.H.; Ohishi, Y.; Shishido, T.; Takehira, K. Synthesis of V-MCM-41 by template-ion exchange method and its catalytic properties in propane oxidative dehydrogenation. Catal. Lett. 2001, 72, 215–219. [Google Scholar] [CrossRef]
  11. Hess, C.; Hoefelmeyer, J.D.; Tilley, T.D. Spectroscopic characterization of highly dispersed vanadia supported on SBA-15. J. Phys. Chem. B 2004, 108, 9703–9709. [Google Scholar] [CrossRef]
  12. Baltes, M.; Cassiers, K.; Van Der Voort, P.; Weckhuysen, B.M.; Schoonheydt, R.A.; Vansant, E.F. MCM-48-supported vanadium oxide catalysts, prepared by the molecular designed dispersion of VO(acac)(2): A detailed study of the highly reactive MCM-48 surface and the structure and activity of the deposited VOx. J. Catal. 2001, 197, 160–171. [Google Scholar] [CrossRef]
  13. Zhu, H.B.; Ould-Chikh, S.; Dong, H.L.; Llorens, I.; Saih, Y.; Anjum, D.H.; Hazemann, J.L.; Basset, J.M. VOx/SiO2 Catalyst Prepared by Grafting VOCl3 on Silica for Oxidative Dehydrogenation of Propane. Chemcatchem 2015, 7, 3332–3339. [Google Scholar] [CrossRef]
  14. Högerl, M.P.; Serena Goh, L.M.; Abou-Hamad, E.; Barman, S.; Dachwald, O.; Pasha, F.A.; Pelletier, J.; Köhler, K.; D’Elia, V.; Cavallo, L.; et al. SOMC grafting of vanadium oxytriisopropoxide (VO(OiPr)3) on dehydroxylated silica; analysis of surface complexes and thermal restructuring mechanism. RSC Adv. 2018, 8, 20801–20808. [Google Scholar] [CrossRef] [Green Version]
  15. Selvaraj, M.; Park, D.W. Highly selective synthesis of cyclododecanone over mesostructured VSBA-15 catalysts. Appl. Catal. A Gen. 2010, 388, 22–30. [Google Scholar] [CrossRef]
  16. Jurado, M.J.; Gracia, M.D.; Campelo, J.M.; Luque, R.; Marinas, J.M.; Romero, A.A. Selective epoxidation of alkenes using highly active V-SBA-15 materials: Microwave vs. conventional heating. J. Mater. Chem. 2009, 19, 8603–8609. [Google Scholar] [CrossRef]
  17. Ying, F.; Li, J.H.; Huang, C.J.; Weng, W.Z.; Wan, H.L. Direct synthesis and superior catalytic performance of V-containing SBA-15 mesoporous materials for oxidative dehydrogenation of propane. Catal. Lett. 2007, 115, 137–142. [Google Scholar] [CrossRef] [Green Version]
  18. Janiszewska, E.; Held, A.; Nowinska, K.; Kowalak, S. One-pot synthesis of vanadium-containing silica SBA-3 materials and their catalytic activity for propene oxidation. RSC Adv. 2019, 9, 4671–4681. [Google Scholar] [CrossRef] [Green Version]
  19. Lim, S.; Haller, G.L. Preparation of Highly Ordered Vanadium-Substituted MCM-41: Stability and Acidic Properties†. J. Phys. Chem. B 2002, 106, 8437–8448. [Google Scholar] [CrossRef]
  20. Dang, T.T.H.; Seeburg, D.; Radnik, J.; Kreyenschulte, C.; Atia, H.; Vu, T.T.H.; Wohlrab, S. Influence of V-sources on the catalytic performance of VMCM-41 in the selective oxidation of methane to formaldehyde. Catal. Commun. 2018, 103, 56–59. [Google Scholar] [CrossRef]
  21. Wang, H.Q.; Qian, W.; Chen, J.; Wu, Y.; Xu, X.Y.; Wang, J.; Kong, Y. Spherical V-MCM-48: The synthesis, characterization and catalytic performance in styrene oxidation. RSC Adv. 2014, 4, 50832–50839. [Google Scholar] [CrossRef]
  22. Piumetti, M.; Bonelli, B.; Massiani, P.; Millot, Y.; Dzwigaj, S.; Gaberova, L.; Armandi, M.; Garrone, E. Novel vanadium-containing mesocellular foams (V-MCF) obtained by direct synthesis. Microporous Mesoporous Mater. 2011, 142, 45–54. [Google Scholar] [CrossRef]
  23. Aktas, O.; Yasyerli, S.; Dogu, G.; Dogu, T. Structural variations of MCF and SBA-15-like mesoporous materials as a result of differences in synthesis solution pH. Mater. Chem. Phys. 2011, 131, 151–159. [Google Scholar] [CrossRef]
  24. Post, K.; Robins, R.G. Thermodynamic diagrams for the vanadium-water system at 298·15K. Electrochim. Acta 1976, 21, 401–405. [Google Scholar] [CrossRef]
  25. Larson, J.W. Thermochemistry of Vanadium(5+) in Aqueous-Solutions. J. Chem. Eng. Data 1995, 40, 1276–1280. [Google Scholar] [CrossRef]
  26. Gao, F.; Zhang, Y.H.; Wan, H.Q.; Kong, Y.; Wu, X.C.; Dong, L.; Li, B.Q.; Chen, Y. The states of vanadium species in V-SBA-15 synthesized under different pH values. Microporous Mesoporous Mater. 2008, 110, 508–516. [Google Scholar] [CrossRef]
  27. Zhao, L.N.; Dong, Y.L.; Zhan, X.L.; Cheng, Y.; Zhu, Y.J.; Yuan, F.L.; Fu, H.G. One-pot Hydrothermal Synthesis of Mesoporous V-SBA-16 with a Function of the pH of the Initial Gel and its Improved Catalytic Performance for Benzene Hydroxylation. Catal. Lett. 2012, 142, 619–626. [Google Scholar] [CrossRef]
  28. Zhang, J.; Burkle-Vitzthum, V.; Marquaire, P.M. An Investigation on the Role of NO2 in the Oxidation of Methane to Formaldehyde. Combust. Sci. Technol. 2015, 187, 1139–1156. [Google Scholar] [CrossRef]
  29. Bañares, M.A.; Cardoso, J.H.; Hutchings, G.J.; Correa Bueno, J.M.; Fierro, J.L.G. Selective oxidation of methane to methanol and formaldehyde over V2O5/SiO2 catalysts. Role of NO in the gas phase. Catal. Lett. 1998, 56, 149–153. [Google Scholar] [CrossRef]
  30. Khan, M.M.; Somorjai, G.A. A Kinetic-Study of Partial Oxidation of Methane with Nitrous-Oxide on a Molybdena Silica Catalyst. J. Catal. 1985, 91, 263–271. [Google Scholar] [CrossRef] [Green Version]
  31. Berndt, H.; Martin, A.; Bruckner, A.; Schreier, E.; Muller, D.; Kosslick, H.; Wolf, G.U.; Lucke, B. Structure and catalytic properties of VOx/MCM materials for the partial oxidation of methane to formaldehyde. J. Catal. 2000, 191, 384–400. [Google Scholar] [CrossRef]
  32. Meltser, L.Z.; Garibyan, T.A.; Grigoryan, R.R.; Muradyan, A.A.; Kurina, L.N. Effect of Homogeneous Initiator on Heterogeneous-Homogeneous Oxidation of Methane. React. Kinet. Catal. Lett. 1989, 38, 229–236. [Google Scholar] [CrossRef]
  33. Tsang, W.; Hampson, R.F. Chemical Kinetic Data Base for Combustion Chemistry. Part I. Methane and Related Compounds. J. Phys. Chem. Ref. Data 1986, 15, 1087–1279. [Google Scholar] [CrossRef]
  34. Takemoto, T.; Tabata, K.; Teng, Y.; Yao, S.; Nakayama, A.; Suzuki, E. Optimization of C1-Oxygenates for the Selective Oxidation of Methane in a Gas-Phase Reaction of CH4−O2−NO at Atmospheric Pressure. Energy Fuels 2001, 15, 44–51. [Google Scholar] [CrossRef]
  35. Mackie, J.C. Partial Oxidation of Methane-the Role of the Gas-Phase Reactions. Catal. Rev. 1991, 33, 169–240. [Google Scholar] [CrossRef]
  36. Wachs, I.E. Recent conceptual advances in the catalysis science of mixed metal oxide catalytic materials. Catal. Today 2005, 100, 79–94. [Google Scholar] [CrossRef]
  37. Myers, R.H.; Montgomery, D.C. Response Surface Methodology: Process and Product in Optimization Using Designed Experiments; John Wiley & Sons, Inc.: Hoboken, NJ, USA, 1995. [Google Scholar]
  38. Toyao, T.; Maeno, Z.; Takakusagi, S.; Kamachi, T.; Takigawa, I.; Shimizu, K. Machine Learning for Catalysis Informatics: Recent Applications and Prospects. ACS Catal. 2020, 10, 2260–2297. [Google Scholar] [CrossRef]
  39. Li, H.; Zhang, Z.; Liu, Z.J. Application of Artificial Neural Networks for Catalysis: A Review. Catalysts 2017, 7, 306. [Google Scholar] [CrossRef]
  40. Abiodun, O.I.; Jantan, A.; Omolara, A.E.; Dada, K.V.; Mohamed, N.A.; Arshad, H. State-of-the-art in artificial neural network applications: A survey. Heliyon 2018, 4, e00938. [Google Scholar] [CrossRef] [Green Version]
  41. McCulloch, W.S.; Pitts, W. A logical calculus of the ideas immanent in nervous activity. Bull. Math. Biophys. 1943, 5, 115–133. [Google Scholar] [CrossRef]
  42. Cybenko, G. Approximation by superpositions of a sigmoidal function. Math. Control Signals Syst. 1989, 2, 303–314. [Google Scholar] [CrossRef]
  43. Jain, A.K.; Mao, J.C.; Mohiuddin, K.M. Artificial neural networks: A tutorial. Computer 1996, 29, 31–44. [Google Scholar] [CrossRef] [Green Version]
  44. Gasteiger, J.; Zupan, J. Neural Networks in Chemistry. Angew. Chem. Int. Ed. 1993, 32, 503–527. [Google Scholar] [CrossRef]
  45. Goldsmith, B.R.; Esterhuizen, J.; Liu, J.-X.; Bartel, C.J.; Sutton, C. Machine learning for heterogeneous catalyst design and discovery. AlChE J. 2018, 64, 2311–2323. [Google Scholar] [CrossRef]
  46. Panerati, J.; Schnellmann, M.A.; Patience, C.; Beltrame, G.; Patience, G.S. Experimental methods in chemical engineering: Artificial neural networks–ANNs. Can. J. Chem. Eng. 2019, 97, 2372–2382. [Google Scholar] [CrossRef]
  47. Timoshenko, J.; Frenkel, A.I. “Inverting” X-ray Absorption Spectra of Catalysts by Machine Learning in Search for Activity Descriptors. ACS Catal. 2019, 9, 10192–10211. [Google Scholar] [CrossRef]
  48. Mizoguchi, T.; Kiyohara, S. Machine learning approaches for ELNES/XANES. Microscopy 2020, 69, 92–109. [Google Scholar] [CrossRef] [PubMed] [Green Version]
  49. Darabi Mahboub, M.J.; Rostamizadeh, M.; Dubois, J.-L.; Patience, G.S. Partial oxidation of 2-methyl-1,3-propanediol to methacrylic acid: Experimental and neural network modeling. RSC Adv. 2016, 6, 114123–114134. [Google Scholar] [CrossRef]
  50. Sing, K.S.W. Reporting physisorption data for gas/solid systems with special reference to the determination of surface area and porosity (Recommendations 1984). Pure Appl. Chem. 1985, 57, 603–619. [Google Scholar] [CrossRef]
  51. Gao, X.T.; Bare, S.R.; Weckhuysen, B.M.; Wachs, I.E. In situ spectroscopic investigation of molecular structures of highly dispersed vanadium oxide on silica under various conditions. J. Phys. Chem. B 1998, 102, 10842–10852. [Google Scholar] [CrossRef] [Green Version]
  52. Schraml-Marth, M.; Wokaun, A.; Pohl, M.; Krauss, H.-L. Spectroscopic investigation of the structure of silica-supported vanadium oxide catalysts at submonolayer coverages. J. Chem. Soc. Faraday Trans. 1991, 87, 2635–2646. [Google Scholar] [CrossRef]
  53. Bulánek, R.; Čapek, L.; Setnička, M.; Čičmanec, P. DR UV–vis Study of the Supported Vanadium Oxide Catalysts. J. Phys. Chem. C 2011, 115, 12430–12438. [Google Scholar] [CrossRef]
  54. Humbert, B.; Burneau, A.; Gallas, J.P.; Lavalley, J.C. Origin of the Raman Bands, D1 and D2, in High Surface-Area and Vitreous Silicas. J. Non-Cryst. Solids 1992, 143, 75–83. [Google Scholar] [CrossRef]
  55. Galeener, F.L.; Mikkelsen, J.C. Vibrational dynamics in 18O-substituted vitreous SiO2. Phys. Rev. B 1981, 23, 5527–5530. [Google Scholar] [CrossRef]
  56. Borodko, Y.; Ager Iii, J.W.; Marti, G.E.; Song, H.; Niesz, K.; Somorjai, G.A. Structure sensitivity of vibrational spectra of mesoporous silica SBA-15 and Pt/SBA-15. J. Phys. Chem. B 2005, 109, 17386–17390. [Google Scholar] [CrossRef] [PubMed]
  57. Döbler, J.; Pritzsche, M.; Sauer, J. Vibrations of Silica Supported Vanadia: Variation with Particle Size and Local Surface Structure. J. Phys. Chem. C 2009, 113, 12454–12464. [Google Scholar] [CrossRef]
  58. Strunk, J.; Banares, M.A.; Wachs, I.E. Vibrational Spectroscopy of Oxide Overlayers. Top. Catal. 2017, 60, 1577–1617. [Google Scholar] [CrossRef]
  59. Das, N.; Eckert, H.; Hu, H.; Wachs, I.E.; Walzer, J.F.; Feher, F.J. Bonding states of surface vanadium(V) oxide phases on silica: Structural characterization by vanadium-51 NMR and Raman spectroscopy. J. Phys. Chem. 1993, 97, 8240–8243. [Google Scholar] [CrossRef]
  60. Izumi, Y.; Konishi, K.; Obaid, D.M.; Miyajima, T.; Yoshitake, H. X-ray absorption fine structure combined with X-ray fluorescence spectroscopy. Monitoring of vanadium sites in mesoporous titania, excited under visible light by selective detection of vanadium Kbeta5,2 fluorescence. Anal. Chem. 2007, 79, 6933–6940. [Google Scholar] [CrossRef]
  61. Hobson, A.J.; Stewart, D.I.; Bray, A.W.; Mortimer, R.J.G.; Mayes, W.M.; Riley, A.L.; Rogerson, M.; Burke, I.T. Behaviour and fate of vanadium during the aerobic neutralisation of hyperalkaline slag leachate. Sci. Total Environ. 2018, 643, 1191–1199. [Google Scholar] [CrossRef]
  62. Kepert, D.L. The Early Transition Metals; Academic Press: London, UK, 1972. [Google Scholar]
  63. Lincoln, W.P.; Skrzypek, J. Synergy of Clustering Multiple Back Propagation Networks. Proceedings of Advances in Neural Information Processing Systems, Denver, CO, USA, 27–30 November 1989; pp. 650–657. [Google Scholar]
  64. Horn, D.; Naftaly, U.; Intrator, N. Large Ensemble Averaging. In Neural Networks: Tricks of the Trade; Orr, G.B., Müller, K.-R., Eds.; Springer: Berlin/Heidelberg, Germany, 1998; pp. 133–139. [Google Scholar] [CrossRef]
  65. Hansen, L.K.; Salamon, P. Neural Network Ensembles. IEEE Trans. Pattern Anal. Mach. Intell. 1990, 12, 993–1001. [Google Scholar] [CrossRef] [Green Version]
  66. Spencer, N.D.; Pereira, C.J. V2O5-SiO2-Catalyzed Methane Partial Oxidation with Molecular-Oxygen. J. Catal. 1989, 116, 399–406. [Google Scholar] [CrossRef]
  67. Haynes, W.M. CRC Handbook of Chemistry and Physics, 97th ed.; CRC Press LLC Taylor & Francis Group: Boca Raton, FL, USA; Florence, Italy, 2016. [Google Scholar]
  68. Launay, H.; Loridant, S.; Pigamo, A.; Dubois, J.L.; Millet, J.M.M. Vanadium species in new catalysts for the selective oxidation of methane to formaldehyde: Specificity and molecular structure dynamics with water. J. Catal. 2007, 246, 390–398. [Google Scholar] [CrossRef]
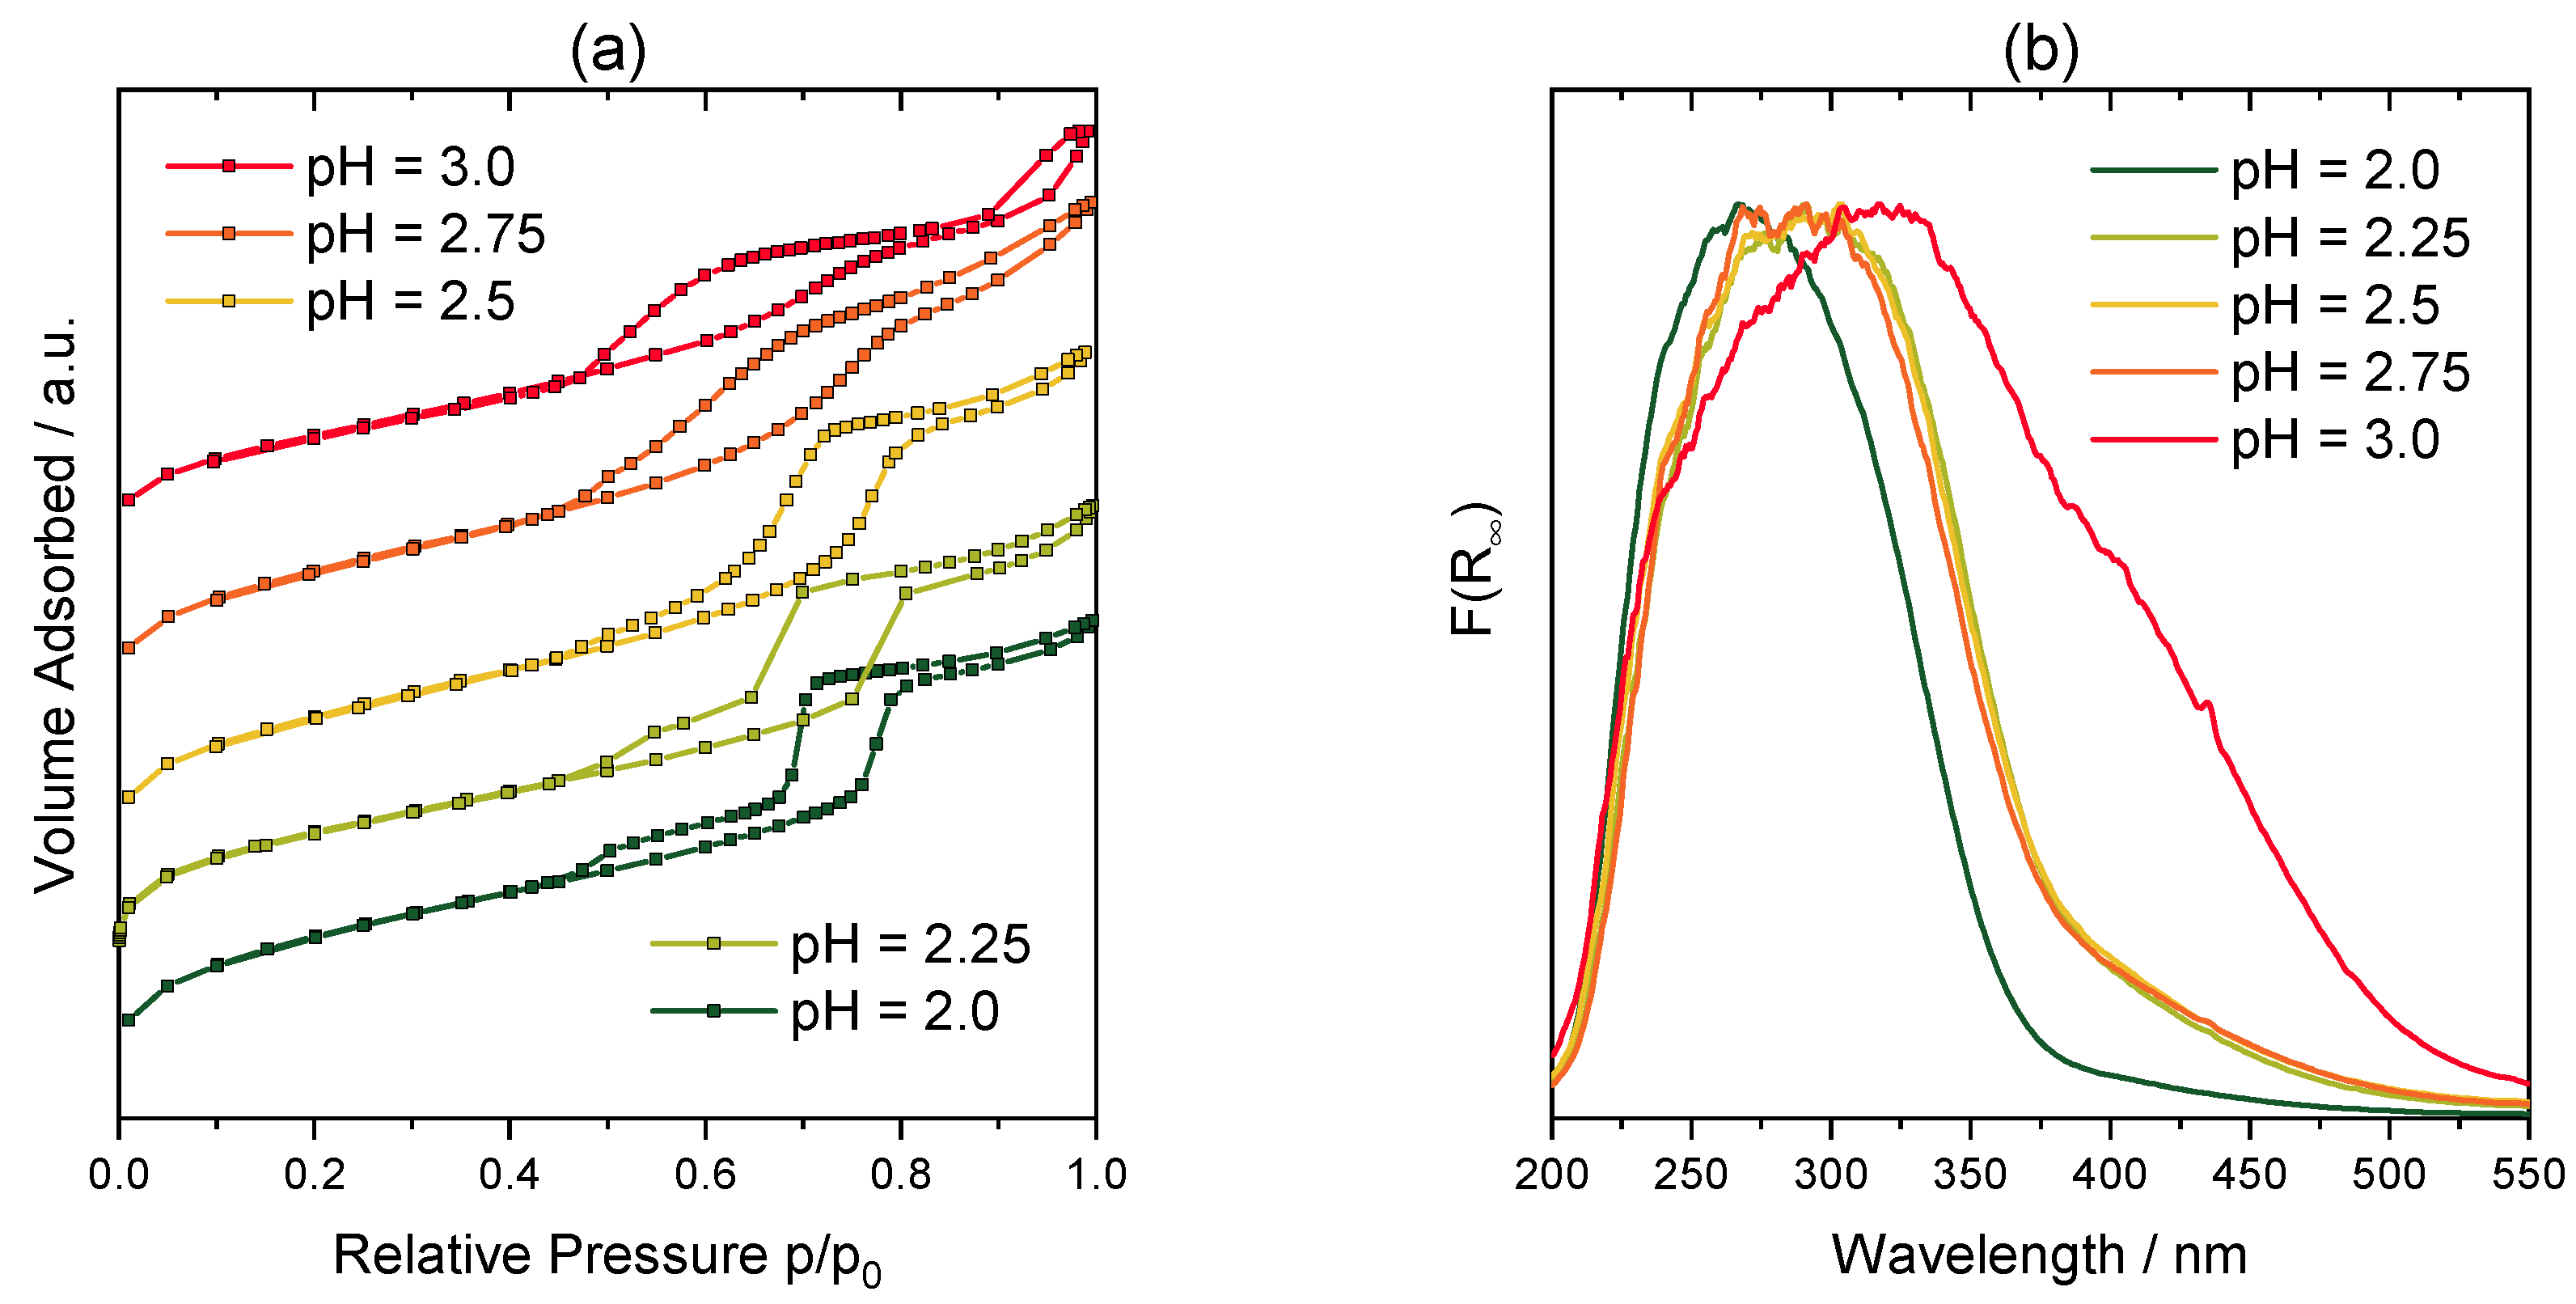
Figure 1. (a) Nitrogen isotherms of V-SBA-15 catalysts. (b) Normalized spectra of V-SBA-15 catalysts after dehydration at 350 °C for 30 min in synthetic air (F = 100 mL∙min−1). (c) Raman spectra of V-SBA-15 catalysts at ambient conditions (stacked). (d) V K-edge X-ray absorption near edge structure (XANES) spectra of V-SBA-15 samples and reference compounds at ambient conditions.
Catalysts 10 01411 g001aCatalysts 10 01411 g001b
Figure 2. Catalytic performance of V-SBA-15 materials in the selective oxidation of methane between 580 and 660 °C (25 mg catalyst, gas hourly space velocity (GHSV) = 720,000 L∙kg−1∙h−1, CH4:O2 9:1): (a) methane conversion XCH4, (b) formaldehyde selectivity SCH2O.
Catalysts 10 01411 g002
Figure 3. (a) Space-time yield of formaldehyde obtained by V-SBA-15 materials in the selective oxidation of methane between 580 and 660 °C (25 mg catalyst, GHSV = 720,000 L∙kg−1∙h−1, CH4:O2 9:1). (b) Formaldehyde selectivity vs. methane conversion recorded at 600 °C (25 mg catalyst, GHSV = 720,000–120,000 L∙kg−1∙h−1, CH4:O2 9:1).
Catalysts 10 01411 g003
Figure 4. Performance of different neural network topologies on test and training set trained via Bayesian regularization or the Levenberg–Marquardt algorithm. Markers indicate average mean squared error on normalized output data, and the respective whiskers represent the standard deviation. Each combination of neural network and training algorithm was trained and evaluated 20 times under usage of a new random division of the data into a test and training set for each run.
Catalysts 10 01411 g004
Scheme 1. Final neural network architecture.
Catalysts 10 01411 sch001
Figure 5. (a) Predicted selectivity and conversion over the whole input range (white) and training data (red). (bd) Predicted selectivity and conversion at 660 °C for the whole input range. Markers are colored by values of oxygen concentration (b), nitrogen dilution (c) or water cofeed (d).
Catalysts 10 01411 g005
Figure 6. Effect of GHSV and temperature on formaldehyde yield at 20% O2, 50% N2 and 20% H2O.
Catalysts 10 01411 g006
Figure 7. Predicted and experimental yield at 600,000 L∙kg−1∙h−1, 20% O2, 50% N2 and 20% H2O.
Catalysts 10 01411 g007
Figure 8. Effect of water cofeed and oxygen concentration on formaldehyde space-time yield at 680 °C, 960,000 L∙kg−1∙h−1 and 0% N2.
Catalysts 10 01411 g008
Figure 9. Predicted and experimental space-time yield at 960,000 L∙kg−1∙h−1, 10% O2, 0% N2 and 20% H2O.
Catalysts 10 01411 g009
Table 1. Basic structural properties of V-SBA-15 catalysts.
CatalystV%/wt%SSA/m2∙g−1Pore Volume/cm−3∙g−1
V-SBA-15(2.0)1.17710.94
V-SBA-15(2.25)1.47570.92
V-SBA-15(2.5)1.97251.00
V-SBA-15(2.75)1.76920.97
V-SBA-15(2.0)1.95740.82
Table 2. Input and output variables used for ANN modelling.
InputOutput
Temperature TConversion of methane X(CH4)
Gas hourly space velocity (GHSV)Selectivity towards formaldehyde S(CH2O)
Concentration of oxygen c(O2)
Concentration of nitrogen c(N2)
Concentration of water c(H2O)
Table 3. Values of parameters for the collection of training data.
GHSV a/L∙kg−1∙h−1c(O2) b/%c(N2) c/%c(H2O) c/%
960,0002.500
720,0005202.5
480,00010405
240,000156010
20 15
20
a—gas hourly space velocity; b—concentration relative to methane; c—absolute concentration.
Publisher’s Note: MDPI stays neutral with regard to jurisdictional claims in published maps and institutional affiliations.