Article

Enhanced Visible Light Photocatalytic Activity of N and Ag Doped and Co-Doped TiO2 Synthesized by Using an In-Situ Solvothermal Method for Gas Phase Ammonia Removal

by
Adilah Sirivallop
1,2,
Thanita Areerob
3 and
Siriluk Chiarakorn
4,*
1
Division of Environmental Technology, The Join Graduate School of Energy and Environment, King Mongkut’s University of Technology Thonburi, Bangkok 10140, Thailand
2
Center of Excellence on Energy Technology and Environment (CEE), PERDO, Ministry of Higher Education, Science, Research and Innovation, Bangkok 10140, Thailand
3
Faculty of Technology and Environment, Prince of Songkla University, Phuket Campus, Phuket 83120, Thailand
4
Environmental Technology Program, School of Energy, Environment and Materials, King Mongkut’s University of Technology Thonburi, Bangkok 10140, Thailand
*
Author to whom correspondence should be addressed.
Catalysts 2020, 10(2), 251; https://doi.org/10.3390/catal10020251
Submission received: 31 January 2020 / Revised: 15 February 2020 / Accepted: 16 February 2020 / Published: 19 February 2020
(This article belongs to the Special Issue Commemorative Issue in Honor of Professor Hugo de Lasa)

Abstract

:
Single doping and co-doping of N and Ag on TiO2 were successfully prepared by using an in-situ solvothermal method and their structural properties and chemical compositions were characterized. The results indicated that all photocatalysts displayed in TiO2 anatase crystal phase, and a small mesoporous structure was observed in the doped materials. The main roles of N and Ag on the property and photocatalytic activity of TiO2 were different. The N doping has significantly enhanced homogenous surface morphology and specific surface area of the photocatalyst. While Ag doping was narrowing the band gap energy, extending light absorption toward a visible region by surface plasmon resonance as well as delaying the recombination rate of electron and hole of TiO2. The existence of N in TiO2 lattice was observed in two structural linkages such as substitutional nitrogen (Ti-O-N) and interstitial nitrogen (O-Ti-N). Silver species could be in the form of Ag0 and Ag2O. The photocatalytic performance of the photocatalysts coated on stainless steel mesh was investigated by the degradation of aqueous MB and gas phase NH3 under visible LED light illumination for three recycling runs. The highest photocatalytic activity and recyclability were reached in 5% N/Ag-TiO2 showing the efficiency of 98.82% for methylene blue (MB) dye degradation and 37.5% for NH3 removal in 6 h, which was 2.7 and 4.3 times, respectively. This is greater than that of pure TiO2. This was due to the synergistic effect of N and Ag doping.

Graphical Abstract

1. Introduction

Since the industrialization and agricultural productivities are growing up steadily, which results in the rising levels of water and air pollution in the environment. The environmental pollutants can be divided into two major groups, which include the organic pollutants (such as volatile organic compounds (VOCs) and dyes) and the inorganic pollutants (such as NH3, H2S, and other metal ions). Those pollutants directly impact on the human and well-being. Nevertheless, there are three main treatment processes that are widely used for controlling pollutant emissions in the environment such as the biological, physical, and chemical treatment technologies [1,2]. The chemical treatment technology, specifically the photocatalytic oxidation reaction (PCO), is one of the most feasibility chemical processes for solving the problem of environmental issues because it has a decomposability of a wide variety of hazardous organic and inorganic pollutants [3,4,5]. Among semiconductor materials, Titanium dioxide (TiO2) [6] is the most promising photocatalytic material suitable for industrial and commercial applications at the present and it will have received much more attention in the future because TiO2 has many advantages including non-toxicity, low cost, high photosensitivity, and a strong photocatalytic reaction [7].
The basic mechanism of the PCO reaction of TiO2 involves with three major steps including (a) the light absorption, (b) the generation and separation of electrons (e) and holes (h+) pairs, and (c) the oxidation-reduction reaction at the TiO2 surface. When TiO2 is exposed to the light, e and h+ are generated in the conduction band (CB) and valence band (VB) of TiO2, respectively. The reaction between photoexcited electrons (e) and oxygen (O2) molecules on the TiO2 surface can produce the superoxide ( O 2 ) radicals. The reaction of the positive holes (h+) and water (H2O) molecules can generate the hydroxyl ( O H · ) radicals. Both O 2 and O H · radicals are the most powerful oxidants in the PCO process [7,8], which can rapidly damage several pollutants in the environment. However, there are some limitations on the utilization and application in a wide range of TiO2. For example, the wide band gap energy (about 3.2 eV) of TiO2 only absorbs the UV light [9]. However, the UV light accounts for only a small fraction of the sun energy (about 4%–5%) as compared to visible light (45%) [10]. The optical property greatly restricts the visible photocatalytic activity of TiO2. The high recombination rate of e/h+ pairs in TiO2 is one of the major limits directly involving the deactivation of the PCO process [11]. For these reasons, there are numerous research studies focusing on the modification of TiO2 properties in order to reduce all limitations and to enhance the photocatalytic performance of TiO2 to be able to activate under a visible light region. Doping with metals and non-metals is an effective process for TiO2 alteration and visible photocatalytic activity enhancement [12,13,14,15]. Among many metals and non-metal dopants, silver (Ag) metal and nitrogen (N) have been considered as the most efficient way to reduce the band gap energy (Eg), restrain e/h+ recombination, and enhance the photocatalytic performance of TiO2. In literature, the band gap energy of TiO2 was found to reduce by decreasing from 3.20 eV to be around 3.10 eV and 2.9 eV after doping by N [16,17,18,19] and Ag [20,21,22], respectively. This outcome results in an improvement in the visible light absorption ability. The N doping can reduce band gap energy of TiO2 by replacing O 2p and form a mid-gap energy state above the valence band [19]. The incorporation of Ag can narrow the band gap energy of TiO2 with the surface plasmon resonance (SPR) under the conduction band. Furthermore, Ag also serves as an electron trap with the Schottky barrier, which can prevent the charge recombination and significantly improve the photocatalytic activity of TiO2 [23,24,25]. The crystal structure, morphology, and surface area of TiO2 play the important factors that strongly influence on the photocatalysis efficiency as well. A solvothermal method is an in-situ synthesis process that has been identified as an effective synthetic route to prepare the TiO2 photocatalyst with a small crystallite size and high specific surface area. Furthermore, there is a large number of publications reporting that metals and nonmetals were successfully incorporated into the TiO2 lattice by the solvothermal method [26,27]. In addition, there are several studies about the doping of N and Ag on TiO2 photocatalysts for decomposing organic pollutants but the N and Ag co-doping on TiO2, and the dominant roles and synergistic effects of N and Ag on photocatalytic property and performance of TiO2 are scarcely found.
The purpose of this present work was to prepare TiO2, N-doped TiO2, Ag-doped TiO2, and N/Ag co-doped TiO2 photocatalysts by using an in-situ solvothermal method, and the important roles of N and Ag doping on the physicochemical properties of TiO2 and their photocatalytic performance in an aqueous phase and a gas phase under visible light-emitting diode (LED) irradiation were also investigated. Methylene blue (MB) dye solution and gaseous ammonia (NH3) were used to simulate water and air pollution in this PCO process. A cylinder of stainless-steel wire mesh coated by the optimal photocatalyst was employed as a photocatalytic air purifier in the reactor for NH3 decomposition.

2. Results and Discussion

2.1. Material Characteristics

2.1.1. Color and Surface Morphology

Figure 1 (inset) represents the colored powders of the prepared photocatalysts, which are TiO2, 10% N-TiO2, 10% Ag-TiO2, and 10% N/Ag-TiO2. The undoped TiO2 or pure TiO2 powder has a bright-white color. 10% N-TiO2, 10% Ag-TiO2, and 10% N/Ag-TiO2 are shown in a pale-yellow, pale-grey, and dark grey color, respectively. The doped TiO2 powders with other dopant loadings were obtained in a slightly lighter color for 5% mol loading and slightly darker color for 15% mol loading as compared to 10% mol dopant loading (the images are not shown). A different color appearance in a photocatalyst was associated with the doping agent sort and its visible light absorption and reflection abilities. For instance, pure TiO2 appears in a white color because all the wavelengths of visible lights were reflected. After doping, the doped photocatalysts have a better visible light absorption and reflects some colors from each material surface as well [28].
The surface morphology and particle size of photocatalysts were investigated by SEM. The SEM images in Figure 1 reveals that all the prepared photocatalysts have the same uniform in a spherical shape. Undoped TiO2 has a large particle agglomeration, which the particle size was around 60–100 nm. The doped particles were in a small size and homogenous distribution. The estimated particle size was around 40–50 nm for Ag-TiO2, 15–20 nm for N-TiO2, and 30–40 nm for N/Ag-TiO2. Hence, the changing color and surface morphology of the doped photocatalyst as compared to pure white TiO2 could be primarily attributed to the introduction of N and Ag into TiO2 lattice [29].

2.1.2. Specific Surface Area and Porosity

In order to investigate the effect of N and Ag doping on surface area and porosity of the prepared photocatalysts, N2 adsorption-desorption analysis was carried out. The Brunauer-Emmett-Teller (BET) method was applied for a specific surface area calculation. Pore size distribution, pore volume, and pore diameter was determined by Barrett-Joyner-Halenda (BJH) analysis. Figure 2 shows the N2 adsorption-desorption isotherm and BJH pore size distribution curves (inset) of different photocatalysts of undoped TiO2, N-TiO2, Ag-TiO2, and N/Ag-TiO2 varying the amount of dopant loading (5%–15% mol). The data on the BET surface area, pore volume, and pore size of all samples are listed in Table 1. It can be observed that, according to IUPAC physisorption isotherm classification [28,29,30], undoped TiO2 exhibited a type II physisorption isotherm, which was characteristic to a nonporous material with lower N2 adsorption due to its much smaller BET surface area of 11.64 m2g−1. Clearly, a high BET surface area and mesoporous structure were observed upon doping. The largest BET surface area of 122.80–101.91 m2g−1 and narrow BJH pore size distribution (around 5–10 nm) were accomplished in the samples of N-TiO2, which demonstrated a type IV physisorption isotherm and H2 hysteresis loop indicating a mesoporous material. Ag-TiO2 and N/Ag-TiO2 displayed the BET surface area in a type IV physisorption isotherm with type H1 hysteresis loops at the higher relative pressure (P/P0 ≈ 0.8–0.9) accordance with their larger mesopore characteristic. Furthermore, one can observe that the BET surface area of the N/Ag co-doped TiO2, which was improved by N loading on Ag-TiO2, increased from 24–16 m2g−1 to 80 m2g−1, and the BET surface area had become lower with dopant loading due to the higher particle agglomeration. These results clearly revealed that the N doping with 5% mol loading was significantly effective for increasing a specific surface area of the photocatalyst, which increased about 8–10 times higher than that of nonporous TiO2. This characteristic causes more effective contact surfaces between the photocatalyst and reactant. The higher surface area is, the better photocatalytic activity is.

2.1.3. Crystallinity

The influences of N and Ag doping with different loading levels (5%–15% mol) on the crystal structure and crystallite size of the photocatalysts were also investigated using X-ray diffraction (XRD) analysis. Figure 3a,b show the XRD patterns of the doped and co-doped samples of N-TiO2, Ag-TiO2, and N/Ag-TiO2 including the data for undoped TiO2 as the reference. The XRD peak position for the crystal phases presented in the samples are identified with the Joint Committee on Powder Diffraction Standards (JCPDS) database. It was found that the pure TiO2 and doped and co-doped TiO2 displayed pure anatase phases of TiO2 at degrees (2θ) of 25.3°, 38.0°, 48.2°, 54.0°, 55.1°, and 63.0° consistencies with the planes of (1 0 1), (0 0 4), (2 0 0), (1 0 5), (2 1 1), and (2 0 4), respectively (JCPDS card no. 21-1272) [31,32,33,34]. Except for 15% Ag-TiO2, the small additional peaks of a rutile phase were observed at degrees (2θ) of 27°, 40.8°, and 56.1° corresponding to the planes of (1 1 0), (1 1 1), and (2 2 0), respectively (JCPDS card no. 21-1276) [14,34]. The rutile phase transformation for 15% Ag-TiO2 could be formed under high temperature calcination (>450 °C) induced by the excess amount of silver metal. The XRD peak of a silver crystal phase at 36.8° and 44.3° indicates to the (1 1 1) plane of Ag2O and (2 0 0) plane of a metallic Ag0 phase, respectively (JCPDS card no. 41–1104 and 04-0783) [33,34], were only observed in 15% Ag-TiO2. However, the metallic silver phase cannot be detected for the lower Ag-loaded samples (<15% mol). This might be due to the visibility limit of XRD analysis.
The average crystallite size and lattice strain determined using the Debye-Scherrer (D-S) formula and Williamson-Hall (W-H) model were listed in Table 1. The average crystallite sizes of DD-S and DW-H showed similarity in value and tendency. These calculation results could be used to confirm the precise crystallite size of the synthesized photocatalysts. The crystallite size was reduced upon doping and found to be reduced with the doping agent, which decreases from 61 nm of TiO2 to 10–16 nm for N/TiO2, 12–18 nm for Ag/TiO2, and 9–15 for N/Ag-TiO2 samples. The smallest crystallite size (9.86 nm) was observed in 5% N/Ag-TiO2. The reduced crystallite size is due to a higher density of N and Ag in TiO2 lattice, which could suppress the grain growth of TiO2 crystal [35,36]. The changed lattice strain of the doped samples as compared to undoped TiO2 indicated the distortion or imperfection in a titanium dioxide crystal caused by the introduction of N and Ag [37,38]. This result is in agreement with the reported results by Milani Moghaddama and Nasirian [36]. They had explained that the lattice strain was positive or negative when crystal lattice was under the influence of tensile (compressive) force from the surface to the volume of crystal resulting in a change in crystallite size and an alteration of the octahedral blocks on the TiO2 lattice. Therefore, the alteration in crystallite size and lattice strain could also confirm that every amount of N and Ag loading by using an in-situ solvothermal synthesis were successfully introduced into a TiO2 crystal lattice, which was the main factor effected on the modification of TiO2 crystallinity [14,33]. Several studies [39,40,41] have reported that the crystal structure and crystallite size of the photocatalyst play an important role on the photocatalytic activity performance.

2.1.4. The Surface Elemental Composition of the Photocatalysts

The surface elemental composition and chemical state of the obtained photocatalysts were characterized by X-ray photoelectron spectroscopy (XPS). As shown in the survey XPS spectra in Figure 4a and all the doped TiO2 samples displayed the same survey XPS spectra of signals from Ti and O atoms as undoped TiO2, which was related to Ti-O bonds in a TiO2 crystal lattice. The C 1s contaminant located at around 284.4–284.8 eV was also found in all samples, which was mostly ascribed to organic precursors [41]. The additional signals from N and Ag were observed in survey scan XPS spectra of the doped materials. In contrast, there were no signals of N and Ag existence in the survey XPS spectra of undoped TiO2. Therefore, this result can be clearly verified that the doping of N and Ag into TiO2 lattice was successful. Figure 4b presents the high-resolution scan XPS spectra of Ti 2p. The two strong peaks of Ti 2p at the binding energies of 465.0 and 459.8 eV attributing the Ti 2p1/2 and Ti 2p3/2 of Ti4+ chemical state in anatase TiO2, respectively, and the low intensity peaks correspond to a Ti3+ chemical state [42]. However, there was no Ti3+ chemical state of the pure TiO2. Furthermore, it was found that the Ti 2p spectra of the doped TiO2 sample slightly shift to the lower binding energy than that of pure TiO2. This could be indicated that the electronic interaction in N-TiO2, Ag-TiO2, and N/Ag-TiO2 was different as compared to the pure TiO2, due to the effect of nitrogen and silver in the TiO2 lattice. Yunfan [42] reported that the existence of Ti4+ and Ti3+ states was beneficial for the photocurrent generation and the mitigation of electron-hole pairs recombination, which were favorable for the photocatalytic process.
The chemical state of N in N-TiO2 and N/Ag-TiO2 was considered from the high resolution XPS spectra in Figure 4c. The three peaks of the N 1s located at 402.5, 400.5, and 398.8 eV were observed in both N doped and N/Ag co-doped samples, which can be revealed to the various N linkages formed within the TiO2 lattice structure. The N 1s peak located at the high binding energy of 402.5 eV was reported to the signal of nitrogen in N-O species mostly. The N 1s peak locating at the low binding energy of 400.5 eV can be ascribed to the interstitial nitrogen to form Ti-O-N or Ti-N-O bonding, and the peak at 398.9 eV attributed to the substitutional nitrogen formed by replacing the O atoms in the TiO2 lattice (O-Ti-N or Ti-N-Ti bonding). This result was consistent with many studies [43,44,45]. The chemical state of silver in the samples Ag-TiO2 and N/Ag-TiO2 were also explored. The high resolution XPS spectra of Ag 3d were detected in two strong peaks at around 373.60 and 367.61 eV (Figure 4d), which were consistent with Ag 3d3/2 and Ag 3d5/2, respectively [46,47]. These peaks can be attributed to the Ag atom in Ag2O and metallic Ag, which could be produced during the calcination process of AgNO3. The Ag 3d peak of N/Ag-TiO2 slightly shifted to the lower binding energy compared to Ag-TiO2, which suggests that the electron migration is different due to the synergistic effect of N and Ag doping. Furthermore, as a consideration of the transition in the color of Ag-doped powders, it was observed that all Ag-doped samples had a change in color from a pale grey to a dark brown color after being irradiated with the light and being exposed to the air. This phenomenon could be due to the oxidation reaction of some Ag2O to Ag° as the reaction (1) [12] and could also be further confirmed by the occurrence of Ag2O to Ag° on the TiO2 surface.
2Ag2O + e ↔ 4Ag° + O2
However, Gannoruwa et al. [48] reported that the existence of Ag+ and Ag° on the TiO2 surface is advantageous for the photocatalytic oxidation reaction and photoexcited electron-hole pairs separation of the TiO2 photocatalyst. The metallic silver (Ag°) could generate the new electronic state below the conduction band of TiO2 by the surface plasmonic resonance (SPR) enhancing the visible light absorption and could also act as an electron capture trap to restrain the electron-hole recombination of the photocatalyst. Silver ions (Ag+) provided the catalytic site to promote the reaction of a photoelectron with surface oxygen.

2.1.5. The Optical Property and Band Gap Energy

Figure 5a shows the UV-vis absorption spectra and Tauc plot (inset) of the N/Ag-TiO2 including the data for N-TiO2, Ag-TiO2, and the pure TiO2. The intensity of the absorbed radiation reveals the ability of light absorption of the photocatalyst at different wavelengths. Clearly, the photocatalyst samples doped by Ag of N/Ag-TiO2 and Ag-TiO2 had a darker colored powder, and exhibited a larger and stronger absorption in the visible light region (400–600 nm), which was due to the surface plasmon resonance (SPR) effect from silver nanoparticles appearing at the wavelength around 450–550 nm [49]. The pale-yellow N-TiO2 powder showed the lower intensity of the absorbed radiation in a visible region. In addition, the white colored TiO2 powder has no light absorption in a visible region. This observation indicated that the change in absorption edge of a TiO2 semiconductor was related to the deposition of N and Ag species. In order to compare the band gap energy between the undoped and doped TiO2 with N and Ag, Tauc plot was employed (inset, Figure 5a). The calculated Eg values for all prepared TiO2 photocatalysts are listed in Table 1. The band gap energy decreased upon doping, reducing from 3.20 eV for pure TiO2 to 3.00–3.02 eV for N-TiO2, 1.7–2.1 eV for Ag-TiO2, and 1.5–1.6 eV for N/Ag-TiO2. This result appeared that Ag doping has a much more significant effect on reducing band gap energy as compared to N-doping, which corresponds to the red shift absorption and the surface plasmon resonance(SPR) effect. Clearly, the lowest band gap energy was achieved in the co-doped sample of 5% N/Ag-TiO2, which was due to the synergistic effect of N and Ag. N doping leads to the formation of a new mid band energy above the O 2p valence band by the N 2p band whereas Ag can narrow the band gap energy with a Fermi level having energy lower than the conduction band of TiO2 as a schematic diagram in Figure 6, which results in the enhancement of visible photocatalytic activity.

2.1.6. Electronic Structure

Photoluminescence (PL) spectroscopy was employed for investigating the electronic structure and the electron-hole recombination rate in the photocatalytic materials. Figure 5b demonstrates PL emission spectra of the undoped TiO2, 5% N-TiO2, 10% Ag-TiO2, and 5% N/Ag-TiO2 photocatalysts. It could be observed that all the photocatalysts displayed the same emission spectra at around 480–490 nm. However, the PL intensity of 5% N/Ag-TiO2 and 10% Ag-TiO2 was much lower than that of pure TiO2 and 5% N-TiO2. The PL emission intensity is directly related to the electron-hole recombination in the TiO2 photocatalyst. The lower PL intensity suggests a delay recombination rate between photoexcited electrons and holes, which is very beneficial for the photocatalytic process. Thus, this result indicated that Ag-doping has an incredibly significant effect on the inhibition of electron-hole recombination because the photoexcited electron could be trapped by Ag particles, which acted as an electron storage sink on the TiO2 surface, as demonstrated in Figure 6.
According to the characteristic properties of the obtained photocatalyst, the results revealed that the main roles of N and Ag on the properties of the TiO2 photocatalyst were different. The N doping has a significant development on the specific surface area and morphology of the photocatalyst. Ag played important roles in reducing band gap energy, which enhanced the light absorption in the visible region as well as delayed electron and hole recombination. The synergistic effect of N and Ag doping can be achieved in the N/Ag co-doped sample. Therefore, it could be expected that the best photocatalytic activity under the visible irradiation would be accomplished by N/Ag-TiO2 due to its optimal photocatalytic properties.

2.2. Photocatalytic Activities in Aqueous Phase and Gas Phase under Visible Light Irradiation

2.2.1. Photocatalytic Degradation of MB Dye Solution

The adsorption capacity and photocatalytic activity of all photocatalyst powders were evaluated by the degradation of methylene blue (MB). To achieve the adsorption equilibrium between MB solution and catalyst surface, 1 g of the photocatalyst was stirred in 100 mL of MB solution (1 × 10⁻⁵ M) under a dark condition until the concentration of MB is stable. After the adsorption reached equilibrium, the remaining MB solution was replaced by the new MB solution in order to prove the photocatalytic performance of the photocatalysts under the visible light-emitting diode (LED) irradiation. Figure 7a–c illustrate the adsorption and photocatalytic degradation of MB over N-TiO2, Ag-TiO2, and N/Ag-TiO2, respectively. For comparing the photocatalytic performance, the data for MB degradation by the pure TiO2 and photolysis of MB solution (blank) without the photocatalyst were also presented. It could be seen that the adsorption equilibrium between MB and photocatalyst was reached after stirring for 3 h (dark condition). The N-TiO2 sample showed the highest MB adsorption capacity, while adsorbing MB dye around 60% in the dark condition was followed by N/Ag-TiO2 and Ag-TiO2 with the MB adsorption at 40% and 20%, respectively. The MB adsorption over the pure TiO2 was only 8%. The adsorption capacity of the photocatalysts was in good correspondence with their specific surface area. The larger the specific surface area is, the better the adsorption capacity is [50].
The photocatalytic activities of MB degradation by the prepared photocatalysts were also displayed in the same figures (light condition). After the light was turned on for 6 h, MB dye has a slight degradation of only 6%, which is caused by photolysis. In contrast, the MB concentration dramatically reduced within 30 min of irradiation time in the presence of the photocatalyst. The co-doped sample (N/Ag-TiO2) exhibited the fastest and the highest photocatalytic performance of the MB degradation at almost 100% in 6 h. The photocatalytic performances of MB degradation by all photocatalysts and their pseudo-first-order kinetic rate constants were listed in Table 1. As expected, 5% N/Ag-TiO2 showed the highest photocatalytic performance of 98.82% MB degradation and the highest rate constant of 17.8 × 10⁻⁵ min−1 due to its optimal photocatalytic properties such as a large surface area, a narrow band gap energy, and a low electron-hole recombination rate.
The stability of the photocatalytic degradation of MB dye over 5% N/Ag-TiO2 was investigated by repeating the experiment for three runs, and the result was shown in Figure 7d. The 5% N/Ag-TiO2 could remain a constant of photocatalytic performance for MB dye degradation under LED light irradiation for three recycling runs with the degradation rates of MB solution that were more than 90%. This phenomenon revealed a good recyclability for degrading MB dye solution at 5% N/Ag-TiO2, which was not only associated with the proper photocatalytic properties of the photocatalyst material (as described in Section 2.1), but was also strongly associated with the abundance of O2 and water (H2O) molecules in the photocatalytic reaction system. Both O2 and H2O were incredibly crucial factors on the OH radical generation for the PCO process. The possible mechanism for OH radical generation and photocatalytic degradation of the organic pollutant over TiO2 with the presence of the Ag atom was presented in Scheme 1. The O2 molecule can react with the photoexcited electrons located in the conduction band (CB) and was trapped by Ag to generate the superoxide ( O 2 ) radical, while H2O molecules could be adsorbed by the positive hole placed in the valence band (VB) of TiO2 to produce hydroxyl ( O H · ) radicals. Both superoxide ( O 2 ) and hydroxyl ( O H · ) radicals are the potential oxidants, which can strongly interact with the organic compound in the photocatalytic oxidation process [51].

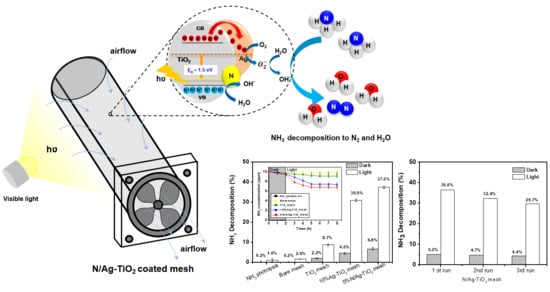
2.2.2. Photocatalytic Decomposition of a Gas Phase NH3

The photocatalytic decomposition of ammonia (NH3) gas over the cylinder of stainless-steel mesh coated with 5% N/Ag-TiO2 was carried in a hand-made stainless-steel photoreactor (volume 54 L). The stainless-steel mesh with a total area of 700 cm2 and 52% open area is coated by 5% N/Ag-TiO2 (1.5 ± 0.5 g) using polyacrylic acid (PAA) as a binder. The cylinder of 5% N/Ag-TiO2-mesh, equipped with a fan on the top end to control the air flow of NH3 gas pass through the mesh surface, was centered inside the photoreactor and irradiated by two visible LED lamps. The NH3 gas was prepared from an aqueous solution of ammonia (30%) by injecting into the photoreactor. The experiment was carried out under room temperature (30 ± 2 °C). For comparison, NH3 photolysis and NH3 with a bare stainless-steel mesh, TiO2 mesh, and Ag-TiO2 mesh were also examined. The photocatalytic performances for NH3 removal were shown in Figure 8a. The results indicated that NH3 gas could be adsorbed (under dark condition) and decomposed by the photocatalyst coated mesh under visible LED illumination. The highest NH3 decomposition belong to 5% N/Ag-TiO2 mesh with 37.5% of NH3 decomposition. The Ag-TiO2 mesh and TiO2 mesh showed 30.9% and 8.7% of NH3 decomposition, respectively. However, one can notice that the decomposition of NH3 gas over 5% N/Ag-TiO2 mesh have a better rate only the first period time of LED irradiation. After irradiation for 3 h, no more NH3 reduction was detected (inset, Figure 8a). The NH3 reduction by photolysis and the bare mesh were negligible. The main products of the photocatalytic oxidation of NH3 were N2 and H2O, which are in agreement with the reports by Altomare and Selli [3] and Lee et al. [52]. The photocatalytic oxidation reaction of ammonia was presented in the reaction (2).
2NH3 + 6OH → N2 + 6H2O
The reusability of 5% N/Ag-TiO2 mesh was investigated by replacing the new NH3 in the photoreactor. Figure 8b displays the recyclability of NH3 decomposition over 5% N/Ag-TiO2 mesh. The efficiency of gas phase NH3 decomposition over 5% N/Ag-TiO2 mesh decreased about 2%–3% during every recycling run. However, the reusability performance of 5% N/Ag-TiO2 mesh for photocatalytic oxidation in a gas phase was different as compared to the reusability in an aqueous phase. There were many factors that could limit the photocatalytic oxidation performance in a gas phase such as the lack of enough O2 and H2O molecules in the photoreactor and the recombination of e/h+ pairs in TiO2. To determine the electron-hole separation efficiency of the photocatalysts, the PL emission analysis of 5% N/Ag-TiO2 and TiO2 before and after irradiation by visible LED light was compared as displayed in Figure 9. It revealed that the intensity of PL emission spectra of the irradiated photocatalyst was higher as compared to the fresh photocatalyst, which means that the separation ability of e/h+ pairs in the photocatalyst could be lower with the effect of the light illumination. Therefore, the electron-hole recombination was one of the main factors that could inhibit the photocatalytic oxidation process.

3. Materials and Methods

3.1. Materials

Titanium (IV) butoxide (Ti(OBu)4, ≥97%) was purchased from Fluka. Silver nitrate (AgNO3, 99%), Diethyl amine (DEA, 99%), Ethanol (99.8%), Nitric acid (HNO3, 65%), and Ammonia solution (NH3, 28%–30%) were purchased from Merck. Methylene blue (C6H18N3CIS.2H2O, ≥96%) was obtained from Unilab. All the chemicals were of an analytical grade and used without further purification.

3.2. Catalyst Preparations

An in-situ solvothermal method was employed to prepare TiO2, N-doped TiO2, Ag-doped TiO2, and N/Ag co-doped TiO2 photocatalysts. Ti(OBu)4 was used as a precursor. AgNO3 and diethyl amine (DEA) were used as Ag and N dopant sources, respectively. In a typical process, Ti(OBu)4 (34 mL, 0.1 mol) was mixed with 110 mL of ethanol, and a small amount of HNO3 (1.26 mL) and distilled water (3.6 mL) to get Ti solution. For dopant loading, the appropriate concentration (5%–15% mol) of dopant was dissolved in 0.5 mL of distilled water before adding it into Ti solution under vigorous stirring until the homogeneous gel is obtained. The gel solution was then transferred into a Teflon-lined stainless steel autoclave (100 mL) for solvothermal treatment in a hot air oven (WOE-105, WIFD) at the temperature of 190 ± 10 °C for 3 h (heating rate of 10 °C until maximum) to form a precipitate of the catalyst. In this solvothermal procedure, the dopant could incorporate into the TiO2 lattice and limit the grain growth of the TiO2 crystal. After thermal treatment and cooling at room temperature, the precipitate was centrifuged, rinsed with distilled water, and ethanol several times to remove some organic residues and then dried at 80 °C overnight. The dried precipitate was ground to a fine powder by hand grinding in a mortar and calcined at 450 °C for 3 h in the air atmosphere with a heating rate of 10 °C/min) using a muffle furnace (JSMF-30HT, maximum temperature 1200 °C, JSR, Korean). The pure TiO2 was also prepared by using the same method as mentioned above without adding dopant solution. The obtained photocatalysts of pure TiO2, N-doped TiO2, and Ag-doped TiO2 powders with different dopant concentrations were labeled as TiO2, x% N-TiO2, and x% Ag-TiO2, respectively, when x is the concentration of the dopant in a mol unit.
Co-doping N and Ag in TiO2 was prepared by N loading in 10% Ag-TiO2 with a solvothermal method. Diethyl amine (DEA) solution, which is an N dopant source, was combined with 10% Ag-TiO2 in 100 mL ethanol by stirring for 1 h until a homogenous solution. The mixed solution was then heated in a Teflon-lined stainless steel autoclave and calcined in an air furnace by using the same temperature condition as single doping. The N and Ag co-doped TiO2 photocatalyst was identified as x% N/Ag-TiO2, when x is the concentration of N in mol units.

3.3. Material Characterizations

The surface morphology and particle size of all samples were observed using the field emission scanning electron microscope (FESEM, S-4800, Hitachi, Japan) with the magnification between 5000× and 50,000×. The specific surface area and pore structure of the catalysts were determined from N2 gas adsorption-desorption isotherms at 77 K by a surface analyzer (Autosorb-1, Quantachrome, BEL model, USA). The Brunauer-Emmett-Teller (BET) method was utilized to calculate the specific surface area. The pore size distribution was measured from the N2 desorption branch using a Barrett–Joyner-Halenda (BJH) analyzer and the total pore volume was estimated from the adsorbed amount at a relative pressure P/P0 of 0.98. The crystal structure was investigated by an X-ray diffractometer (XRD, D8 Advance with Eulerian Cradle, Bruker, USA) with Cu Kα radiation (λ = 1.54 Å). The diffractogram was recorded at the range of 20–70°. The mean crystallite size was calculated via the Debye–Scherrer (D-S) equation (D = 0.89λ/β cos θ) [31] and compared to the Williamson–Hall (W–H) equation [53,54]. The lattice strain was only observed in the W–H plot. The surface element composition of the pure TiO2, N-TiO2, Ag-TiO2, and N/Ag-TiO2 was characterized by an X-ray photoelectron spectroscopy (XPS) using Thermo scientific ECALAB 250xi system with the Mg Kα source. The survey scan and the high resolution scan XPS spectrums were examined and all the binding energies were calibrated using C 1s (284.6 eV) [42]. The absorption edge wavelength was recorded by Ultraviolet-Visible-Near Infrared (UV-VIS-NIR) spectrometer within the range of 300–800 nm (Perkin Elmer, Lambda 950, USA). The band gap energy was estimated using the Tauc plot [55]. The electronic structure and the separation of the photoexcited electron and the hole were investigated using photoluminescence (PL) emission spectra equipped with a 20 microwatts LED lamp.

3.4. The Photocatalytic Degradation of Methylene Blue (MB)

The photocatalytic activities of the as-synthesized photocatalysts were evaluated by the photocatalytic degradation of methylene blue (MB) dye solution. The photocatalytic reaction was carried out under a white LED lamp (nominal power: 16 W, wavelength: 365–800 nm) in a closed wooden box. In a typical experiment, 1 g of the photocatalyst sample was dispersed in 100 mL of 1 × 10⁻⁵ M of MB solution. The absorption reaction was first carried out in the dark condition with continuous stirring at room temperature for 2 h until adsorption equilibrium. Afterward, the photocatalytic reaction was replaced with the new MB solution and the light was then turned on. The photolysis reaction of MB was also carried out without any catalyst to show the photocatalytic performance over the as-synthesized catalyst. The photocatalytic degradation of MB was estimated by the decolorization of MB every 30 min by measuring using the UV-vis spectrophotometer with the wavelength absorbance at 664 nm (λmax). The efficiency of a photocatalytic degradation of MB was calculated by using Equation (3). C0 and Ct are the MB concentration at the initial time and measuring time, respectively.
Photocatalytic   degradation   =   [ C 0 C t C 0 ]   ×   100 %
The recyclability of the optimal photocatalyst material for degradation of MB dye solution under visible LED irradiation was investigated by repeating the experiment three times. After each run, the photocatalyst was separated from the degraded MB solution by centrifugation, and the new MB dye solution was then added into the reaction in order to run the next photocatalytic experiment.

3.5. Immobilization of the Photocatalyst on Stainless Steel Mesh

A cylinder of 304 stainless steel woven wire mesh, having a total area of 700 cm2, 52% open area, wire diameter of 0.3 mm, and an aperture diameter of 0.9 mm, was used as a substrate material for immobilization of the photocatalyst particle. Before immobilization, the substrate was first immersed in a diluted nitric acid solution for 1 min and cleaned with acetone and ethanol for three times. Afterward, the cleaned substrate was dried in an oven at 100 °C for 3 h. The optimal 5% N/Ag-TiO2 particle was immobilized onto stainless steel wire mesh using a brushing technique and poly(acrylic acid) (PAA) as a binder. A 50-mL of 5% N/Ag-TiO2-binder (10% w/v) suspension was brushed over the cleaned mesh surface. The immobilized 5% N/Ag-TiO2 mesh was dried at 80 °C for 2 h. The different weight of a substrate before and after immobilization revealed that the 1.5 ± 0.5 g of 5% N/Ag-TiO2 particle was immobilized over a stainless-steel mesh surface.

3.6. Photocatalytic Decomposition of a Gas Phase Ammonia (NH3)

Photocatalytic decomposition of a gaseous ammonia (NH3) over the immobilized mesh was carried out in a closed stainless steel reactor (volume 54 L) having the two visible LED lamps (nominal power 16 W). The light intensity in a closed reactor was around 500–700 lux. In order to control the airflow of NH3 gas to contact over the 5% N/Ag-TiO2 mesh surface, a small fan was equipped on the end of a mesh cylinder (Figure 10), while the opposite side was closed with aluminum foil. Figure 10 presents the inside view and top view of a stainless steel photoreactor. An immobilized mesh cylinder with a fan was centered between the two LED lamps inside the photoreactor. The photocatalytic decomposition of NH3 gas was performed at room temperature 30 ± 2 °C by injecting a small amount of 30% ammonia solution into the photoreactor. The concentration of evaporated NH3 was monitored by an ammonia detector placed inside the photoreactor in real time. For comparison, the decomposition of NH3 over TiO2 mesh and 10% Ag-TiO2 mesh were also explored. The reusability of the 5% N/Ag-TiO2 mesh was investigated under the same condition by releasing the decomposed NH3 and injecting the new NH3 in the photoreactor. The reuse experiment of 5% N/Ag-TiO2 mesh was repeated three times.

4. Conclusions

In this study, the anatase crystals of TiO2, N-TiO2, Ag-TiO2, and N/Ag-TiO2 were successfully prepared via an in-situ solvothermal method. The existence of N and Ag in the TiO2 lattice was verified by X-ray photoelectron spectroscopy (XPS) analysis. The incorporation of N in the TiO2 lattice was observed in two linkages including interstitial nitrogen and substitutional nitrogen in the form of Ti-O-N and O-Ti-N linkages, respectively. On the other hand, Ag species could be incorporated on the TiO2 lattice surface in the form of Ag0 and Ag2O. The major roles of N and Ag on the photocatalytic activities of TiO2 were different. The N doping has a significant influence on the homogenous surface morphology and specific surface area of the photocatalyst. Ag-doping has an incredibly significant effect on the narrowing band gap energy of TiO2 (reducing from 3.20 eV to 1.7 eV), which enhances the light absorption ability toward a visible light region as well as delaying the electrons-holes recombination rate. The co-doped photocatalyst of 5% N/Ag-TiO2 was promoted to be a promising photocatalyst, which shows the highest visible light photocatalysis performance for MB degradation near 100% within 6 h and having an excellent recyclability in aqueous phase photocatalysis, which was due to the synergistic influence of N ang Ag doping. The photocatalytic decomposition of a gas phase ammonia (NH3) under visible LED irradiation over the 5% N/Ag-TiO2 coated mesh was also accomplished. The decomposability of NH3 (10 ppm) under visible light was 37.5%. However, the recyclability of 5% N/Ag-TiO2 mesh for gas phase NH3 decomposition decreased by about 2%–3% every recycling run. This could be due to the change in the state of silver (Ag0 or Ag+), the recombination of the e/h+ pair, and the lack of abundance of O2 and water molecules in the gas phase PCO process.

Author Contributions

S.C. was in charge of a research supervisor and acted as a corresponding author. T.A. was responsible for research methodology and experimental design. A.S. was responsible for the experiments and preparing the manuscript. All authors have read and agreed to the published version of the manuscript.

Funding

The authors would like to express their gratitude to the Joint Graduate School of Energy and Environment, King Mongkut’s University of Technology Thonburi, Center of Excellence on Energy Technology and Environment, PERDO, Bangkok, Thailand, and the Petchra Pra Jom Klao Doctoral Degree Research Scholarship from the King Mongkut’s University of Technology Thonburi for financial support.

Acknowledgments

The authors would like to especially thank Hugo de Lasa for his valuable comments and suggestions to improve the quality of this article.

Conflicts of Interest

The authors declare no conflict of interest.

References

  1. Estrada, J.M.; Kraakman, N.J.R.B.; Muñoz, R.; Lebrero, R. A Comparative Analysis of Odour Treatment Technologies in Wastewater Treatment Plants. Environ. Sci. Technol. 2011, 45, 1100–1106. [Google Scholar] [CrossRef] [PubMed]
  2. Alinezhad, E.; Haghighi, M.; Rahmani, F.; Keshizadeh, H.; Abdi, M.; Naddafi, K. Technical and economic investigation of chemical scrubber and bio-filtration in removal of H2S and NH3 from wastewater treatment plant. J. Environ. Manag. 2019, 241, 32–43. [Google Scholar] [CrossRef] [PubMed]
  3. Altomare, M.; Selli, E. Effects of metal nanoparticles deposition on the photocatalytic oxidation of ammonia in TiO2 aqueous suspensions. Catal. Today 2013, 209, 127–133. [Google Scholar] [CrossRef]
  4. Boyjoo, Y.; Sun, H.; Liu, J.; Pareek, V.; Wang, S. A review on photocatalysis for air treatment: From catalyst development to reactor design. Chem. Eng. J. 2017, 310, 537–559. [Google Scholar] [CrossRef]
  5. Boxi, S.S.; Paria, S. Visible light induced enhanced photocatalytic degradation of organic pollutants in aqueous media using Ag doped hollow TiO2 nanospheres. RSC Adv. 2015, 5, 37657–37668. [Google Scholar] [CrossRef]
  6. Liu, H.; Dong, X.; Liu, T.; Zhu, Z. In-situ fabrication of silver-modified TiO2 microspheres for enhanced visible light driven photocatalytic activities. Sol. Energy Mater. Sol. Cells 2015, 132, 86–93. [Google Scholar] [CrossRef]
  7. Hashimoto, K.; Irie, H.; Fujishima, A. TiO2 Photocatalysis: A Historical Overview and Future Prospect. JSAP Int. 2005, 44, 8269–8285. [Google Scholar]
  8. Pelaez, M.; Nolan, N.T.; Pillai, S.; Seery, M.; Falaras, P.; Kontos, A.G.; Dunlop, P.; Hamilton, J.; Byrne, J.; O’Shea, K.; et al. A review on the visible light active titanium dioxide photocatalysts for environmental applications. Appl. Catal. B Environ. 2012, 125, 331–349. [Google Scholar] [CrossRef] [Green Version]
  9. Dette, C.; Pérez-Osorio, M.A.; Kley, C.S.; Punke, P.; Patrick, C.; Jacobson, P.; Giustino, F.; Jung, S.J.; Kern, K. TiO2 Anatase with a Bandgap in the Visible Region. Nano Lett. 2014, 14, 6533–6538. [Google Scholar] [CrossRef]
  10. Binas, V.; Venieri, D.; Kotzias, D.; Kiriakidis, G. Modified TiO2 based photocatalysts for improved air and health quality. J. Mater. 2017, 3, 3–16. [Google Scholar] [CrossRef]
  11. Santos, L.M.; Machado, A.; França, M.D.; Borges, K.A.; Paniago, R.M.; Patrocinio, A.O. Structural characterization of Ag-doped TiO2 with enhanced photocatalytic activity. RSC Adv. 2015, 5, 103752–103759. [Google Scholar] [CrossRef]
  12. Albiter, E.; Valenzuela, M.; Alfaro, S.; Valverde-Aguilar, G.; Martínez-Pallares, F. Photocatalytic deposition of Ag nanoparticles on TiO2: Metal precursor effect on the structural and photoactivity properties. J. Saudi Chem. Soc. 2015, 19, 563–573. [Google Scholar] [CrossRef] [Green Version]
  13. Di Valentin, C.; Pacchioni, G. Trends in non-metal doping of anatase TiO2: B, C, N and F. Catal. Today 2013, 206, 12–18. [Google Scholar] [CrossRef]
  14. Gao, X.; Zhou, B.; Yuan, R. Doping a metal (Ag, Al, Mn, Ni and Zn) on TiO2 nanotubes and its effect on Rhodamine B photocatalytic oxidation. Environ. Eng. Res. 2015, 20, 329–335. [Google Scholar] [CrossRef] [Green Version]
  15. Parveen, B.; Hassan, M.U.; Khalid, Z.; Riaz, S.; Naseem, S. Room-temperature ferromagnetism in Ni-doped TiO2 diluted magnetic semiconductor thin films. J. Appl. Res. Technol. 2017, 15, 132–139. [Google Scholar] [CrossRef]
  16. Di Valentin, C.; Finazzi, E.; Pacchioni, G.; Selloni, A.; Livraghi, S.; Paganini, M.C.; Giamello, E. N-doped TiO2: Theory and experiment. Chem. Phys. 2007, 339, 44–56. [Google Scholar] [CrossRef]
  17. Yang, G.; Jiang, Z.; Shi, H.; Xiao, T.; Yan, Z. Preparation of highly visible-light active N-doped TiO2 photocatalyst. J. Mater. Chem. 2010, 20, 5301–5309. [Google Scholar] [CrossRef]
  18. Katoueizadeh, E.; Zebarjad, S.M.; Janghorban, K. Synthesis and enhanced visible-light activity of N-doped TiO2 nano-additives applied over cotton textiles. J. Mater. Res. Technol. 2018, 7, 204–211. [Google Scholar] [CrossRef]
  19. Ansari, S.A.; Khan, M.M.; Ansari, M.O.; Cho, M.H. Nitrogen-doped titanium dioxide (N-doped TiO2) for visible light photocatalysis. New J. Chem. 2016, 40, 3000–3009. [Google Scholar] [CrossRef]
  20. Ali, T.; Ahmed, A.; Alam, U.; Uddin, I.; Tripathi, P.; Muneer, M. Enhanced photocatalytic and antibacterial activities of Ag-doped TiO2 nanoparticles under visible light. Mater. Chem. Phys. 2018, 212, 325–335. [Google Scholar] [CrossRef]
  21. Elsellami, L.; Dappozze, F.; Houas, A.; Guillard, C. Effect of Ag+ reduction on the photocatalytic activity of Ag-doped TiO2. Superlattices Microstruct. 2017, 109, 511–518. [Google Scholar] [CrossRef]
  22. García-Serrano, J.; Gómez-Hernández, E.; Ocampo-Fernández, M.; Pal, U. Effect of Ag doping on the crystallization and phase transition of TiO2 nanoparticles. Curr. Appl. Phys. 2009, 9, 1097–1105. [Google Scholar] [CrossRef]
  23. Kerkez, Ö.; Boz, İ. Efficient removal of methylene blue by photocatalytic degradation with TiO2 nanorod array thin films. React. Kinet. Mech. Catal. 2013, 110, 543–557. [Google Scholar] [CrossRef]
  24. Elghniji, K.; Ksibi, M.; Elaloui, E. Sol–gel reverse micelle preparation and characterization of N-doped TiO2: Efficient photocatalytic degradation of methylene blue in water under visible light. J. Ind. Eng. Chem. 2012, 18, 178–182. [Google Scholar] [CrossRef]
  25. Khan, M.; Gul, S.R.; Li, J.; Cao, W. Photocatalytic Degradation of Methylene Blue by Hydrothermally Prepared Ag-Doped TiO2 Under Visible Light Irradiations. JOM 2015, 67, 2104–2107. [Google Scholar] [CrossRef]
  26. Gupta, S.; Tripathi, M. A review on the synthesis of TiO2 nanoparticles by solution route. Chin. Sci. Bull. 2011, 12, 1639–1657. [Google Scholar] [CrossRef] [Green Version]
  27. Ramakrishnan, V.M.; Li, J.; Wu, Q.; Wu, J. Synthesis of Nanoparticles via Solvothermal and Hydrothermal Methods. In Handbook of Nanoparticles; Aliofkhazraei, M., Ed.; Springer International Publishing: Cham, Switzerland, 2015; pp. 1–28. [Google Scholar]
  28. Thommes, M.; Kaneko, K.; Neimark, A.V.; Olivier, J.P.; Rodriguez-Reinoso, F.; Rouquerol, J.; Sing, K.S. Physisorption of gases, with special reference to the evaluation of surface area and pore size distribution (IUPAC Technical Report). Pure Appl. Chem. 2015, 87, 1051–1069. [Google Scholar] [CrossRef] [Green Version]
  29. Kusano, D.; Emori, M.; Sakama, S. Influence of electronic structure on visible light photocatalytic activity of nitrogen doped TiO2. RSC Adv. 2017, 7, 1887–1898. [Google Scholar] [CrossRef] [Green Version]
  30. Krejcikova, S.; Matějová, L.; Koci, K.; Obalová, L.; Matěj, Z.; Čapek, L.; Solcova, O. Preparation and characterization of Ag-doped crystalline titania for photocatalysis applications. Appl. Catal. B Environ. 2012, 111–112, 119–125. [Google Scholar] [CrossRef]
  31. Quan, F.; Hu, Y.; Zhang, X.; Wei, C. Simple preparation of Mn-N-codoped TiO2 photocatalyst and the enhanced photocatalytic activity under visible light irradiation. Appl. Surf. Sci. 2014, 320, 120–127. [Google Scholar] [CrossRef]
  32. Scarpelli, F.; Mastropietro, T.; Poerio, T.; Godbert, N. Mesoporous TiO2 Thin Films: State of the Art. In Titanium Dioxide—Material for a Sustainable Environment; Yang, D., Ed.; IntechOpen: London, UK, 2018; pp. 57–80. [Google Scholar]
  33. Mogal, S.I.; Gandhi, V.G.; Mishra, M.K.; Tripathi, S.; Shripathi, T.; Joshi, P.A.; Shah, D.O. Single-Step Synthesis of Silver-Doped Titanium Dioxide: Influence of Silver on Structural, Textural, and Photocatalytic Properties. Ind. Eng. Chem. Res. 2014, 53, 5749–5758. [Google Scholar] [CrossRef]
  34. Akel, S.; Dillert, R.; Balayeva, N.O.; Boughaled, R.; Koch, J.; El Azzouzi, M.; Bahnemann, D.B.D. Ag/Ag2O as a Co-Catalyst in TiO2 Photocatalysis: Effect of the Co-Catalyst/Photocatalyst Mass Ratio. Catalysts 2018, 8, 647. [Google Scholar] [CrossRef] [Green Version]
  35. Singh, I.; Birajdar, B. Synthesis, characterization and photocatalytic activity of mesoporous Na-doped TiO2 nano-powder prepared via a solvent-controlled non-aqueous sol–gel route. RSC Adv. 2017, 7, 54053–54062. [Google Scholar] [CrossRef] [Green Version]
  36. Moghaddam, M.; Nasirian, S. Dependence of activation energy and lattice strain on TiO2 nanoparticles. Nanosci. Methods 2012, 1, 201–212. [Google Scholar] [CrossRef]
  37. Wang, X.; Zhang, K.; Guo, X.; Shen, G.; Xiang, J. Synthesis and characterization of N-doped TiO2 loaded onto activated carbon fiber with enhanced visible-light photocatalytic activity. New J. Chem. 2014, 38, 6139–6146. [Google Scholar] [CrossRef]
  38. Cheng, X.; Yu, X.; Xing, Z.; Wan, J. Enhanced Photocatalytic Activity of Nitrogen Doped TiO2 Anatase Nano-Particle under Simulated Sunlight Irradiation. Energy Procedia 2012, 16, 598–605. [Google Scholar] [CrossRef] [Green Version]
  39. Li, G.; Li, J.; Li, G.; Jiang, G. N and Ti3+ co-doped 3D anatase TiO2 superstructures composed of ultrathin nanosheets with enhanced visible light photocatalytic activity. J. Mater. Chem. A 2015, 3, 22073–22080. [Google Scholar] [CrossRef]
  40. Cheng, X.; Yu, X.; Xing, Z.; Yang, L. Synthesis and characterization of N-doped TiO2 and its enhanced visible-light photocatalytic activity. Arab. J. Chem. 2016, 9 (Suppl. 2), S1706–S1711. [Google Scholar] [CrossRef]
  41. Lee, T.Y.; Lee, C.Y.; Chiu, H.T. Enhanced Photocatalysis from Truncated Octahedral Bipyramids of Anatase TiO2 with Exposed {001}/{101} Facets. ACS Omega 2018, 3, 10225–10232. [Google Scholar] [CrossRef]
  42. Xu, Y.; Wu, S.; Wan, P.; Sun, J.; Hood, Z.D. Introducing Ti3+ defects based on lattice distortion for enhanced visible light photoreactivity in TiO2 microspheres. RSC Adv. 2017, 7, 32461–32467. [Google Scholar] [CrossRef] [Green Version]
  43. Xu, T.; Wang, M.; Wang, T. Effects of N Doping on the Microstructures and Optical Properties of TiO2. J. Wuhan Univ. Technol.-Mat. Sci. 2019, 34, 55–63. [Google Scholar] [CrossRef]
  44. Miyauchi, M.; Ikezawa, A.; Tobimatsu, H.; Irie, H.; Hashimoto, K. Zeta potential and photocatalytic activity of nitrogen doped TiO2 thin films. Phys. Chem. Chem. Phys. 2004, 6, 865–870. [Google Scholar] [CrossRef]
  45. Wang, H.; Hu, Y. The Photocatalytic Property of Nitrogen-Doped TiO2 Nanoball Film. Int. J. Photoenergy 2013, 1–6. [Google Scholar] [CrossRef] [Green Version]
  46. Zhang, X.; Li, M.; He, X.; Huang, X.; Hang, R.; Tang, B. Effects of silver concentrations on microstructure and properties of nanostructured titania films. Mater. Des. (1980–2015) 2015, 65, 600–605. [Google Scholar] [CrossRef]
  47. Zielinska, J.A.; Kowalska, E.; Sobczak, J. Silver-doped TiO2 prepared by microemulsion method: Surface properties, bio- and photoactivity. Sep. Purif. Technol. 2010, 45, 155–162. [Google Scholar] [CrossRef] [Green Version]
  48. Gannoruwa, A.; Ariyasinghe, B.; Bandara, J. The mechanism and material aspects of a novel Ag2O/TiO2 photocatalyst active in infrared radiation for water splitting. Catal. Sci. Technol. 2016, 6, 479–487. [Google Scholar] [CrossRef]
  49. Jung, H.-Y.; Yeo, I.-S.; Kim, T.-U.; Ki, H.-C.; Gu, H.-B. Surface plasmon resonance effect of silver nanoparticles on a TiO2 electrode for dye-sensitized solar cells. Appl. Surf. Sci. 2018, 432, 266–271. [Google Scholar] [CrossRef]
  50. Jin, M.; Nagaoka, Y.; Nishi, K.; Ogawa, K.; Nagahata, S.; Horikawa, T.; Katoh, M.; Tomida, T.; Hayashi, J. Adsorption properties and photocatalytic activity of TiO2 and La-doped TiO2. Adsorption 2008, 14, 257–263. [Google Scholar] [CrossRef]
  51. Zhang, J.; Tian, B.; Wang, L.; Xing, M.; Lei, J. Provides a comprehensive description of the photocatalytic mechanism and factors affecting photocatalytic activity. In Photocatalysis: Fundamentals, Materials and Applications; Springer: Singapore, 2018; pp. 1–15. [Google Scholar]
  52. Lee, J.; Park, H.; Choi, W. Selective Photocatalytic Oxidation of NH3 to N2 on Platinized TiO2 in Water. Environ. Sci. Technol. 2002, 36, 5462–5468. [Google Scholar] [CrossRef]
  53. Kibasomba, P.M.; Dhlamini, S.; Maaza, M.; Liu, C.-P.; Rashad, M.M.; Rayan, D.A.; Mwakikunga, B. Strain and grain size of TiO2 nanoparticles from TEM, Raman spectroscopy and XRD: The revisiting of the Williamson-Hall plot method. Results Phys. 2018, 9, 628–635. [Google Scholar] [CrossRef]
  54. Mote, V.; Purushotham, Y.; Dole, B. Williamson-Hall analysis in estimation of lattice strain in nanometer-sized ZnO particles. J. Theor. Appl. Phys. 2012, 6, 6. [Google Scholar] [CrossRef] [Green Version]
  55. Suram, S.K.; Newhouse, P.F.; Gregoire, J.M. High Throughput Light Absorber Discovery, Part 1: An Algorithm for Automated Tauc Analysis. ACS Comb. Sci. 2016, 18, 673–681. [Google Scholar] [CrossRef] [PubMed]
Figure 1. The surface morphology of (a) TiO2, (b) 10% Ag-TiO2, (c) 10% N-TiO2, and (d) 10% N/Ag-TiO2, determined from SEM.
Catalysts 10 00251 g001
Figure 2. N2 adsorption-desorption isotherm and the BJH pore size distribution (inset) of (a) undoped TiO2, (b) N-TiO2, (c) Ag-TiO2, and (d) N/Ag-TiO2 with different dopant loadings (5%–15% mol).
Catalysts 10 00251 g002
Figure 3. X-ray diffraction (XRD) spectra of (a) N-TiO2 and Ag-TiO2 and (b) N/Ag co-doped TiO2 (prepared by loading N into 10% Ag-TiO2). The data for pure TiO2 was included as a reference. (A = Anatase, R = Rutile, and Ag = Silver).
Catalysts 10 00251 g003
Figure 4. (a) Survey scan and high-resolution scan XPS spectra of the photocatalyst for (b) Ti 2p, (c) N 1s, and (d) Ag 3d.
Catalysts 10 00251 g004
Figure 5. (a) UV-vis absorbance spectra and Tauc plot (inset) and (b) photoluminescence (PL) emission spectra of TiO2, 5% N-TiO2, 10%Ag-TiO2, and 5% N/Ag-TiO2.
Catalysts 10 00251 g005
Figure 6. Schematic diagrams of the band energy structure and the migration of photoexcited electrons in undoped TiO2, N-TiO2, Ag-TiO2, and N/Ag-TiO2.
Catalysts 10 00251 g006
Figure 7. Adsorption and photocatalytic degradation of MB under the visible LED irradiation (16 W) by (a) N-TiO2, (b) Ag-TiO2, and (c) N/Ag-TiO2, including the data for TiO2 and MB photolysis (blank), and (d) recycled 5% N/Ag-TiO2.
Catalysts 10 00251 g007
Scheme 1. The possible photocatalytic mechanism for degrading organic pollutant over the TiO2 photocatalyst with the existence of Ag on the surface.
Catalysts 10 00251 sch001
Figure 8. (a) Adsorption and photocatalytic performance for gas phase ammonia (NH3) decomposition by different photocatalysts coated on stainless steel mesh under visible LED illumination for 3 h and (b) reusability performance of the 5% N/Ag-TiO2 mesh.
Catalysts 10 00251 g008
Figure 9. PL emission spectra of 5% N/Ag-TiO2 and TiO2 before and after visible LED irradiation.
Catalysts 10 00251 g009
Figure 10. Schematic illustration of the cylinder of the photocatalyst coated mesh and a stainless steel photoreactor (inside and top views) with the two visible LED lamps and gas detector for a gas phase NH3 decomposition test.
Catalysts 10 00251 g010
Table 1. Characteristic information and photocatalytic performance of MB degradation under visible LED irradiation in 6 h of different prepared photocatalysts, including the data for MB degradation by photolysis without a catalyst.
SamplesCrystal SizesLattice StrainSBET (m2g−1)VBJH
(cm3g−1)
DBJH (nm)Eg (eV)% MB
Reduction (Average ± SD)
Kapp
(×10−5 min−1)
DD-S (nm)DW-H (nm)
MB degradation by photolysis without a catalyst6 ± 0.010.0
TiO261.4857.110.000011.640.027.993.2035.17 ± 0.021.5
5% N-TiO211.459.72−0.0120122.800.195.873.0263.05 ± 0.064.0
10% N-TiO214.8510.15−0.0034117.230.188.113.0256.21 ± 0.043.2
15% N-TiO216.3914.28−0.0040101.910.149.833.0047.10 ± 0.052.5
5% Ag-TiO218.7818.520.000221.500.1221.822.177.18 ± 0.035.7
10% Ag-TiO215.8116.710.000723.600.1626.541.784.00 ± 0.046.8
15% Ag-TiO215.5312.35−0.003116.150.1127.041.775.95 ± 0.045.5
Co-doped materials 6
5% N/Ag-TiO211.479.86−0.001781.160.2615.971.598.82 ± 0.0217.8
10% N/Ag-TiO215.0815.06−0.000730.870.1732.571.598.08 ± 0.0317.2
15% N/Ag-TiO215.97 115.12 1−0.0007 229.01 30.17 330.88 31.6 497.65 ± 0.0216.5 5
1 Crystallite sizes were calculated by using the Debye Scherrer (D-S) equation and Williamson Hall (W-H) equation. 2 The lattice strain was estimated using Williamson Hall plot. 3 BET surface area (SBET) was calculated using the Brunauer-Emmett-Teller (BET) equation. Pore volume (Vp) was estimated at P/P0 = 0.98 and Pore diameter (Dp) was estimated using the BJH model. 4 Band gap energy (Eg) was considered from the Tauc plot. 5 The kinetic rate constant was calculated using the first order kinetic model. 6 Co-doped materials were prepared by loading a different amount of N (5%–15% mol) into 10% Ag-TiO2.

