Abstract
Power to gas systems is one of the most interesting long-term energy storage solutions. As a result of the high exothermicity of the CO2 methanation reaction, the catalyst in the methanation subsystem is subjected to thermal stress. Therefore, the performance of a commercial Ni/Al2O3 catalyst was investigated over a series of 100 hour-long tests and in-process relevant conditions, i.e. 5 bar from 270 to 500 °C. Different characterization techniques were employed to determine the mechanism of the observed performance loss (N2 physisorption, XRD, TPO). The TPO analysis excluded carbon deposition as a possible cause of catalyst aging. The BET analysis evidenced a severe reduction in the total surface area for the catalyst samples tested at higher temperatures. Furthermore, a direct correlation was found between the catalyst activity decline and the drop of the catalyst specific surface. In order to correctly design a reliable methanation reactor, it is essential to have a kinetic model that includes also the aging kinetics. For this purpose, the second set of experiments was carried out, in order to determine the intrinsic kinetics of the catalyst. The kinetic parameters were identified by using nonlinear regression analysis. Finally, a power-law aging model was proposed to consider the performance loss in time.
1. Introduction
Most of the world countries have pledged, firstly in the Kyoto protocol and subsequently in the Paris agreement, to reduce their emissions of greenhouse gasses. In the European Union (EU) the target for the final renewable energy consumption ratio is set to 32% by 2030 [1]. Renewable electricity generation, mainly from wind and solar energy, will play a relevant role in reaching this target [2]. As the adoption of renewable energy sources (RES) for electricity generation rises, the intrinsic fluctuating generation characteristic is introduced in the electric network [3]. This will have a strong impact on the management of the electric grid as it operates on a demand/offer basis and has a limited storage capacity (mainly as pumped hydroelectric storage). Therefore, energy storage will be vital for a reliable and robust electric system with high RES penetration.
One of the most promising solutions for long term energy storage is the Power to Gas (PtG) technology. In this concept, electricity is converted into hydrogen through water electrolysis. The obtained hydrogen could be stored or injected into the natural gas grid [4]. However, injection into the natural gas grid is limited or not permitted in some grids due to both lower volumetric energy density of hydrogen and steel embrittlement caused by hydrogen [5,6]. Therefore, a second conversion stage can be added to combine hydrogen with carbon dioxide to obtain methane. Carbon dioxide can be sourced from high concentration flue gas streams from industry, biogas to biomethane upgrade plants, ethanol production plants. The product is a methane-rich gas that has similar proprieties as natural gas. Therefore, it is a substitute natural gas (SNG) and it can be used in the same applications of natural gas exploiting the existing infrastructure. Furthermore, SNG can be used for the difficult-to-decarbonize sectors (i.e. heavy truck freight transport and ship transport). So far, many pilot-scale plants were built to demonstrate the validity of the PtG technology [7]. Among these, the Store&GO European project demonstrates the feasibility of three methanation plant concepts: honeycomb methanation reactors, milli-structured methanation reactors and biological methanation [8]. This work was performed within the Italian demo plant that uses the milli-structured reactor design and has a power input of 200 kWel, corresponding to methane productivity of 10 Nm3/h. The product gas can be injected in the natural gas grid or it can be eventually liquified onsite, thus being a PtG as well as PtLNG innovative installation. The process configuration can be found in [9].
At the heart of the PtG process is the CO2 methanation reaction also known as the Sabatier reaction reported in Equation (1).
According to Le Chatelier’s principle, the methanation reaction is favored at low temperature and high pressure. Therefore, in order to obtain high conversion rates, a catalyst is required to overcome kinetic limitations occurring at low temperatures. Several transition metals have demonstrated activity for the CO2 methanation reaction [10,11]. The most studied catalysts for this application are nickel-based catalysts due to their good activity and low price [12]. Very few studies investigate the stability of the catalyst in real operating conditions: Bartholomew et al. [13,14] have studied the metallic surface area loss in hydrogen and hydrogen/water atmosphere. They have found that loss of nickel surface area is caused by support collapse and nickel particle growth. Sehested et al. [15,16] have performed a similar study for steam reforming nickel supported catalysts. None of these studies supplied operando CO2 methanation performance. Rostrup-Nielsen et al. [17] have studied the sintering of a commercial nickel-based catalyst for methanation of CO at high temperatures (600–700 °C). The study was conducted on catalyst samples from a pilot plant that operated for over 8000 h long tests. Abellò et al. [18] have performed long term tests (500 h) and up to 500 °C on highly loaded nickel catalysts. They found that the catalyst maintains its activity and selectivity with little nickel particle growth. Koschany et al. [19] observed a strong deactivation on a co-precipitated nickel catalyst in a 320 h long test carried out at 380 °C. They have also reported a correlation between the particle average size and the weight time yield. Furthermore, they did not observe any correlation with the BET surface area. A recent study by Ewald et al. [20] has analyzed with great detail the cause of methanation nickel-based catalysts between 300 and 350 °C and in tests up to 168 h long. They have found that sintering of the of nickel particles is the main cause of deactivation for co-precipitated samples. For the impregnated samples both the surface area and nickel particle growth were the main cause of deactivation. They have also fitted activity data with a power law model in isothermal conditions. None of the above studies have provided a complete methanation kinetic model containing both the intrinsic kinetic model and the aging behavior. This is a crucial aspect in order to be able to correctly design a reliable methanation reactor system.
In this work, the aging behavior of a commercial Ni/Al2O3 catalyst is examined in real-world operating conditions. Furthermore, the cause of the aging process is investigated using different analytical techniques: N2 physisorption, X-ray diffractometry (XRD) and temperature-programmed oxidation (TPO). Finally, a kinetic model that considers also the aging kinetics is proposed.
2. Results and Discussion
2.1. Catalyst Aging Experiments
In this section, the results from the catalyst aging tests are presented, accompanied by the catalyst characterization and the kinetic analysis.
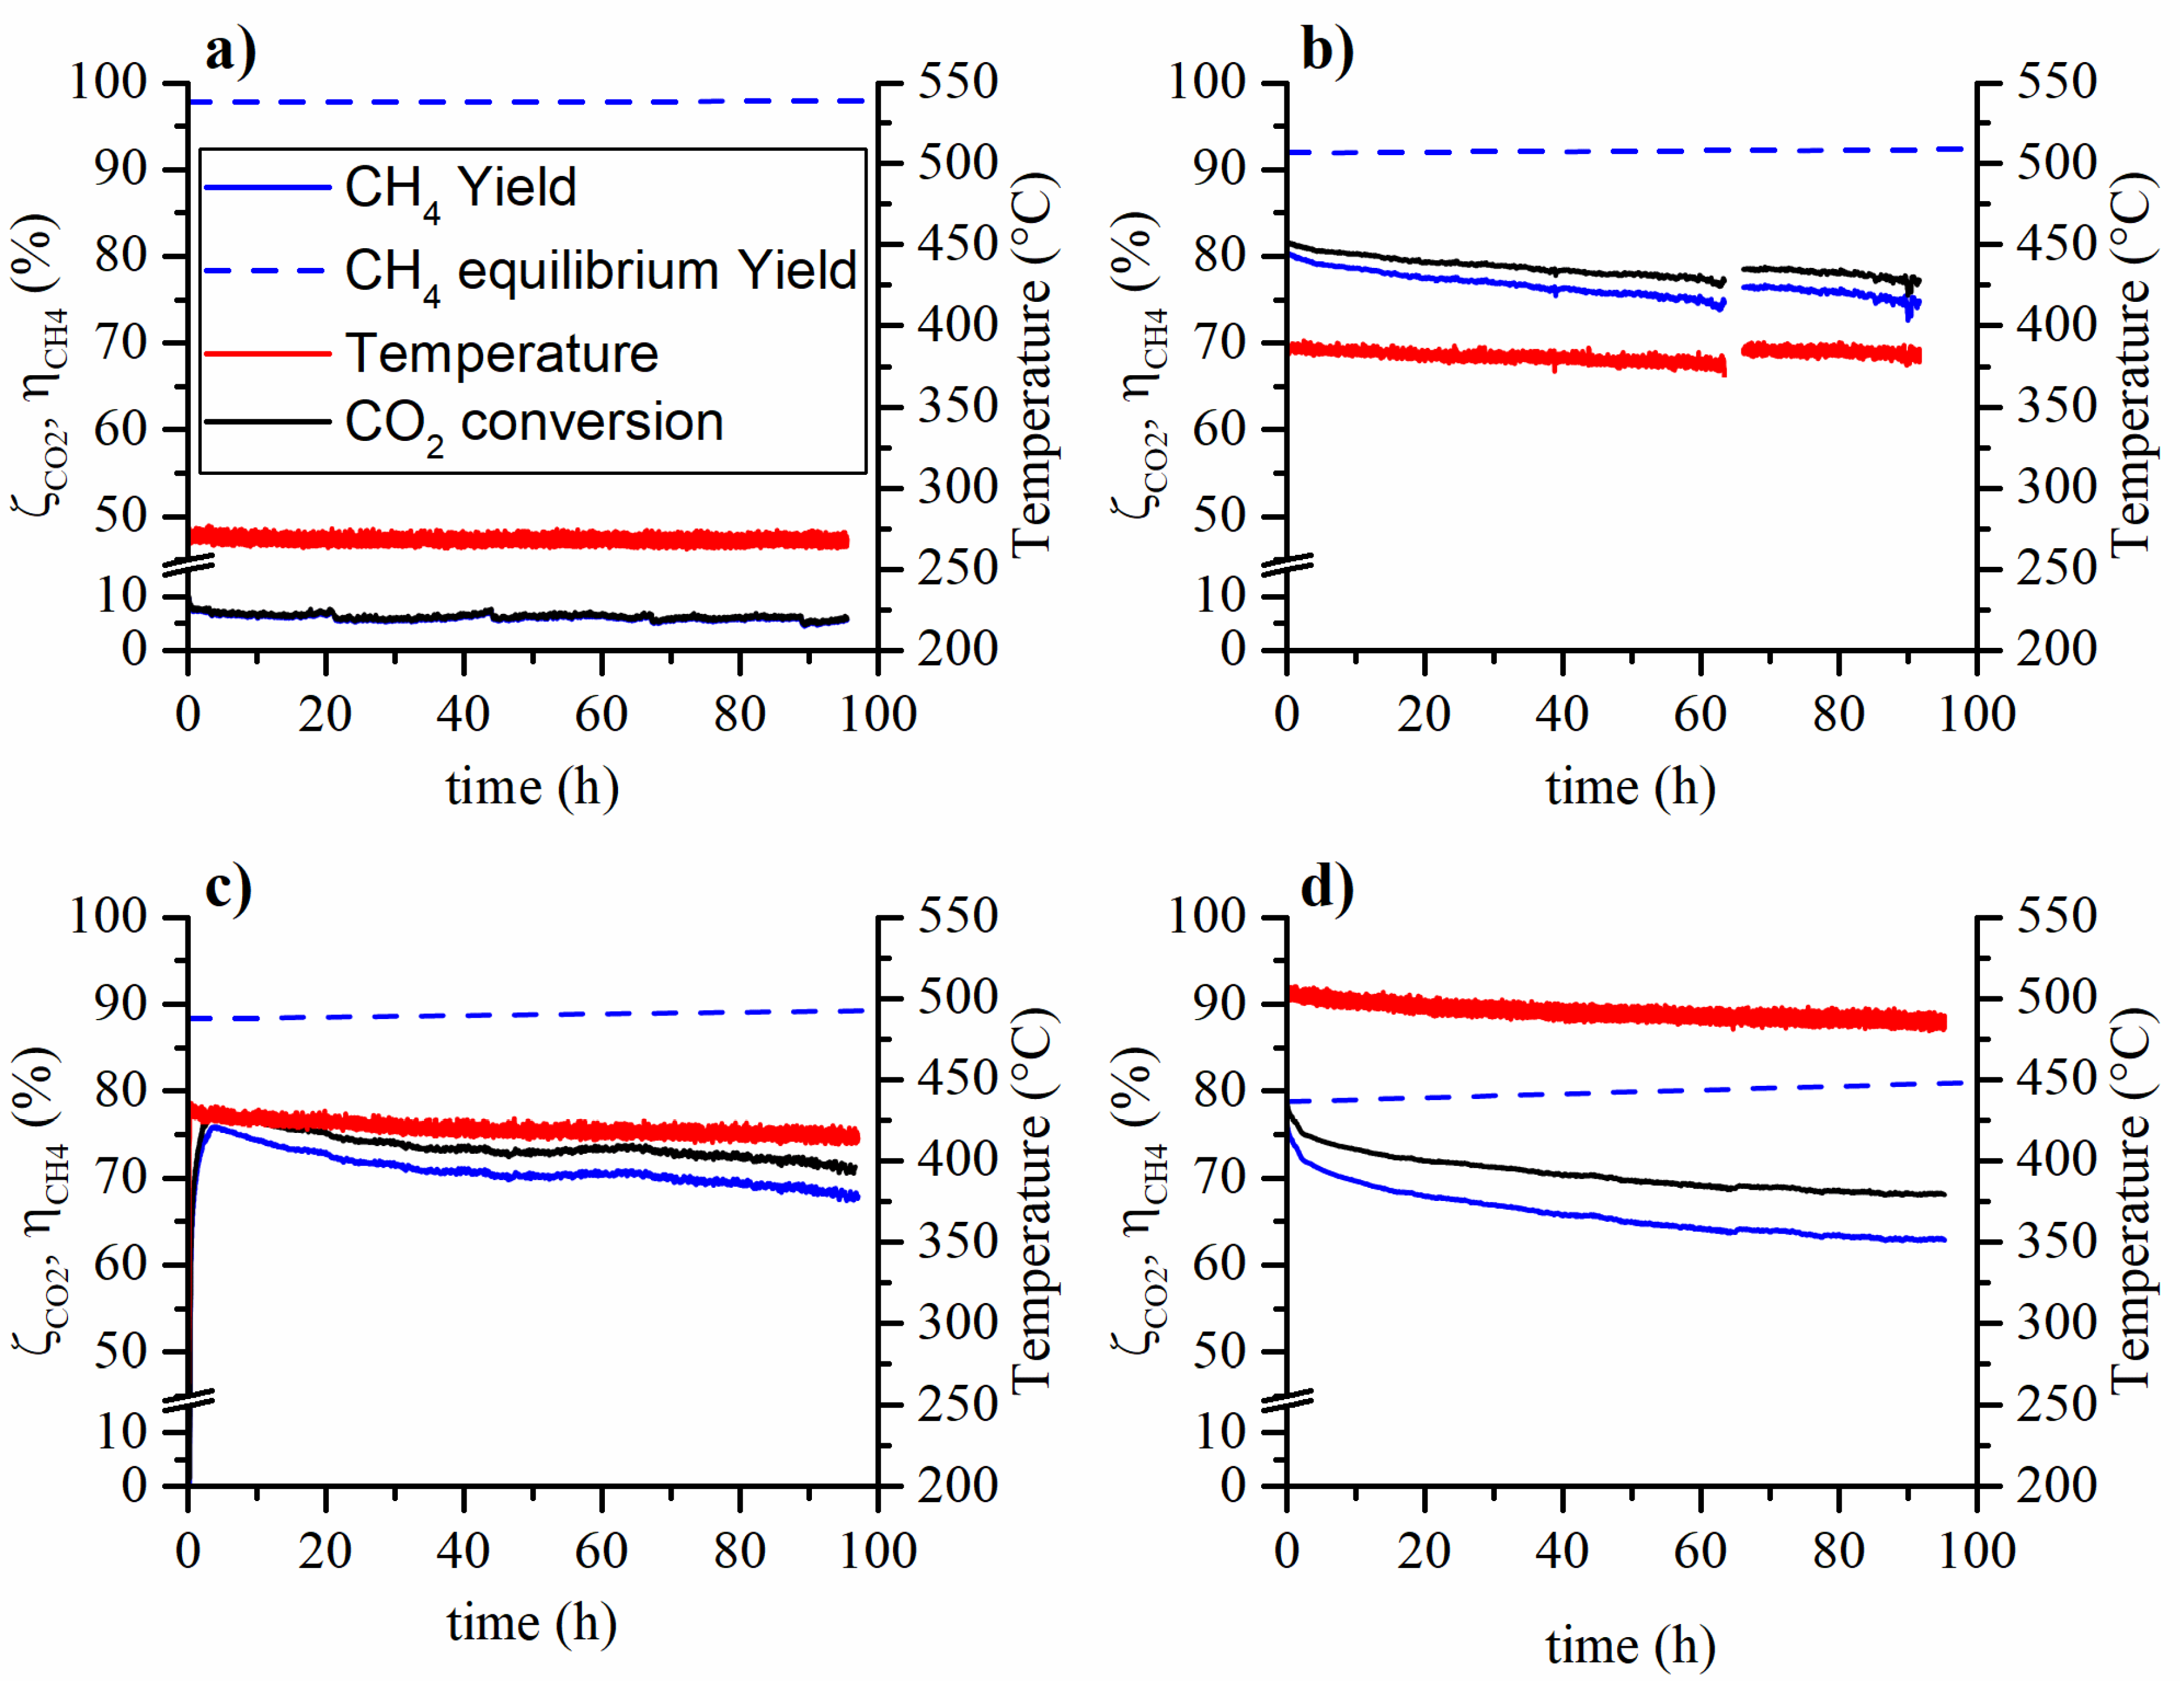
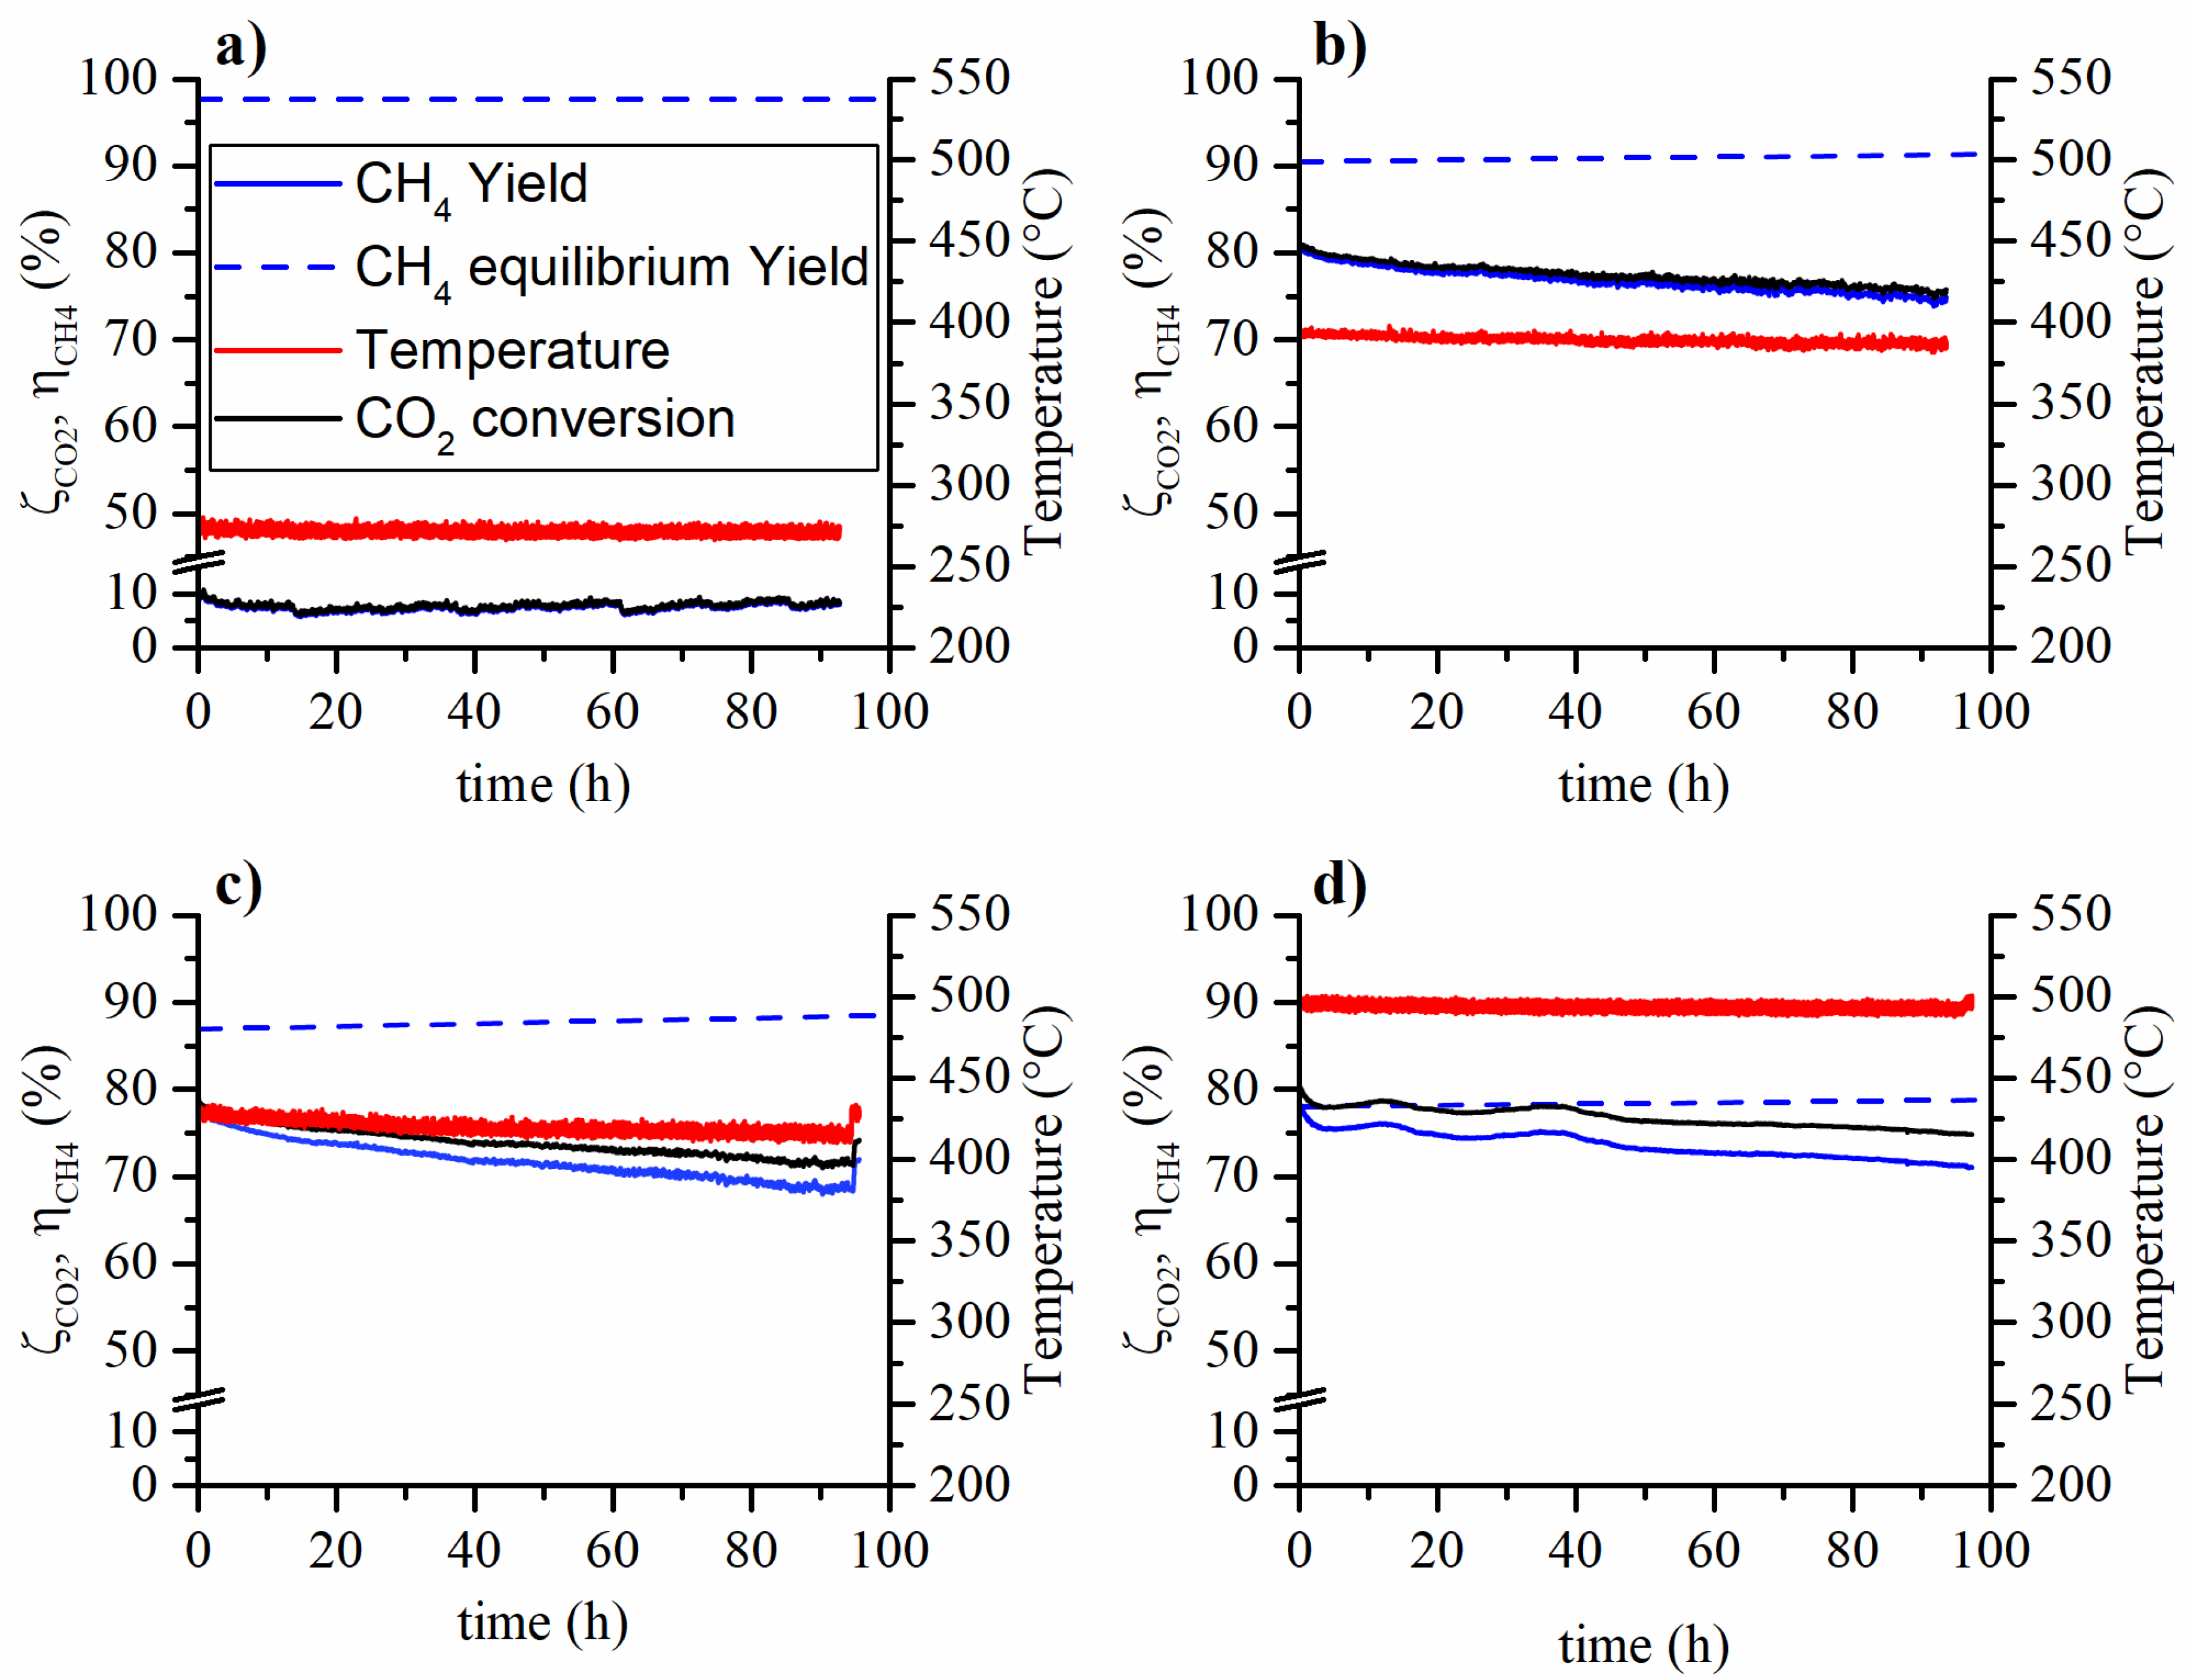
In Figure 1 and Figure 2 the CO2 conversion and CH4 yield are reported for the aging tests carried out at various temperatures and feed compositions. On the one hand, the tests carried out at low temperature (270°C) have not shown, within experimental error, a methane yield (or CO2 conversion) variation during the ~100 h long aging run. On the other hand, the tests carried out at higher temperatures have shown a decrease both in terms of methane yield and reaction temperature. The observed methane yield loss is due to two non-independent phenomena. During the aging process, the aging of the catalyst causes the reduction of the conversion rate. Therefore, the reduced heat production results in the reduction of the catalytic bed temperature. Hence, an amplification of the observed methane yield reduction is caused by both the catalyst aging and the decrease in reaction temperature. This occurs because the controlled temperature is that of the oven in which the reactor is placed.
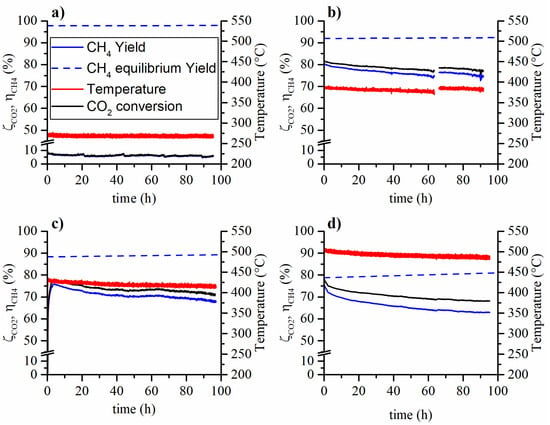
Figure 1.
Aging tests at 5 bar, weight hourly space velocity (WHSV) = 150 , feed composition 16% CO2, 64% H2 and 20% N2 and (a) 270 °C, (b) 380 °C, (c) 425 °C and (d) 500 °C.

Figure 2.
Aging tests at 5 bar, WHSV = 150 , feed composition 14.8% CO2, 59.2% H2, 6% CH4 and 20% N2 at 5 bar and (a) 270 °C, (b) 380 °C, (c) 425 °C and (d) 500 °C.
The tests aged with 6% of methane in the feed gave similar results compared to the ones aged without methane in the feed. Therefore, the presence of methane in the feed stream does not affect the catalyst stability. The CO2 conversion and CH4 yield loss at the end of the aging tests are summarized in Table 1: in the caption, Test 1 refers to Figure 1, while Test 2 to Figure 2. The decay of the CO2 conversion and CH4 yield follow similar trends at a first glance. A light increase in the CO yield was also observed during the aging tests. This could be caused by the selectivity change of the catalyst but also by the loss of activity of the catalyst and operating conditions (carbon monoxide could be an intermediate in the reaction mechanism).

In Figure 2c,d, at the end of the aging run, the temperature was raised back to the initial value in order to observe the real loss in catalytic activity, not biased by the lower reaction temperature. In the case of the test at 425 °C, the yield loss halved when the effect of the temperature drop was removed by restoring the initial temperature. The test at 500 °C does not appear to be affected by the temperature drop and no yield increase was observed when the temperature was restored to the initial value. This is probably due to the proximity of the equilibrium.
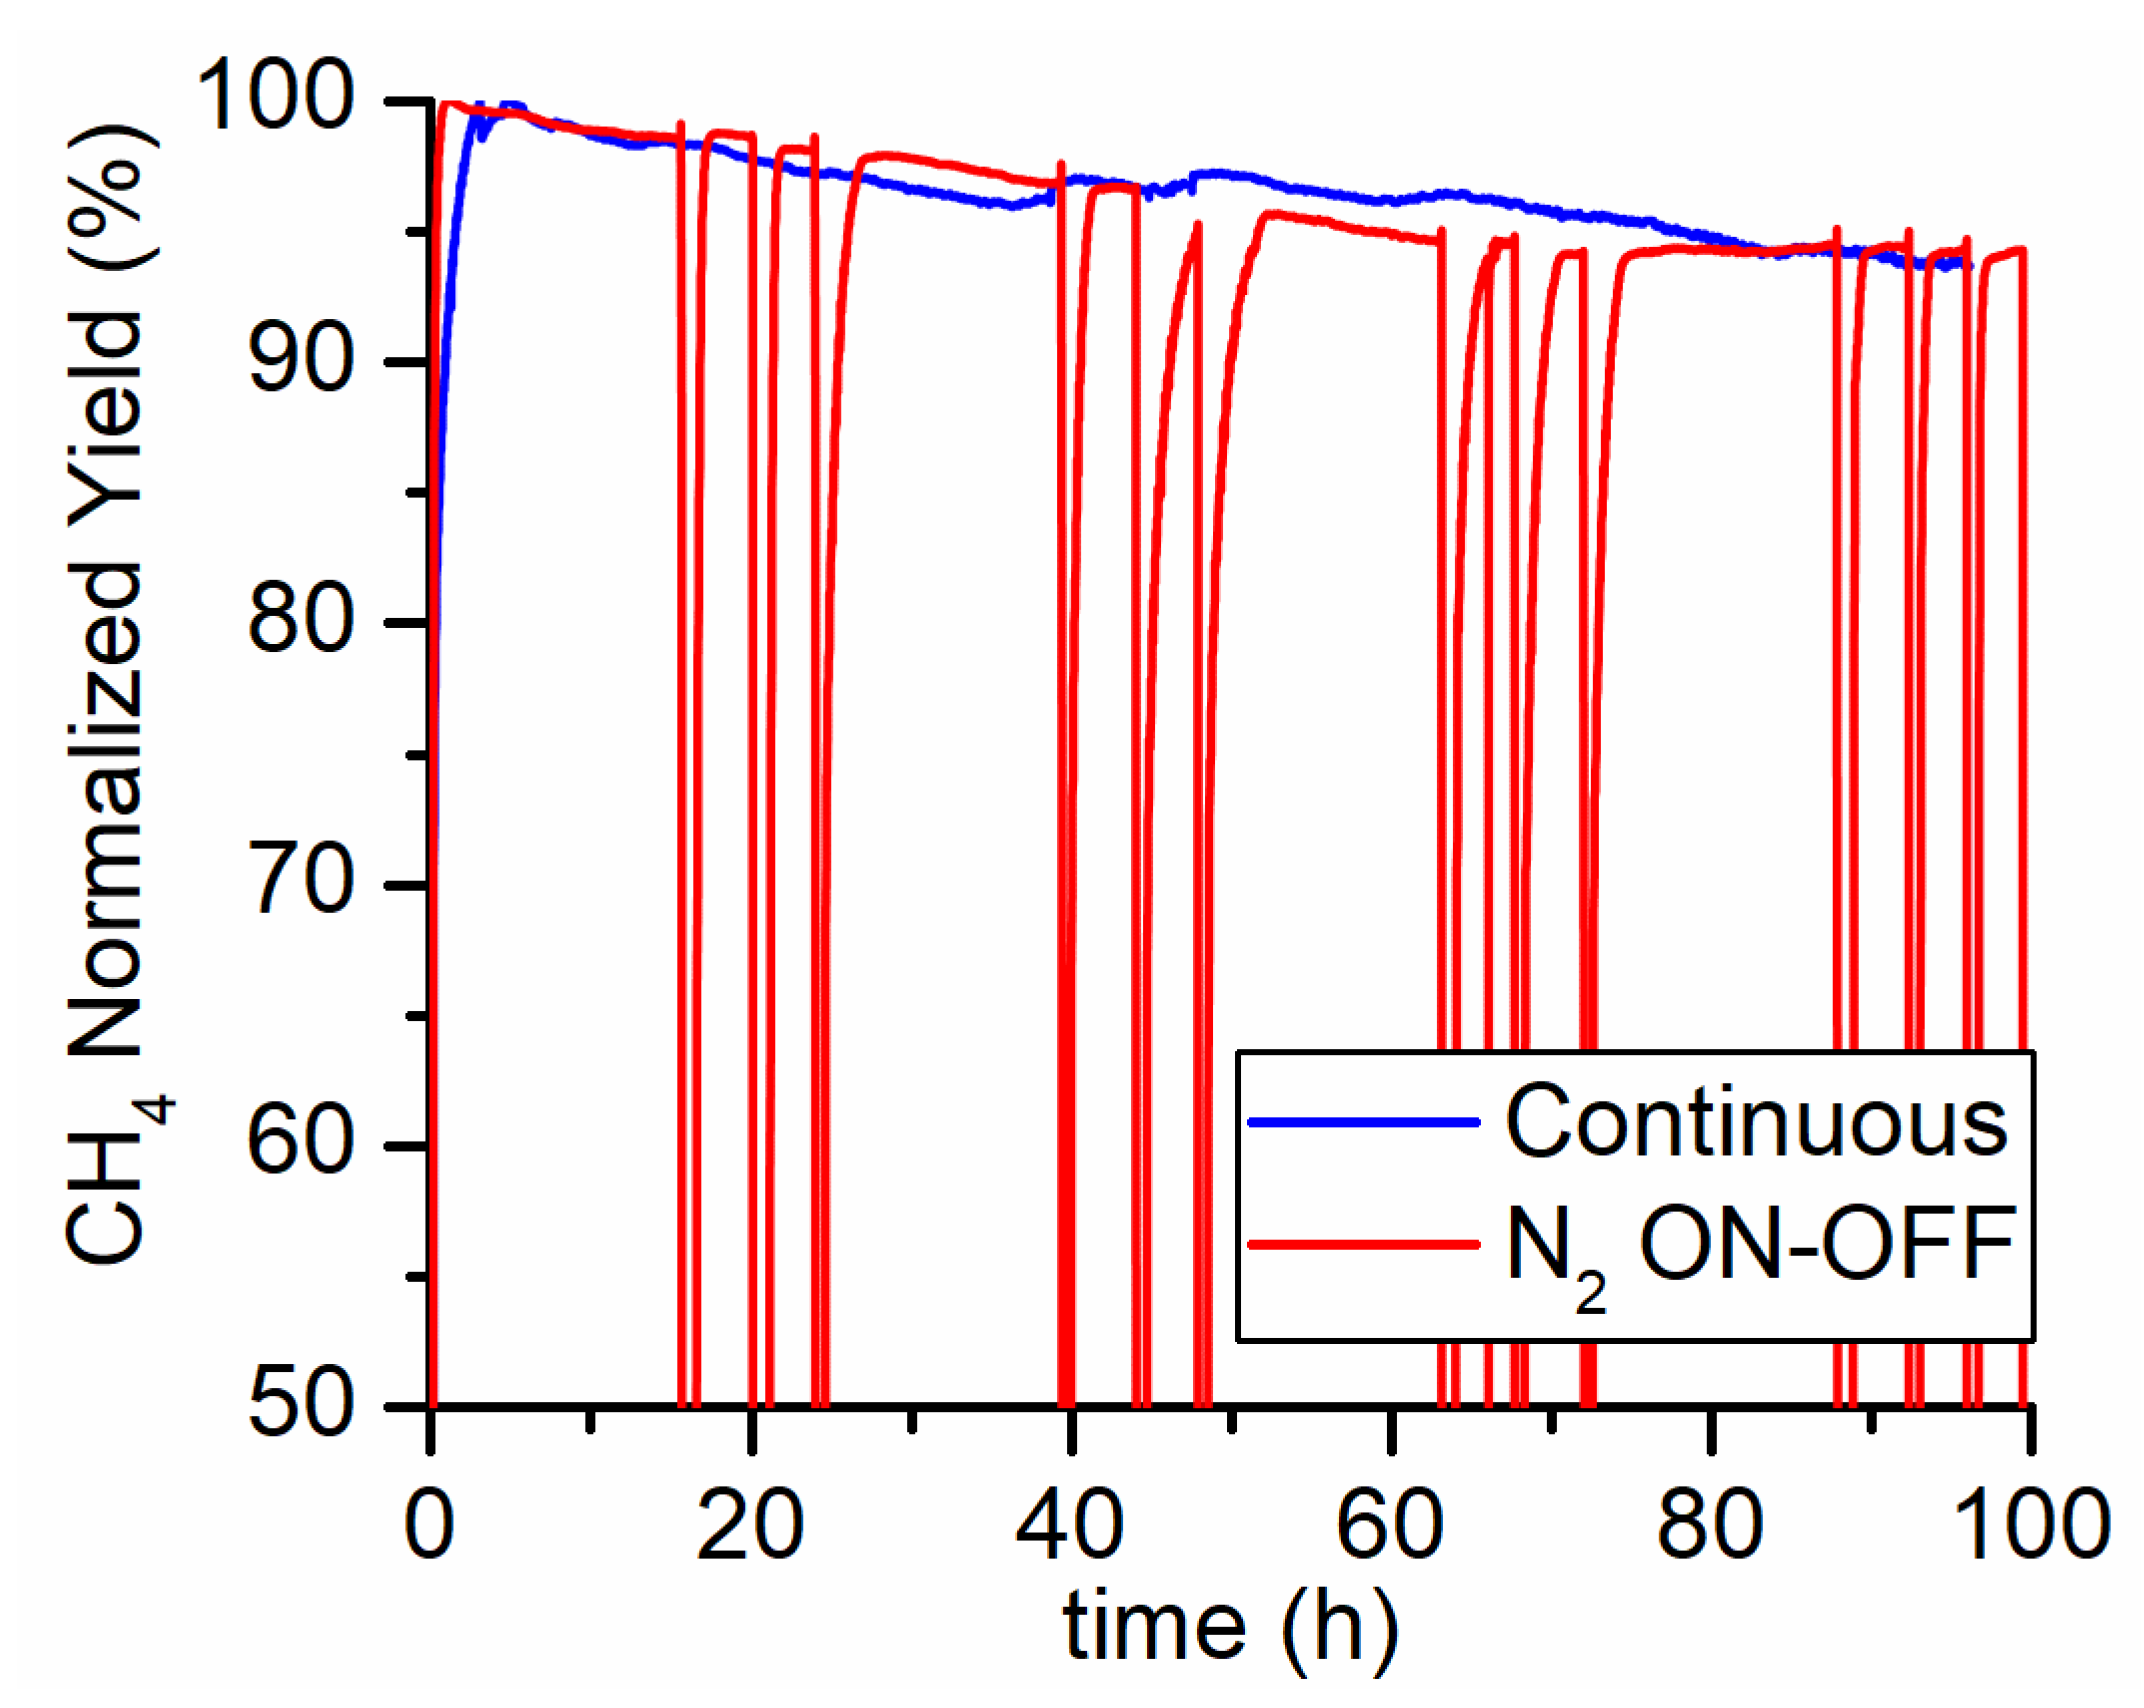
The PtG methanation system typically undergoes fast modulation following the availability of hydrogen from electrolysis. Hence, an ON-OFF run was conducted at 425 °C in order to asses if the shutdown and start-up of the reaction have any influence on the catalyst performance. A total of 12 on-off cycles were carried out during a 100 h long run. During the off-phase, the reactor was kept at the operating temperature and under 30 lSTP/h of nitrogen flow rate. High purity 6.0-grade nitrogen was used in order to avoid nickel oxidation by oxygen impurities [21]. In Figure 3 the results are reported in terms of normalized methane yield (defined as the ratio between the yield at time t and the yield at the beginning of the run). No differences were observed between the straight run and the ON-OFF test. Therefore, the aging process is not affected by the transients generated with the repeated start-up and shutdown of the reaction. Thus, it can be concluded that the aging process depends only on the time on stream and reaction conditions.
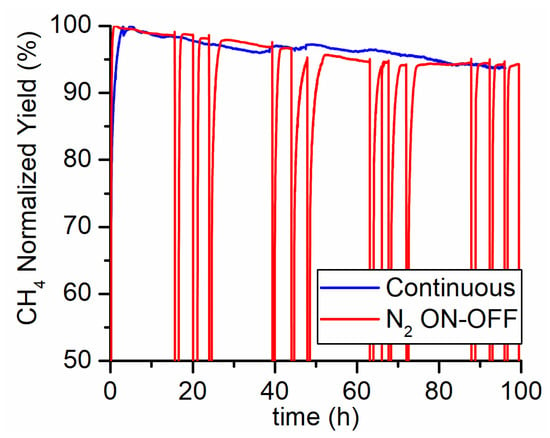
Figure 3.
Continuous (blue line) versus ON-OFF (red line) 100 h test carried out at 425 °C, 5 bar, feed flow rate of 150 and composition CO2/H2/N2 = 4/16/5. Nitrogen was used to flush the reactor during the OFF phases.
2.1.1. Aged Samples Analysis
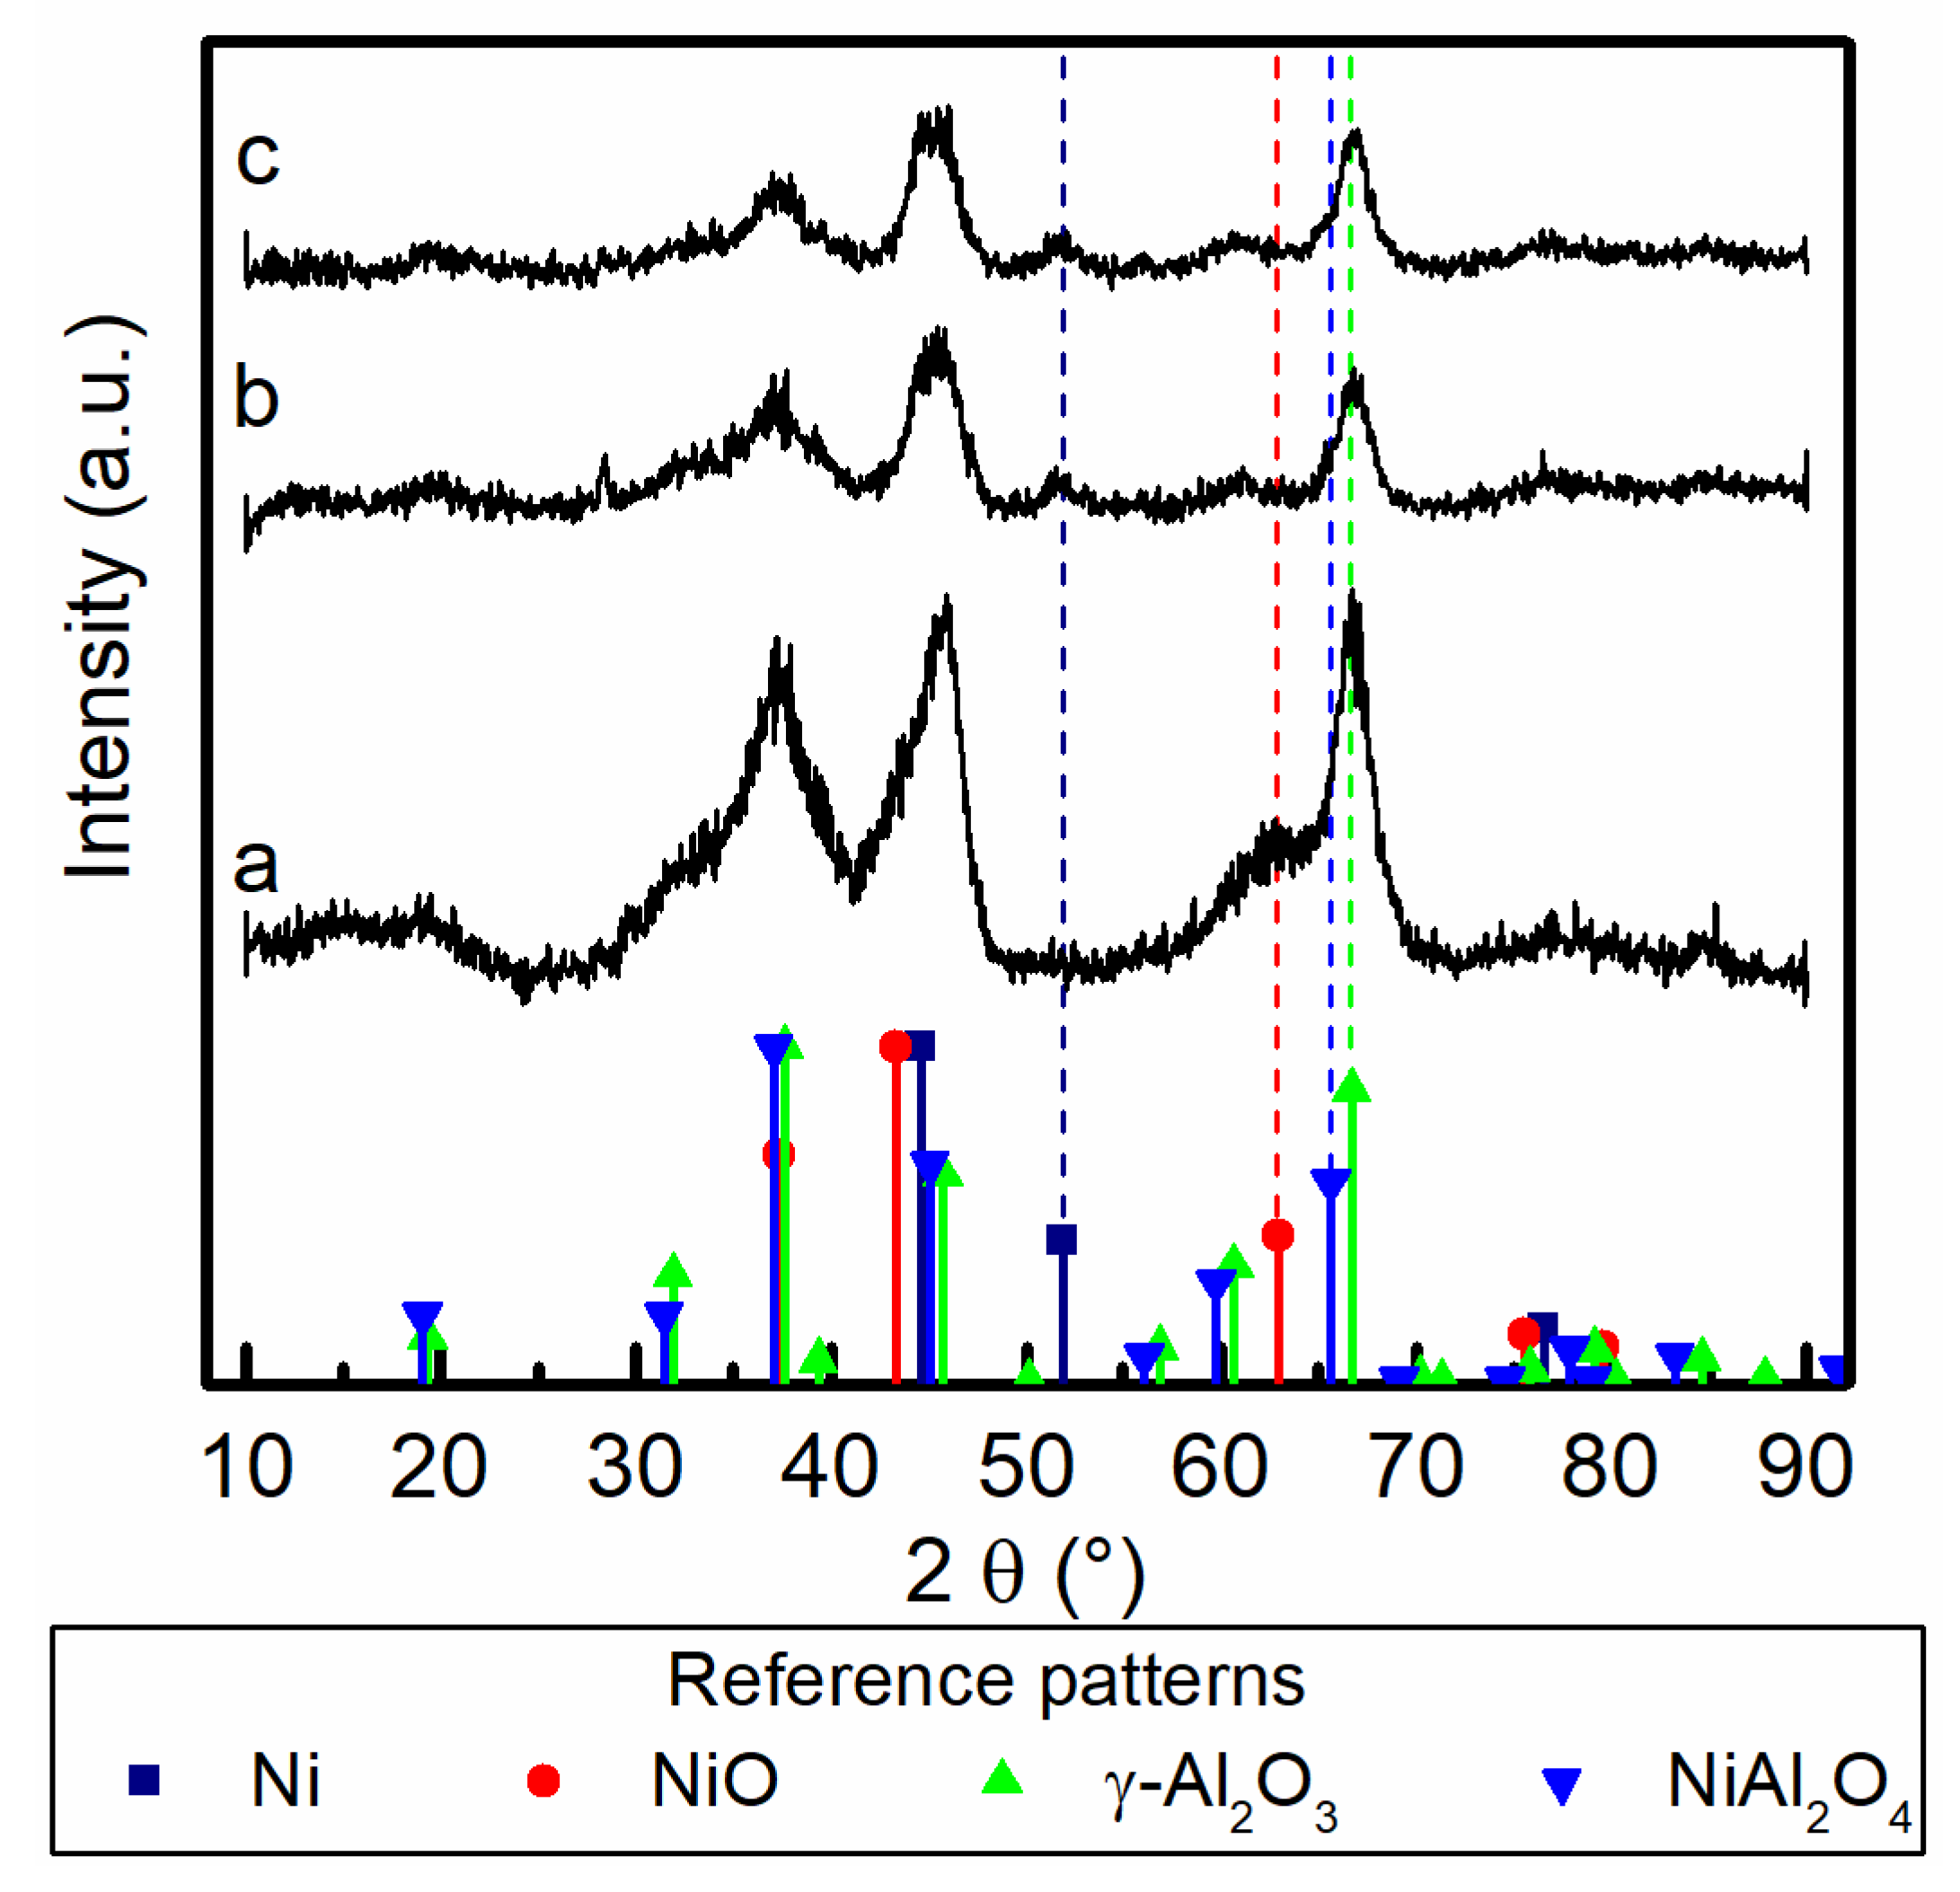
The XRD diffractograms were analyzed and compared with reference patterns of Ni, NiO, γ-Al2O3 and NiAl2O4 (Figure 4). The main reflection peaks of the reference patterns are all near one another, especially those of γ-Al2O3 and NiAl2O4. For the fresh and activated sample, the peaks corresponding to the NiO persist (2θ = 62.9°). The low activation temperature is not sufficiently high to reduce entirely nickel from oxide to metallic state. This aspect was also corroborated by the H2-TPR analysis performed on the fresh catalyst (see Supporting Information Figure S-3). About 22% of the total hydrogen uptake takes place during the activation procedure. This corresponds to the same fraction of reduced nickel. The aged catalyst samples carried out at higher temperatures with respect to the activation temperature presented a reflection at 2θ = 51.9° that was attributed to metallic Ni. The oxide reduction to the metal form is caused by the high content of hydrogen present in the gas stream during the methanation process. Furthermore, this peak is not present in the freshly activated sample and could be a sign of Ni crystallite growth with consequent loss of dispersion and nickel exposed surface. The peak of γ-Al2O3 at 2θ = 66.6° becomes less intense in the samples aged at high temperatures. This can be an indication of the evolution of the alumina support, which partially turns into Ni aluminate, with consequent loss of the porous structure of the support. Moreover, a secondary peak assigned to NiAl2O4 can be observed at 2θ = 65.5°.

Figure 4.
X-ray diffractograms of (a) fresh activated catalyst, (b) aged at 380 °C for 100 h and (c) aged 425 °C for 100 h. The diffractogram was compared with the reference patterns of Ni (01-087-0712), NiO (01-078-0429), γ-Al2O3 (96-201-5531) and NiAl2O4 (00-010-0339).
The results from the surface area analysis are summarized in Table 2, the adsorption isotherms are reported in Figure S-1 and pore distribution in Figure S-2. The samples have a Type IV isotherm, typical of mesoporous materials. The fresh, fresh reduced and aged at 270 °C catalysts have a hysteresis resembling an H2 type. Generally, H2 hysteresis loops are ascribed to materials without a well-defined porous structure [22].

Table 2.
Surface area and average pore width.
The surface area of the reduced sample and the fresh sample do not change within errors. The aging tests carried out at 270 °C also do not show a decrease in surface area. This is also in agreement with the activity that remains constant during the entire test. The surface areas of the aging tests carried out at higher temperatures exhibit a significant decrease as the temperature of the aging test increases.
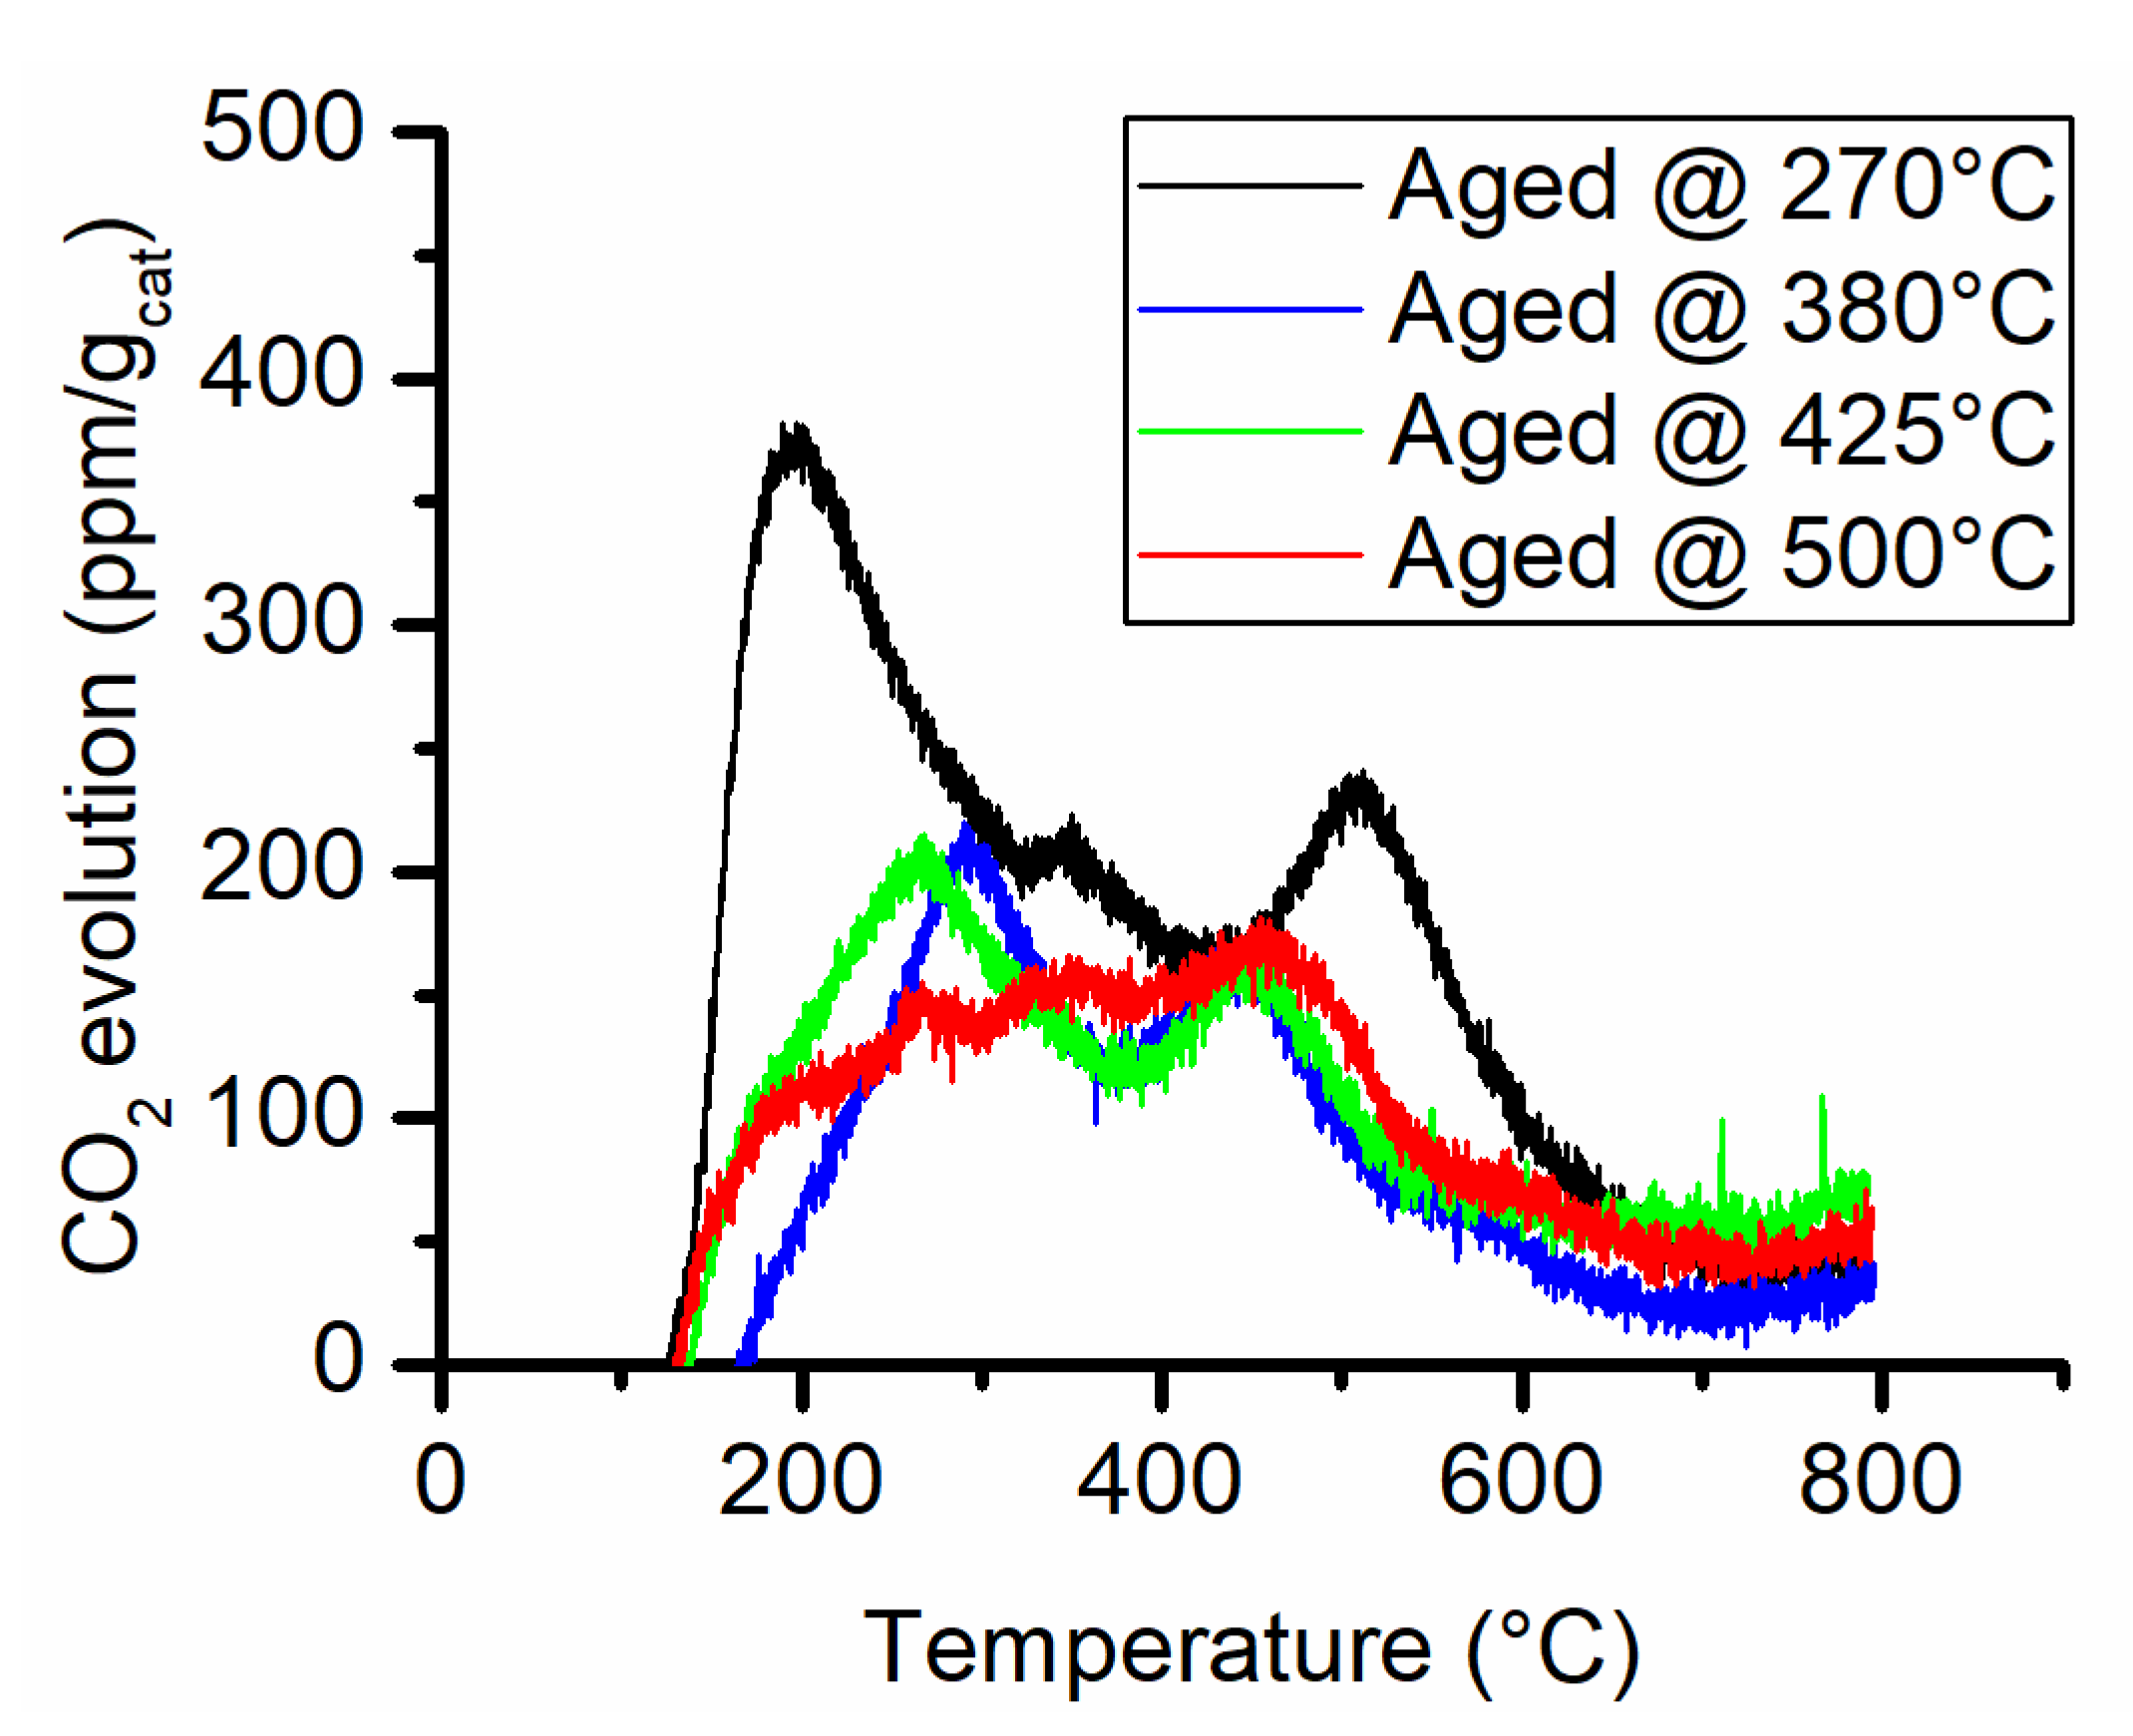
The possible causes for this important reduction in the surface area could be either fouling and pore occlusion caused by carbon deposition or sintering of the support. The TPO analysis is reported in Figure 5 and the quantitative analysis in Table 3. The comparison of the TPO results with the CO2-TPD (see Supporting Information Figure S-4) does not reveal a substantial increase in the CO2 generation. The combustion of eventual carbon deposits generally occurs at temperatures above 500 °C if the reactivity of these deposits is analogous to the one formed on Ni/Al2O3 catalysts used in dry reforming [23,24,25]. Therefore, the CO2 evolution peaks below 500 °C are probably caused by leftover decomposing carbonates or negligible quantities of contaminating organic material that may occur during sample manipulation. From the examination of the curves in Figure 5, the main contribution to CO2 emissions occurs below 500 °C. The only analysis that gave a CO2 evolution peak above 500 °C was on the sample aged at 270 °C. In that case, it could be associated with carbon deposition. Nevertheless, the integral quantity of CO2 measured with the TPO revealed a very small amount of equivalent carbon present on aged samples. Thus, carbon deposition can be excluded as the main cause of the decrease in surface area.
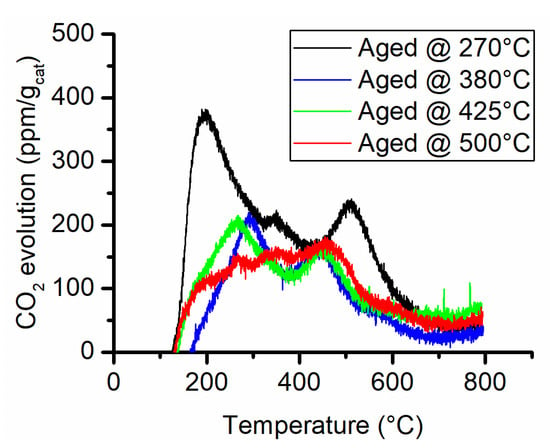
Figure 5.
CO2 evolution during the temperature-programmed combustion analysis.

Table 3.
TPO Test 1 quantitative analysis of carbon production.
The cause of such an important decrease in surface area can only be attributed to the catalyst support sintering. In this case, the support might be incorporating the nickel active phase by surface rearrangement and pore closing. In fact, the average pore dimension increases from ~6 nm to ~12 nm and a complete loss of the micropores was observed. Furthermore, Bartholomew et al. [13,14] have demonstrated that water highly promotes the collapse of alumina support. This is obtained in the high CO2 conversion achieved in the high-temperature tests.
2.1.2. Kinetic Analysis
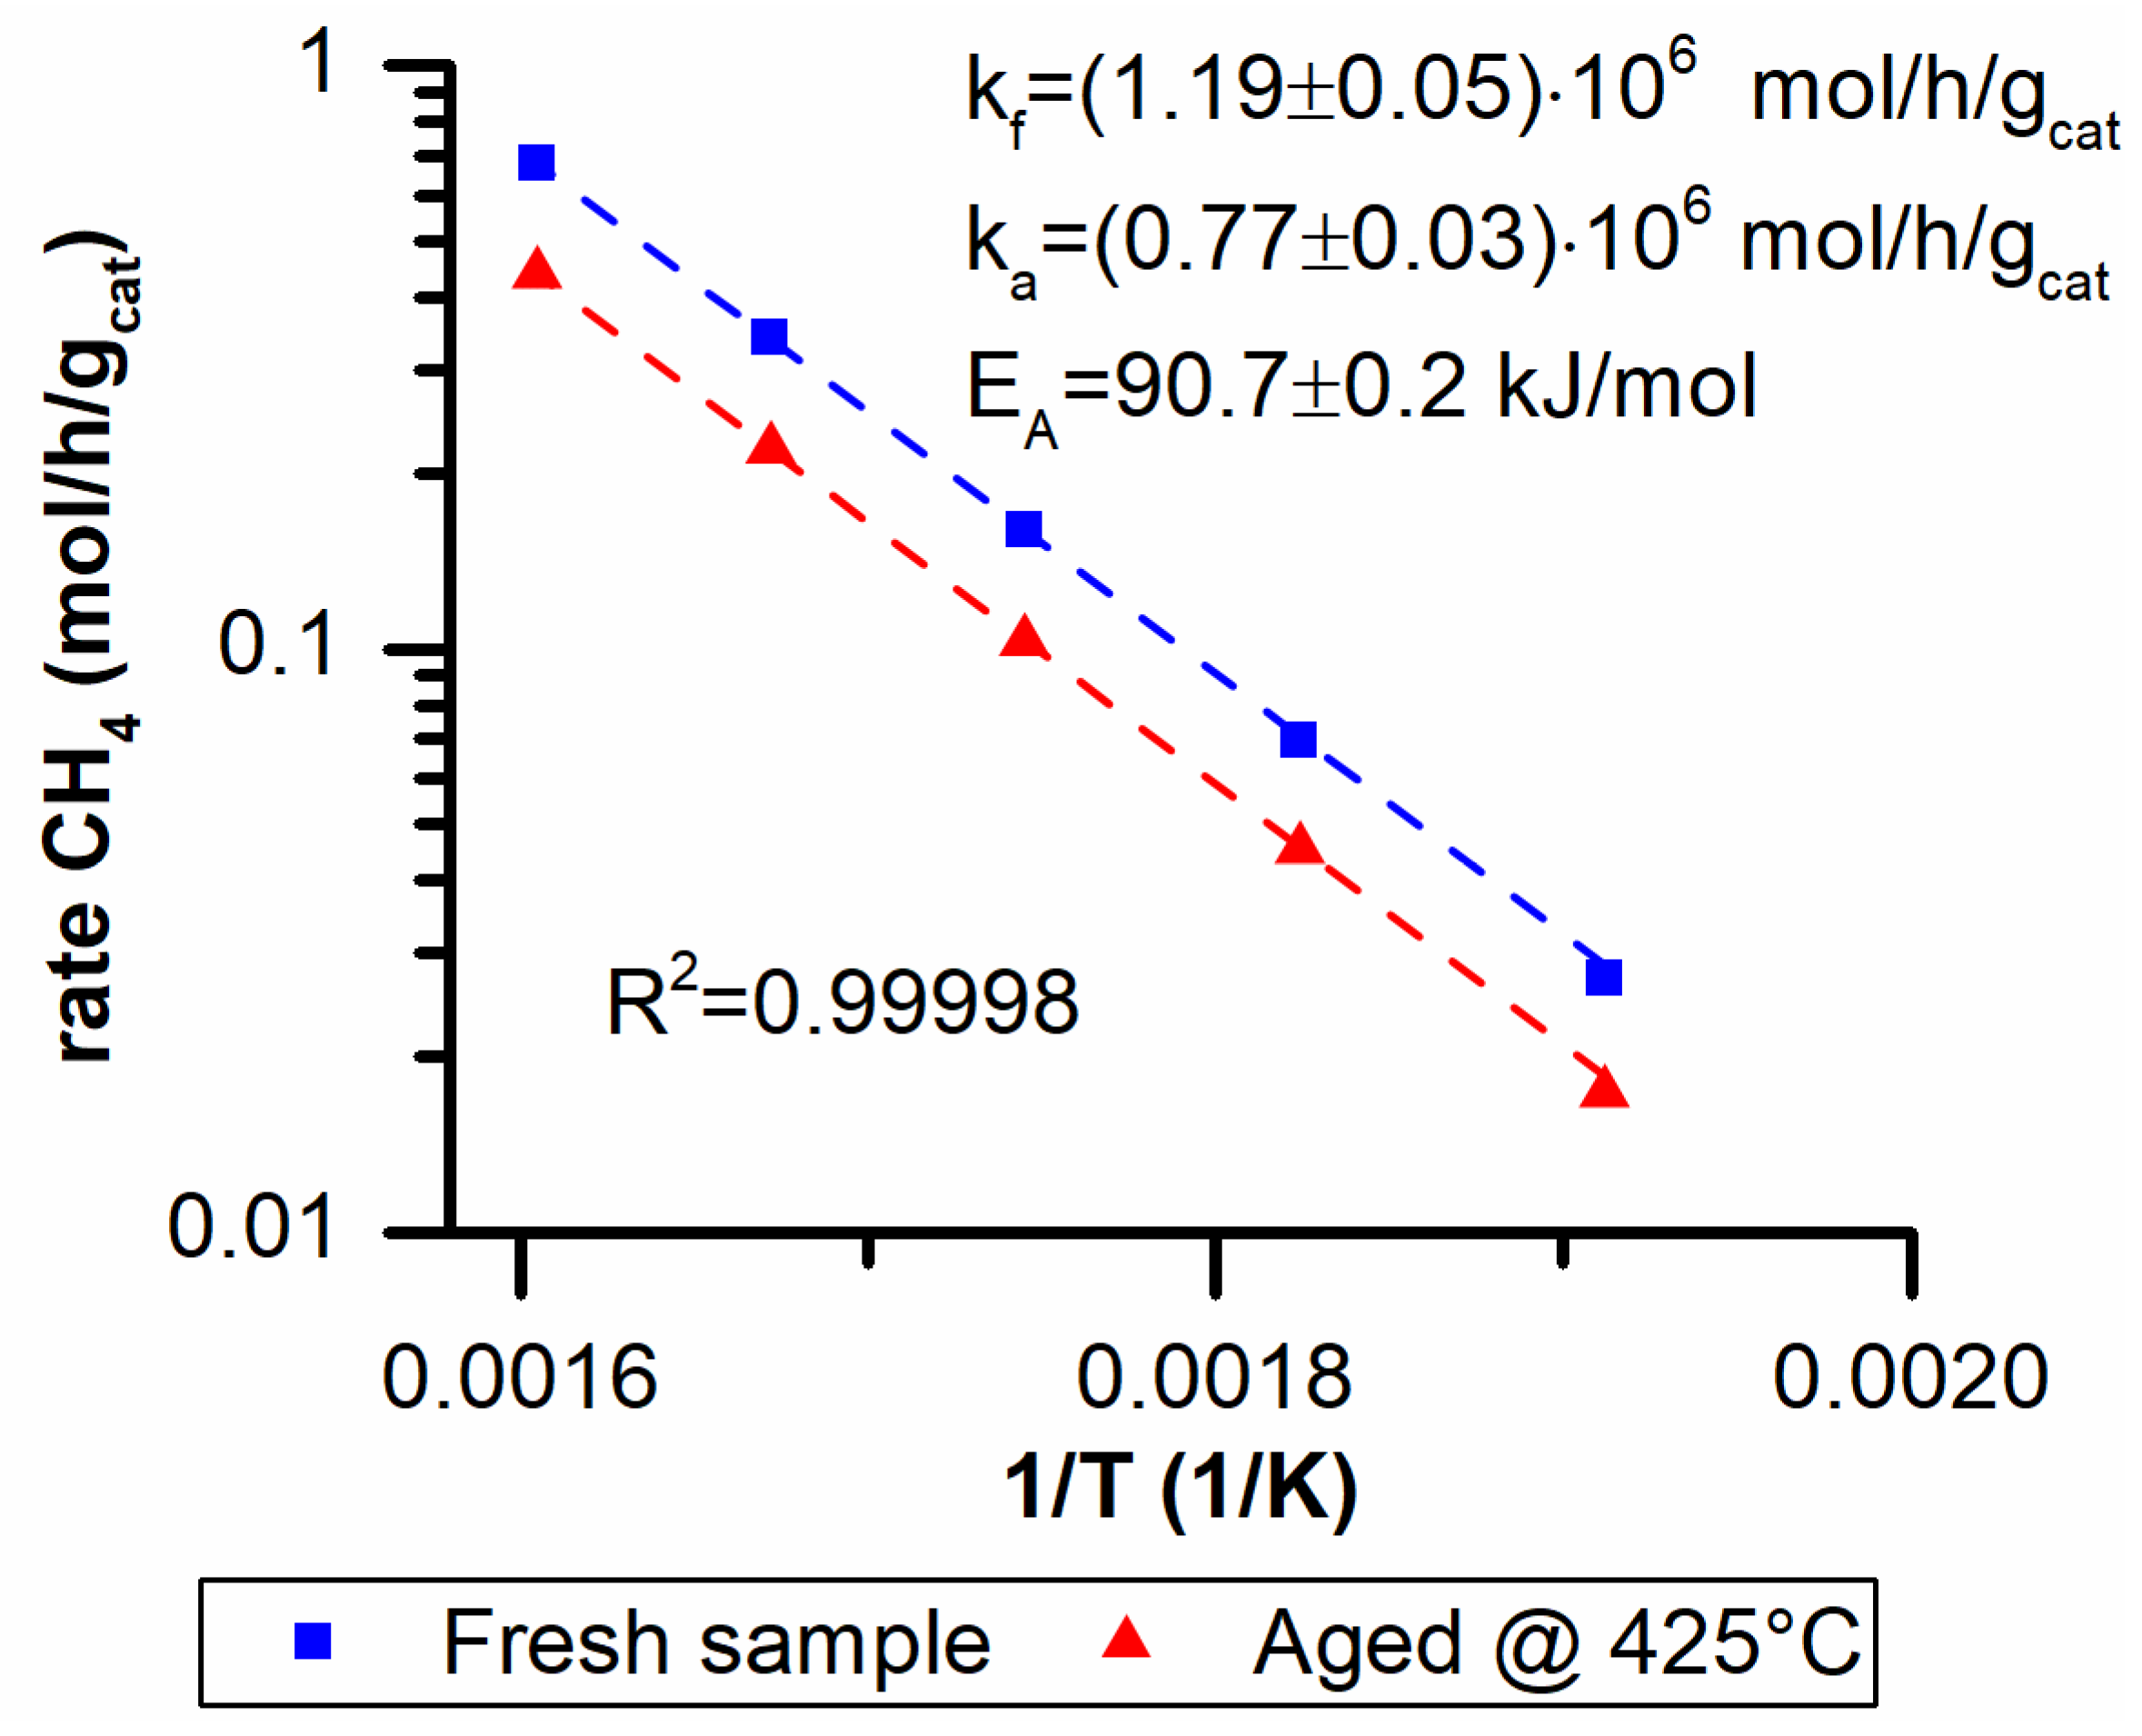
Two activity runs were performed on a fresh catalyst sample and on the same sample aged at 425 °C for 100 h. The activity tests were performed at 5 bar with a feed composition CO2/H2/N2 = 16/64/20 and in a temperature range between 250 °C and 350 °C. This allowed for the preexponential factor and activation energy to be estimated for the fresh and aged catalyst. In an Arrhenius plot, the preexponential factor is proportional to the number of active sites while the activation energy depends on the reaction mechanism. An eventual loss of active sites would only affect the preexponential factor. Therefore, the activity data were fitted using two different equations: Equation (2) for the fresh sample and Equation (11) for the aged one. These equations have the same activation energy since the reaction mechanism should not change.
In Figure 6 the Arrhenius plot and the fitting results are reported. The two activity runs are parallel to one another when plotted on the Arrhenius plot. This implies that the changes that occur are impacting only on the preexponential factor. In fact, a very good fit of the data was obtained with basically a unitary determination coefficient using Equation (2).
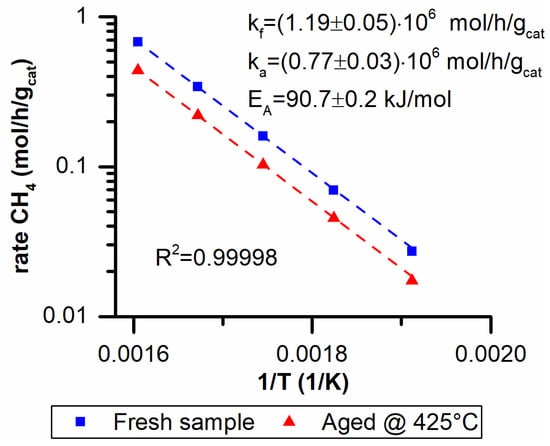
Figure 6.
Activation energy (EA) and preexponential factor for a fresh (kf) and aged (ka) sample at 425 °C.
Another important result was obtained when the ratio of the two preexponential factors (Equation (4)) was compared to the ratio of the surface areas of fresh and aged samples (Equation (5)):
The two ratios are basically identical and a direct correlation between the activity loss and the BET area drop exists.
With the latter result in mind, the same analysis was carried out on the data obtained during the long-term tests (Figure 1). These data were obtained in a reactor operating in integral mode and therefore the procedure is slightly different. A first order kinetic rate that considers the distance from equilibrium was used, as reported in Equation (6). The regression was performed on the fresh sample and at the end of the run. Since the temperature varies during the test a mean temperature value was used for the equilibrium composition calculation. The results are reported in Table 4. The ratio between the fresh and aged kinetic constants was compared with the ratio of the surface areas. A very good agreement was obtained also in this case. This means that the reduction of the active sites is directly proportional to the surface area reduction, further supporting the thesis that total surface area loss is the main cause of aging.

Table 4.
Fitting results of the integral operating reactor and comparison with surface area ratios.
2.2. Kinetic Modelling
2.2.1. Power-Law Kinetic Model
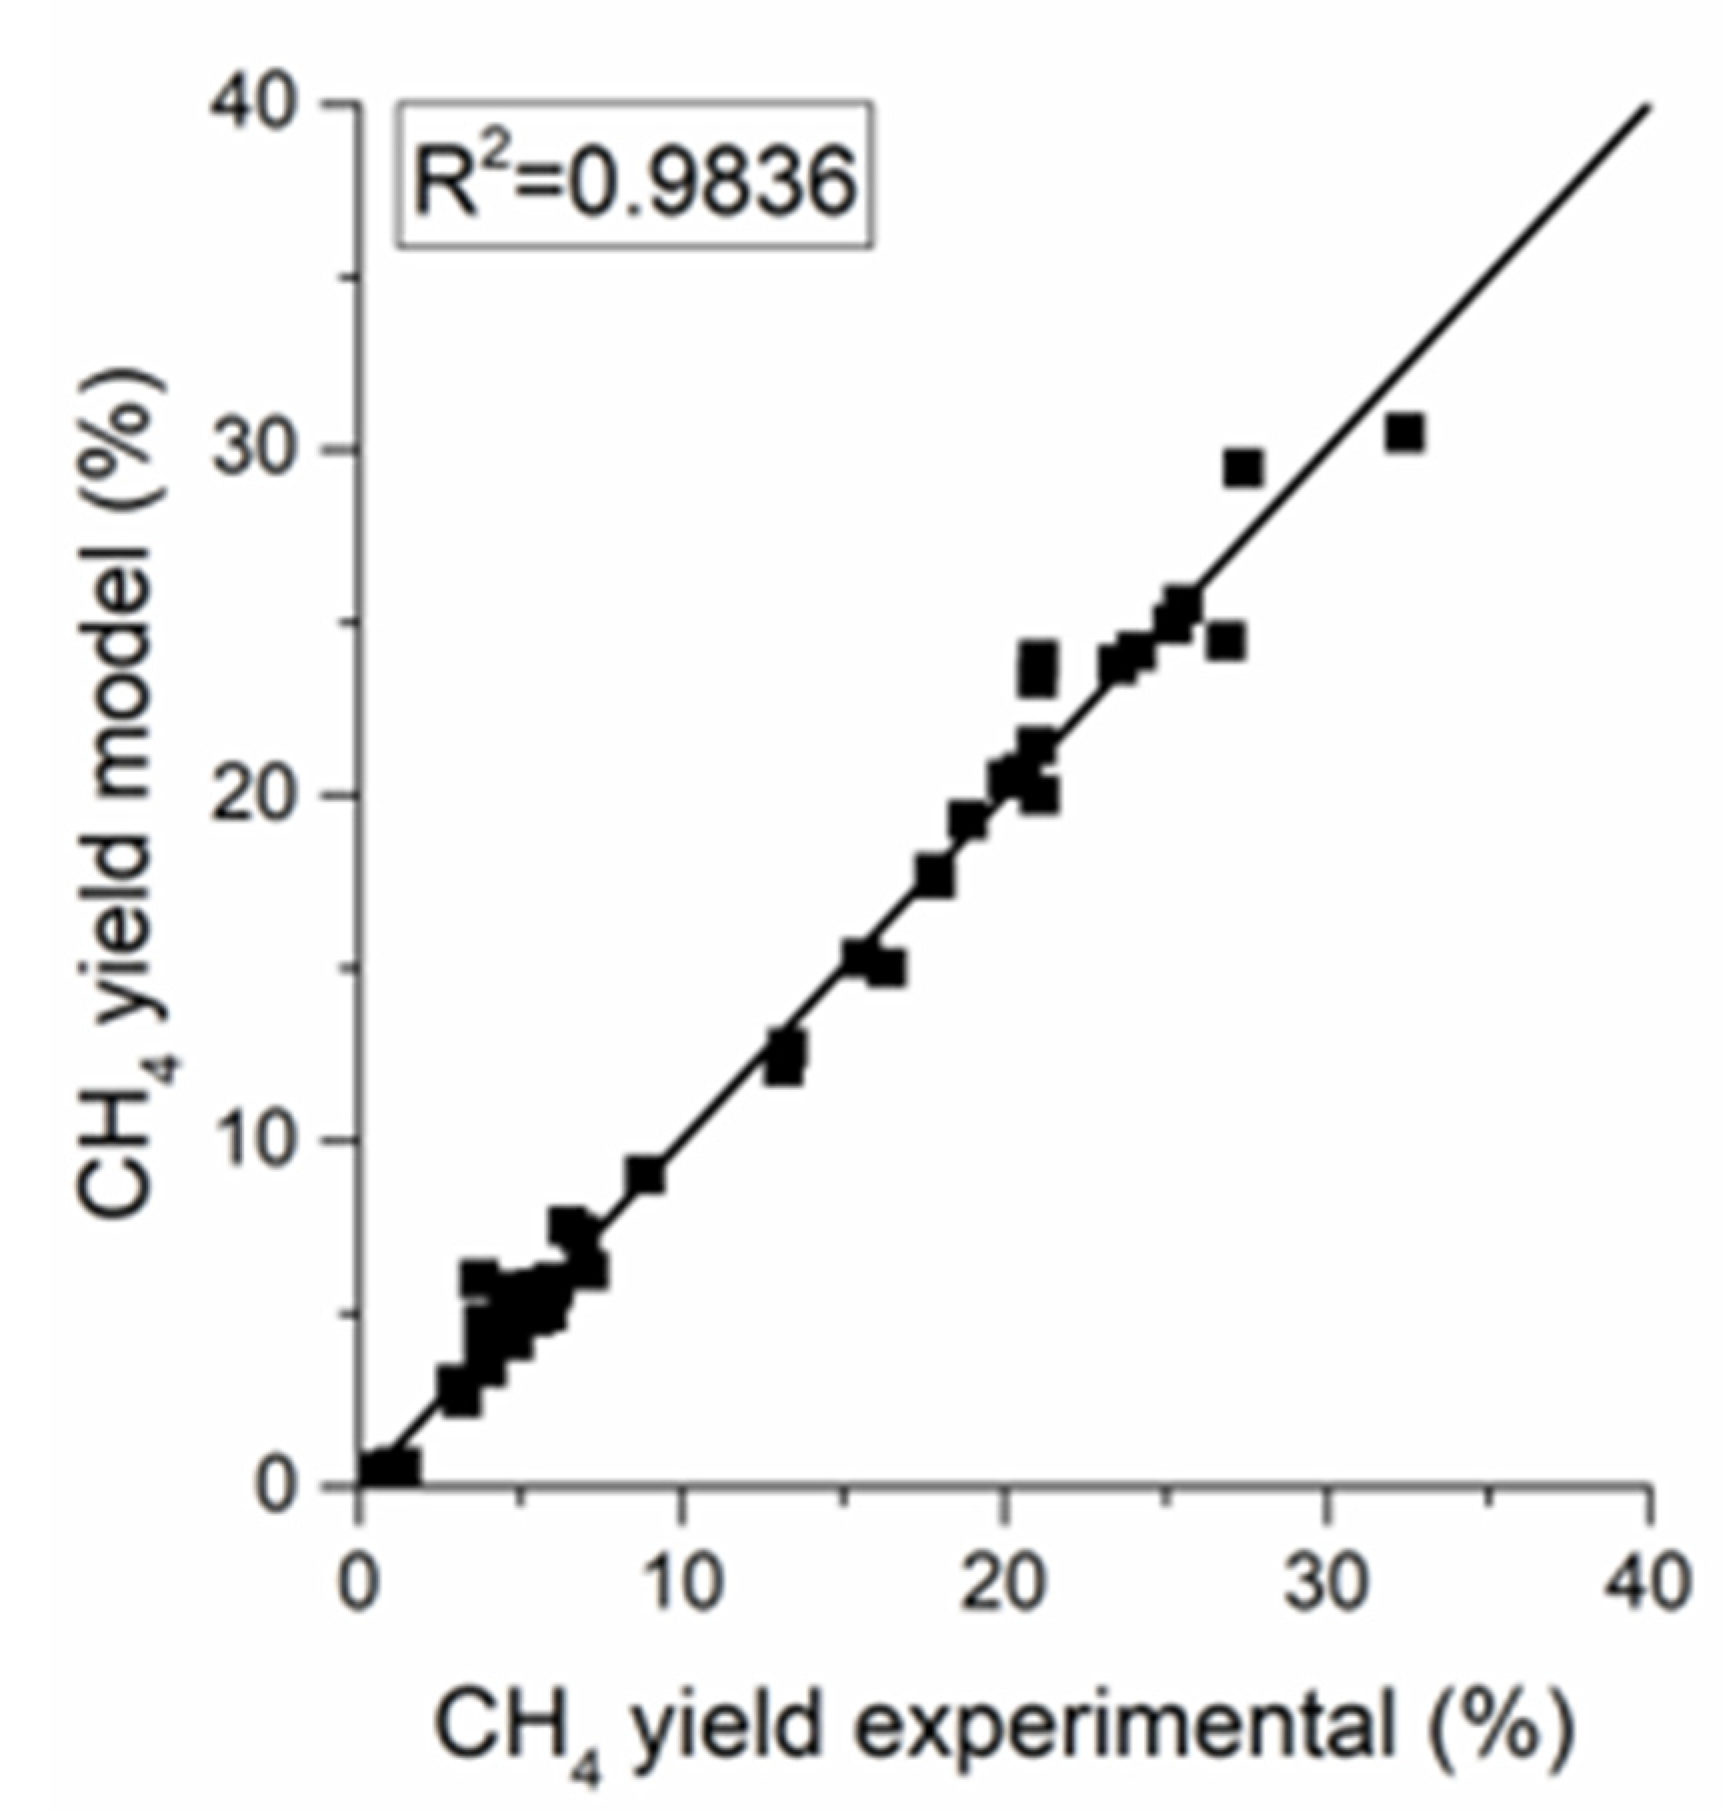
The parity plot of the power-law (PL) kinetics in Figure 7 reveals a good fit for the methanation methane yield with an of 0.984. The parameters of the power-law kinetic model are reported in Table 5. The apparent activation energy of 86.2 kJ/mol is in line with the literature values for nickel-based catalysts [19,26]. The negative exponent of the partial pressure of hydrogen in the reverse water gas shift (RWGS) reaction is reasonable because CO yield diminishes as the H2 to CO2 ratio in the feed increases.
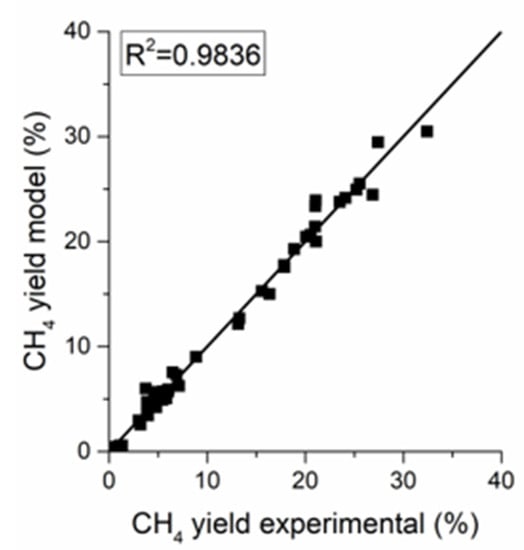
Figure 7.
Parity plot for the power-law kinetic models.

Table 5.
Power-law expressions regression results.
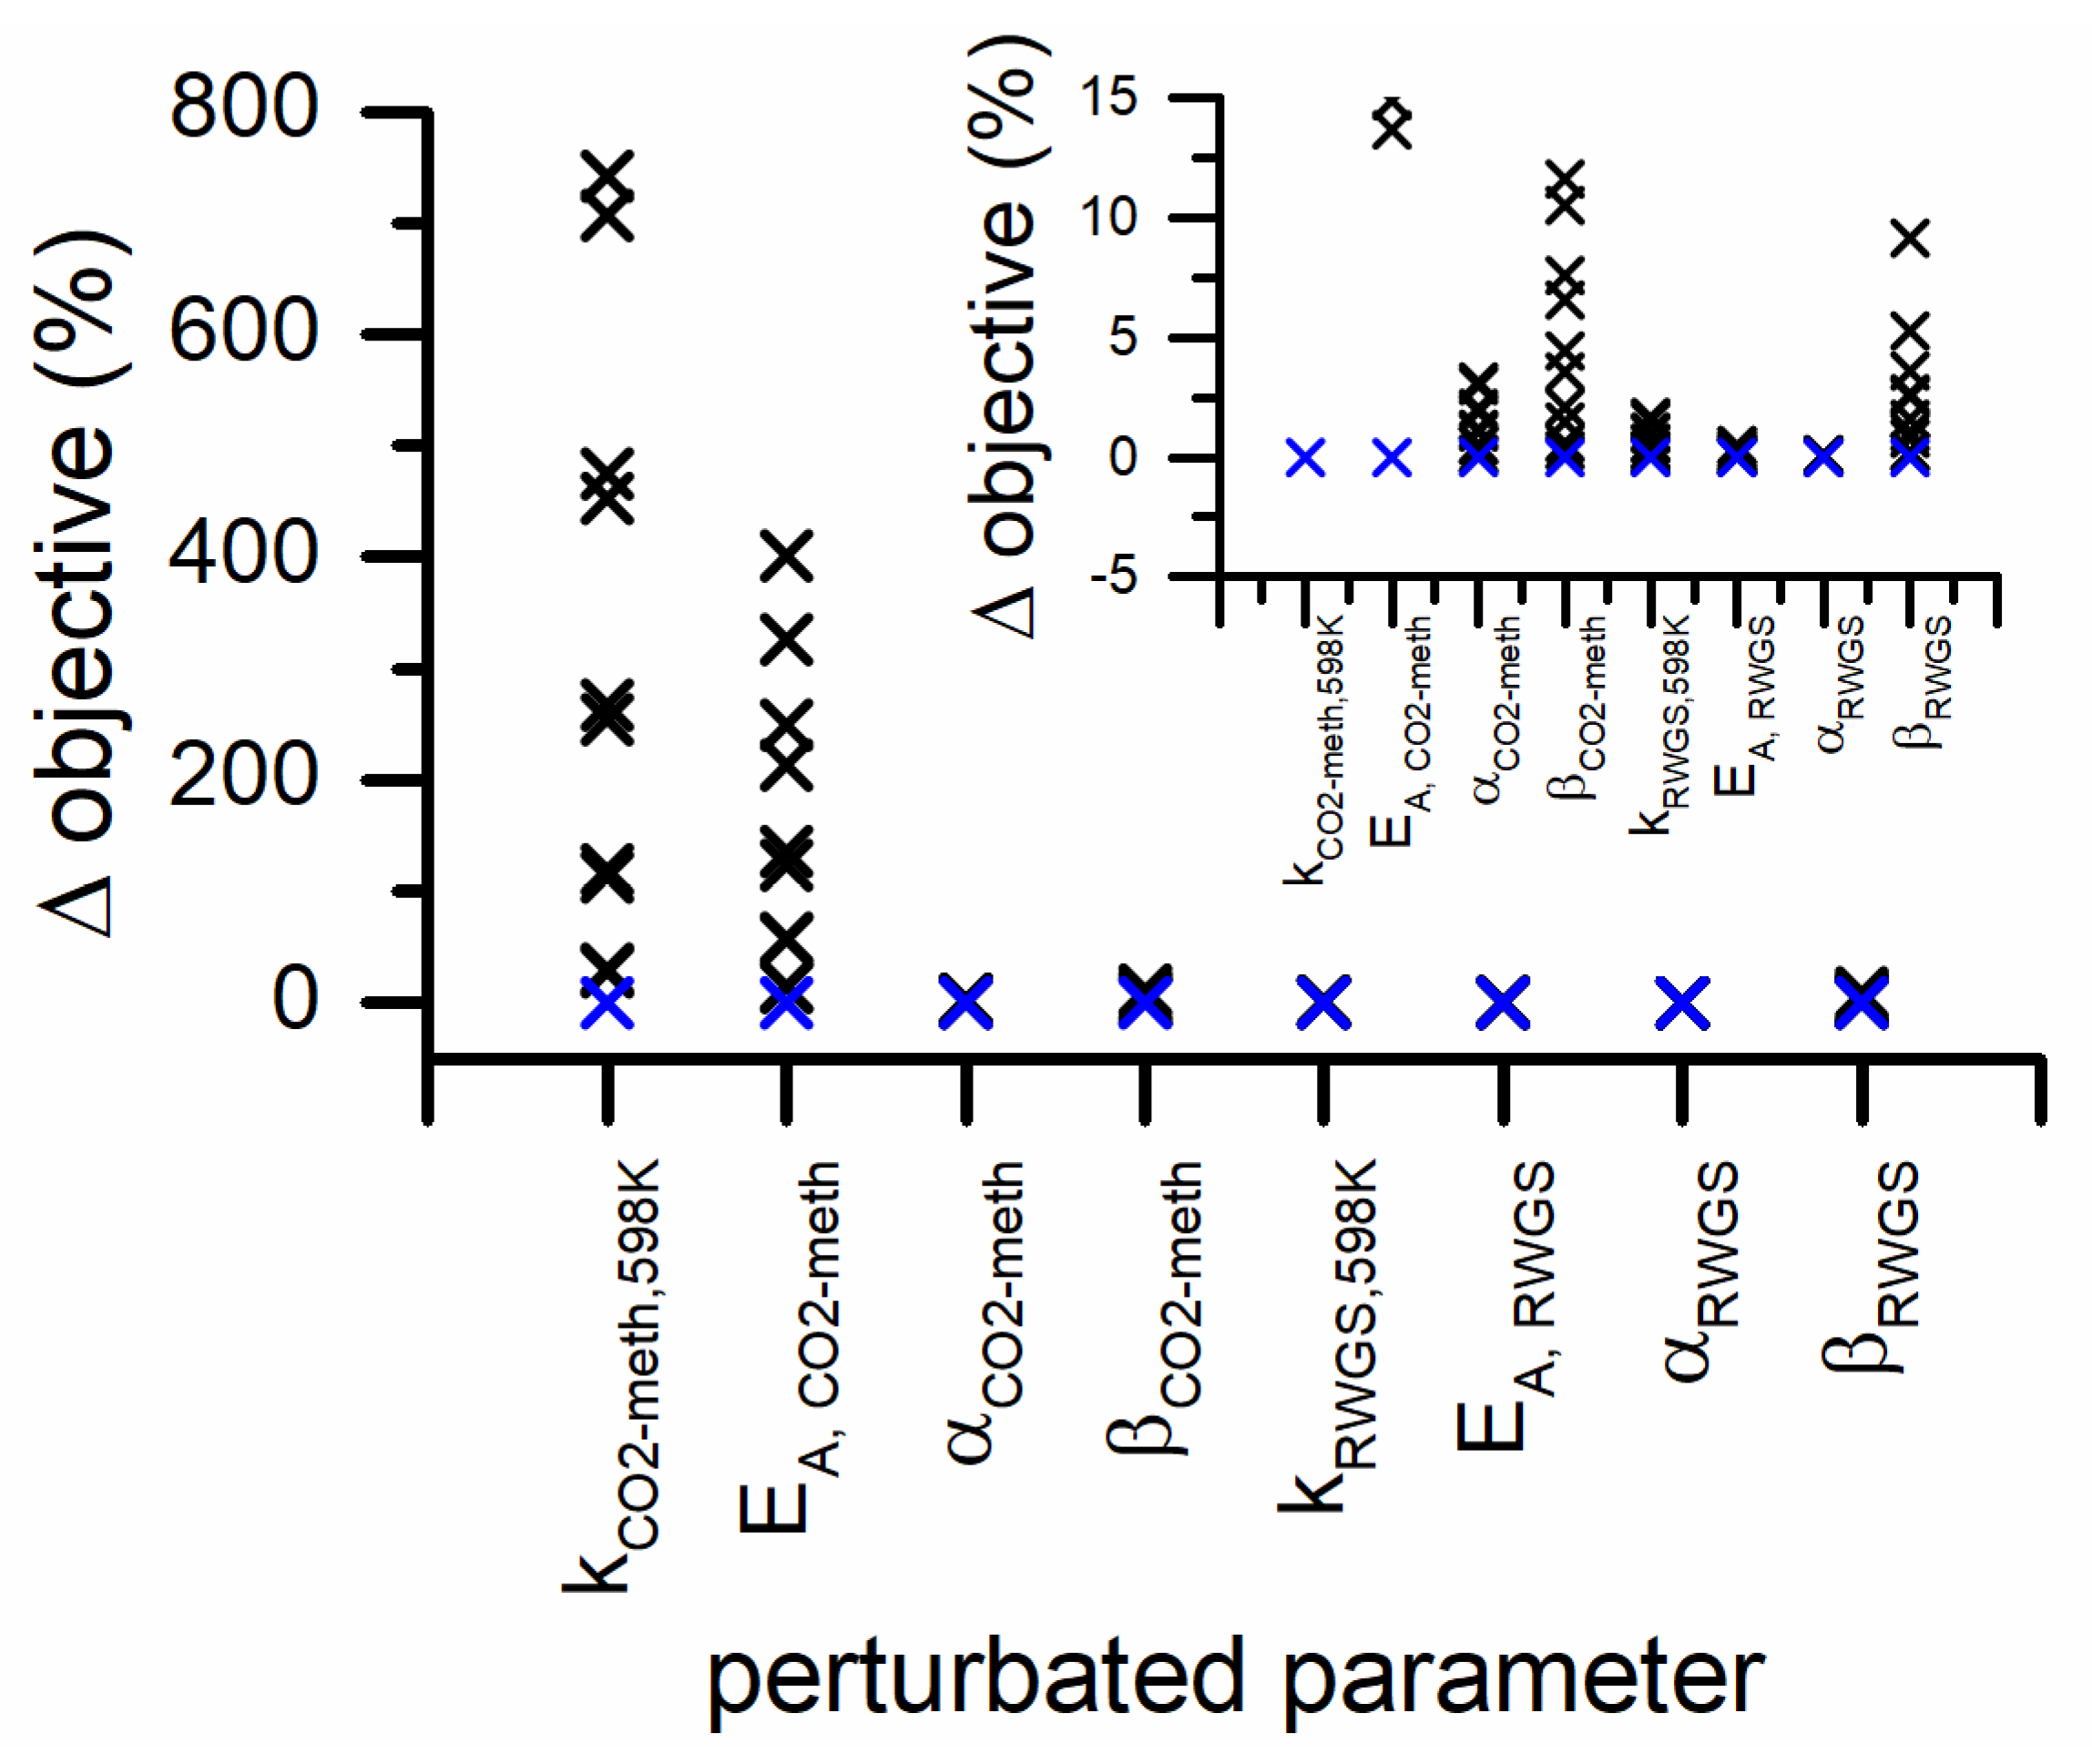
In Figure 8, the sensitivity analysis carried out on the parameters of the power-law model is represented. The objective function is the most sensitive to the preexponential factor and activation energy of CO2 methanation. The variation of the exponents of H2 partial pressure in both reaction rates has a variation of the objective function. While the variations of the exponents of the CO2 partial pressures have the smallest effect on the objective function in both CO2 methanation and RWGS rates.
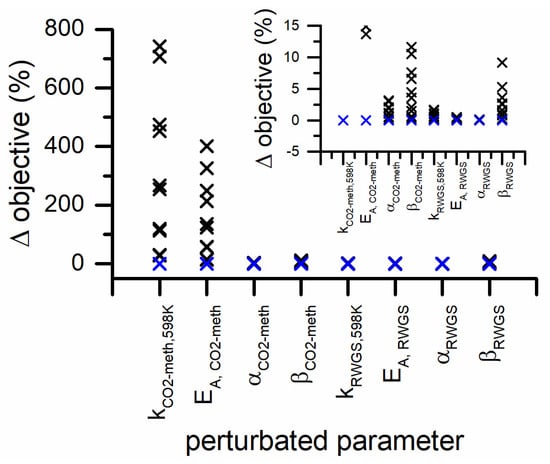
Figure 8.
Parameter sensitivity analysis for PL kinetic model (blue symbols represents the 0% variation and the black symbols represent the 5% variation steps). The inset is a zoom of the y-axis in the 0–15% range.
2.2.2. Langmuir-Hinshelwood-Hougen-Watson (LHHW) Kinetic Model
The LHHW kinetic rate that was chosen for fitting the kinetic data is represented in Equations (7) and (8). These rates were determined assuming the rate-determining step 4.a in the mechanism in (see Materials and Methods section) for the CO2 methanation reaction and step 2.a for the RWGS reaction rate. Adsorbed hydrogen, CO and hydroxyls were considered as the most abundant surface intermediates. This kinetic model was readapted from a previous study with the addition of the RWGS reaction with an LHHW derived equation [26].
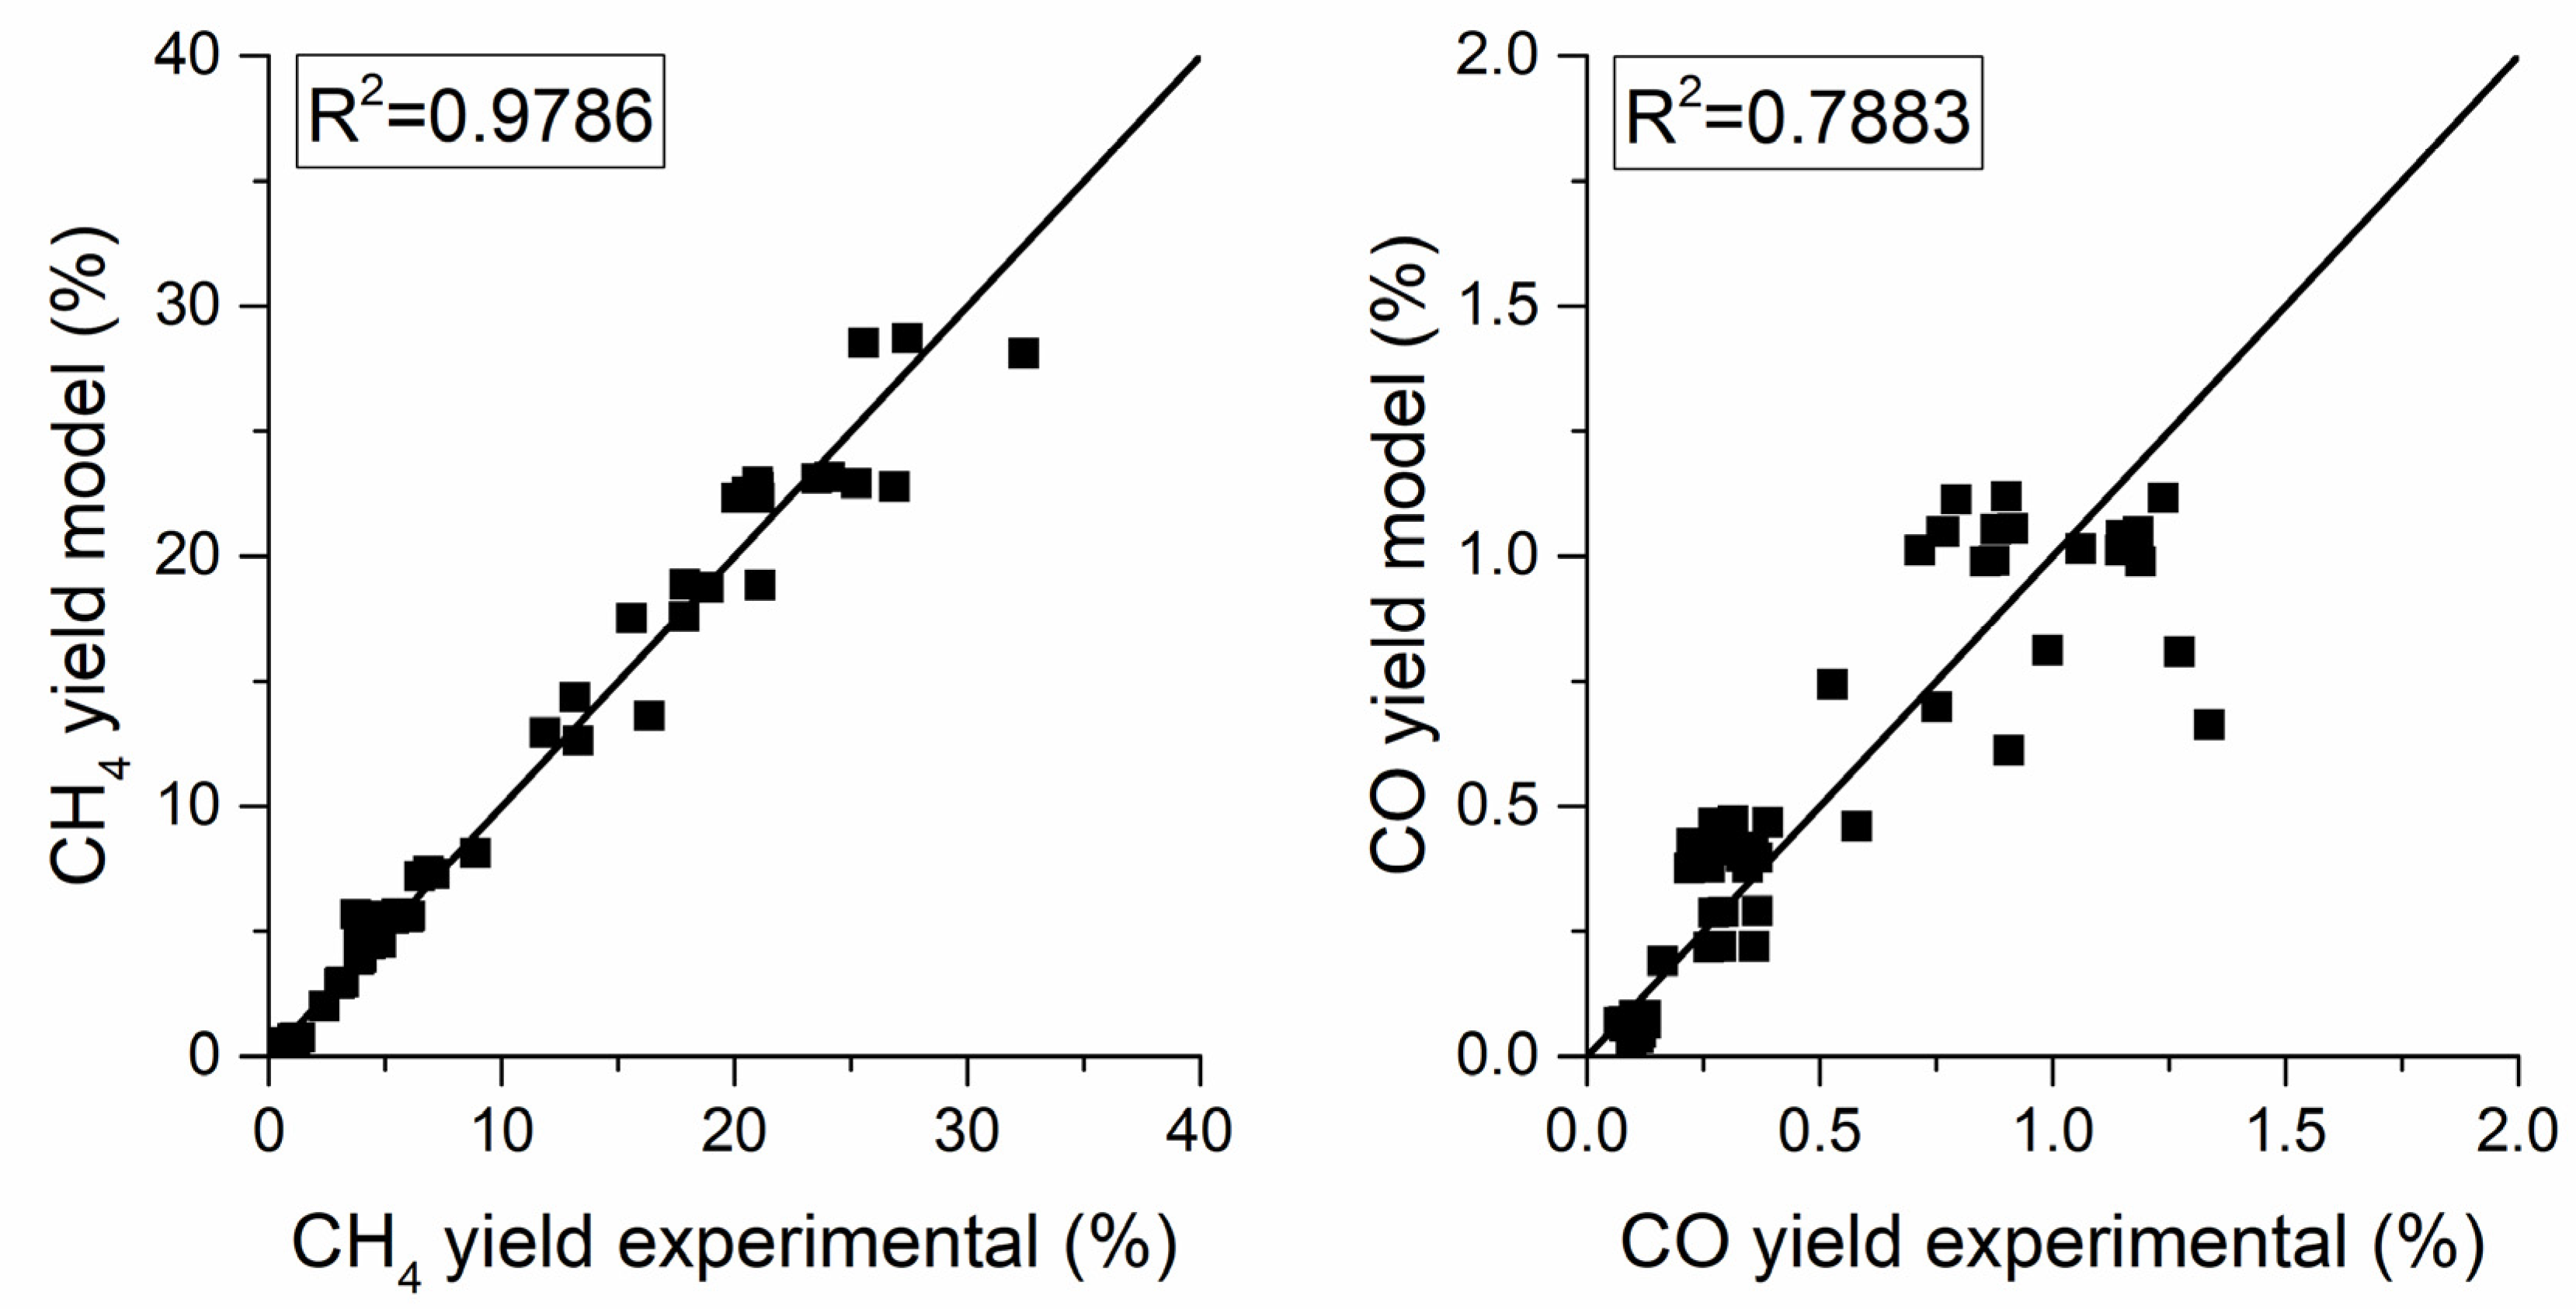
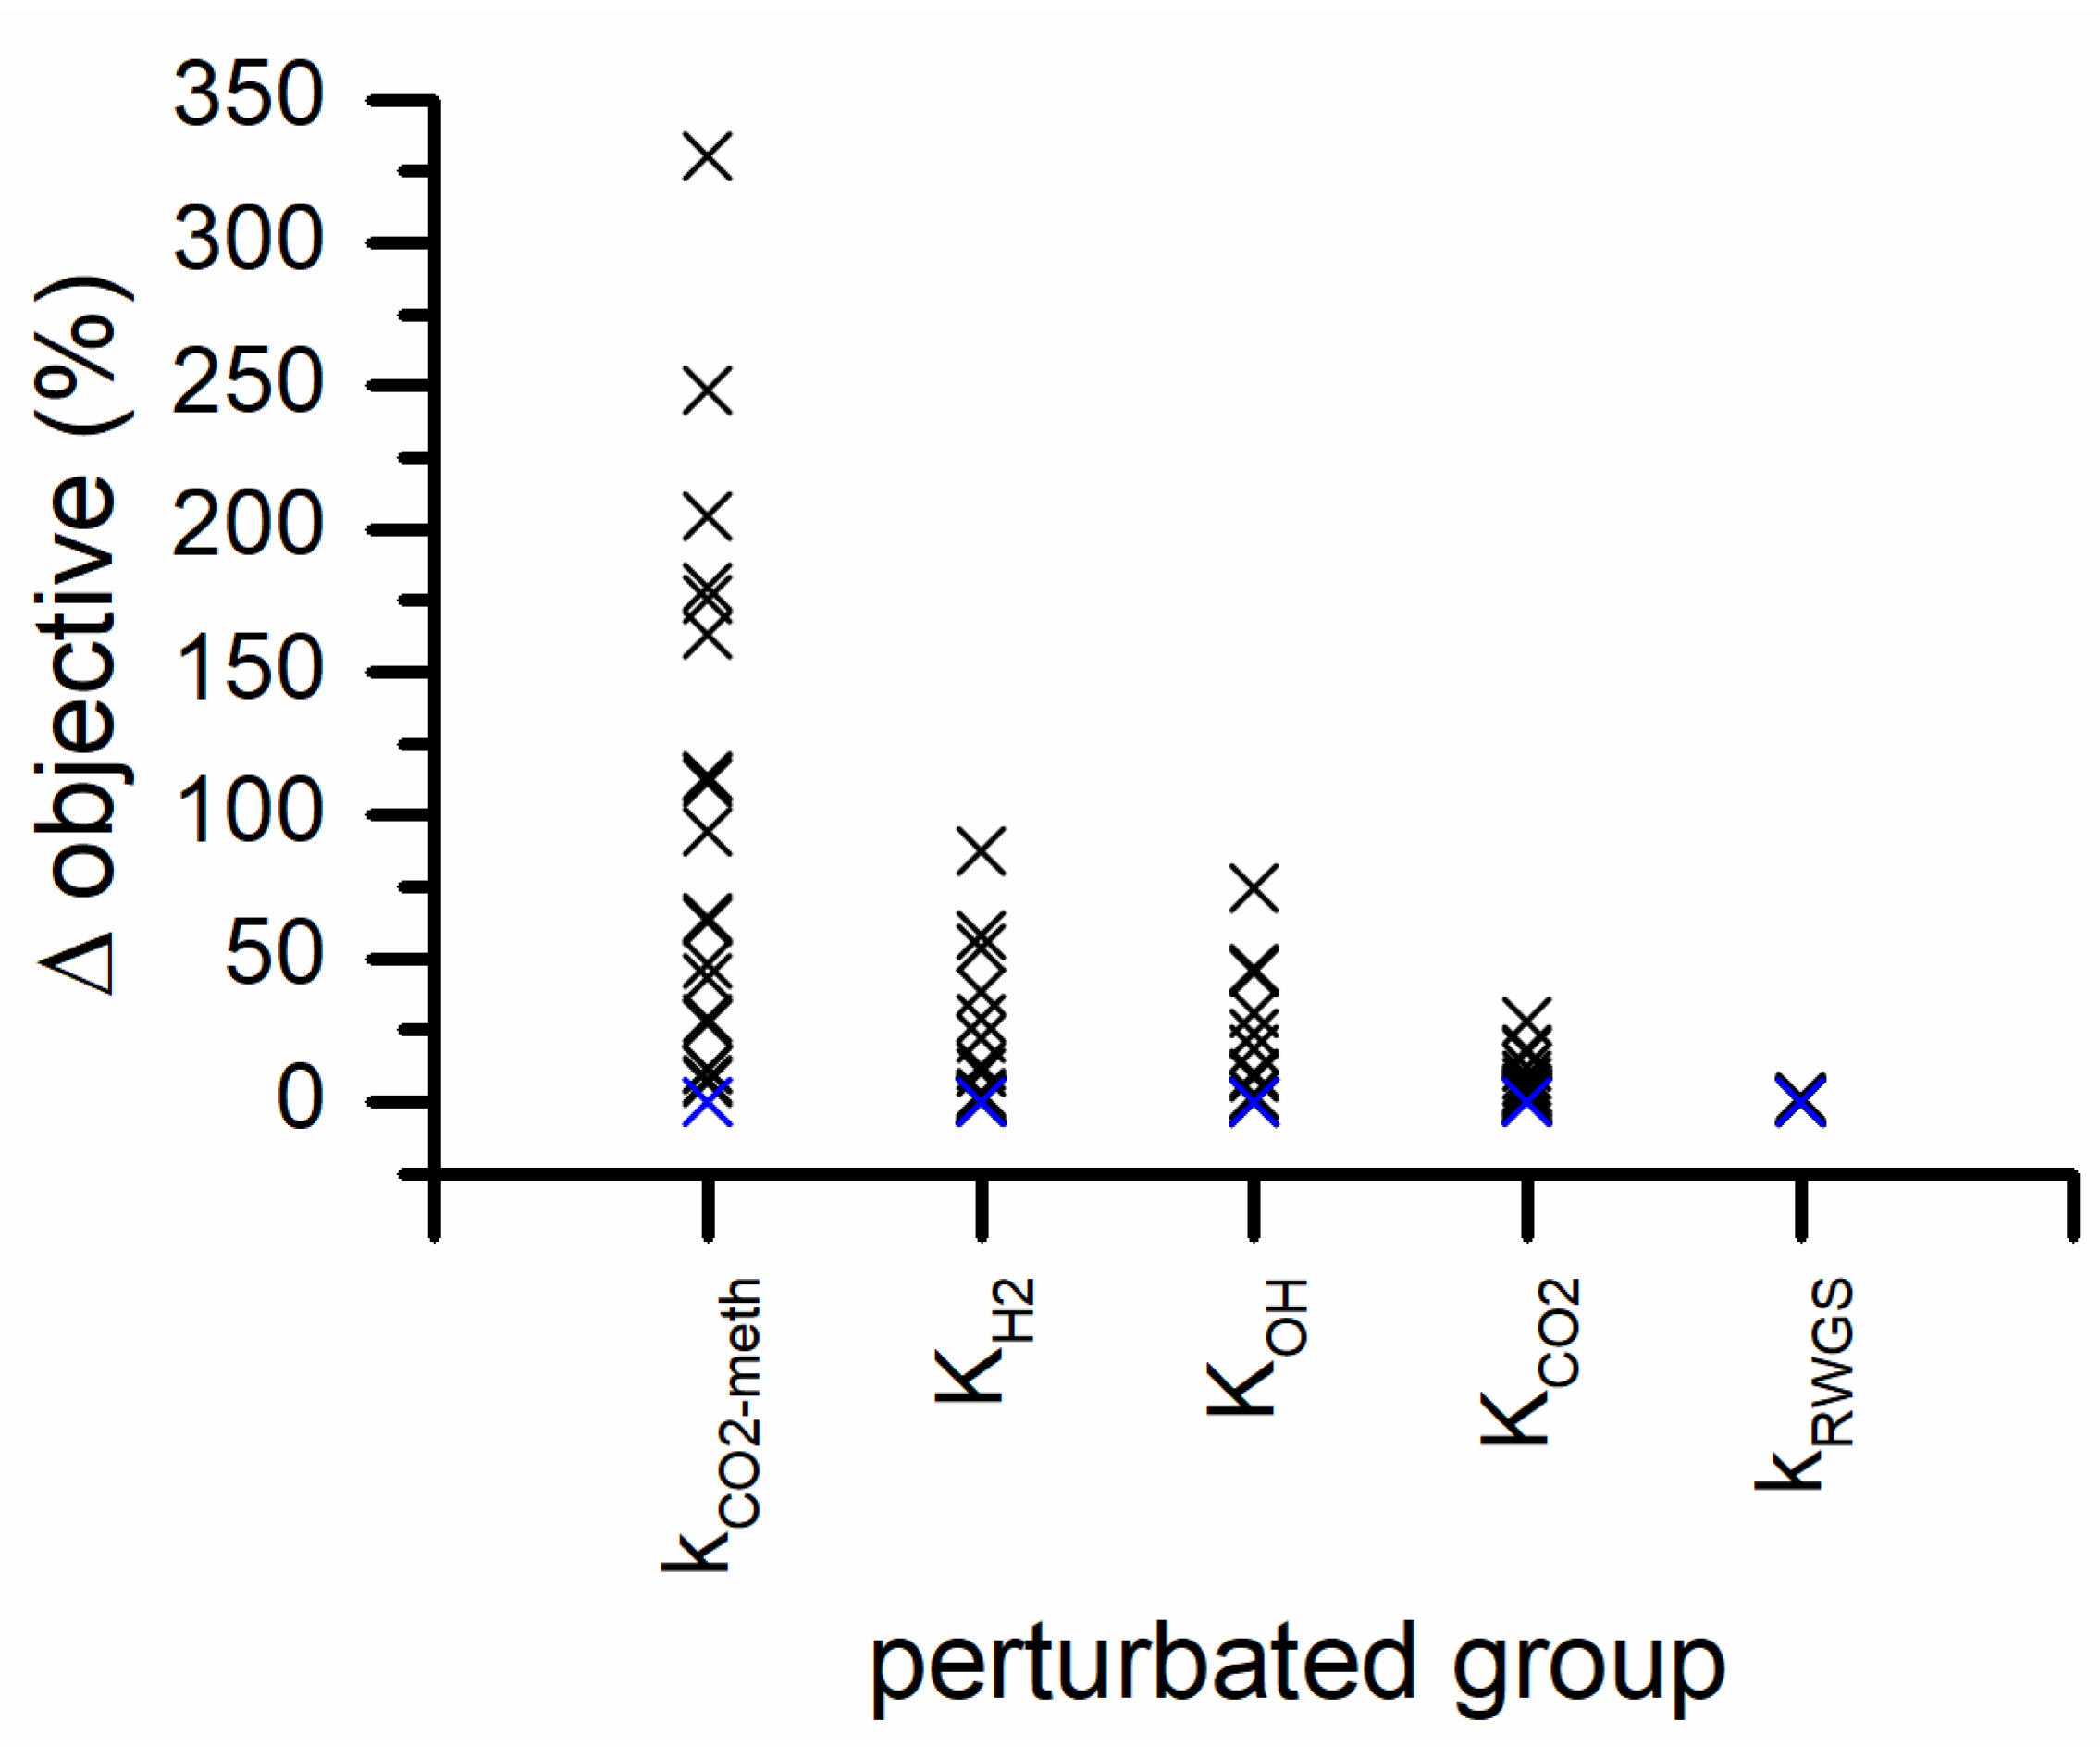
The fitting parameters are reported in Table 6, the parity plot in Figure 9 and the sensitivity analysis is reported in Figure 10.

Table 6.
Langmuir-Hinshelwood-Hougen-Watson (LHHW) kinetic parameters.
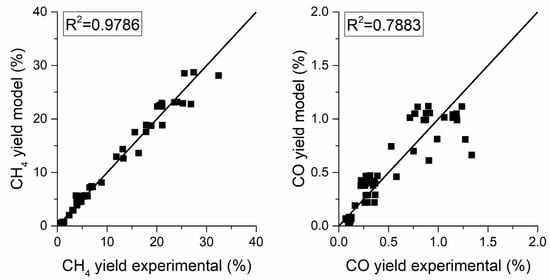
Figure 9.
Parity plot using the LHHW model for the CH4 yield (left) and the CO yield (right).

Figure 10.
Parameter sensitivity analysis (blue symbols represents 0% variation and the black symbols represent the 5% variation steps).
2.3. Catalyst Aging Modeling
In Section 2.1, it was demonstrated that the loss in catalyst activity is proportional to the loss in the BET surface area with a unitary proportionality factor. As a result, it is a reasonable assumption that the ratio of the BET areas in Equation (5) is also equal to the ratio S/S0 of the exposed nickel surface areas. Therefore, it can be assumed that the exponent p in Equation (20) is also unitary and the same function type can be used for the aging rate, as stated in Equation (9):
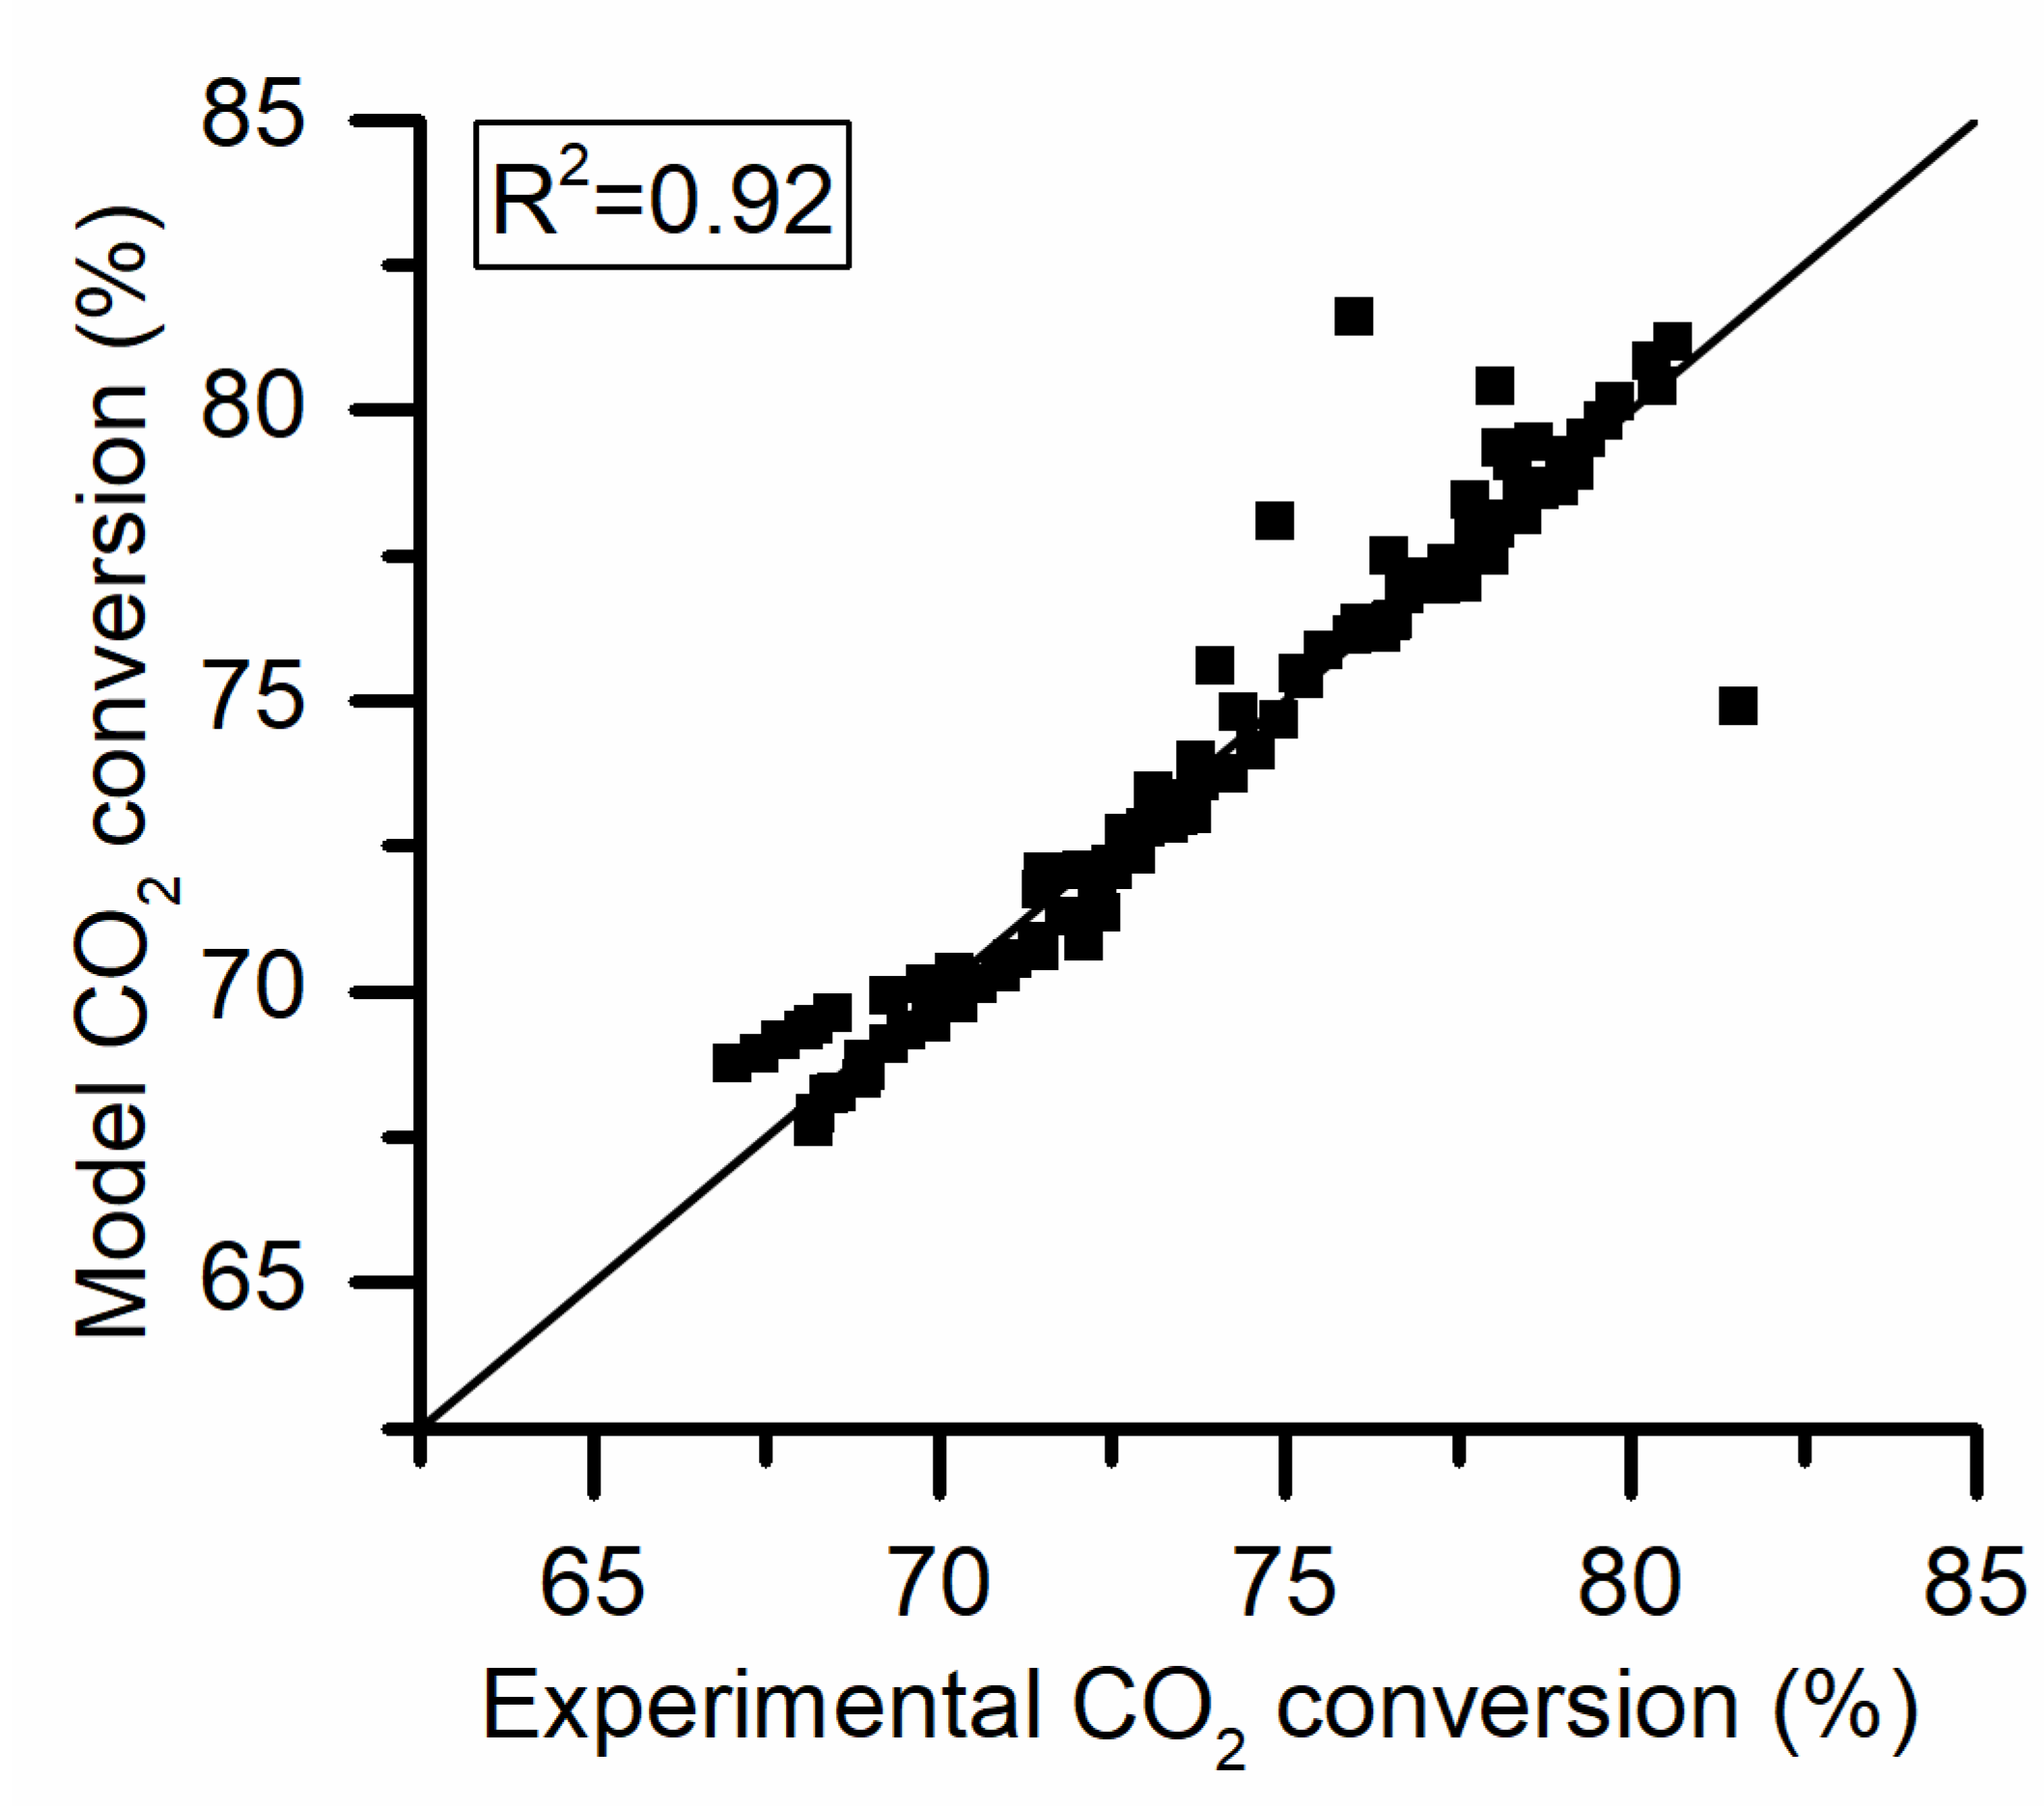
The three parameters that the fitting procedure determines are the preexponential factor (ka,Tref), the activation energy (EA,a) and the exponent m. The catalyst aging rate was calculated using the data from the aging tests carried out at 380 °C, 425 °C, and 500 °C. The only test that was excluded from the dataset was the run with 6% of methane in the feed because it was at equilibrium for half the test. The dataset was reduced by sampling the data with a sampling time step of 5 h. The CO2 conversion and temperature were averaged with ±30 minutes interval around the sampling point. This procedure reduced the number of points to a more manageable amount. In Table 7 the fitting parameters are reported and Figure 11 the corresponding parity plot.

Table 7.
Aging kinetics parameters.

Figure 11.
Parity plot for aging kinetics.
According to the literature, the exponent m can assume values between 3 and 15 for supported Ni catalyst sintering rates [27,28]. This is in line with the value that was found in this study. However, being the deactivation of an empiric law, the fitting parameters do not have any physical meaning. Therefore, any consideration of the values assumed by the parameters can be misleading. The aging law that we have obtained here can be used in a reactor model to give some insight into the possible behavior of the reactor in time. This would allow the designer to put in place different strategies to slow the aging process, and/or by allowing higher flexibility on the operating conditions to limit the aging effect on the process performance (i.e. temperature and pressure). In literature, an example of the behavior of a methanation reactor with catalyst aging has been modeled by Sun et al. [29]. The deactivation in their study is caused by carbon deposition. However, similar results can be expected with the aging law obtained in this work.
3. Materials and Methods
The study was performed in two steps. In the first step, an experimental campaign was carried out in order to determine how the methanation catalyst ages. The experimental conditions were chosen to reflect the operating conditions that the catalyst may encounter in a methanation reactor. After the aging tests, the catalyst samples were characterized by different analytical techniques in order to determine the aging mechanism. In the second step, an experimental campaign was aimed at gathering catalyst activity data necessary for the regression of the intrinsic kinetic model parameters. As a result, an aging kinetic equation was determined thus obtaining a combined kinetic and aging model.
3.1. Experimental
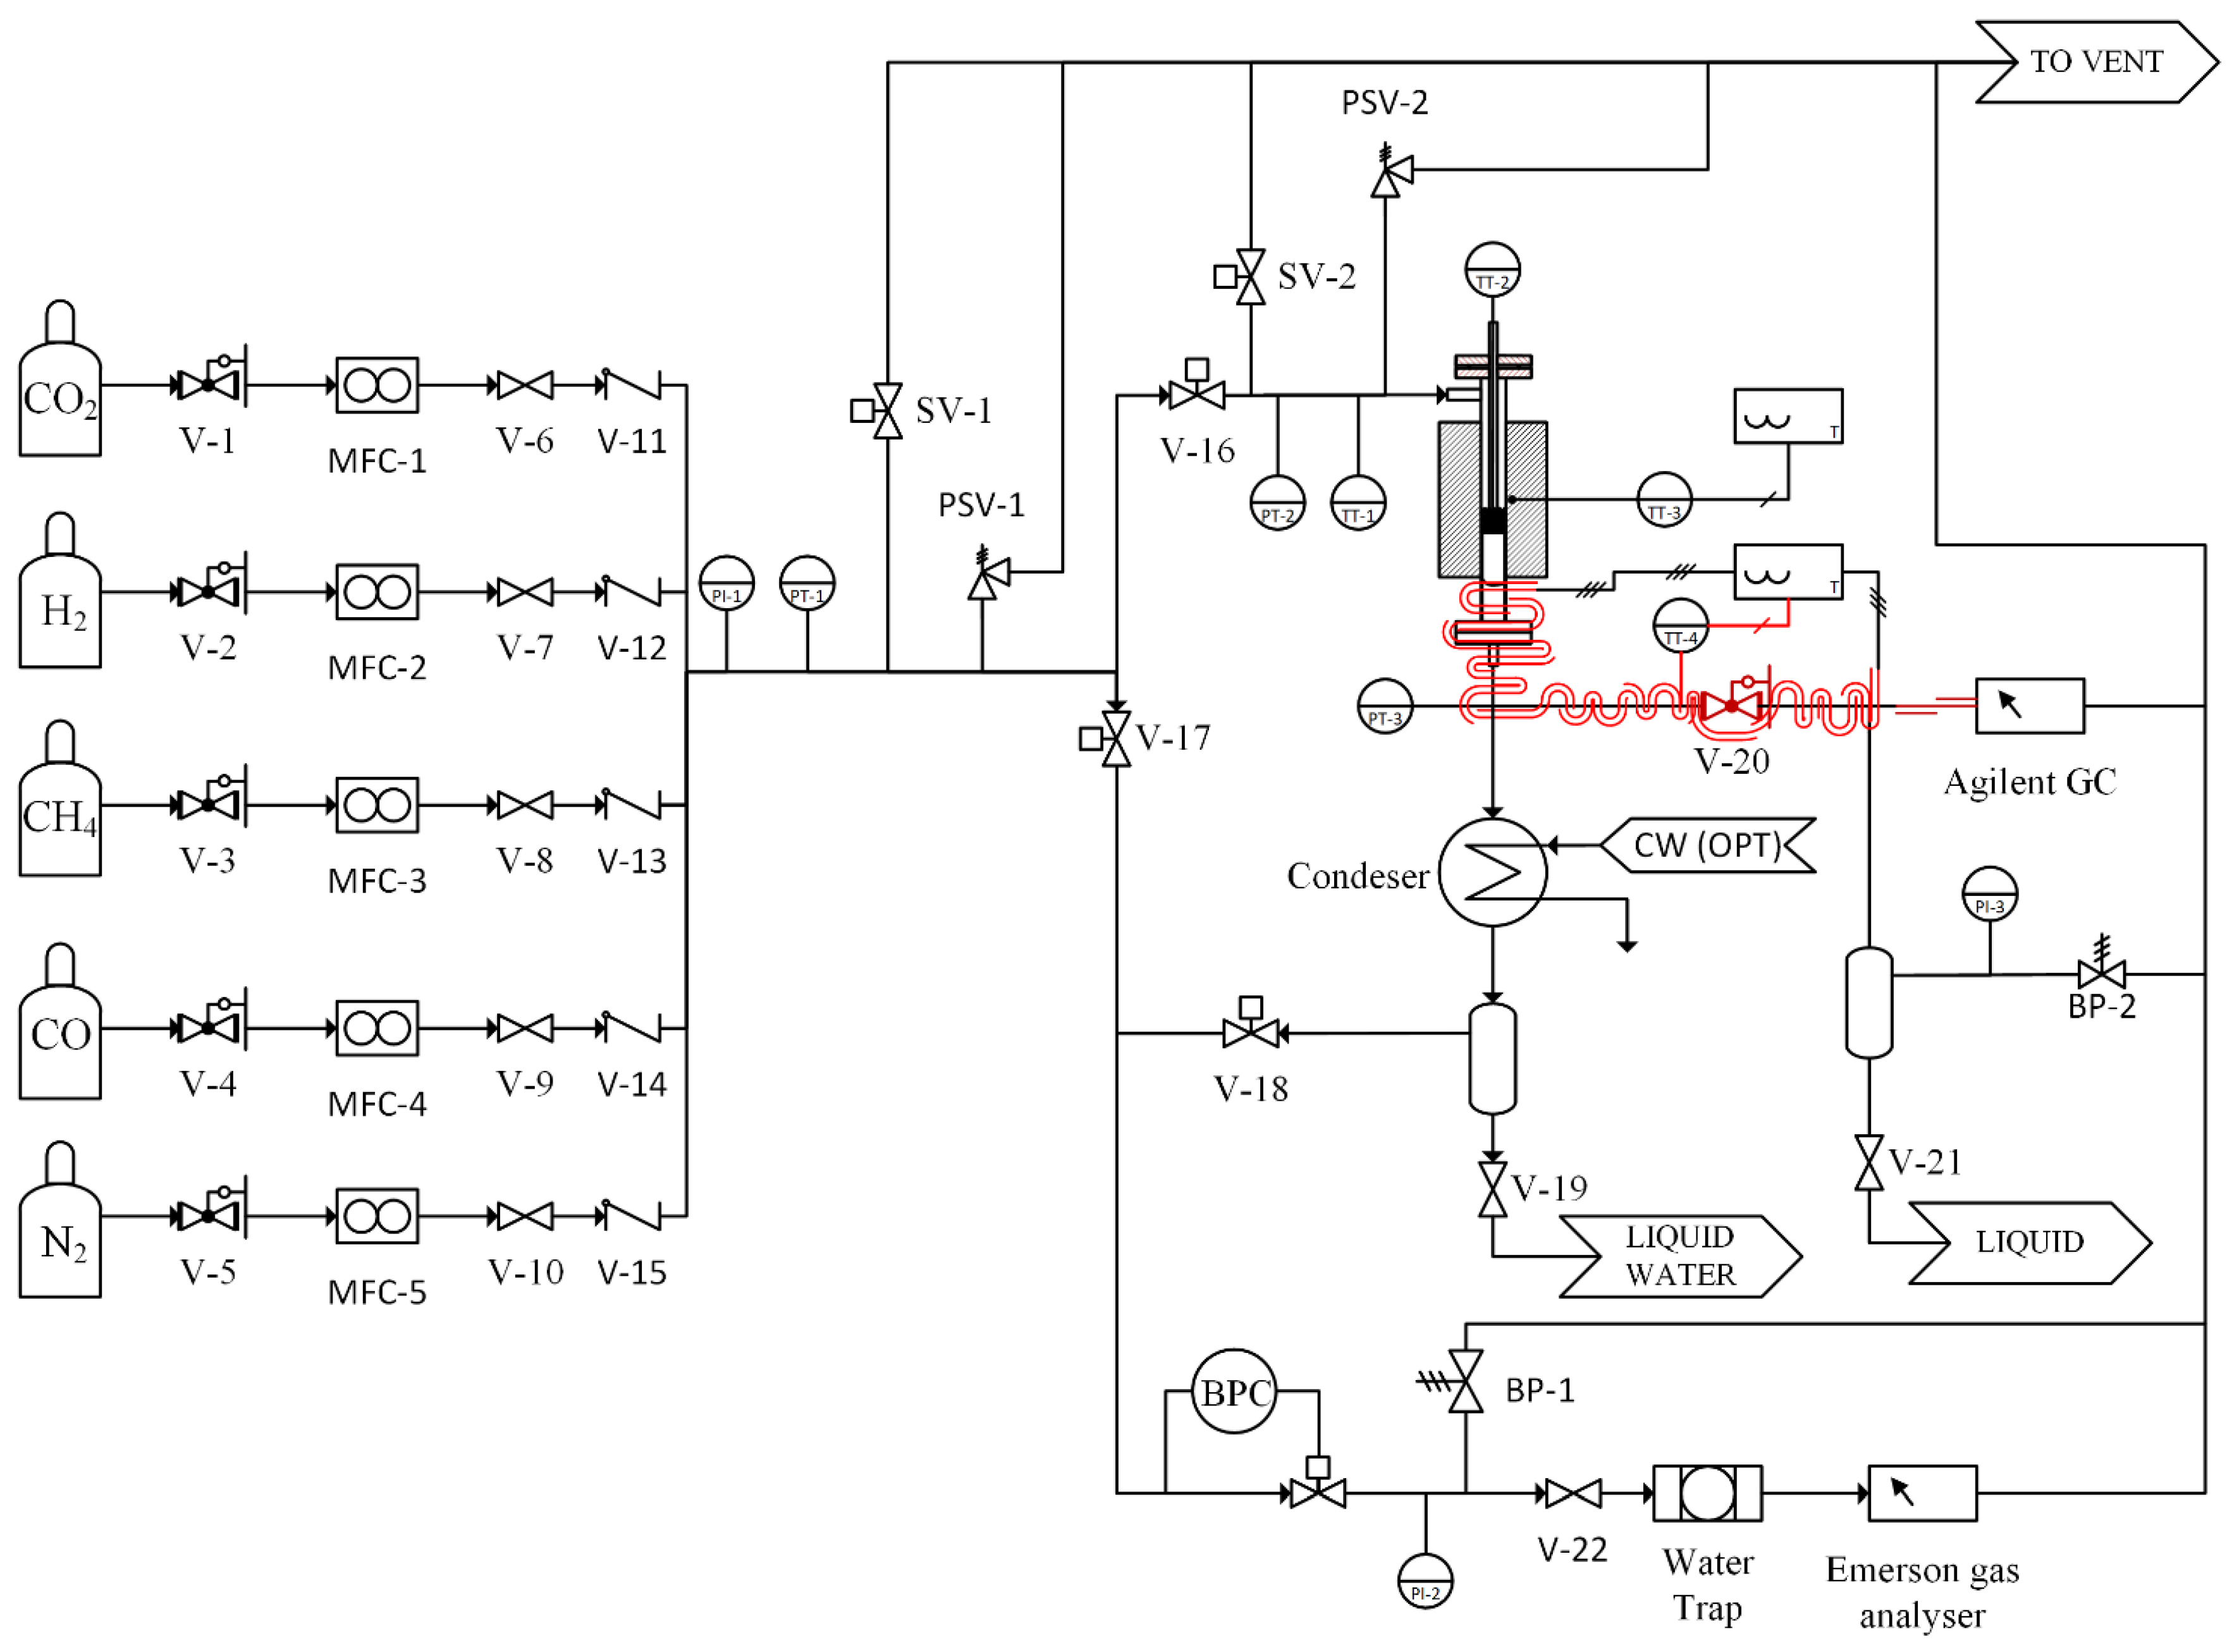
Both catalytic activity and catalyst aging experiments were carried out on a newly designed test unit allowing operations up to 500 °C and 30 bar (Figure 12). All the involved gases come from pure gas cylinders provided by S.I.A.D. SpA (Bergamo, Italy) with the following purities: H2 (4.5), CO2 (4.0), CH4 (4.5) and N2 (6.0). The individual gases are mixed in the correct proportion using for each gas a dedicated mass flow controller. A 4-way valve system allows for the feed mixture to be analyzed before switching it to the reactor. The reactor is made of a stainless-steel tube with an inner diameter of 8 mm. Inside the reactor, a 1/8-inch thermocouple well is placed that allows the reaction temperature to be measured along the axis of the fixed bed by moving the thermocouple. The reactor is heated by an electrical heating jacket controlled using a thermocouple placed on the reactor outer wall. The product gas coming out of the reactor is cooled to room temperature and water is condensed and collected inside a tank. The pressure inside the unit is maintained to the setpoint by a back-pressure controller; moreover, two more pressure transducers are used to monitor the pressure at reactor inlet and outlet. Many different safety valves are placed on the gas lines in order to guarantee safe operation. The gases are analyzed using a multi-channel Emerson X-Stream gas analyzer (Emerson Automation Solutions, Milan, Italy) equipped with non-dispersive infrared (NDIR) sensors for CO, CO2 and CH4 and a thermal conductivity (TCD) detector for H2 measurements. Each measurement channel was calibrated (‘zero’ and ‘span’ calibration) using certified bottled gas mixtures. An optional Agilent 7890B (Agilent Technologies, Santa Clara, CA, USA) gas chromatograph was used to identify possible reaction by-products. The GC is equipped with an HP-PLOT/Q column (30 m length, 530 µm diameter and 40 µm film thickness) and an HP-PLOT Molesieve column (30 m length, 530 µm diameter and 50 µm film thickness) connected in series. A TCD and a flame ionization detector (FID), also connected in series, complete the GC setup.

Figure 12.
Pressurized catalytic testing setup. V-1 to V-5, V-20 pressure reduction valves; MFC-1 to MFC-5 mass flow controllers; V-6 to V-10, V19, V-21, V-22 manual ball valves: V-11 to V-15 check valves; V-16 to V-18, SV-1 and SV-2 actuated ball valves; PSV-1 and PSV-2 pressure safety valves; BP-1 and BP-2 manul back pressure control valve; BPC back pressure controller.
The tests were performed on a commercial Ni/Al2O3 based catalyst with a nickel loading that ranges between 14–17 wt. %. The proprieties of the catalyst are summarized in Table 8 [30,31].

Table 8.
Catalyst proprieties.
The catalyst is pre-reduced by the manufacturer for a quicker reaction start-up and to allow a lower activation temperature procedure. Before the tests, the catalyst samples were activated in situ at 260 °C for 5 h with a 30% H2 in N2 gas flow. The aging tests were performed on 200 mg unaltered catalyst samples in order to have the closest representation of the behavior of the catalyst inside the real reactor. Two feed compositions were tested during the aging experiments: in the first case (Test 1), a CO2/H2/N2 = 16/64/20 gas mixture is fed to the reactor; while, in the second case (Test 2), a 59.2% H2, 14.8% CO2, 6% of methane and 20% N2 was used. These two compositions were identified through the process modeling of a methanation line with gas separation and recycling, within the concept of the above mentioned Store&GO plant, whose process simulations and results are reported in [9]. The test matrix is summarized in Table 9. Both temperature and product gas composition were logged during the whole test length at regular time intervals.

Table 9.
Aging test matrix.
Three catalyst characterization techniques were used in order to determine the cause of catalyst aging. The first technique involved the measurement of specific surface area, pore volume and mean pore diameter using N2 adsorption isotherms. The measurements were carried out using a TriStar II 3020 from Micromeritics (Norcross, GA, USA). Prior to the measurements, the samples were degassed at 200 °C under nitrogen flow for two hours. The specific surface area was determined by fitting the Brunauer-Emmett-Teller (BET) equation to the N2 adsorption isotherms [32]. The regression was performed for values of relative pressure (p/p0) between 0.05 and 0.35. The pore size distribution was determined using the Barrett-Joyner-Halenda (BJH) method [33].
The second technique was an X-ray diffraction analysis using Cu Kα radiation (X’Pert Philips PW3040 diffractometer (Almelo, Netherlands), 2θ range = 10–90°, step size = 0.013°, counting time at 0.2 s/step). Prior to the analysis, the samples had to be crushed in order to obtain a powder. The XRD patterns were compared with reference patterns from the Powder Diffraction Files by the International Centre of Diffraction Data (ICDD) database. Carbon deposition is thermodynamically unfavoured in the testing conditions [9,34]. However, absorbed carbon species could form as reaction intermediates. This could lead to carbon deposition caused by a difference in generation and consumption rates. Therefore, temperature-programmed oxidation (TPO) was performed on 100 mg of aged catalyst samples. The catalyst samples were placed in a U tube quartz reactor and degassed from adsorbed CO2 at 400 °C for 30 minutes under nitrogen flow (see Appendix for CO2-TPD). Afterward, the samples were cooled down to ambient temperature. The combustion was performed by feeding the reactor with 200 ml/min of gas containing 2% of O2 in nitrogen and with a heating rate of 10°C/min ramp up to 800 °C. The outlet gas composition was monitored with the same Emerson X-Stream 5 channel gas analyzer. The TPO procedure is also presented in the supporting information (Figure S-5).
The activity tests used for the intrinsic kinetic model parameter regression were performed on 75 mg catalyst samples. In order to further reduce the risk of being in a diffusional controlled regime, instead of kinetic controlled one, the catalyst sample was crushed and sieved to obtain a granulometry between 106 and 212 μm. For fluid dynamic reasons, the catalyst was diluted in a 1 to 5 ratio with silicon carbide. Prior to the kinetic measurements, the catalyst was stabilized over one night by keeping it on stream at the maximum operating temperature of the kinetic tests. The test matrix is summarized in Table 10.

Table 10.
Kinetic test matrix.
3.2. Kinetic Modelling
Different kinetic expressions were fitted to the experimental data. Since the amount of CO measured during the experimental campaign is not negligible, the kinetic model must account for its formation. The same approach was used for the derivation of the kinetic model is found in the literature [19,26,35].
3.2.1. Power-Law Model
A system of two power-laws describing the CO2 methanation and reverse water gas shift reported in Equation (10) and Equation (11), respectively, was the starting point of the kinetic study.
The kinetic constants are expressed as Arrhenius type:
In order to reduce the correlation between the preexponential factor and the activation energy during the fitting procedure, Equation (12) was reparametrized as stated in Equation (13):
The equilibrium constants were evaluated using thermodynamic data from the NIST Chemistry WebBook [36]. The constants are evaluated using Equation (14).
The number of parameters that must be estimated for each power law equation is four: the preexponential factor and the activation energy in the Arrhenius term and the two orders of reaction for CO2 and H2.
3.2.2. Langmuir-Hinshelwood-Hougen-Watson (LHHW) Models
The LHHW models were derived from the two mechanisms proposed in the literature and summarized in Table 11. Both mechanisms have in common many elementary steps, but the conversion of CO is different. On the one hand, in the mechanism a, the adsorbed CO species are hydrogenated in step 4.a to form carbon-hydroxyl COH or formyl HCO intermediates. Afterward, the oxygen gets removed from these intermediates in step 5.a and further hydrogenated to methane in step 6.a. On the other hand, in mechanism b the adsorbed CO is converted in adsorbed carbon in step 4.b and further hydrogenated to methane. Both these mechanisms were successfully used to formulate rate equations that described the CO2 methanation [19,26,35].

Table 11.
Reaction mechanism proposed in the literature.
The general form of LHHW rate equations have the form reported in Equation (15):
where k is the kinetic term and depends on the rate-determining step, DF is the driving force and represents the distance from the thermodynamic equilibrium, AD is the adsorption group that depends on the most abundant surface intermediates and the exponent n is an integer. The rate equations were derived using the same approach found in [37].
3.3. Computational Method
An ideal plug flow reactor model was used to integrate the kinetic model. The mass balance is represented through the system of differential equations, as summarized in Equation (16).
where is the mole flow rate of species i, m is the mass of catalyst, νi is the stoichiometric coefficient of the component in reaction j, and Rj is the reaction of the key component j. By solving the mass balance, the methane and carbon monoxide yields can be calculated using Equation (17) and Equation (18).
The regression was performed by minimizing the sum of squared residuals of the methane and CO yields represented in Equation (19).
The parameter estimation procedure was carried out using MATLAB with the Statistics and Machine Learning Toolbox™. The procedure involved firstly the use of the genetic algorithm for an initial estimation of the model parameters and successively the use of the nonlinear fitting routines for the final minimization.
Local sensitivity analysis was performed in order to evaluate the behavior of the objective function near the determined minima and to investigate the sensitivity of the model to the single parameters. The sensitivity analysis was evaluated by perturbating one parameter at a time in a ± 25% range from the optimum value. For every perturbation of the parameter values, the objective function was re-evaluated.
3.4. Aging Modelling
The normalized activity (a) is defined as the ratio between the reaction rate at time t (r) and the initial reaction rate (r0) [28,38]. The loss of activity during a sintering process can be correlated with the loss of normalized surface area or dispersion of the active phase with a proportionality, as reported in Equation (20) [28].
where S is the surface area of the active phase at time t, S0 is the initial surface area, D is the dispersion at time t, D0 is the initial dispersion and p is a real positive exponent. The sintering rate can be expressed using a power-law expression (21).
where is the sintering kinetic constant that can be expressed using an Arrhenius like term with a preexponential factor and an activation energy (13).
4. Conclusions
The aging evolution of a nickel-based catalyst for CO2 methanation was investigated at different temperatures and two in feed compositions during 100 h long tests. At low temperature, no activity loss was observed, while at a higher temperature the performance of the catalyst degraded up to a 7% drop in methane yield for the 500 °C test. The aging effect was attributed to a decrease in total surface area of the aged samples and consequently of the exposed active nickel surface. Furthermore, for one of the aged samples a direct correlation was found between the ratio of the preexponential factors of the fresh and aged sample and the ratio of the BET surface of the aged and fresh sample.
The reaction rates of CO2 methanation and RWGS were determined for the fresh catalyst (being careful to limit the deactivation during kinetic measurements). An LHHW kinetic model was used to fit the activity data and the parameters were estimated. Finally, power-law aging kinetics was determined for the catalyst. This gives a complete description of the catalyst behavior both in terms of operating conditions and time on stream. The complete kinetic model can be used to simulate the behavior and performance of this catalyst in an industrial reactor.
Supplementary Materials
The following are available online at https://www.mdpi.com/2073-4344/10/3/283/s1, Figure S1: Nitrogen adsorption isotherms for the (a) fresh sample, (b) fresh reduced, (c) aged @270 °C, (d) aged @ 380 °C, (e) aged @ 425 °C and (f) aged @ 500 °C; Figure S2: BJH desorption pore-size distribution curves for the (a) fresh sample, (b) fresh reduced, (c) aged @ 270 °C, (d) aged @ 380 °C, (e) aged @ 425 °C and (f) aged @ 500 °C; Figure S3: H2-TPR with peak deconvolution; Figure S4: CO2 evolution during TPD analysis; Figure S5: CO2 evolution during TPD analysis.
Author Contributions
Conceptualization, R.P. and S.B.; investigation, E.A.M. and F.S.; writing—original draft preparation, E.A.M.; supervision, R.P. and S.B.; project administration, S.B. All authors have read and agreed to the published version of the manuscript.
Funding
This research has received funding from the European Union’s Horizon 2020 research and innovation program under grant agreement 691797—Store and GO (Innovative large-scale energy STORagE Technologies & Power-to-Gas concepts after Optimization) project (http://storeandgo.info/).
Conflicts of Interest
The authors declare no conflict of interest.
References
- European Commission 2030 Climate & Energy Framework. Available online: https://ec.europa.eu/clima/policies/strategies/2030_en (accessed on 12 December 2019).
- Internation Energy Agency. World Energy Outlook 2016; Internation Energy Agency: Paris, France, 2016. [Google Scholar]
- Salomone, F.; Giglio, E.; Ferrero, D.; Santarelli, M.; Pirone, R.; Bensaid, S. Techno-economic modelling of a Power-to-Gas system based on SOEC electrolysis and CO2 methanation in a RES-based electric grid. Chem. Eng. J. 2019, 377, 120233. [Google Scholar] [CrossRef]
- Melaina, M.W.; Antonia, O.; Penev, M. Blending Hydrogen into Natural Gas Pipeline Networks. A Review of Key Issues; National Renewable Energy Laboratory: Golden, CO, USA, 2013. [Google Scholar]
- Briottet, L.; Moro, I.; Lemoine, P. Quantifying the hydrogen embrittlement of pipeline steels for safety considerations. Int. J. Hydrog. Energy 2012, 37, 17616–17623. [Google Scholar] [CrossRef]
- Meng, B.; Gu, C.; Zhang, L.; Zhou, C.; Li, X.; Zhao, Y.; Zheng, J.; Chen, X.; Han, Y. Hydrogen effects on X80 pipeline steel in high-pressure natural gas/hydrogen mixtures. Int. J. Hydrog. Energy 2017, 42, 7404–7412. [Google Scholar] [CrossRef]
- Bailera, M.; Lisbona, P.; Romeo, L.M.; Espatolero, S. Power to Gas projects review: Lab, pilot and demo plants for storing renewable energy and CO2. Renew. Sustain. Energy Rev. 2017, 69, 292–312. [Google Scholar] [CrossRef]
- Store&GO Consortium Store&GO. Available online: http://www.storeandgo.info/ (accessed on 31 March 2017).
- Morosanu, E.A.; Saldivia, A.; Antonini, M.; Bensaid, S. Process Modeling of an Innovative Power to LNG Demonstration Plant. Energy Fuels 2018, 32, 8868–8879. [Google Scholar] [CrossRef]
- Frontera, P.; Macario, A.; Ferraro, M.; Antonucci, P. Supported Catalysts for CO2 Methanation: A Review. Catalysts 2017, 7, 59. [Google Scholar] [CrossRef]
- Gao, J.; Liu, Q.; Gu, F.; Liu, B.; Zhong, Z.; Su, F. Recent advances in methanation catalysts for the production of synthetic natural gas. RSC Adv. 2015, 5, 22759–22776. [Google Scholar] [CrossRef]
- Martinez Molina, M.; Kern, C.; Jess, A. Catalytic Hydrogenation of Carbon Dioxide to Methane in Wall-Cooled Fixed-Bed Reactors ‡. Chem. Eng. Technol. 2016, 39, 2404–2415. [Google Scholar] [CrossRef]
- Bartholomew, C.H.; Pannell, R.B.; Fowler, R.W. Sintering of alumina-supported nickel and nickel bimetallic methanation catalysts in H2 H2O atmospheres. J. Catal. 1983, 79, 34–46. [Google Scholar] [CrossRef]
- Bartholomew, C.H.; Sorensen, W.L. Sintering kinetics of silica- and alumina-supported nickel in hydrogen atmosphere. J. Catal. 1983, 81, 131–141. [Google Scholar] [CrossRef]
- Sehested, J.; Carlsson, A.; Janssens, T.V.W.; Hansen, P.L.; Datyey, A.K. Sintering of nickel steam-reforming catalysts on MgAl2O4spinel supports. J. Catal. 2001, 197, 200–209. [Google Scholar] [CrossRef]
- Sehested, J. Sintering of nickel steam-reforming catalysts. J. Catal. 2003, 217, 417–426. [Google Scholar] [CrossRef]
- Rostrup-Nielsen, J.R.; Pedersen, K.; Sehested, J. High temperature methanationSintering and structure sensitivity. Appl. Catal. A Gen. 2007, 330, 134–138. [Google Scholar] [CrossRef]
- Abelló, S.; Berrueco, C.; Montané, D. High-loaded nickel-alumina catalyst for direct CO2 hydrogenation into synthetic natural gas (SNG). Fuel 2013, 113, 598–609. [Google Scholar] [CrossRef]
- Koschany, F.; Schlereth, D.; Hinrichsen, O. On the kinetics of the methanation of carbon dioxide on coprecipitated NiAl(O)x. Appl. Catal. B Environ. 2016, 181, 504–516. [Google Scholar] [CrossRef]
- Ewald, S.; Kolbeck, M.; Kratky, T.; Wolf, M.; Hinrichsen, O. On the deactivation of Ni-Al catalysts in CO2 methanation. Appl. Catal. A Gen. 2019, 570, 376–386. [Google Scholar] [CrossRef]
- Mutz, B.; Gänzler, A.; Nachtegaal, M.; Müller, O.; Frahm, R.; Kleist, W.; Grunwaldt, J.-D. Surface Oxidation of Supported Ni Particles and Its Impact on the Catalytic Performance during Dynamically Operated Methanation of CO2. Catalysts 2017, 7, 279. [Google Scholar] [CrossRef]
- Sing, K.S.W. Reporting physisorption data for gas/solid systems with special reference to the determination of surface area and porosity (Recommendations 1984). Pure Appl. Chem. 1985, 57, 603–619. [Google Scholar] [CrossRef]
- Rahbar Shamskar, F.; Rezaei, M.; Meshkani, F. The influence of Ni loading on the activity and coke formation of ultrasound-assisted co-precipitated Ni–Al2O3nanocatalyst in dry reforming of methane. Int. J. Hydrog. Energy 2017, 42, 4155–4164. [Google Scholar] [CrossRef]
- Jiang, Z.; Liao, X.; Zhao, Y. Comparative study of the dry reforming of methane on fluidised aerogel and xerogel Ni/Al2O3 catalysts. Appl. Petrochem. Res. 2013, 3, 91–99. [Google Scholar] [CrossRef]
- San-José-Alonso, D.; Juan-Juan, J.; Illán-Gómez, M.J.; Román-Martínez, M.C. Ni, Co and bimetallic Ni-Co catalysts for the dry reforming of methane. Appl. Catal. A Gen. 2009, 371, 54–59. [Google Scholar] [CrossRef]
- Marocco, P.; Morosanu, E.A.; Giglio, E.; Ferrero, D.; Mebrahtu, C.; Lanzini, A.; Abate, S.; Bensaid, S.; Perathoner, S.; Santarelli, M.; et al. CO2 methanation over Ni/Al hydrotalcite-derived catalyst: Experimental characterization and kinetic study. Fuel 2018, 225, 230–242. [Google Scholar] [CrossRef]
- Wanke, S.E.; Flynn, P.C. The Sintering of Supported Metal Catalysts. Catal. Rev. 1975, 12, 93–135. [Google Scholar] [CrossRef]
- Bartholomew, C.H. Sintering kinetics of supported metals: New perspectives from a unifying GPLE treatment. Appl. Catal. A Gen. 1993, 107, 1–57. [Google Scholar] [CrossRef]
- Sun, D.; Khan, F.M.; Simakov, D.S.A. Heat removal and catalyst deactivation in a Sabatier reactor for chemical fixation of CO2: Simulation-based analysis. Chem. Eng. J. 2017, 329, 165–177. [Google Scholar] [CrossRef]
- Try, R.; Bengaouer, A.; Baurens, P.; Jallut, C. Dynamic modeling and simulations of the behavior of a fixed-bed reactor-exchanger used for CO2 methanation. AIChE J. 2018, 64, 468–480. [Google Scholar] [CrossRef]
- Ducamp, J.; Bengaouer, A.; Baurens, P. Modelling and experimental validation of a CO2 methanation annular cooled fixed-bed reactor exchanger. Can. J. Chem. Eng. 2017, 95, 241–252. [Google Scholar] [CrossRef]
- Brunauer, S.; Emmett, P.H.; Teller, E. Adsorption of Gases in Multimolecular Layers. J. Am. Chem. Soc. 1938, 60, 309–319. [Google Scholar] [CrossRef]
- Barrett, E.P.; Joyner, L.G.; Halenda, P.P. The Determination of Pore Volume and Area Distributions in Porous Substances. I. Computations from Nitrogen Isotherms. J. Am. Chem. Soc. 1951, 73, 373–380. [Google Scholar] [CrossRef]
- Frick, V.; Brellochs, J.; Specht, M. Application of ternary diagrams in the design of methanation systems. Fuel Process. Technol. 2014, 118, 156–160. [Google Scholar] [CrossRef]
- Weatherbee, G.D.; Bartholomew, C.H. Hydrogenation of CO2 on group VIII metals II. Kinetics and mechanism of CO2 hydrogenation on nickel. J. Catal. 1982, 77, 460–472. [Google Scholar] [CrossRef]
- NIST Standard Reference Data NIST Chemistry WebBook. Available online: https://webbook.nist.gov/chemistry/ (accessed on 8 April 2019).
- Froment, G.F.; Bischoff, K.B.; De Wilde, J. Chemical Reactor Analysis and Design, 3rd ed.; John Wiley & Sons, Inc.: New York, NY, USA, 2012; Volume 2, ISBN 978-0-470-56541-4. [Google Scholar]
- Levenspiel, O. Chemical Reaction Engineering, 3rd ed.; John Wiley & Sons, Inc.: New York, NY, USA, 1999; ISBN 978-0471254249. [Google Scholar]
© 2020 by the authors. Licensee MDPI, Basel, Switzerland. This article is an open access article distributed under the terms and conditions of the Creative Commons Attribution (CC BY) license (http://creativecommons.org/licenses/by/4.0/).

