Article

Tunable Composition Aqueous-Synthesized Mixed-Phase TiO2 Nanocrystals for Photo-Assisted Water Decontamination: Comparison of Anatase, Brookite and Rutile Photocatalysts

by
Konstantina Chalastara
1,
Fuqiang Guo
1,
Samir Elouatik
2 and
George P. Demopoulos
1,*
1
Materials Engineering, McGill University, Montreal, QC H3A 0C5, Canada
2
Département de chimie, Université de Montréal, Montreal, QC H3T 2B1, Canada
*
Author to whom correspondence should be addressed.
Catalysts 2020, 10(4), 407; https://doi.org/10.3390/catal10040407
Submission received: 31 December 2019 / Revised: 5 April 2020 / Accepted: 7 April 2020 / Published: 8 April 2020
(This article belongs to the Special Issue Photocatalytic Nanocomposite Materials)

Abstract

:
Mixed-phase nanoTiO2 materials attract a lot of attention as advanced photocatalysts for water decontamination due to their intrinsic structure that allows better photo-excited ecb-h+vb charge separation, hence improved photocatalytic efficiency. Currently, the best-known mixed-phase TiO2 photocatalyst is P25 with approximate composition 80% Anatase/20% Rutile (A/r). Apart from Anatase (A) and Rutile (R) phases, there is Brookite (B) which has been evaluated less as photocatalyst in mixed-phase nanoTiO2 systems. In this work we present a sustainable solution process to synthesize tunable composition mixed-phase nanotitania photocatalysts in a continuously stirred tank reactor (CSTR) by modulating conditions like pH, CTiCl4 and time. In particular three mixed-phase TiO2 nanomaterials were produced, namely one predominantly anatase with brookite as minor component (A/b), one predominantly brookite with minor component rutile (B/r), and one predominantly rutile with minor component brookite (R/b) and evaluated as photocatalysts in the degradation of methyl orange. The three semiconducting nanomaterials were characterized by XRD and Raman spectroscopy to quantify the phase ratios and subjected to nano-morphological characterization by FE-SEM and TEM/HR-TEM. The new mixed-phase nanoTiO2 materials are shown to be endowed with large specific surface area, ranging from 90–125 m2 g−1, double of that of P25, to be mesoporous and be surface-rich in Ti–OH molecular groups varying from 12%–20% versus 4% for P25. These properties though impact the adsorptive capacity with R/b and B/r removing > 50% of MO but not photocatalytic activity. The latter depends on nanograined mixed-phase structure and not mere assembly of different phase nanoparticles. First-order rate constants reveal essentially equivalent photocatalytic activity for anatase nanocrystals with either rutile (P25) or brookite (this work) domains.

1. Introduction

Nanoscale titanium dioxide (TiO2) is one the most common photocatalysts used for a variety of applications since the pioneering photocatalytic work of Fujishima and Honda [1]. One of these applications is heterogeneous photocatalytic oxidation (HPO) used for environmental remediation, air and water purification containing organic pollutants [2,3,4]. Other applications include photovoltaics and energy storage in Li-ion batteries [5,6]. Among the advantages of nanotitania as a photocatalyst are (i) the high specific surface area, (ii) high chemical stability, (iii) reusability, and (iv) strong photocatalytic activity under UV light illumination, that upon doping can also be extended to the visible-light range [4,7].
Once light is illuminated on the nanotitania with energy equal or higher than its band gap, conduction band electrons ( e cb ) and valence band holes ( h vb + ) are generated. The h vb + may be used to oxidize organic molecules, and react with H2O and hydroxide ions in solution to produce hydroxyl radicals (OH), while the e cb can reduce oxygen to superoxide (O2−•) and hydrogen peroxide (H2O2), or may be used to reduce inorganic pollutants [7]. Odling et al. mention the significant difference between surface bound radicals (OHs) and free in solution radicals (OHf) on the degradation reactions [8].
TiO2 photocatalytic activity depends on the crystal structure, phase composition, nanoparticle size distribution, porosity, band gap and surface-bound hydroxyl species [9]. TiO2 exists mainly in three pure phases: anatase (A), brookite (B) and rutile (R). The two main drawbacks of single-phase TiO2 are that (i) pure TiO2 is photoactive only under UV light illumination because its bandgap lies at ~ 3.2 eV, which corresponds to 390 nm wavelength and (ii) suffers from fast recombination of the ecb and h+vb [7,10]. Strategies to overcome these disadvantages and improve the photocatalytic efficiency involve (i) the modification of nanoTiO2 by doping to broaden the spectrum wavelength [11,12,13] and (ii) the modifications of the structural and morphological characteristics which would give a beneficial synergistic effect between the TiO2 polymorphs [14]. Though recently there is a controversy in literature as to which one has greater effect on the photocatalytic efficiency of the nanoTiO2 [15,16,17].
Until very recently, most studies on the photocatalytic performance of nanoTiO2 were conducted with anatase (A), as it has longer charge-carrier lifetime and mobility [8], while photocatalytic applications of brookite (B) and rutile (R) are the least known [9,18,19,20]. Nowadays, a lot of attention is given to mixed phase TiO2 photocatalysts as the synergistic effect between the two phases reduces the recombination effect [4]. The most common commercial TiO2 photocatalyst is the benchmark Evonik P25, which is a mixed phase of 80% A/20% R [15]. Even though many agree on the synergistic effect between the two phases that gives less e cb and h vb + recombination, uncertainty exists, if the high photocatalytic efficiency is due to intra-particle heterojunction between the two phases or it is due to inter-particle contact of single phase nanoparticles [8,10,14,15,21,22,23]. Ohtani et al. argue that P25 is a simple mixture of A-R nanoparticles without any intrinsic electronic interactions [10], while Jiang et al. although agree that P25 comprises single phase A and R particles, they also state that it comprises as well binary-phase heterojunctioned TiO2 nanoparticles in the form of A particles having a thin R surface overlayer [15]. Observations were made by Likodimos et al. that mixed-phase TiO2 nanoparticles are significantly better photocatalysts than simple mixture of single-phase nanoparticles due to their close-contact heterophase junctions [4]. The e cb from the R or B phase are being transferred to the A phase due to favorable conduction band alignment, thus inhibiting charge recombination [22,24]. Moreover, in a mixed A/B and A/R configuration, the lattices align to facilitate charge separation thus enhancing the photocatalytic efficiency of mixed-phase TiO2 compared to its single-phases [20,25,26].
TiO2 can be synthesized by various methods such as sol-gel synthesis to produce powders and films [27], solvothermal or hydrothermal technologies [20,26,28]. All these methods involve high temperature processing, for example, hydrothermal treatment at 200 °C for several hours [20,26], or calcination at 400–800 °C [29,30]. In our previous work, a scalable process was developed for the synthesis of nanoTiO2 in a continuous stirred-tank reactor, CSTR (Scheme S1). This is a scalable hydrolytic process, where no toxic organic chemicals are added, constituting a cost-effective and green alternative [31]. In this work, the synthesis method is tuned to produce mixed-phase nanoTiO2 blends by changing various process parameters—agitation speed, residence time, Ti(IV) concentration and pH. The method allows us to simply control the crystallinity, size and phase of the titania powder during the synthesis. The crystal shape, size and surface area control by varying the Ti(IV) concentration. TiO2 in the form of pure A, B, and R and mixed powders Anatase-brookite minor (A/b), Brookite-rutile (B/r) and Rutile-brookite (R/b) were synthesized and extensively investigated by XRD, Raman, FE-SEM, HM-TEM, XPS, TGA and FTIR. We present evidence that the mixed-phase nanoTiO2 particles are nanograined with different d-spacing lattice profiles within 4 nm size domains that exhibit superior photocatalytic activity in UV light degradation of the organic compound, methyl orange (MO), when compared to mere mixtures of single-phase nanoTiO2 particles. Finally, based on detailed characterization a combined adsorption/photo-oxidation mechanism is proposed to explain the degradation of methyl orange on nanoTiO2.

2. Results

2.1. Synthesis of Mixed-Phase TiO2 Nanoparticles (NPs)

In order to determine the best mixed-phase nanoTiO2 photocatalyst, we varied the hydrolytic synthesis conditions producing nanoparticulates with different phase composition using the CSTR reactor setup graphically described in Scheme S1. The process parameters that were varied were: Ti(IV) feed concentration, pH and agitation speed. The products obtained from the different tests are summarized in Table S1 and reproducibility synthesis results are given in Table S2. Among the different products, three mixed-phase nanoTiO2 assemblies were selected following a standard photocatalytic degradation test as described in Section 4.4. These three nanoTiO2 products are labeled as A/b, B/r, R/b, where caps (A, anatase; B, brookite; R, rutile) indicate the major phase and subscripts the minor phase, respectively. Their synthesis process flowchart is shown in Figure S1. Single-phase anatase, brookite and rutile nanoTiO2 were also produced to compare their photocatalytic activity with that of the mixed-phase nanoTiO2. Details on the synthesis conditions for each of the nanoTiO2 products tested are given in Table 1. An increase in pH, from 1 to 3 favored the formation of the anatase phase, while at intermediate pH around 0.7–0.8 formation of brookite major was favored. At even lower pH values and higher Ti(IV) concentration the rutile phase dominated. This trend in TiO2 phase formation as a function of pH is in agreement with our previous work [31,32]. As per our previous findings, spontaneous forced hydrolysis favors the homogeneous nucleation of anatase as first step, which depending on the pH, transforms to brookite at intermediate pH, and further to rutile at lower pH via the dissolution-recrystallization mechanism [32]. In this work, taking advantage of the established reaction mechanism, we have successfully interrupted the nucleation-dissolution-recrystallization sequence at different stages by tuning the pH and the other conditions, giving rise to variable composition mixed-phase nanoTiO2.

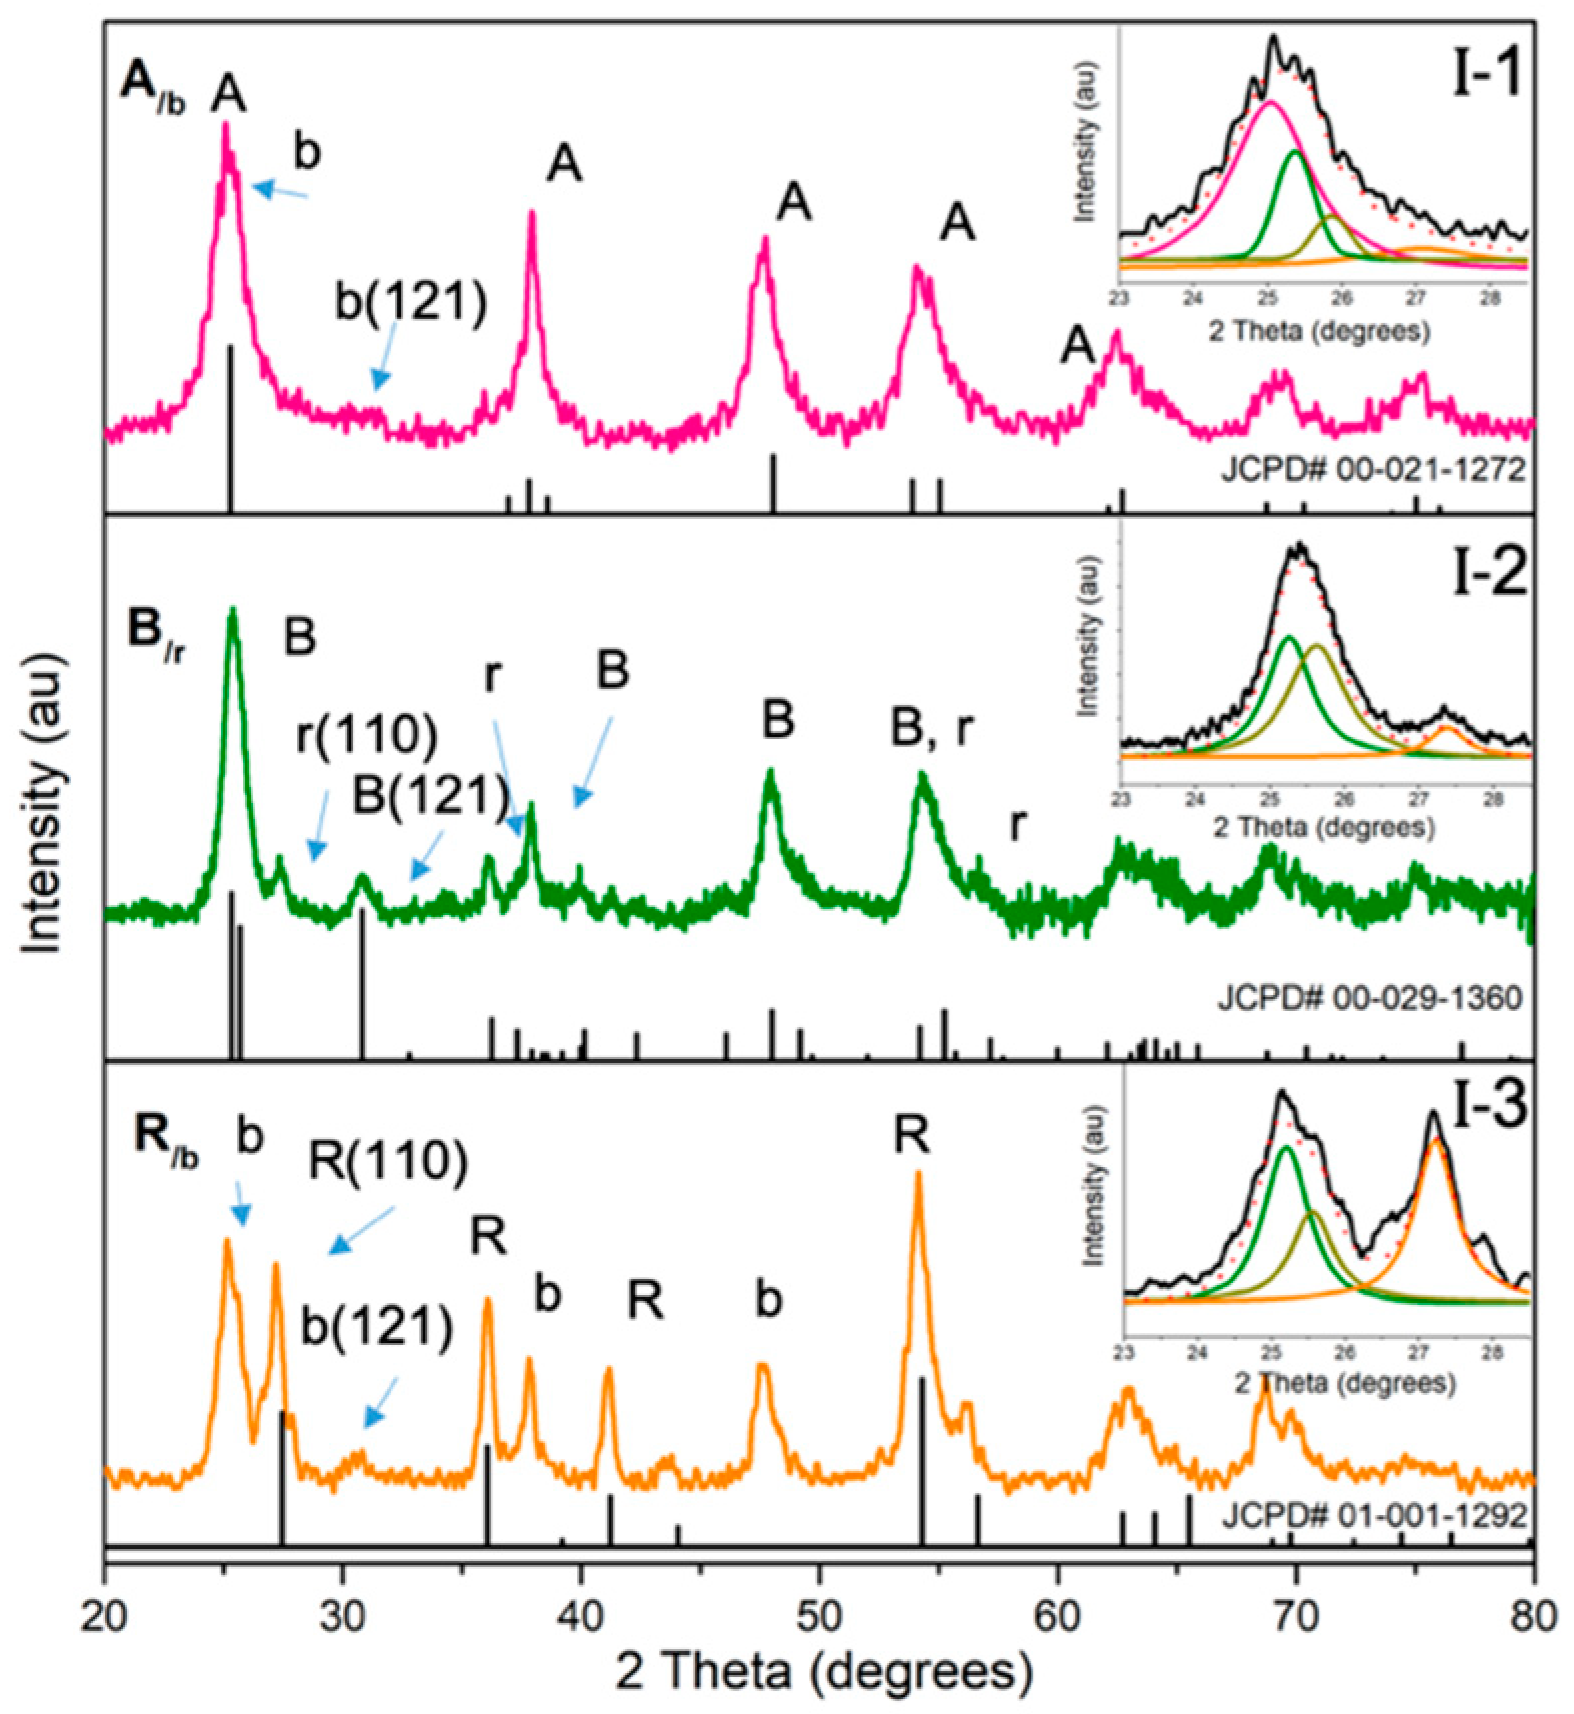
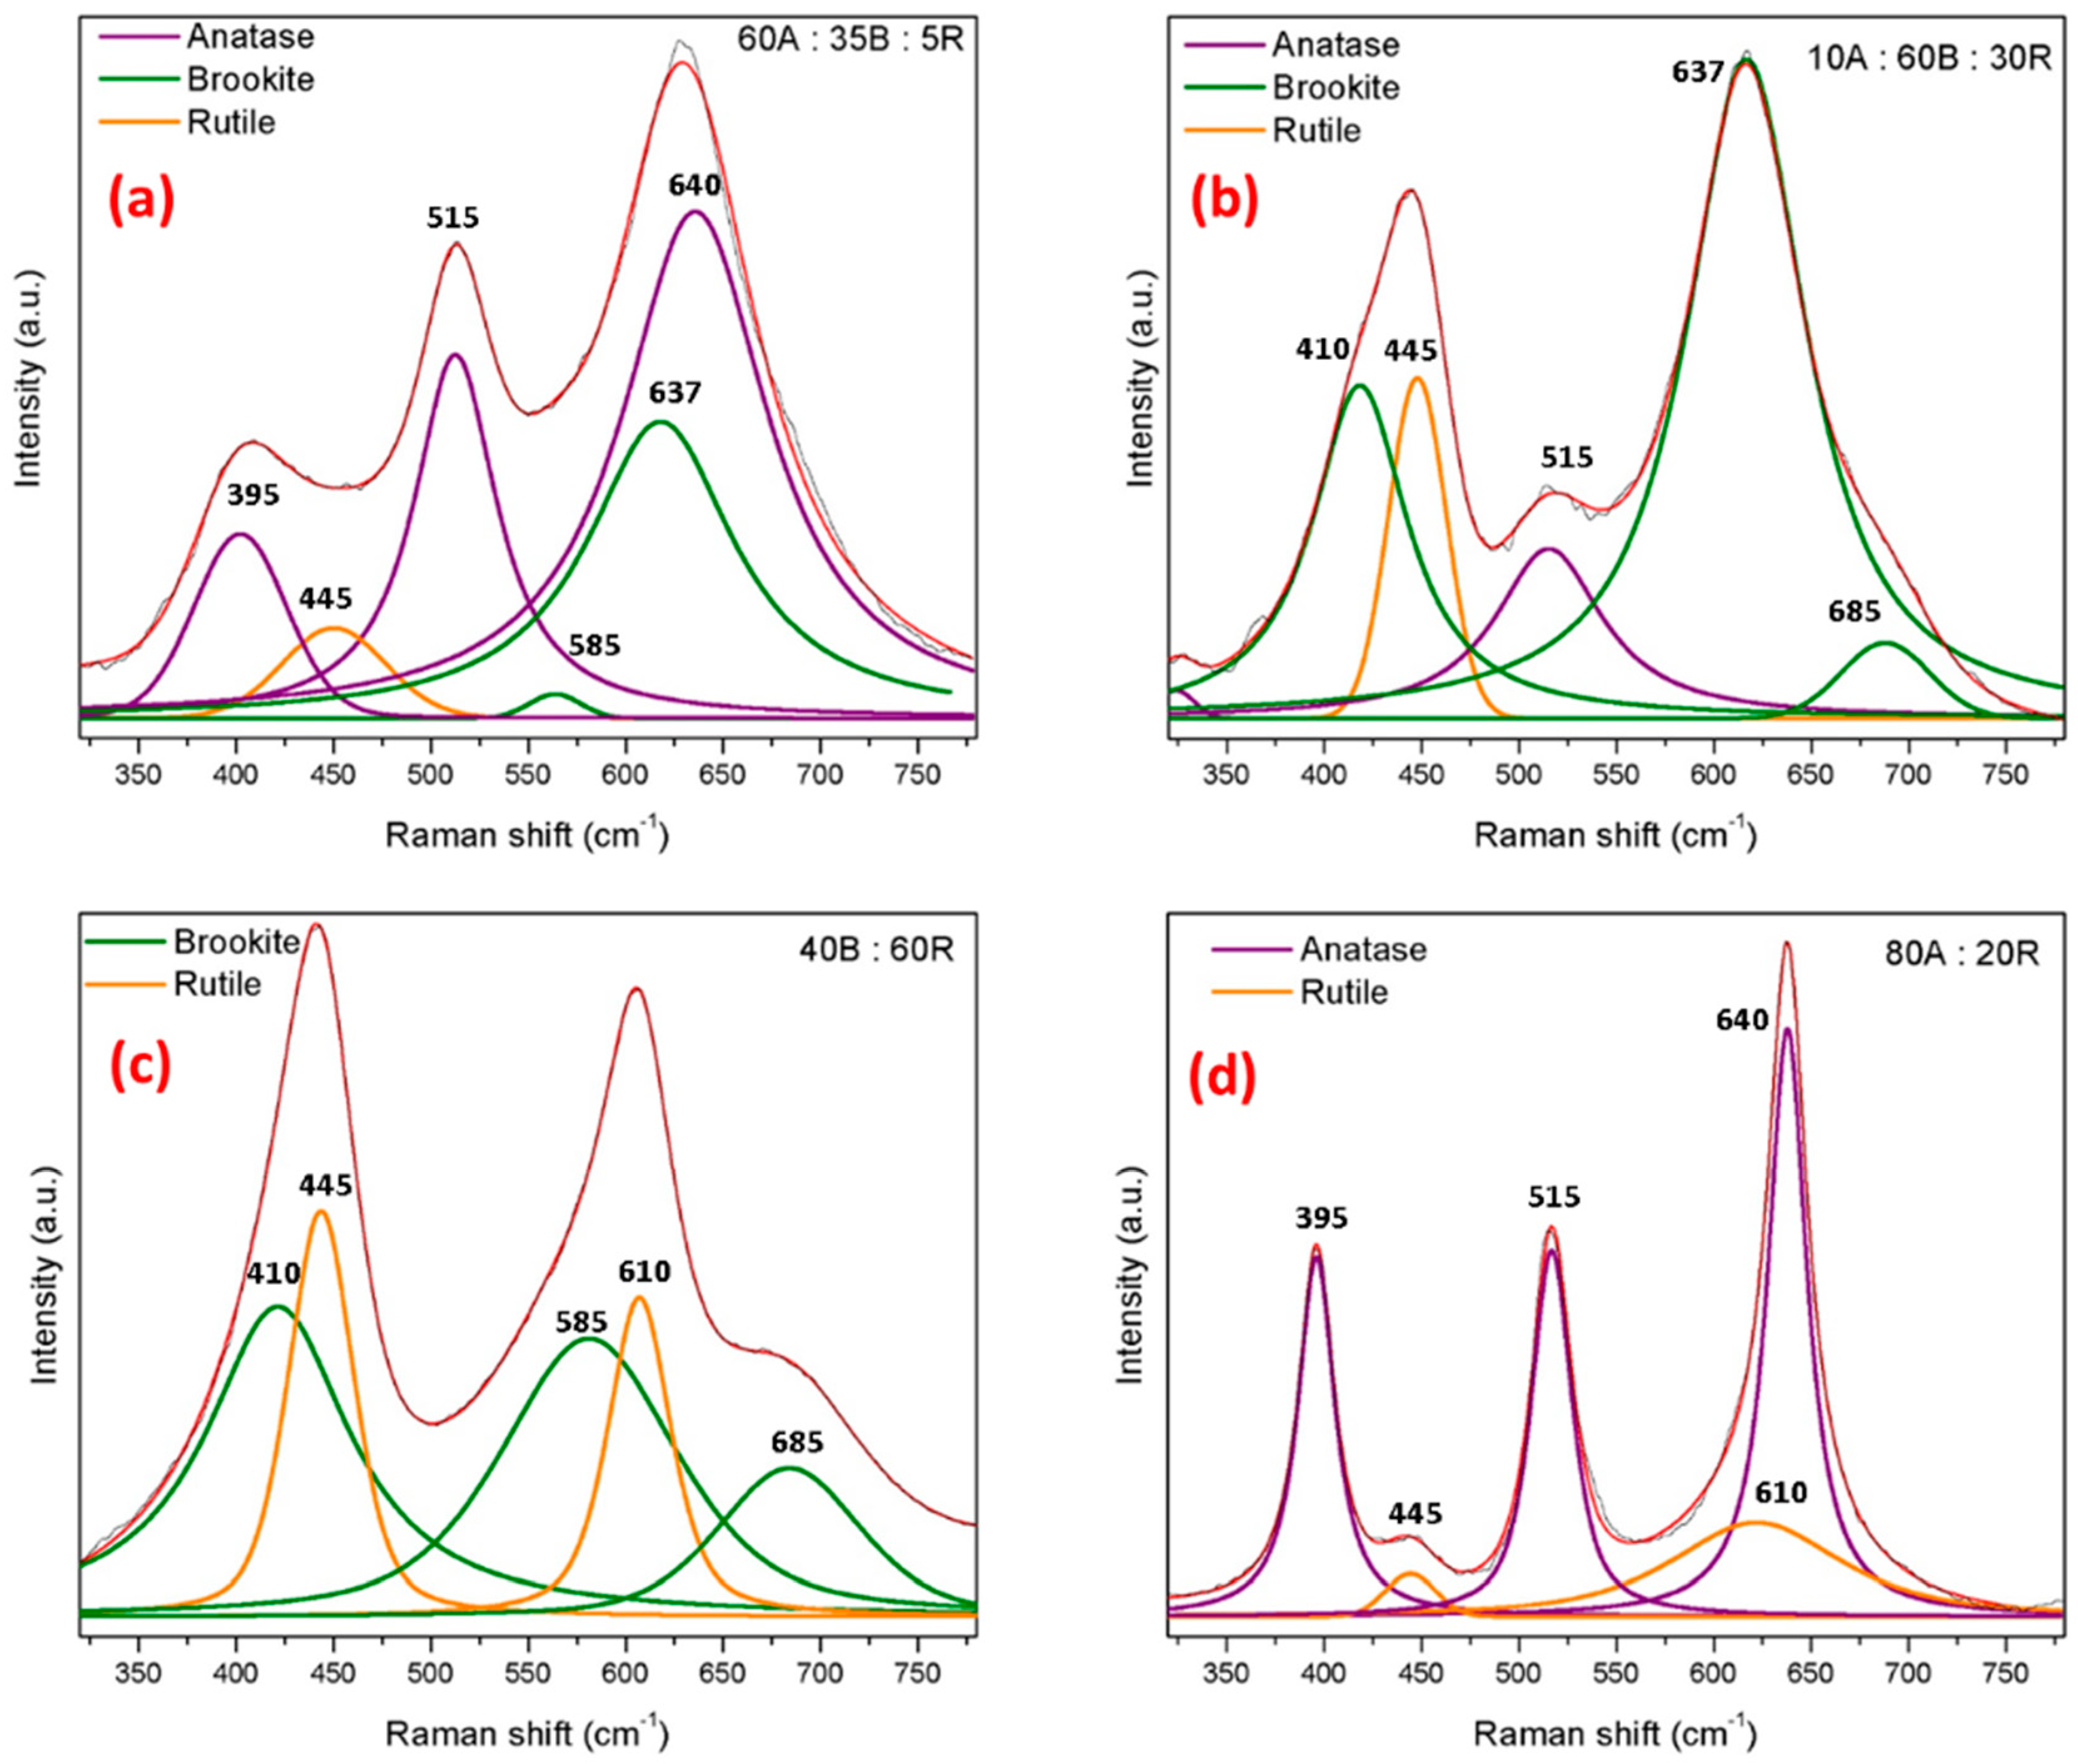
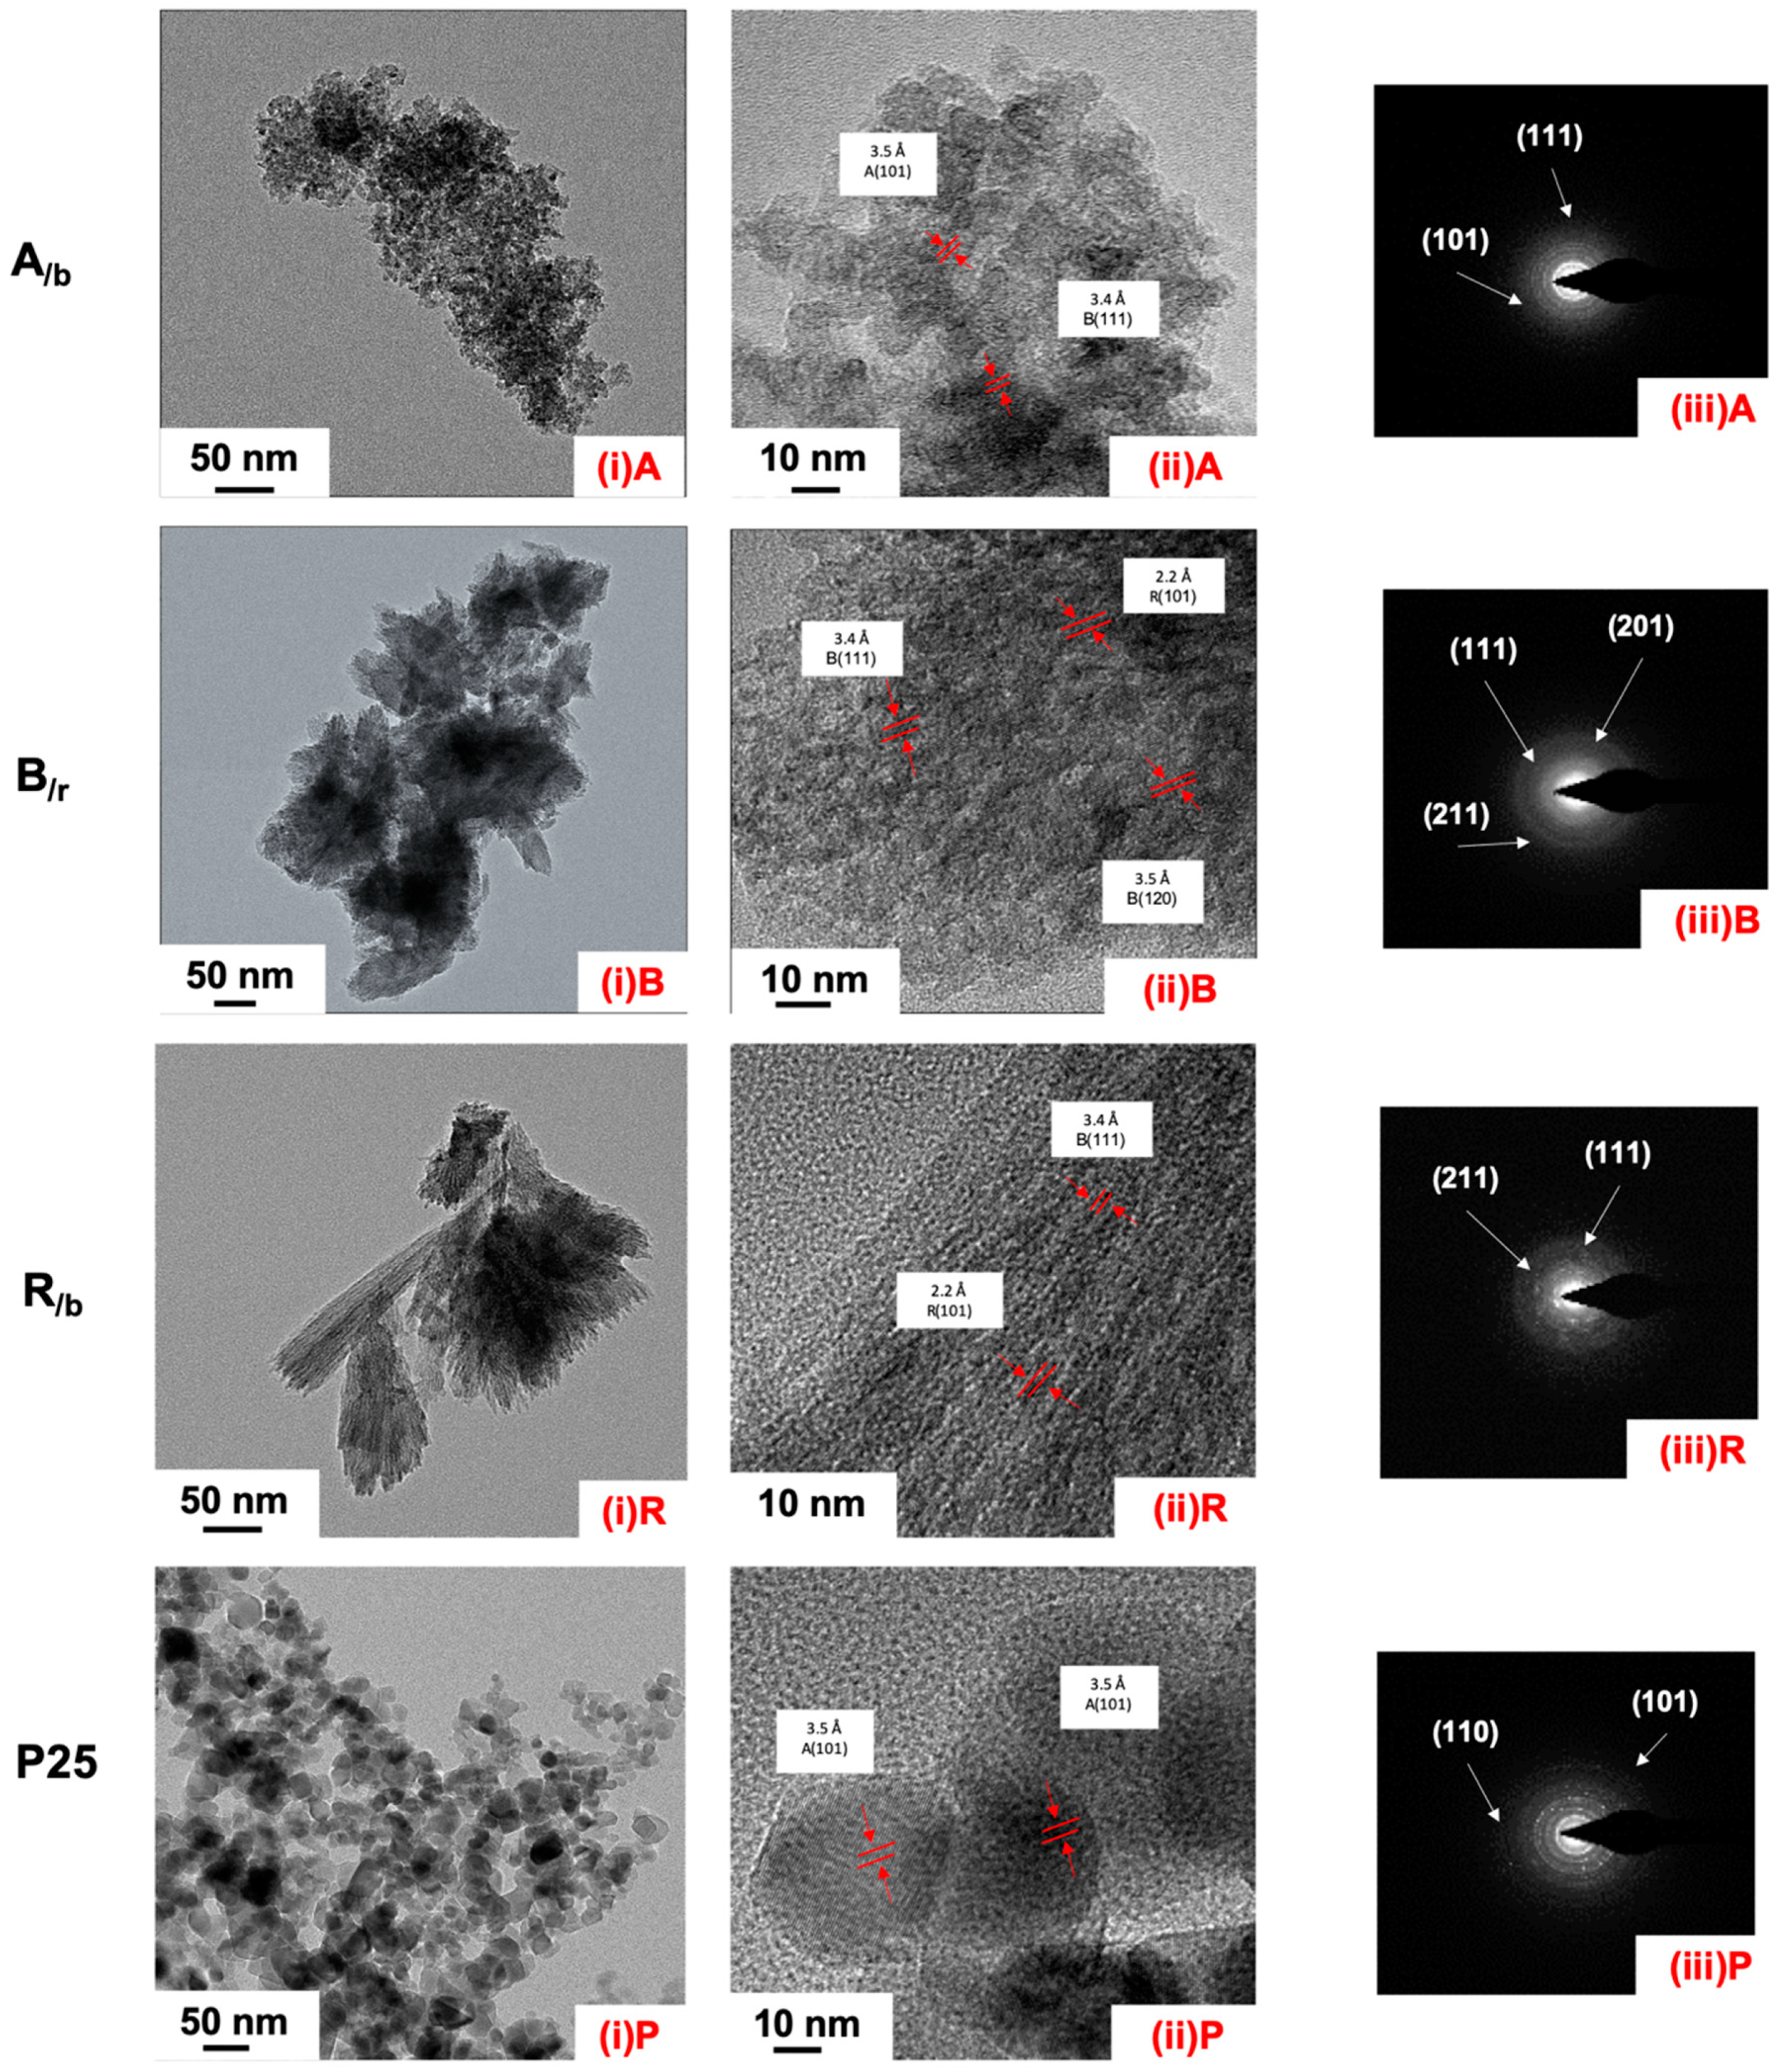
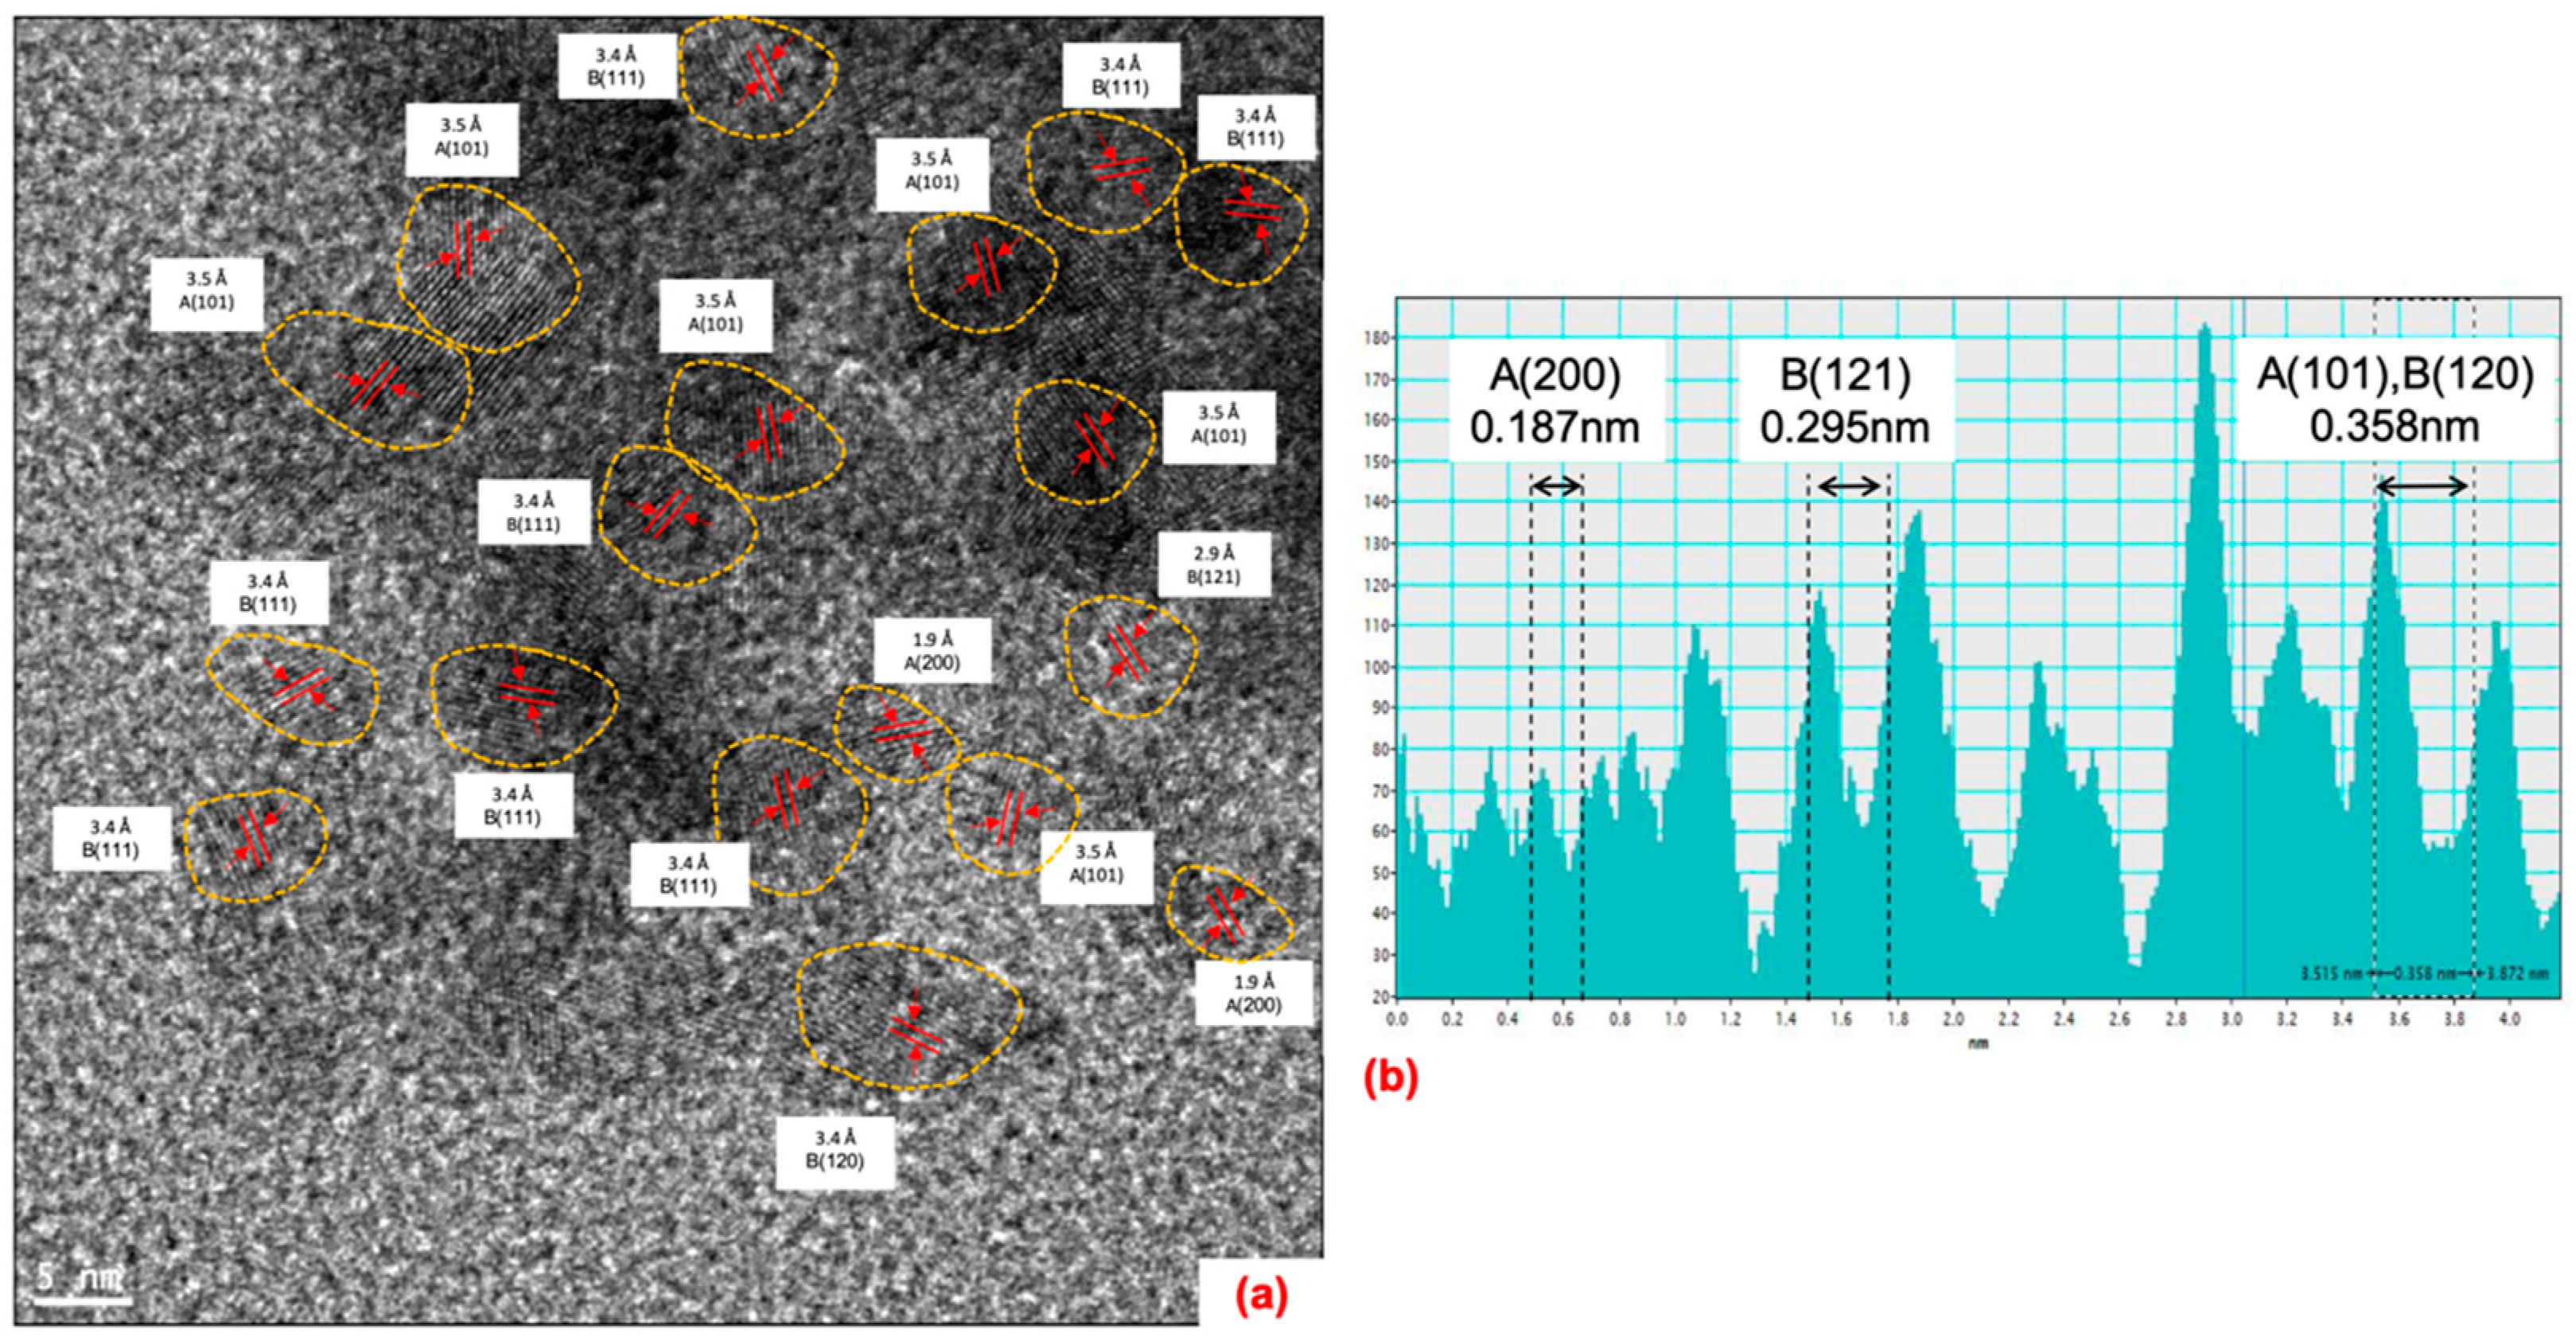
2.2. Characterization and Properties of Synthesized TiO2 Nanocrystals

Nanostructural Properties

The XRD patterns of the three synthesized mixed-phase TiO2 NPs—namely A/b, B/r, and R/b—are shown in Figure 1, where they are compared to the JCPD reference data of anatase, brookite and rutile; #00-021-1272, #00-029-1360 and #00-001-1292, respectively. As can be seen, the A/b product’s pattern can be matched with the key peaks of anatase at 2θ = 25.3° (101), 37.0° (004), 48.0° (200), 53.9° (105), 62.2° (118) and 68.5° and 75.05° (215), while the co-existing minor brookite component is discerned by its characteristic peak at 30.8° (121) and the subtle presence of its tween peak at 25.3° (120) and 25.7°(111) (according to JCPD#00-029-1360), evident by the slight shoulder as discussed in a previous paper by our group [33], and supported by the peak deconvolution data presented as inset I-1 in Figure 1. In the case of B/r, the presence of brookite is revealed by the peak at 30.8° that does not overlap with any peak from anatase or rutile but otherwise mere examination of the XRD pattern is not adequate to discern if anatase or brookite is the main phase because of the closeness of their major peaks (at 25.3°–25.7°). Upon deconvolution though of the main peak in the B/r pattern, very good fit is obtained with brookite’s tween peak at 25.3°/25.7° (see deconvoluted data in inset I-2 in Figure 1), which together with its nanoplatelet morphology (see TEM analysis later and discussion in [33]) leads to conclude that it is predominantly brookite. In the B/r product at 27.2° (110) there is the faint peak of rutile, which becomes dominant in the R/b product along the equivalent tween peak of co-existing brookite at 25.3°/25.7° (see deconvoluted data in inset I-3 in Figure 1). In the R/b pattern product, the presence of the characteristic brookite peak at 30.8° (121) is clearly evident. The remaining peaks can be assigned to either rutile or brookite, with distinct peaks of 36.1° (101), 41.1° (111), 54.5° (211), 56.8° (220), 64° (002) and 70.2° (112). Using the Le Bail method in TOPAS software and the JCPD reference data, we were able to estimate the approximate phase composition percentage of the three single-phase and the three mixed-phase synthesized nanotitania powders, and the obtained data is shown in Table 1. It can be seen that the standard single-phase anatase (HM-A) and single-phase rutile (HM-R) are 100% pure phase, while the single-phase brookite (HM-B) standard contains 6% of rutile. Meanwhile, the mixed-phase A/b was determined to be 70% anatase and 30% brookite; the R/b 65% rutile and 35% brookite; the B/r 65% brookite, 25% rutile, 10% anatase.
The approximate phase composition of the synthesized NPs is further determined by deconvolution of the Raman spectra, Figure 2. The Raman bands at 395, 515 and 640 cm−1 can be assigned to the B1g, A1g or B1g and Eg Raman vibration modes of the anatase phase, respectively [34,35]; the 410, 585, 637 and 685 cm−1 Raman peaks to A1g, B2g and A1g modes of the brookite phase; while the 445 and 610 cm−1 to the A1g and B1g modes of the rutile phase [4,9,24,36]. After spectral deconvolution, we were able to compare the intensity of the major peaks for each phase. A/b was confirmed to be a mixed-phase nanoTiO2 with approximate composition percentage ratios: 60% anatase, 35% brookite and 5% rutile; the B/r to have 60% brookite, 30% rutile, 10% anatase; the R/b to consist of 60% rutile, 40% brookite. For comparison, P25 was also analyzed (Figure 2d) and found to consist of 80% anatase and 20% rutile, in agreement with other reports [15]. Despite the inclusion of a third component in the deconvolution analysis, the Raman-derived percentage compositions are in good overall agreement with the respective XRD data as presented in Table 1.
The nanotitania powders were characterized further in terms of specific surface area (SSA) and porosity by performing Brunauer–Emmett–Teller (BET) analysis, and compared with the commercial titania, Evonik P25 in order to evaluate possible differences on the interparticle phases. As seen in Table 2, the SSA for the A/b and B/r is at 122 and 110 m2 g−1, respectively, while for the R/b is 92 m2 g−1. In all three cases, the SSA is at least double of that of P25 at 49 m2 g−1. A similar SSA for P25 has been reported as well in previous studies. [32,37]. Another attractive feature of the newly synthesized nanoTiO2 powders is that they are mesoporous as can be deduced from the N2 adsorption–desorption isotherms that are type IV category—as shown in Figure S6. This is confirmed by performing the Barrett–Joyner–Halenda (BJH) analysis—shown in Figure S7(insets)—to determine their pore size distributions. All four powders seem to have an adsorption branch combined with a monomodal pore size distribution [22]. The mean pore size for the B/r major TiO2 (Figure S6b) is centered at 26 nm, while the A/b (Figure S6a) and P25 (Figure S6d) are centered at 45 nm and 40 nm, respectively, though the R/b (Figure S6c) has the smallest pores at 4.3 nm. In Figure S6(a,b,d), it can be seen that the A/b, B/r and P25 powders display a late adsorption edge (P/Po > 0.8); this is due to the large pore size compared with the R/b, as shown in Figure S6c [22].
The morphological characteristics of the synthesized TiO2 NPs were evaluated with SEM and TEM techniques. The SEM images are presented in Figure S2 and the TEM images in Figure 3 reveal distinct nanocrystal morphologies among the three mixed-phase nanoTiO2 photocatalysts and P25. Thus, the predominantly anatase product, A/b, exhibits aggregate morphology of quasi-spherical primary nanocrystallites of 5–10 nm in size (Figure 3 and Figure S2a); the predominantly brookite, B/r, has a thin (<10nm) nanoplatelet morphology [33], with dimensions of 50 to 150 nm (Figure 3 and Figure S2b); the predominantly rutile, R/b, has a needle-like one-dimension morphology 200–500 nm long (Figure 3 and Figure S2c). For comparison, the commercial P25 exhibits uniform nanocrystal morphology and size of 20–30 nm (Figure 3 and Figure S2d).
The nanostructure of the three mixed-phase TiO2 NPs was probed further by transmission electron microscopy (TEM) and high resolution TEM (HM-TEM) in order to determine if the mixed-phase nanoTiO2 materials are a simple physical mixture, or if individual nanoparticles consist of more than one phase. According to the HR-TEM images in Figure 3(ii), d spacings from different phases can be seen to be present, hence providing indirect evidence of intraparticle mixed-phase nanomaterials. The characteristic d-spacing of the anatase (101), (004) and (200) planes is 3.5, 3.27 and 1.89 Å, respectively; the respective d-spacing for brookite (120), (111), (121), (032) is 3.51, 3.4, 2.9 and 1.96 Å, respectively; while the d-spacing for rutile (110), (101) and (111) is 3.25, 2.48, 2.2 Å, respectively. Analysis of A/b, B/r and R/b in terms of the presence of characteristic d-spacings showed the respective phases A–B, B–R and R–B to co-exist. We have analyzed several HR-TEM images providing further evidence of phase co-existence in the TiO2 nanograined particles—see Figure 4 and Figures S3–S5. There it can be seen that we have evidence of different phase nanodomains in interconnected nanograins in all three mixed-phase nanoTiO2 photocatalysts (Figures S3–S5). More specifically, using the DigitalMigrograph software, the HM-TEM images of all three mixed-phase materials were analyzed by taking lattice profiles at three different spots of <4 nm size. Thus, as can be seen in the case of A/b (Figure 4b and Figure S3), the characteristic A (101), A (004), A (200) and B (121) and B (120) planes are present within 2–3 nm space, i.e., in a distance smaller than the size of a single nanocrystallite. In Figure S4 featuring an image from the B/r material, we have B (121), B (120), B (111) and R (111) planes within 2–3 nm confirming the mixed-phase B/r character of this material. Finally, in Figure S5 we have identified the R (110), R (101) and B (032) planes, which correspond to the R/b mixed-phase composition. Further evidence of the mixed-phase character of the synthesized nanoTiO2 photocatalysts is revealed by the Selective Area Electron Diffraction patterns (SAED) shown in Figure 3(iii). The continuous ring patterns indicate the anatase-major, brookite-major, and rutile-major particles to be polycrystalline, judging from the concentric Debye–Scherrer rings which can be indexed to (111) and (101) for anatase, (211) and (201) for brookite and (211) for rutile.

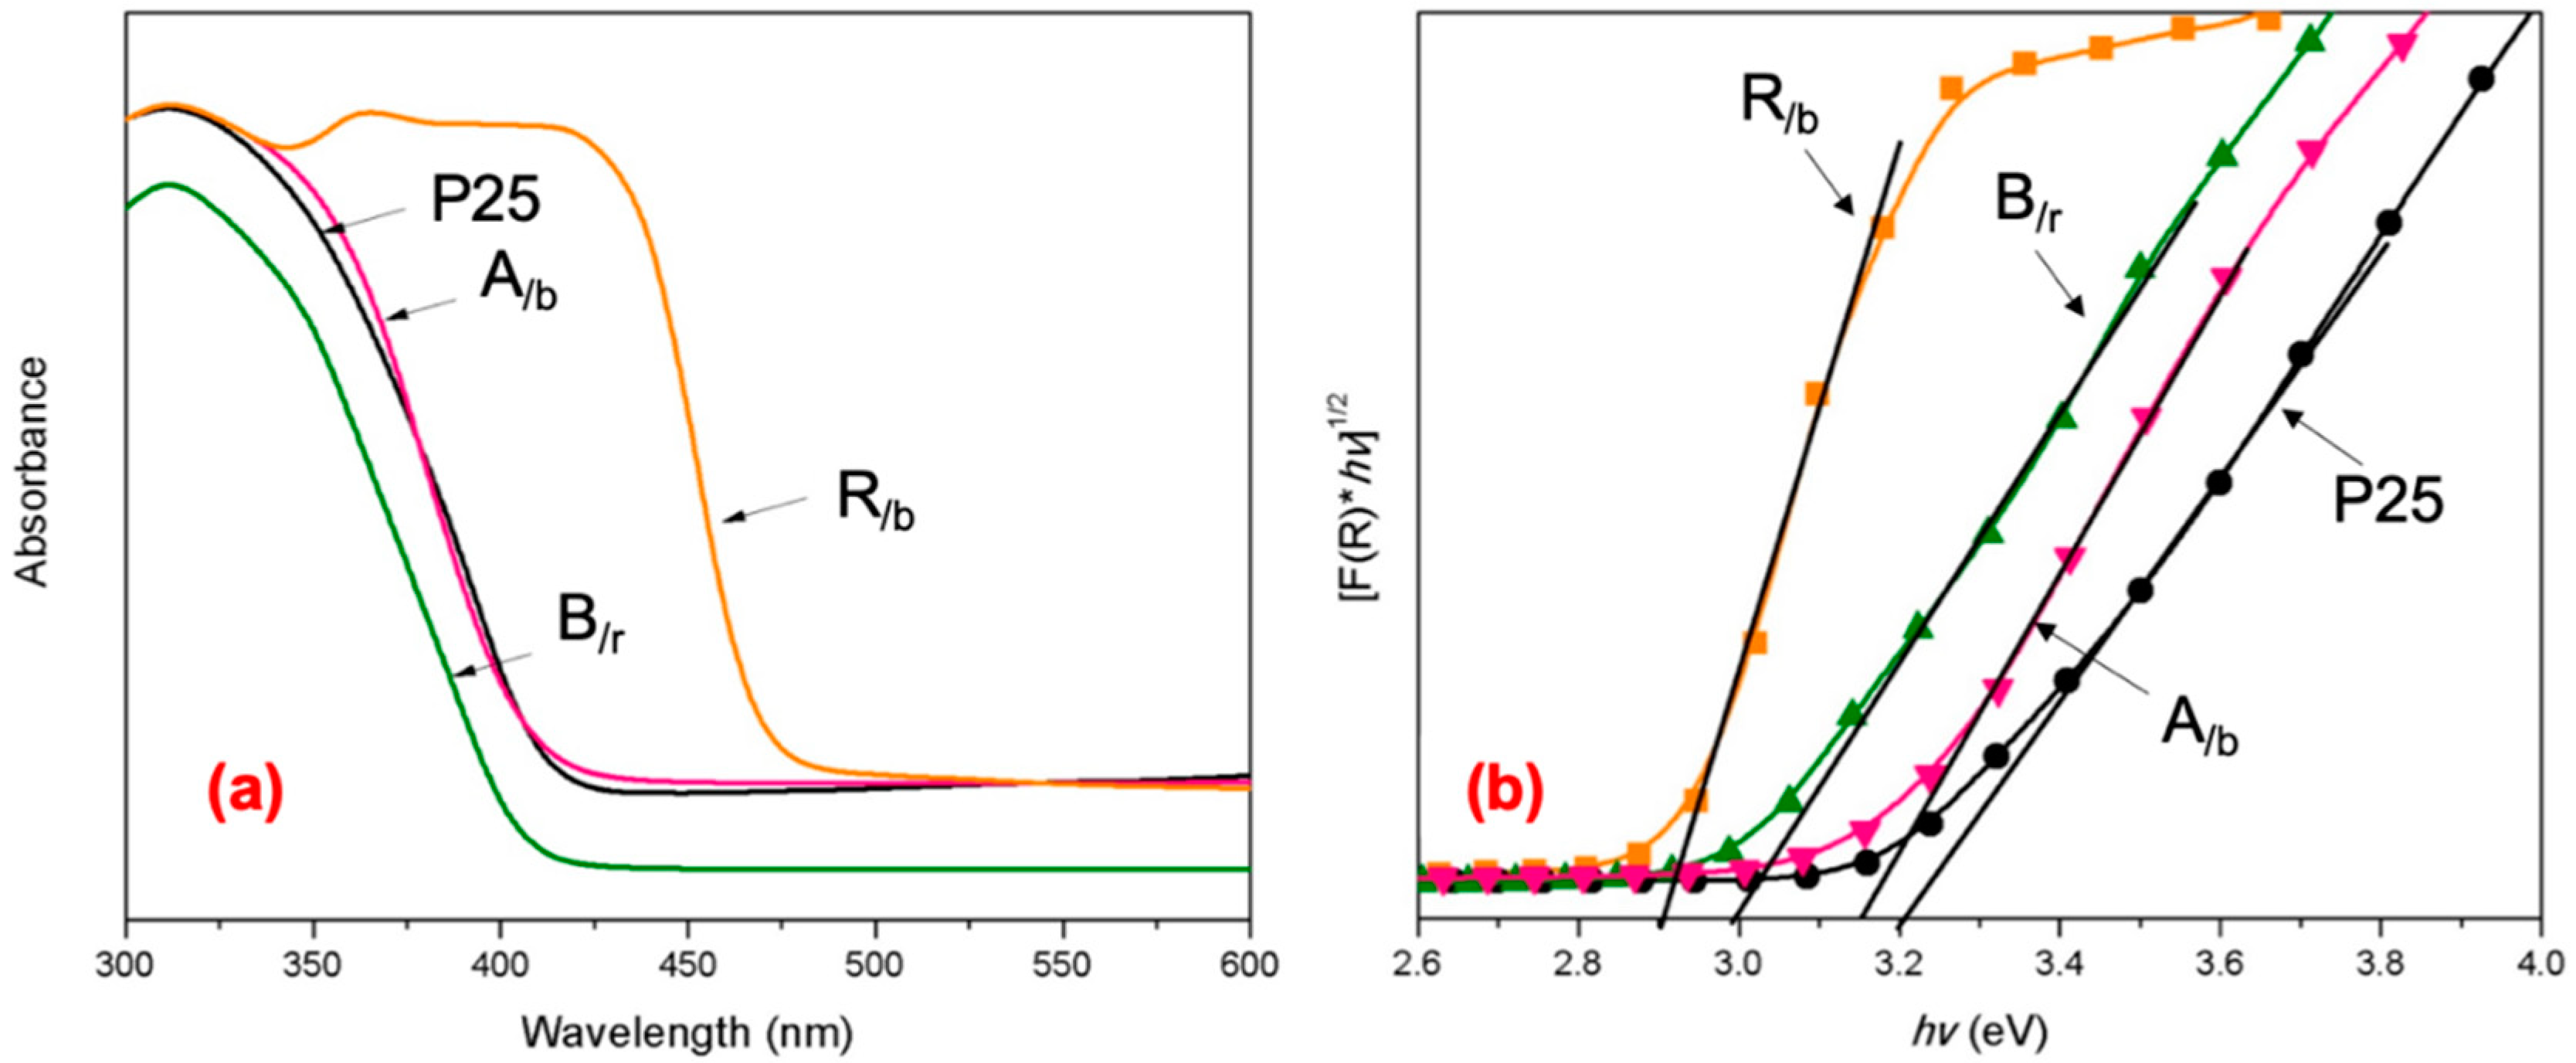
Light-Absorbing and Electronic Properties
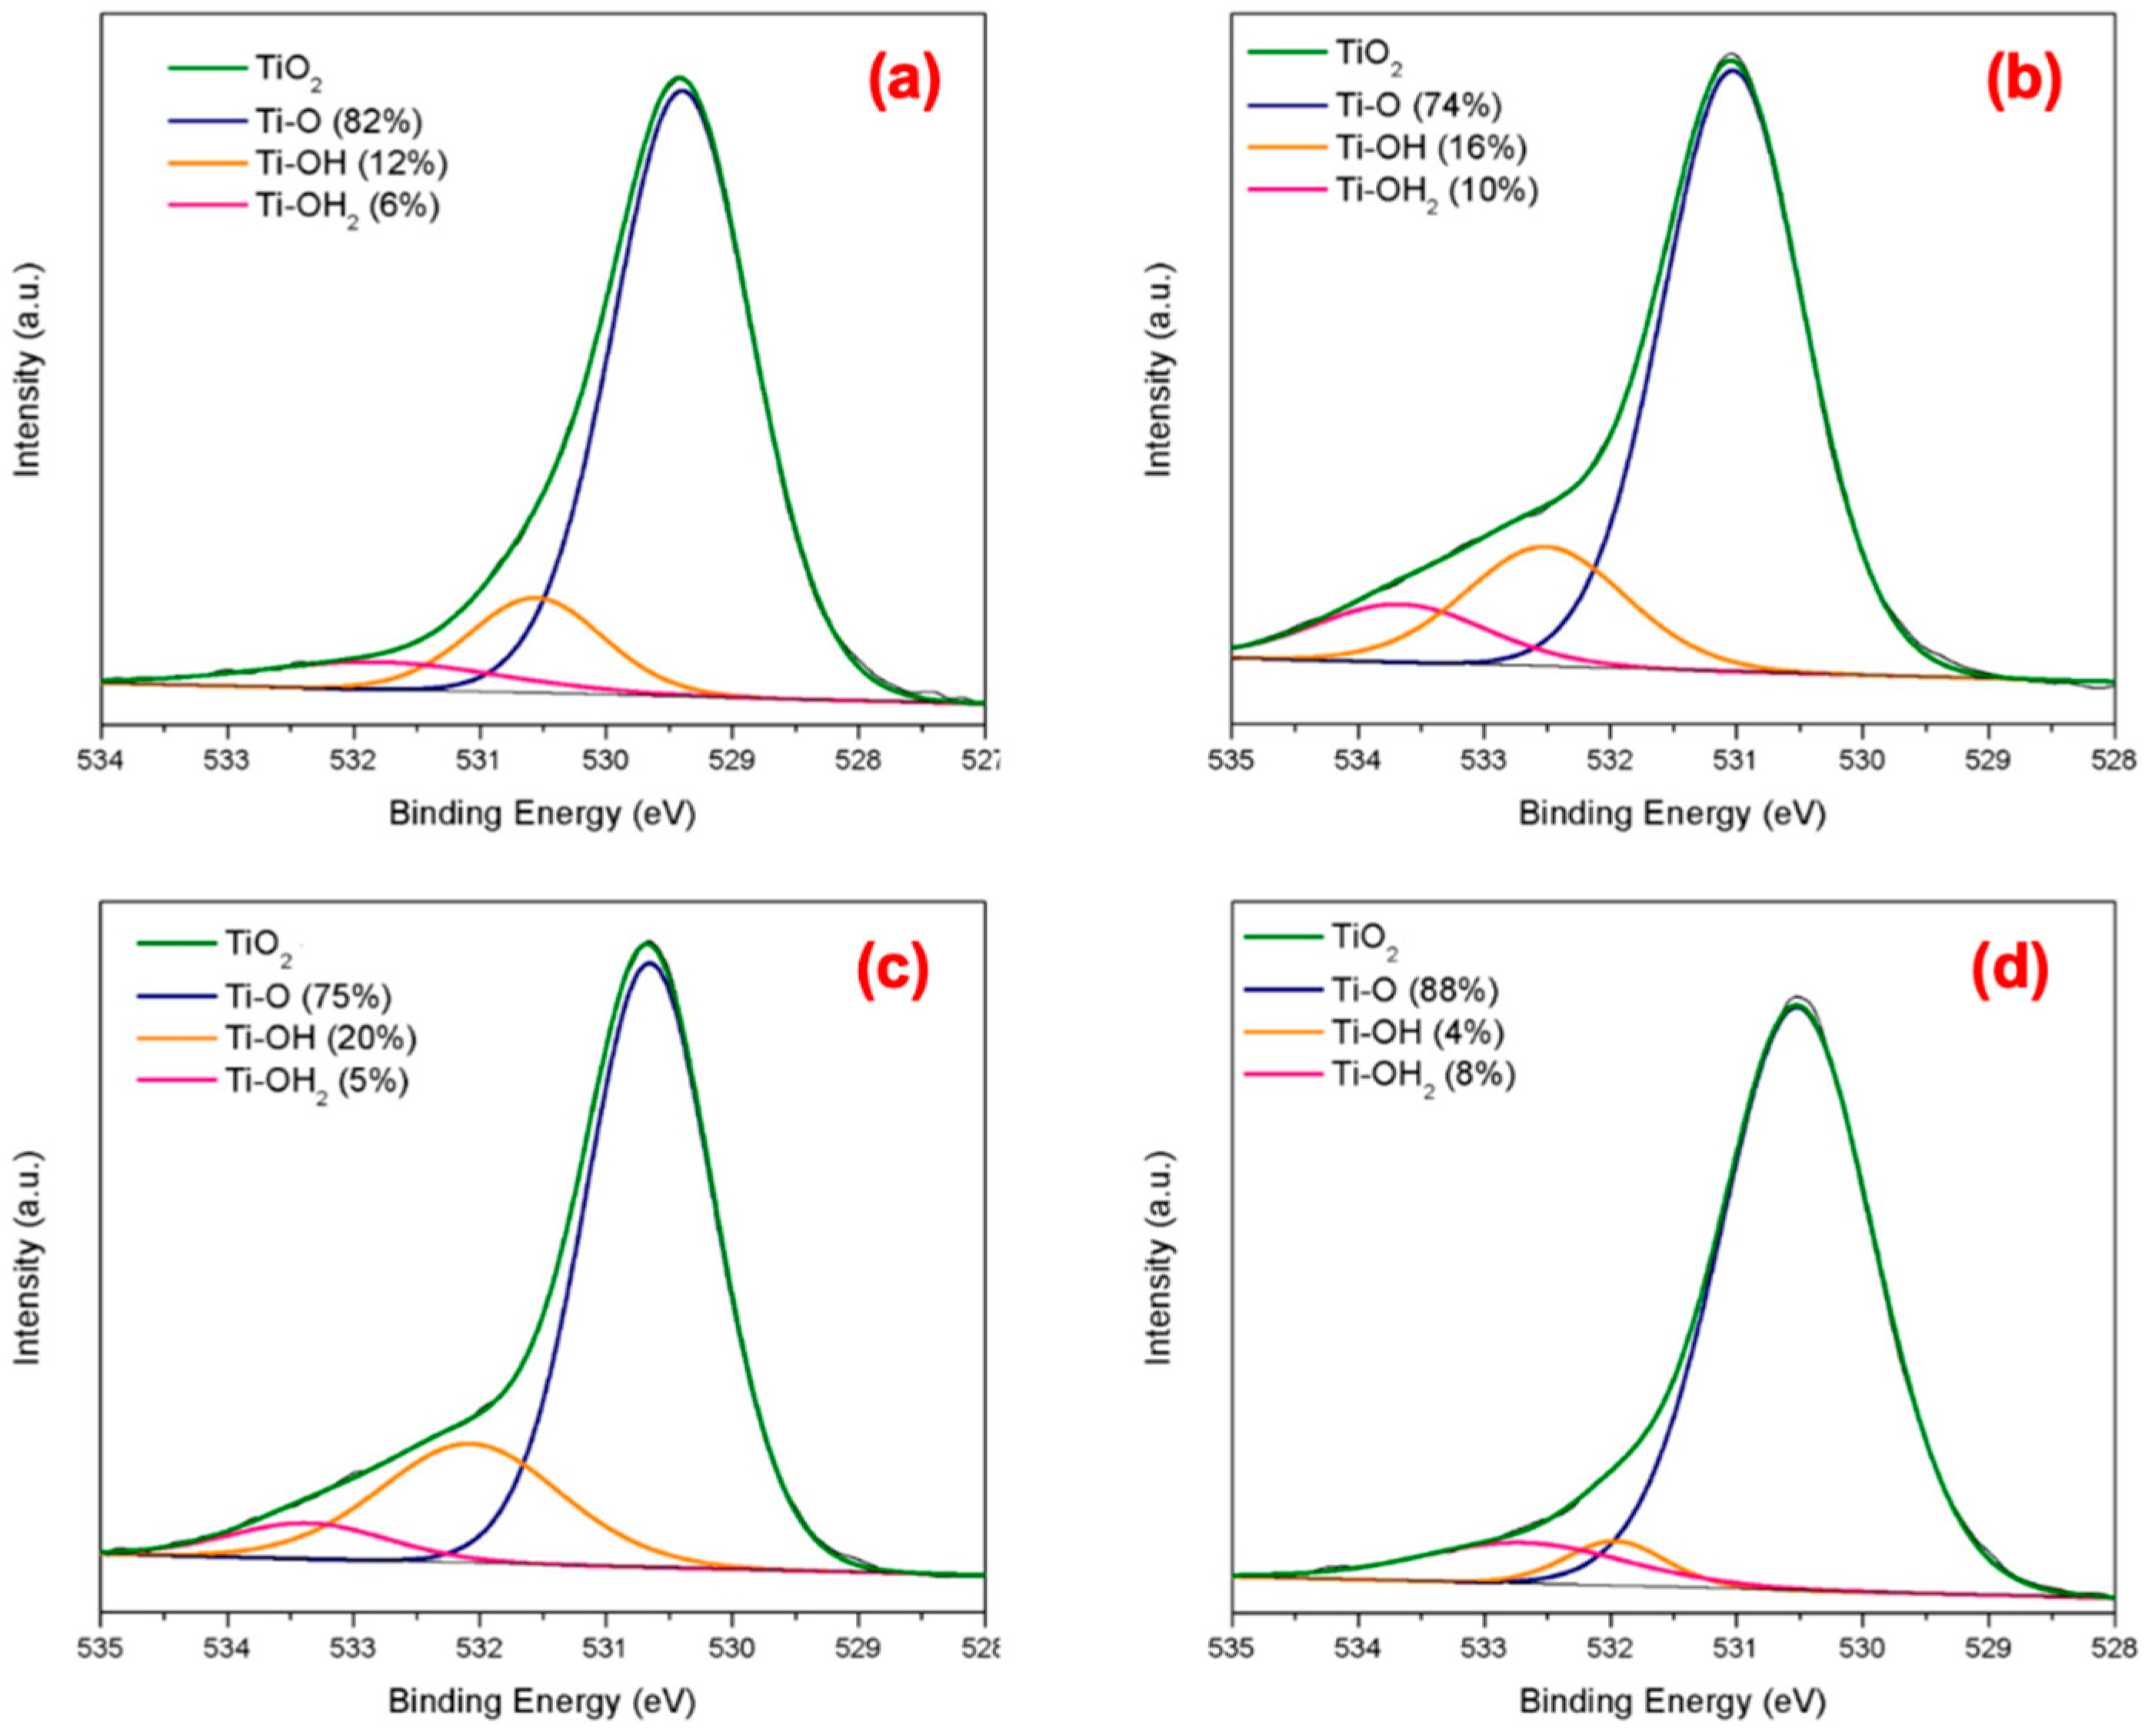
Figure 5a shows the UV-Vis absorbance spectra of the synthesized mixed-phase TiO2 nanoparticles, where it can be seen that the absorption edges of the A/b and P25 overlap at about λ = 420 nm, the B/r is at 415 nm wavelength, whereas the mixed phase R/b exhibits an extended light adsorption range with an edge at 455 nm, quite different than the other mixed phases (see Table 2). The UV range relates primarily to the band gap adsorption of each TiO2 nanophase but also possibly to surface morphology and interface states [38]. Each nanoTiO2, as a semiconductor, has a band gap energy, which can be determined by the Kubelka–Munk function by converting the reflectance measurements, R to the absorption coefficient, F(R) (Equations (S1)–(S2)) [31]. Figure 5b shows the Tauc plots where the (F(R) hv)1/2 is plotted versus the photon energy. The indirect band gap (Eg) is determined by extrapolating the linear segment of the spectrum [24]. The determined values for the different nanoTiO2 photocatalysts are summarized in Table 2 and compared to single-phase nanoTiO2 photocatalysts in Table S5.
The band gaps of the A/b and P25 (A/r) nanomaterials lie very close at 3.15 and 3.2 eV, respectively, while the band gap values for B/r and R/b TiO2 nanophases are at 3.0 and 2.9 eV, respectively. These values follow the same order with the single-phase nanoTiO2 values measured at 3.16 for A, 3.1 for B and 3.0 for R, which are at par with values published in literature: 3.21 (A), 3.13 (B) and 3.0 (R) [39]. The mixed-phase Eg values seem to be close to the values of the dominant phase in each case, but shifted to a slightly lower value by the presence of the minor phase.

Surface Properties

To evaluate the surface chemistry of the TiO2 nanocrystals, FTIR spectra were recorded for the three mixed-phase nanotitania photocatalysts and compared with P25 as shown in Figure S8. The broad band at around 3300 cm−1 is due to the stretching vibration modes of –OH groups on TiO2, while the band around 1650 cm−1 corresponds to the bending vibration of molecularly adsorbed H2O [18,31]. After determining the –OH% spectroscopic parameter as described in the SI (Table S3), the aqueous-synthesized nanotitania phases were revealed to be richer in hydroxyl content at 14%, 21% and 20% for A/b, B/r and R/b, respectively, compared with the high-temperature synthesized P25 at 7% [18,40].
In order to further quantify the –OH and H2O content of the different nanoTiO2 samples, they were characterized by Thermogravimetric Analysis (TGA) and the results are shown in Figure S9. As per the first significant weight loss region up to 120 °C corresponding to physically adsorbed molecular H2O, we have 5.8%, 5.4% and 6.8% H2O(ads) content for A/b, B/r and R/b, respectively, while P25 has only about 0.9%. Similarly, the second weight loss region at 120–600 °C attributed to chemically bound water and/or chemisorbed/covalent surface OH groups (Ti–OH/Ti–OH2) [31,34] gave 8%, 6.3% and 6.2% for A/b, B/r and R/b, respectively, vs. only 0.7% for P25. It is significant to note that the synthesized TiO2 NPs are endowed with almost 10% more water and hydroxyl groups absorbed (~ 12%) than the commercial P25 TiO2, that has only 1.5%.
XPS analysis was also implemented to probe the surface chemistry of newly synthesized TiO2 nanophases and compare them to P25. XPS analysis focused on the O 1s spectral region of the synthesized TiO2 is shown in Figure 6, which aimed to identify the various oxygen-containing surface species. All spectra feature the principal characteristic peak for the O 1s level at around 531 eV binding energy, while upon further deconvolution the other characteristic peaks were revealed [22,34]. The blue curve is the O bond with Ti, the orange curve is the -OH group bonded to Ti and the pink curve represents the remaining –OH groups. It is significant to note that the abundance% of Ti–OH was estimated at 12%, 16%, and 20% for the A/b, B/r and R/b, respectively, whereas that of the commercial P25 (Figure 6d) was only 4%. These values agree in terms of trend with the FTIR and TGA results presented in the previous paragraphs. Such a rich presence of surface-bound OH/H2O groups in the synthesized TiO2 NPs is very significant, as they have been proven to facilitate organic molecule adsorption via stabilizing H-bond formation that results in higher electron transport [34]—an important attribute for enhanced photocatalytic activity [8].

2.3. Photocatalytic Evaluation of Mixed-Phase TiO2 Nanocrystals

Adsorption

Methyl orange (MO), Scheme S2 is an established organic model compound used in organic photocatalytic degradation studies and therefore used to systematically investigate the photocatalytic activity of the different synthesized mixed-phase TiO2 NPs. In all tests, the commercial P25 was used as a reference material. The reactor set up used can be seen in Scheme S3.
A typical degradation curve (shown in Figure S12) has two parts reflecting: (I) the adsorption of MO during equilibration in the dark, followed (II) by the photo-degradation of MO under UV light illumination. Most of previous studies have ignored the role of adsorption on organic removal prior to onset of illumination typically presenting only the photo-degradation period (II) results in percent units [18,24,25,41]. As is shown in the present work, adsorption is an important aspect of the photocatalytic process that deserves proper characterization. Thus, as can be seen in Figure S13, there is a variable fraction of MO adsorbed on the different TiO2 NPs during equilibration in the dark. Adsorption is almost complete after 30 min and this time was selected as standard pre-illumination contacting in the dark. Interestingly, the predominantly anatase TiO2 nanocrystals (A/b) recorded a similar level of MO adsorption (~ 20%) with the P25 that is also predominantly anatase [10]. By contrast the other two aqueous-synthesized TiO2 materials (B/r and R/b) exhibited significantly larger adsorption capacity (~ 60%) than the A/b and P25. There is no correspondence of the amount of MO adsorbed to specific surface area, particle size or pore size if we take into account the data given in Table 2. Instead, the large adsorption capacity for B/r and R/b may reflect favorable adsorption on specific crystal planes associated with their 2-D and 1-D nanomorphology, respectively, as per TEM images in Figure 4.

Nano-TiO2 Pretreatment

Several experiments were performed to evaluate the impact of NP surface pretreatment on MO degradation efficiency. Various pretreatment processes were tried on B/r, such as ozone treatment to clean the NP surface of organic debris (Figure S14a), annealing at 500 °C (Figure S14b) and using the nanopowders either wet “as produced” (Figure S14c) or after washing and drying at 80 °C overnight. Simple drying of the nanoTiO2 products was determined to yield the best photocatalytic activity and thus the presented results are for pre-dried photocatalysts.

Mixed-Phase vs. Single-Phase or Physically Mixed Photocatalysts

Figure 7a shows photocatalytic tests that were conducted to evaluate the photocatalytic efficiency of the synthesized pure-phase anatase (HM-A), pure phase brookite (HM-B) and pure phase rutile (HM-R) TiO2 NPs (based on the synthesis conditions of Table 1) in comparison to the commercial P25 benchmark. Clearly the mixed-phase P25 nanoTiO2 outscored the pure-phase counterparts as established in previous works [10,21]. Of the three single-phase synthesized TiO2 nanomaterials, anatase and brookite exhibited similar photocatalytic activity (~ 80% MO degradation in 2.5 h) slightly better than pure-phase rutile (~ 67% MO degradation) compared to P25, that fully removed (100%) methyl orange in the same time.
The photocatalytic activity of mixed-phase P25 (predominantly anatase) was compared next to our mixed-phase A/b (predominantly anatase), as shown in Figure 7b. There we can see both photocatalysts to have equivalent photocatalytic performance, which appears to be due to the mixed-phase structure as proposed by Jiang et al. [15]. By contrast, an equivalent in composition to A/b physical mixture of 70% A and 30% B TiO2 did not show a synergistic effect but had a similar performance to the single-phase anatase (HM-A). Additional comparative data is presented in Figure S15. This provides further support to previous reports that mixed-phase anatase nanoparticles with minor rutile or brookite phase domains offer superior photocatalytic activity to single-phase alone or in physical mixture with other TiO2 nanophases [17,22,23,24,26,38].
Since the A/b mixed-phase nanoTiO2 material showed equivalent photocatalytic activity to P25, superior to single-phase nanoparticle mixtures, it was decided to tune the aqueous synthesis process conditions to produce two more varieties of mixed-phase NPs, namely the predominantly brookite, B/r, and the predominantly rutile, R/b. As was stated earlier, the literature on mixed-phase nanomaterials other than anatase mixed-phase nanoTiO2 photocatalysts is relatively limited, hence the interest in testing the new mixed-phase nanomaterials. The photodegradation kinetic curves of the three mixed-phase synthesized nanoTiO2 powders are shown in Figure 8b along P25 for comparison. Additionally, a control test without TiO2 was performed (photolysis) confirming that we have a heterogeneous photocatalytic process as in the absence of TiO2; only 5% degradation and no color difference was observed (Figure 8a). Interestingly, the integrated adsorption–photodegradation elimination of MO reached the same level for A/b, P25, and R/b (100% after 150 min), despite drastically different contributions from adsorption and photocatalysis. Thus, R/b (and similarly B/r) removed more than 60% of the methyl orange after 30 min in the dark via relatively fast adsorption, and the rest via slow photodegradation. Meanwhile A/b and P25 follow a different trend, with only 20%–25% of methyl orange adsorbed in the dark and the bulk eliminated via photodegradation in 2.5 h. In other words, the predominantly anatase heterostructured nanocrystals are shown to have higher photocatalytic activity than their rutile or brookite mixed-phase counterparts.
We have further ranked in terms of photocatalytic activity the different mixed-phase TiO2 nanocrystals by analyzing the UV illumination period kinetic data only (refer to Figure S16), i.e., excluding the removal of MO by adsorption under dark. The respective first-order plots and the extracted photocatalytic rate constants are presented in Figure 8b and Table S4. Their photocatalytic activity is in the order of predominantly anatase, A/b or A/r (P25) > predominantly rutile, R/b > predominantly brookite, B/r. In other words, predominantly anatase nanocrystals with intraparticle rutile or brookite domains by far are the strongest UV photocatalysts when it comes to the photo-oxidation of organic molecules like MO. While mixed-phase anatase/rutile TiO2, with the best example being P25 [15,22], is known to be highly photoactive, the present work has revealed that mixed-phase anatase/brookite can be equally photoactive. This is attributed to favorable conduction and valence band alignment permitting the preferential transfer of electrons from brookite to anatase [24], and holes from anatase to brookite, thus reducing the occurrence of the e cb - h vb + charge recombination as graphically depicted in Scheme 1 in the following section [22].

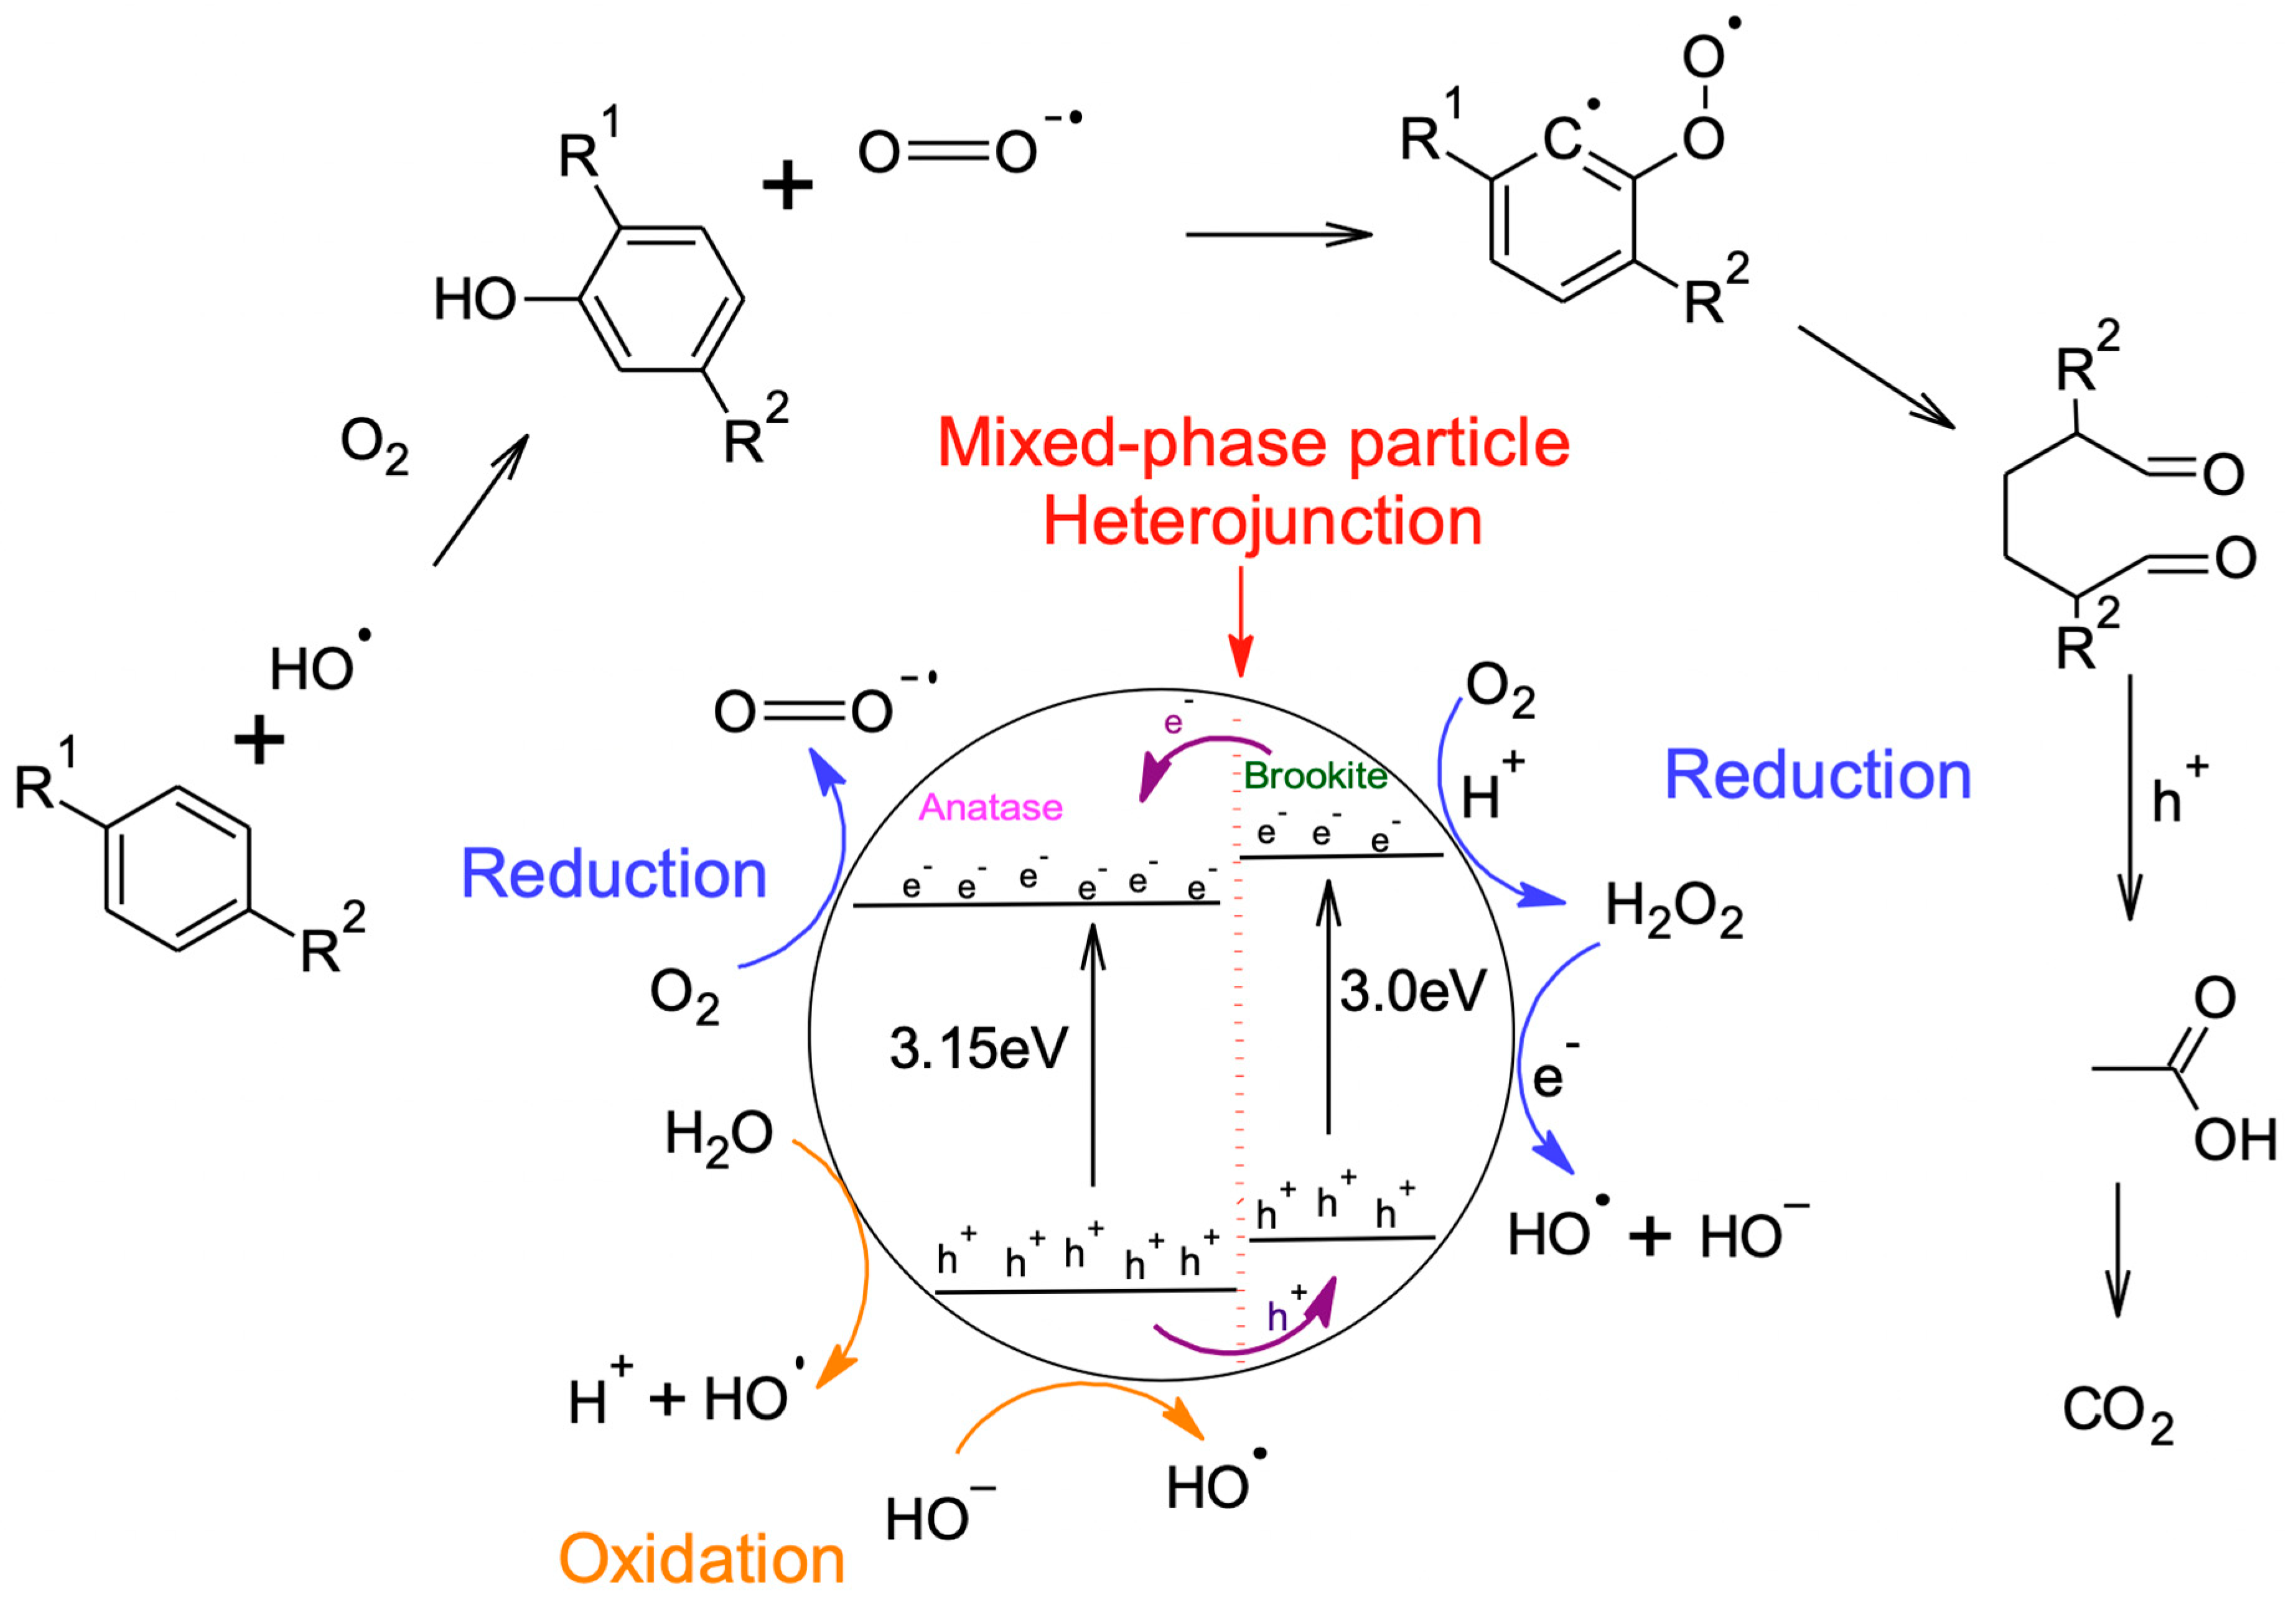
3. Discussion—Proposed Mechanism of Photocatalysis

The Scheme 1 provides a graphical description of a simplified photocatalytic mechanism to account for the degradation of MO under UV illumination of a mixed-phase A/b nanoparticle. Upon UV illumination of nanoTiO2, conduction band electrons ( e cb ) and valence band holes ( h vb + ) are generated, which in turn are implicated in reduction and oxidation reactions with surface chemical species. Charge separation is a prerequisite for maximizing the photocatalytic effect. Similarly to the anatase/rutile mixed-phase system [22], the anatase and brookite bandgaps (3.15 eV and 3.0 eV as per data in Table 2) form a favorable energy alignment at the heterojunction of A/b nanoparticle facilitating charge separation: electrons move from brookite CB to anatase CB and holes from anatase VB to brookite VB. The photo-generated h vb + can react with H2O and hydroxide ions in solution to produce hydroxyl radicals (OH), while the e cb can reduce oxygen to superoxide (O2−•), which can further yield H2O2 [42]. O2 has a significant dual role in the photocatalytic oxidation process, though the clear mechanism and role remains still speculative [7]. O2 acts as an e cb scavenger helping to minimize the recombination of the e cb and h vb + . Moreover, it participates in the degradation of the MO molecules by initiating the cleavage of the aromatic ring, as seen in Scheme 1 [7].
The overall methyl orange degradation reaction is given by Equation 1, according to which CO2 and H2O are the products. However, the reaction is much more complex, proceeding via several steps; the hydroxylation and oxidative opening of the aromatic ring to yield carboxylic acid from which CO2 forms via further oxidation, as documented elsewhere [7,9]—this is schematically shown in Scheme 1.
C 14 H 14 N 3 NaO 3 S   +   OH CO 2 + H 2 O

4. Materials and Methods

4.1. Reagents—Chemicals

For nano-titania synthesis, titanium tetrachloride, TiCl4 (ReagentPlus®, 99.9% trace metals basis, Sigma-Aldrich (Oakville, ON, Canada) was used. Commercial titanium dioxide, P25 was purchased from Evonik® (Maitland, ON, Canada). For pH adjustments, ammonium hydroxide, NH4OH (Fisher Scientific, Saint-Laurent, QC, Canada) was used. Methyl orange (C14H14N3NaO3S) anhydrous ethanol, (CH3CH2OH) used in nanoparticle washing, was purchased from Sigma-Aldrich. All the chemicals used during the experiments were of laboratory grade and all solutions were diluted with deionized (DI) water.

4.2. Synthesis of Mixed-Phase TiO2 Nanoparticles

Earlier studies in our research group report have led to the development of a green synthesis process for TiO2 nanoparticles based on forced hydrolytic precipitation conducted at a steady-state in a continuously stirred tank reactor, CSTR (2 L Applikon jacketed reactor, Delft, Netherlands) [31,32]. NanoTiO2 samples were collected only after steady-state operation was attained. This typically took 2 h in the case of A/b product, 4 h for B/r, and 5 h for R/b. The reactor set up and the synthesis flowchart are described in the Scheme S1 and Figure S1. The overall hydrolytic precipitation reaction is given by Equation (2).
TiCl 4 ( aq ) + 2 H 2 O TiO 2 ( s ) + 4 HCl ( aq )
Mixed phase NPs were synthesized by varying the parameters of solution pH (at < 1 with no base addition or controlled at a pre-selected value of 1–3), feed TiCl4 solution concentration (0.1–0.5 M), temperature (80 °C), agitation speed (400–800 rpm) and residence time (30–60 min). In a typical synthesis run, stock solution of 2 M TiCl4 was prepared in an ice-bath and kept refrigerated. For starting up, the reactor was filled first with 1 L “charge” solution of 0.01 M TiCl4, and then the feed TiCl4 solution was continuously pumped into it at a certain flow rate (33 mL/min or 16.5 mL/min for a residence time of 30 min and 60 min, respectively), while being agitated at 800 rpm unless otherwise stated. pH was controlled through the automatically regulated addition of NH4OH solution. Solution temperature was controlled with a recirculating oil bath. Upon discharge, the suspension was further neutralized by NH4OH at pH 3. The precipitates were washed by centrifuging trice with DI water and a fourth wash was done with anhydrous ethanol. The synthesized nanocrystals were dried overnight at 80 °C and then grounded in a mortar and pestle before being used in photocatalytic tests or for characterization.

4.3. Characterization Techniques

4.3.1. Photocatalyst Characterization

The crystal structure of the synthesized TiO2 was identified by powder X-ray Diffraction (XRD) using the Bruker D8 Discover X-ray diffractometer (Milton, ON, Canada) with Cu Kα source (k = 1.5406 Å) at 45 kV, by scanning between 20° to 80° (2θ) at a rate of 0.03° step/min. Data were collected using the Gadd software, while TOPAS software was used for background subtraction, smoothening, and quantitatively analyzing the diffraction patterns using the Le Bail method. The following JCPDS reference data patterns were used: for anatase JCPDS # 00-012-1272, brookite JCPDS #00-029-1360, and rutile JCPDS #00-001-1292. The crystallite size was determined using the Scherrer equation [32]. Scanning Electron Microscopy (SEM) analysis was performed using a Cold Field Emission (SU8230 by Hitachi, Toronto, ON, Canada) microscope. Transmission Electron Microscopy (TEM) with the Philips CM200 microscope (Markham, ON, Canada) was used at 200 kV to understand the orientation of the crystals and evaluate their nanosize features. The DigitalMigrograph software was used to analyze the HM-TEM images of the three mixed-phase nanoTiO2 materials to substantiate the co-existence of two phases in the nanograined particles. X-ray Photoelectron Spectroscopy (XPS) was performed on a Thermo Scientific K-Alpha XPS System (Saint-Laurent, QC, Canada) by scanning between 0–1350 eV in 1 eV steps. Raman spectroscopy was performed using a Renishaw Invia confocal microscope (Mississauga, ON, Canada) equipped with 514.5 nm Ar+ Laser as an excitation source. The optical grating was at 1800 L/mm, with a CCD detector at a 50× objective as a collection lens. Fourier-transform infrared spectroscopy (FTIR) was performed on Perkin Elmer Spectrum 400 FT Mid-IR (Woodbridge, ON, Canada) over 400–4000 cm−1 at a 0.5 cm−1 resolution. Thermogravimetric Analysis (TGA) was performed on a TA Instruments Q500 TGA (New Castle, DE, USA), with the TiO2 samples heated up to 600 °C at 10 °C/min under nitrogen gas.
The Brunauer–Emmett–Teller (BET) method was used with a Micromeritics TriStar 3000 apparatus (Mississauga, ON, Canada) to measure the specific surface area via the physical adsorption of 77 multi-points of nitrogen in an adsorption-desorption procedure involving 100 mg of synthesized TiO2 powder sample degassed with nitrogen gas at 70 °C overnight. The pore size distribution was determined using the Barret–Joyner–Halender (BJH) method via the adsorption branch of the isotherm [22]. The optical properties were determined via the Kubelka–Munk function applied to UV-Vis diffuse reflectance spectra collected on an Evolution 300 UV-visible spectrometer (Fisher Scientific, Saint-Laurent, QC, Canada) and a scanning wavelength from 300 to 600 nm. The band gap was determined using a linear extrapolation of the curve of the tauc plot. A mirror was used before each measurement for calibration.

4.3.2. Solution Characterization

Inductively Coupled Plasma-Atomic Emission Spectrometry (ICP-AES) was performed on a Thermo Jarrel Ash Trace Scan Machine (Thermo Fisher Scientific, Saint-Laurent, QC, Canada) to determine the Ti concentration of the TiCl4 solution. To determine the progress of MO degradation/removal, the UV-vis method was used. Absorption spectra of methyl orange were obtained using the Perkin-Elmer Lambda Bio 20 UV-Vis spectrometer (Woodbridge, ON, Canada) with a quartz cuvette of 1 cm path length between the 220 to 600 nm wavelength range. Deionized water was used as a blank. Beer’s Law was used to convert absorption data to concentration, as shown in Figure S11.

4.4. Evaluation of Photocatalytic Activity

The synthesized TiO2 NPs were evaluated and compared to commercial Evonik P25 photocatalyst in terms of their photocatalytic activity by measuring the photo-degradation of MO by UV light irradiation. The experiments were performed in a 1 L custom-made closed cylindrical vessel under UV light irradiation. As the UV-Vis light source, a 10 W output Ultraviolet immersed type lamp from the Atlantic Ultraviolet Corporation (Hauppauge, NY, USA) with a wavelength range of 200–280 nm and peak at 254 nm was used. The reactor configuration equipped with a pH probe can be seen in Scheme S3. The solution was circulated with the aid of a magnetic stirrer. The whole reactor was placed in a black box. The experiments were conducted at room temperature. All the experiments were carried out in triplicates, characteristic reproducibility data is shown in Figure S17.
In a typical experiment, 1 g of the synthesized NPs was dispersed in 500 mL DI water and sonicated for 20 min. Next, 500 mL MO aqueous solution was added thereafter to obtain 1 L of starting solution with 25 mg/L MO concentration and a catalyst loading of 1 g/L. The suspension was magnetically agitated at 600 rpm in the dark for 30 min to attain adsorption equilibration prior to onset of illumination. Samples (5 mL) were taken at regular intervals for a total illumination time of 4 h. Control experiments were done under the same conditions without TiO2 catalyst. All samples were centrifuged and filtered through a 0.22 μm Millipore cellulose filter before UV-Vis spectrometer analysis. The photo-degradation efficiency was determined with the aid of Equation 3—where A0 is the absorption peak of methyl orange at 464 nm at time 0, and At is the peak at different irradiation time.
D % = ( A 0 A t A 0 ) × 100

5. Conclusions

Tunable composition mixed-phase TiO2 nanoparticles were synthesized by a green hydrolytic process by varying parameters such as pH, TiCl4 concentration and residence time in a continuous stirred tank reactor operating at 80 °C. Synthesized nanoparticles with anatase, brookite and rutile in different percentages were characterized and tested as photocatalysts for the heterogeneous photo-degradation of the organic model pollutant, methyl orange (MO), using immersed UV light irradiation. The formation of mixed-phase TiO2 nanocrystals was confirmed by XRD and Raman spectroscopy, XPS and HR-TEM/SEAD microscopic analysis. The mixed-phase nanoTiO2 particles were shown to be nanograined and have different d-spacing lattice profiles within <4 nm size domains that may be taken as indirect evidence of heterostructuring, but further work should be undertaken to provide a definitive answer. BET showed the aqueous-synthesized NPs to have double SSA (~ 110 m2 g−1) compared to P25 and higher hydroxyl content. These properties impacted the removal of MO by adsorption but not by photocatalysis. When it comes to photocatalytic activity per se, however, it has been concluded that intraparticle mixed-phase TiO2 nanocrystals are superior to single-phase nanoTiO2 and/or physical mixtures of single-phase nanoparticles. The photocatalytic activity order was established to be from top to bottom: predominantly anatase, A/b or A/r (P25) > predominantly rutile, R/b > predominantly brookite, B/r > single-phase A or single-phase B or physical mixture of A + B. In other words, predominantly anatase nanocrystals with brookite or rutile nanodomains by far are the strongest UV photocatalysts when it comes to the photo-oxidation of organic molecules like MO. The synergistic photocatalytic effect of the mixed-phase A/b nanocrystals is attributed to favorable energy band alignment.

Supplementary Materials

The following are available online at https://www.mdpi.com/2073-4344/10/4/407/s1, Figure S1: Flowchart of synthesis of mixed-phase TiO2 nanoparticles, Figure S2: SEM images of synthesized TiO2 nanoparticles; (a) anatase major, A/b, (b) brookite major, B/r, (c) rutile major, R/b, and (d) commercial P25; Figure S3: High resolution TEM image of nanograined particles of the mixed-phase A/b nanoTiO2 photocatalyst with d-spacing lattice profiles at three explored areas; Figure S4: High resolution TEM image of nanograined particles of the mixed-phase B/r nanoTiO2 photocatalyst with d-spacing lattice profiles at three explored areas; Figure S5: High resolution TEM image of nanograined particles of the mixed-phase R/b nanoTiO2 photocatalyst with d-spacing lattice profiles at three explored areas; Figure S6: N2 adsorption–desorption BET isotherms of synthesized TiO2 nanoparticles (a) anatase major, A/b, (b) brookite major, B/r, (c) rutile major, R/b, and (d) commercial P25; insets show the BJH pore size distributions; Figure S7: Raman full spectra for the synthesized TiO2 mixed phases; (a) anatase major, A/b, (b) brookite major, B/r and (c) rutile major, R/b; Figure S8: FTIR spectra of aqueous-synthesized mixed-phase TiO2 nanoparticles and P25; (a) commercial P25, (b) anatase major, A/b, (c) brookite major, B/r, and (d) rutile major, R/b; Figure S9: TGA analysis: weight percent (orange curve) and derivative of weight percent (blue curve) of (a) anatase major, A/b, (b) brookite major, B/r, (c) rutile major, R/b, and (d) commercial P25; Figure S10: Custom-made photo reactor with immersed UV light lamp used in methyl orange photo-degradation tests: (a) before light illumination; (b) after 2 h photo-illumination. UV lamp characteristics: 10 W output, wavelength range of 200–280 nm, peak at 254 nm, power density of 30 mW/cm2, by Atlantic Ultraviolet Corporation; Figure S11: (a) Example of UV-Vis spectra of methyl orange obtained at different UV illumination times to evaluate the photocatalytic degradation efficiency of one of the synthesized mixed-phase TiO2 material (brookite major, B/r). Conditions: catalyst loading 1 g TiO2/L, CMO: 25 mg/L, dark equilibrium 30 min and (b) Beer’s law calibration curve for methyl orange; Figure S12: Typical integrated adsorption and photo-degradation curve; Figure S13: Percent adsorption of MO on anatase major, A/b, brookite major, B/r, rutile major, R/b, and commercial P25 during equilibration in the dark for 4 h. Conditions: catalyst loading 1 g TiO2/L, CMO: 25 mg/L; Figure S14: Evaluation of the effect of NP pretreatment on photocatalytic degradation of methyl orange with UV light illumination; (a) ozone treatment, (b) wet before drying, (c) annealing treatment. Conditions; nanoTiO2 used dry B/r; catalyst loading 1 g TiO2/L, CMO: 25 mg/L; Figure S15: Photo-assisted elimination of methyl orange with different TiO2 nanophase particles under dark (−30 to 0 min) and UV illumination (0 to 240 min): comparison of aqueous-synthesized pure phase anatase (HM-A), brookite (HM-B), physical mixture of aqueous-synthesized pure anatase and brookite (70% A/30% B), and aqueous-synthesized mixed-phase (A/b, 70% A/30% B) nanoTiO2. Conditions; catalyst loading 1 g TiO2/L, CMO: 25 mg/L. UV lamp characteristics: 10 W output, wavelength range of 200–280 nm, peak at 254 nm, by Atlantic Ultraviolet Corporation; Figure S16: Kinetic analysis of the illumination part (dark period excluded) for the different nanoTiO2 photodegradation curves (refer to Figure S9a): (a) C/Co vs. time, and (b) ln (C/Co) vs t; Figure S17: Characteristic reproducibility data of photocatalytic tests for (a) commercial P25 and (b) synthesized mixed phase B/r TiO2. Conditions: catalyst loading 1 g TiO2/L, CMO: 25 mg/L; Figure S18: Band gap calculation process, example of anatase major, A/b TiO2 nanomaterial: (a) UV-Vis absorbance spectrum and (b) tauc plot, a linear extrapolation of the curve determines the band gap; Table S1: Synthesis conditions favoring mixed-phase TiO2 of variable composition; Table S2: Reproducibility of the composition of the synthesized mixed-phase nanoTiO2 materials; Table S3:% OH content derived from determination of the –OH% spectroscopic parameter; Table S4: First-order* photocatalytic reaction rate constants of synthesized mixed-phase nanoTiO2; Table S5: Bandgap comparison of synthesized pure-phase Anatase, Brookite and Rutile TiO2 nanoparticles with synthesized mixed-phase TiO2 nanoparticles; A/b, B/r, R/b; Scheme S1: Synthesis of TiO2 in continuous stirred tank reactor by forced hydrolysis of aqueous TiCl4 solution; Scheme S2: Simplified molecular structure of methyl orange; Scheme S3: Scheme representation of the UV photocatalytic reactor in a box.

Author Contributions

K.C. performed the bulk of the work, data analysis and prepared the manuscript. F.G. assisted with the synthesis experiments and S.E. with the Raman analysis at Université de Montréal. G.P.D. directed the work and the revision of the manuscript. All authors have read and agreed to the published version of the manuscript.

Funding

This research was funded by Natural Sciences & Engineering Research Council of Canada, grant number RGPIN-2017-04664”. K. Chalastara and G. P. Demopoulos acknowledge additional support by McGill Engineering Doctoral Award (MEDA) and McGill Sustainability Systems Initiative (MSSI) programs.

Acknowledgments

K.C. is thankful to fellow lab members, as well as N. Brodusch and D. Liu for their assistance with SEM and TEM image collection, respectively.

Conflicts of Interest

The authors declare no conflicts of interest.

References

  1. Fujishima, A.; Honda, K. Electrochemical Photolysis of Water at a Semiconductor Electrode. Nature 1972, 238, 37–38. [Google Scholar] [CrossRef] [PubMed]
  2. Keane, D.A.; McGuigan, K.G.; Ibanez, P.F.; Polo-Lopez, M.I.; Byrne, J.A.; Dunlop, P.S.M.; O’Shea, K.; Dionysiou, D.D.; Pillai, S.C. Solar photocatalysis for water disinfection: Materials and reactor design. Catal. Sci. Technol. 2014, 4, 1211–1226. [Google Scholar] [CrossRef] [Green Version]
  3. Fujishima, A.; Zhang, X.; Tryk, D.A. TiO2 photocatalysis and related surface phenomena. Surf. Sci. Rep. 2008, 63, 515–582. [Google Scholar] [CrossRef]
  4. Likodimos, V.; Chrysi, A.; Calamiotou, M.; Fernández-Rodríguez, C.; Doña-Rodríguez, J.; Dionysiou, D.; Falaras, P. Microstructure and charge trapping assessment in highly reactive mixed phase TiO 2 photocatalysts. Appl. Catal. B Environ. 2016, 192, 242–252. [Google Scholar] [CrossRef]
  5. Lee, K.E.; Charbonneau, C.; Demopoulos, G.P. Thin single screen-printed bifunctional titania layer photoanodes for high performing DSSCs via a novel hybrid paste formulation and process. J. Mater. Res. 2013, 28, 480–487. [Google Scholar] [CrossRef]
  6. Sussman, M.J.; Yasin, A.; Demopoulos, G.P. On the complex interplay of crystallinity and surface area effects on Li-ion intercalation and pseudocapacitive storage properties of nanocrystalline anatase. J. Power Sources 2014, 272, 58–67. [Google Scholar] [CrossRef]
  7. Pang, X.B.; Chen, C.C.; Ji, H.W.; Che, Y.K.; Ma, W.H.; Zhao, J.C. Unraveling the Photocatalytic Mechanisms on TiO2 Surfaces Using the Oxygen-18 Isotopic Label Technique. Molecules 2014, 19, 16291–16311. [Google Scholar] [CrossRef] [Green Version]
  8. Odling, G.; Robertson, N. Why is Anatase a Better Photocatalyst than Rutile? The Importance of Free Hydroxyl Radicals. ChemSusChem 2015, 8, 1838–1840. [Google Scholar] [CrossRef]
  9. Tran, H.T.T.; Kosslick, H.; Ibad, M.F.; Fischer, C.; Bentrup, U.; Vuong, T.H.; Nguyen, L.Q.; Schulz, A. Photocatalytic Performance of Highly Active Brookite in the Degradation of Hazardous Organic Compounds Compared to Anatase and Rutile. Appl. Catal. B Environ. 2017, 200, 647–658. [Google Scholar] [CrossRef]
  10. Ohtani, B.; Prieto-Mahaney, O.; Li, D.; Abe, R. What is Degussa (Evonik) P25? Crystalline composition analysis, reconstruction from isolated pure particles and photocatalytic activity test. J. Photochem. Photobiol. A Chem. 2010, 216, 179–182. [Google Scholar] [CrossRef] [Green Version]
  11. Wang, F.L.; Ho, J.H.; Jiang, Y.J.; Amal, R. Tuning Phase Composition of TiO2 by Sn4+ Doping for Efficient Photocatalytic Hydrogen Generation. Acs Appl. Mater. Interfaces 2015, 7, 23941–23948. [Google Scholar] [CrossRef] [PubMed]
  12. Choudhury, B.; Borah, B.; Choudhury, A. Extending photocatalytic activity of TiO2 nanoparticles to visible region of illumination by doping of cerium. Photochem. Photobiol. 2012, 88, 257–264. [Google Scholar] [CrossRef] [PubMed]
  13. Pelaez, M.; Nolan, N.T.; Pillai, S.C.; Seery, M.K.; Falaras, P.; Kontos, A.G.; Dunlop, P.S.M.; Hamilton, J.W.J.; Byrne, J.A.; O’Shea, K.; et al. A review on the visible light active titanium dioxide photocatalysts for environmental applications. Appl. Catal. B Environ. 2012, 125, 331–349. [Google Scholar] [CrossRef] [Green Version]
  14. Zhao, H.; Liu, L.; Andino, J.M.; Li, Y. Bicrystalline TiO2 with controllable anatase–brookite phase content for enhanced CO2 photoreduction to fuels. J. Mater. Chem. A 2013, 1, 8209. [Google Scholar] [CrossRef] [Green Version]
  15. Jiang, X.; Manawan, M.; Feng, T.; Qian, R.; Zhao, T.; Zhou, G.; Kong, F.; Wang, Q.; Dai, S.; Pan, J.H. Anatase and rutile in evonik aeroxide P25: Heterojunctioned or individual nanoparticles? Catal. Today 2018, 300, 12–17. [Google Scholar] [CrossRef]
  16. Ju, M.G.; Sun, G.; Wang, J.; Meng, Q.; Liang, W. Origin of high photocatalytic properties in the mixed-phase TiO2: A first-principles theoretical study. ACS Appl Mater Interfaces 2014, 6, 12885–12892. [Google Scholar] [CrossRef] [PubMed]
  17. Cong, S.; Xu, Y. Explaining the High Photocatalytic Activity of a Mixed Phase TiO2: A Combined Effect of O2 and Crystallinity. J. Phys. Chem. C 2011, 115, 21161–21168. [Google Scholar] [CrossRef]
  18. Haque, F.Z.; Nandanwar, R.; Singh, P. Evaluating photodegradation properties of anatase and rutile TiO2 nanoparticles for organic compounds. Optik 2017, 128, 191–200. [Google Scholar] [CrossRef]
  19. Di Paola, A.; Bellardita, M.; Palmisano, L. Brookite, the least known TiO2 photocatalyst. Catalysts 2013, 3, 36–73. [Google Scholar] [CrossRef] [Green Version]
  20. Gai, L.; Duan, X.; Jiang, H.; Mei, Q.; Zhou, G.; Tian, Y.; Liu, H. One-pot synthesis of nitrogen-doped TiO2 nanorods with anatase/brookite structures and enhanced photocatalytic activity. CrystEngComm 2012, 14, 7662–7671. [Google Scholar] [CrossRef]
  21. Doudrick, K.; Monzón, O.; Mangonon, A.; Hristovski, K.; Westerhoff, P. Nitrate Reduction in Water Using Commercial Titanium Dioxide Photocatalysts (P25, P90, and Hombikat UV100). J. Environ. Eng. 2012, 138, 852–861. [Google Scholar] [CrossRef]
  22. Luo, Z.; Poyraz, A.S.; Kuo, C.H.; Miao, R.; Meng, Y.T.; Chen, S.Y.; Jiang, T.; Wenos, C.; Suib, S.L. Crystalline Mixed Phase (Anatase/Rutile) Mesoporous Titanium Dioxides for Visible Light Photocatalytic Activity. Chem. Mater. 2015, 27, 6–17. [Google Scholar] [CrossRef]
  23. Ide, Y.; Inami, N.; Hattori, H.; Saito, K.; Sohmiya, M.; Tsunoji, N.; Komaguchi, K.; Sano, T.; Bando, Y.; Golberg, D. Remarkable charge separation and photocatalytic efficiency enhancement through interconnection of TiO2 nanoparticles by hydrothermal treatment. Angew. Chem. Int. Ed. 2016, 55, 3600–3605. [Google Scholar] [CrossRef] [PubMed]
  24. El-Sheikh, S.M.; Khedr, T.M.; Zhang, G.; Vogiazi, V.; Ismail, A.A.; O’Shea, K.; Dionysiou, D.D. Tailored synthesis of anatase–brookite heterojunction photocatalysts for degradation of cylindrospermopsin under UV–Vis light. Chem. Eng. J. 2017, 310, 428–436. [Google Scholar] [CrossRef] [Green Version]
  25. Boehme, M.; Ensinger, W. Mixed Phase Anatase/rutile Titanium Dioxide Nanotubes for Enhanced Photocatalytic Degradation of Methylene-blue. Nano Micro Lett. 2011, 3, 236–241. [Google Scholar] [CrossRef] [Green Version]
  26. Tay, Q.L.; Liu, X.F.; Tang, Y.X.; Jiang, Z.L.; Sum, T.C.; Chen, Z. Enhanced Photocatalytic Hydrogen Production with Synergistic Two-Phase Anatase/Brookite TiO2 Nanostructures. J. Phys. Chem. C 2013, 117, 14973–14982. [Google Scholar] [CrossRef]
  27. Benehkohal, N.P.; Gomez, M.A.; Gauvin, R.; Demopoulos, P.G. Enabling aqueous electrophoretic growth of adherent nanotitania mesoporous films via intrafilm cathodic deposition of hydrous zinc oxide. Electrochim. Acta 2013, 87, 169–179. [Google Scholar] [CrossRef]
  28. Caramazana-González, P.; Dunne, P.W.; Gimeno-Fabra, M.; Zilka, M.; Ticha, M.; Stieberova, B.; Freiberg, F.; McKechnie, J.; Lester, E.H. Assessing the life cycle environmental impacts of titania nanoparticle production by continuous flow solvo/hydrothermal syntheses. Green Chem. 2017, 19, 1536–1547. [Google Scholar] [CrossRef] [Green Version]
  29. Atitar, M.F.; Ismail, A.A.; Al-Sayari, S.; Bahnemann, D.; Afanasev, D.; Emeline, A. Mesoporous TiO2 nanocrystals as efficient photocatalysts: Impact of calcination temperature and phase transformation on photocatalytic performance. Chem. Eng. J. 2015, 264, 417–424. [Google Scholar] [CrossRef]
  30. Atitar, M.F.; Ismail, A.; Dillert, R.; Bahnemann, D.W. Photodegradation of herbicide imazapyr and phenol over mesoporous bicrystalline phases TiO2: A kinetic study. Catalysts 2019, 9, 640. [Google Scholar] [CrossRef] [Green Version]
  31. Yasin, A.; Guo, F.Q.; Demopoulos, G.P. Continuous-reactor, pH-controlled synthesis of multifunctional mesoporous nanocrystalline anatase aggregates. Chem. Eng. J. 2016, 287, 398–409. [Google Scholar] [CrossRef]
  32. Yasin, A.; Guo, F.; Sussman, M.J.; Gauvin, R.; Demopoulos, G.P. Steady-State, Scalable Production of Mesoporous Rutile and Brookite Particles and Their Use in Energy Conversion and Storage Cells. ChemNanoMat 2016, 2, 980–988. [Google Scholar] [CrossRef]
  33. Sussman, M.J.; Celikin, M.; Yasin, A.; Demopoulos, G.P. Mesoporous brookite nanoplatelets with superior lithium-ion intercalation stability. Electrochim. Acta 2014, 138, 215–223. [Google Scholar] [CrossRef]
  34. Lee, K.E.; Gomez, M.A.; Charbonneau, C.; Demopoulos, G.P. Enhanced surface hydroxylation of nanocrystalline anatase films improves photocurrent output and electron lifetime in dye sensitized solar cell photoanodes. Electrochim. Acta 2012, 67, 208–215. [Google Scholar] [CrossRef]
  35. Shirolkar, M.M.; Phase, D.; Sathe, V.; Rodriguez-Carvajal, J.; Choudhary, R.J.; Kulkarni, S.K. Relation between crystallinity and chemical nature of surface on wettability: A study on pulsed laser deposited TiO2 thin films. J. Appl. Phys. 2011, 109, 123512. [Google Scholar] [CrossRef]
  36. Iliev, M.N.; Hadjiev, V.G.; Litvinchuk, A.P. Raman and infrared spectra of brookite (TiO2): Experiment and theory. Vib. Spectrosc. 2013, 64, 148–152. [Google Scholar] [CrossRef]
  37. Hussain, M.; Ceccarelli, R.; Marchisio, D.L.; Fino, D.; Russo, N.; Geobaldo, F. Synthesis, characterization, and photocatalytic application of novel TiO2 nanoparticles. Chem. Eng. J. 2010, 157, 45–51. [Google Scholar] [CrossRef]
  38. Zhang, X.R.; Lin, Y.H.; He, D.Q.; Zhang, J.F.; Fan, Z.Y.; Xie, T.F. Interface junction at anatase/rutile in mixed-phase TiO2: Formation and photo-generated charge carriers properties. Chem. Phys. Lett. 2011, 504, 71–75. [Google Scholar] [CrossRef]
  39. Reyes-Coronado, D.; Rodríguez-Gattorno, G.; Espinosa-Pesqueira, M.; Cab, C.; de Coss, R.D.; Oskam, G. Phase-pure TiO2 nanoparticles: Anatase, brookite and rutile. Nanotechnology 2008, 19, 145605. [Google Scholar] [CrossRef]
  40. Charbonneau, C.; Gauvin, R.; Demopoulos, G. Aqueous solution synthesis of crystalline anatase nanocolloids for the fabrication of DSC photoanodes. J. Electrochem. Soc. 2011, 158, H224–H231. [Google Scholar] [CrossRef]
  41. López-Muñoz, M.J.; Revilla, A.; Alcalde, G. Brookite TiO2-based materials: Synthesis and photocatalytic performance in oxidation of methyl orange and As(III) in aqueous suspensions. Catal. Today 2015, 240, 138–145. [Google Scholar] [CrossRef]
  42. Sheng, H.; Ji, H.; Ma, W.; Chen, C.; Zhao, J. Direct four-electron reduction of O2 to H2O on TiO2 surfaces by pendant proton relay. Angew. Chem. Int. Ed. 2013, 52, 9686–9690. [Google Scholar] [CrossRef] [PubMed]
Figure 1. XRD patterns of aqueous-synthesized mixed-phase nanoTiO2 materials; anatase major, A/b, brookite major, B/r and rutile major phase, R/b. Insets I 1–3 show the corresponding deconvoluted spectra.
Catalysts 10 00407 g001
Figure 2. Raman spectra of synthesized mixed-phase nanoTiO2 photocatalysts; (a) anatase major, A/b, (b) brookite major, B/r (c) rutile major phase R/b and (d) commercial P25.
Catalysts 10 00407 g002
Figure 3. TEM analysis of the synthesized mixed-phase TiO2 nanoparticles; (i) TEM images, (ii) HR-TEM images, and (iii) SAED patterns; (A) anatase major, A/b, (B) brookite major, B/r, (R) rutile major, R/b, and (P) commercial P25.
Catalysts 10 00407 g003
Figure 4. High-resolution TEM image of nanograined particles of the mixed-phase A/b nanoTiO2 photocatalyst (a) and d-spacing lattice profile sampling (b) with evidence of phase co-existence within 2–3 nm space.
Catalysts 10 00407 g004
Figure 5. (a) UV-Vis absorbance spectra and (b) Tauc plots showing the band gap energies of the synthesized mixed-phase nanoTiO2 photocatalysts.
Catalysts 10 00407 g005
Figure 6. XPS spectra for the O 1s spectral region; (a) anatase major, A/b, (b) brookite major, B/r, (c) rutile major, R/b, and (d) commercial P25.
Catalysts 10 00407 g006
Figure 7. Photo-assisted elimination of methyl orange with different TiO2 nanophase particles under dark (−30 to 0 min) and UV illumination (0 to 240 min) conditions: (a) comparison of aqueous-synthesized pure phase anatase (HM-A), brookite (HM-B), and rutile (HM-R) with commercial P25; and (b) comparison of aqueous-synthesized pure phase anatase (HM-A), physical mixture of aqueous-synthesized pure anatase and brookite (70% A/30% B), and aqueous-synthesized mixed-phase (A/b, 70% A/30% B) nanoTiO2. Conditions; catalyst loading 1 g TiO2/L, CMO: 25 mg/L. UV lamp characteristics: 10 W output, wavelength range of 200–280 nm, peak at 254 nm, power density of 30 mW/cm2, by Atlantic Ultraviolet Corporation.
Catalysts 10 00407 g007
Figure 8. (a) Combined adsorption-photocatalytic elimination curves of methyl orange for three mixed-phase TiO2 nanomaterials with the commercial P25 and with no catalyst loading and (b) First-order photocatalytic kinetic plots (adsorption period excluded). Conditions; catalyst loading 1 g TiO2/L, CMO: 25 mg/L.
Catalysts 10 00407 g008
Scheme 1. Simplified mechanistic representation of the photocatalytic degradation of methyl orange on a mixed-phase A/b TiO2 nanoparticle under UV illumination. Note for clarity the adsorption of MO is not shown.
Catalysts 10 00407 sch001
Table 1. Mixed-phase nanoTiO2 produced under different conditions; comparison with the standard single-phase anatase, brookite, and rutile nanomaterials.
Parameter Single-Phase Anatase
(HM-A)
A/bSingle-Phase Brookite
(HM-B)
B/rSingle-Phase Rutile
(HM-R)
R/b
Product
Feed solution [TiCl4]0.1 M0.1 M0.1 M0.1 M0.5 M0.5 M
Temperature80 °C80 °C80 °C80 °C80 °C80 °C
Residence time30 min30 min60 min60 min60 min30 min
Agitation800 rpm800 rpm800 rpm400 rpm800 rpm400 rpm
pHsteady-state
Base
pH 3
NH4OH
pH 2
NH4OH
0.7–0.8
No
0.7–0.8
No
<0.5
No
<0.5
No
Phase (%)XRDXRDRamanXRDXRDRamanXRDXRDRaman
Anatase10069 ± 160-12 ± 210---
Brookite-31 ± 1359463 ± 160-37 ± 240
Rutile--5625 ± 13010063 ± 260
Table 2. Phase composition and properties of synthesized mixed-phase nanoTiO2 products; BET surface area, BJH pore size, estimated band gap energy, Eg, nanoparticle diameter as determined from TEM images.
TiO2 ProductsBET Surface Area (m2 g−1)BJH Pore Size (nm)Size * (nm)Eg (eV)Adsorption Edge Wavelength, λ (nm)
A/b122 ± 12455–103.15422
B/r110 ± 72650–1503.01415
R/b92 ± 54.3200–5002.9455
Commercial P2549 ± 24020–303.2425
* as determined from TEM images (see Figure 3).

