Article

Facile Synthesis of Amorphous C3N4ZnxOy (x, y = 0.32–1.10) with High Photocatalytic Efficiency for Antibiotic Degradation

Physics Department & Shanghai Key Laboratory of Magnetic Resonance, School of Physics and Electronic Science, East China Normal University, North Zhongshan Road 3663, Shanghai 200062, China
*
Authors to whom correspondence should be addressed.
Catalysts 2020, 10(5), 514; https://doi.org/10.3390/catal10050514
Submission received: 30 March 2020 / Revised: 2 May 2020 / Accepted: 5 May 2020 / Published: 7 May 2020
(This article belongs to the Section Environmental Catalysis)

Abstract

:
The development of novel, noble metal-free semiconductor catalysts with high efficiency is of great importance for the degradation of organic compounds. Among them, amorphous materials have been extensively studied for their unique and commercially useful properties. Here, a completely amorphous, noble metal-free photocatalyst C3N4ZnxOy (x, y = 0.32–1.10) was successfully synthesized from urea and ZnO by a simple high-temperature polymerization method. As the Zn content increased, the short-range ordered structures of the amorphous samples were still retained, as revealed by XPS, FTIR, and ssNMR. Meanwhile, the -CN3 structures were observed to be gradually destroyed, which may make the amorphous state more favorable for photocatalytic reactions. Compared with g-C3N4, the amorphous samples showed significantly reduced intensities in the photoluminescence spectra, indicating that the recombination rate of the photo-generated charge carriers was greatly reduced. It was confirmed that the optimized sample (C3N4Zn0.61O0.61) achieved a photocatalytic efficiency of 86.1% in the degradation of tetracycline hydrochloride under visible light irradiation within 1 h. This is about 2 times higher than that of both g-C3N4 and ZnO. This study emphasizes the importance of the amorphous structure in photocatalytic reactions, and this synthetic strategy may provide an effective model for designing other novel catalysts.

Graphical Abstract

1. Introduction

The discovery and application of antibiotics is a revolution in human history. Due to the prominent antibacterial and bactericidal effects, antibiotics have a high consumption rate in humans and livestock medicines. Tetracycline (TC), one of the most widely used antibiotics in the world, plays an important role in the medical industry due to its broad-spectrum antimicrobial effect on a variety of diseases [1,2]. However, the large amount of antibiotic residues discharged into wastewater poses a serious threat to ecosystems [3,4,5]. The most appropriate and effective method to effectively eliminate antibiotics from the environment has become a public issue in the international community. At present, several techniques have been developed to remove antibiotic residues such as activated carbon adsorption, UV/H2O2 processes, ozone oxidation, biodegradation, and electrolysis [6,7,8,9]. Recently, photocatalytic degradation based on semiconductors has been considered one of the most promising approaches, owing to the green byproduct and high efficiency compared with other traditional techniques [10,11].
Over the past few years, while most photocatalysts are based on crystalline compounds, a growing class of amorphous materials has shown higher efficiency than their crystalline counterparts. Amorphous materials have attracted much attention due to their unique isotropic and high concentration of coordinatively unsaturated sites. The long-range disorder but short-range order in these structures provide more active and selective sites that exhibit excellent activity and selectivity in photocatalytic reactions [12,13,14,15,16,17,18,19]. Moreover, the amorphous nanostructures not only improve the adsorption capacity of the catalyst but also increase the contact area between the adsorbate and the catalyst. It is reported that amorphous metal sulfides (e.g., MoSx and CoSx) exhibit excellent performance in the hydrogen evolution reaction (HER) [16,17,20], while amorphous metal oxides (e.g., MOx, M = Fe, Co, and Ni) are highly efficient in the oxygen evolution reaction (OER) [21,22,23,24,25]. Recent studies also showed that amorphous TiO2 and amorphous g-C3N4 exhibit enhanced photocatalytic activities in hydrogen generation [26,27,28,29,30] and pollution degradation [31]. Although some progress has been made in studying the catalytic properties of photocatalysts, it is still necessary to design novel materials and gain a deep understanding of their catalytic mechanisms.
Herein, a completely amorphous material, which is denoted as C3N4ZnxOy (x, y = 0.32–1.10), was successfully fabricated by a simple one-step thermal polymerization method. As the Zn content increased, the regions of crystallization were destroyed and became amorphous. 13C ssNMR spectra revealed that the heptazine carbon (-CN3) functional group in the sample gradually disappeared. The increase in the Zn element leads to an increase in the band gap and a decrease in the specific surface area, but the C3N4ZnxOy samples show enhanced photocatalytic activity compared to g-C3N4 and ZnO. The optimized sample (C3N4Zn0.61O0.61) achieved a photocatalytic efficiency of 86.1% in the degradation of tetracycline hydrochloride (TC-HCl) under visible light irradiation (0.6 W/cm2) within 1 h, which was about 2 times higher than that of both pure g-C3N4 and ZnO.

2. Results and Discussion

2.1. Element Analysis

Table 1 shows the H, C, N, and O elemental analysis results of the as-prepared samples, and the percentage of the Zn element was calculated based on the total mass proportion. The C/N atomic ratio of g-C3N4 is 2.7:4, which is close to 3:4. As for the other four samples, the C/N ratio did not change significantly from 2.7:4. For simplicity, the samples were designated C3N4ZnxOy (x, y = 0.32–1.52), where x and y represent the number of Zn and O atoms relative to the N atom, respectively. It is worth noting that a small amount of oxygen resided in g-C3N4 which is attributed to the oxygenated carbon (C=O) because of the incomplete polymerization during the formation of g-C3N4. The addition of Zn caused a change in the oxygen content, which may be due to changes in the configurations of the oxygen combination binding sites. The specific surface areas of g-C3N4 and C3N4ZnxOy samples were measured by monitoring nitrogen adsorption–desorption isotherms, as shown in Figure S1. The g-C3N4 and ZnO samples possessed a specific surface area of 89.8 and 29.9 m2 g−1, respectively, while the specific surface areas of the C3N4ZnxOy samples were between the above two. The higher the Zn content, the smaller the specific surface area.

2.2. X-Ray Diffraction

The phase structures of the as-prepared catalysts were examined by X-ray diffraction (XRD). As shown in Figure 1a, pure g-C3N4 exhibited two diffraction peaks at 12.9° and 27.3°, representing the (100) and (002) crystal faces, respectively. The peak at 12.9° represents the in-plane repeating tri-s-triazine ring structure, and the peak at 27.3° originates from the interlayer stacking of the π-conjugated aromatic system. As the Zn content increased, the peaks at both sites gradually weakened and slowly disappeared. The scattering curves show a large broad baseline with no obvious peak, indicating an amorphous structure. When the mass ratio of urea/ZnO is in the range of 25–100, a completely amorphous sample C3N4ZnxOy (x, y = 0.32–1.10) can be obtained. The disappearance of the diffraction peaks also demonstrates that the arrangement of the repeating unit structures of g-C3N4 may be damaged to a short-range order. When the Zn content continuously increases, peaks gradually arise at 32°, 34.6°, 36.4°, 47.7°, 56.7°, 63° and 68.1° of the C3N4Zn1.52O1.30 sample, which correspond to the ZnO diffraction peaks.

2.3. Thermogravimetric Analysis

To better understand the effect of the raw material ratio on the decomposition of the final product produced by the pyrolysis process, thermogravimetric analysis (TGA) was performed on g-C3N4, C3N4ZnxOy, and ZnO samples, as shown in Figure 1b. We also conducted the first derivative curve DTG in Figure 1c. From the TG and DTG curves, it can be found that ZnO maintains its mass during the heating process due to the high boiling point (2360 °C). The g-C3N4 and C3N4ZnxOy samples are stable below 500 °C, and the mass gradually decreases in the range of 500–750 °C. It can be speculated that the C and N elements in these samples react with O2 and volatilize. The most rapid mass loss occurs at about 700 °C, indicating the most intensive oxidation reaction at this temperature. It should be noted that a second decrease appears at about 810 °C in the C3N4Zn0.61O0.61, C3N4Zn1.10O1.02, and C3N4Zn1.52O1.30 samples. This indicates that partial C and N elements may have formed strong covalent bonds in these samples, such as C≡N or Zn–N, therefore a higher temperature may be needed to cause the formation of CO2, NO, etc. It is assumed that the formation of new strong covalent bonds leads to the destruction of the long-range ordered structure, thus no diffraction peaks can be seen in the XRD spectra of the C3N4ZnxOy samples.

2.4. FTIR Spectra

In the FTIR spectrum (Figure 1d) of ZnO, the peaks around 500 cm−1 correspond to the characteristic Zn–O stretching vibration modes. The FTIR spectrum of g-C3N4 shows the apparent aromatic CN heterocycle stretching mode at 1200–1700 cm−1. The bands appearing at 1248 cm−1, 1326 cm−1, and 1415 cm−1 are assigned to the aromatic C–N vibrations in the structure. The peaks at 1571 cm−1 and 1636 cm−1 correspond to C=N stretching modes of the aromatic ring in the g-C3N4 structure. The band near 815 cm−1 is attributed to the out of plane bending modes of C–N heterocycles, which can be considered as the main peak reflecting the existence of the g-C3N4 structure. As for the C3N4ZnxOy samples, all of the FTIR spectra are similar with a sharp band at 802 cm−1 and stretching bands around 1200–1700 cm−1, indicating that the C−N heterocycles are maintained and the short-range order of g-C3N4 remains unchanged. It should be noted that the band at 815 cm−1 was slightly shifted to 802 cm−1, which may due to the transfer of interfacial charge and the formation of new chemical bonds [32]. The peak at 2185 cm−1, which can be assigned to C≡N triple bonds [33,34], only appeared in the C3N4ZnxOy samples. The peak intensity increased with the ZnO content, indicating that some triazine rings were broken and the sp2 C–N bonds were transformed into C≡N triple bonds. The above behaviors exist in the g-C3N4/ZnO composite, indicating that the C3N4ZnxOy samples have a lot of similarities with the g-C3N4/ZnO composite. In addition, this is well in line with the DTG results.

2.5. SEM Images

The morphologies of g-C3N4, C3N4ZnxOy, and ZnO samples were assessed by SEM images (Figure 2), revealing differences in their structure. Pure g-C3N4 exhibited a wrinkled and folded thin-sheet morphology (Figure S2). As the Zn content increased, the C3N4ZnxOy samples gradually became a denser layered structure and finally transformed into a large lamellar structure. The corresponding EDS mapping revealed that the Zn and O elements were dispersed uniformly in C3N4Zn1.10O1.02. The EDS mapping of the other samples is shown in Figure S3.

2.6. Optical Band Gap Measurement

The optical properties of the as-prepared samples were characterized by UV-Vis diffuse reflectance spectroscopy. As shown in Figure 3a, pure g-C3N4 displayed an absorption band below 450 nm, whereas the C3N4ZnxOy samples exhibited an onset of absorbance farther out in the visible region and below 600 nm. The band gaps of the samples were obtained based on the Tauc plot, as shown in Figure 3b. Compared with g-C3N4, the band gaps of the C3N4ZnxOy samples first decreased upon introducing small quantities of ZnO into urea, and then, rose to near the band gap of ZnO upon increasing the ZnO content. The conduction bands of these photocatalysts were estimated using the valence band X-ray photoelectron spectra (VBXPS), as shown in Figure S4. The relative positions of valence and conduction band energies are depicted in Figure S5.

2.7. Photoluminescence and Photocurrent Measurements

The room temperature photoluminescence (PL) spectra of g-C3N4, C3N4ZnxOy, and ZnO photocatalysts are plotted in Figure 3c. Each spectrum consists of one broad band around 470 nm in the visible region. Compared to g-C3N4, the PL intensities of the C3N4ZnxOy samples all decreased, which indicates that the photo-generated electron-hole recombination is much more inhibited. The lowest PL intensity of C3N4Zn1.10O1.02 indicates the lowest recombination rate among the C3N4ZnxOy samples.
Transient photocurrent responses of the C3N4ZnxOy samples were investigated at a constant voltage of 0.6V versus Ag/AgCl, with several on–off cycles of intermittent full wavelength irradiation (320–780 nm, 0.8 W/cm2). As shown in Figure 3d, all samples exhibit stable and high-speed current swings during the illumination cycle, thus demonstrating rapid and steady photoelectrochemical efficiency. The C3N4Zn0.61O0.61 sample exhibits a significantly higher photocurrent intensity than the other three samples.

2.8. X-Ray Photoelectron Spectroscopy (XPS)

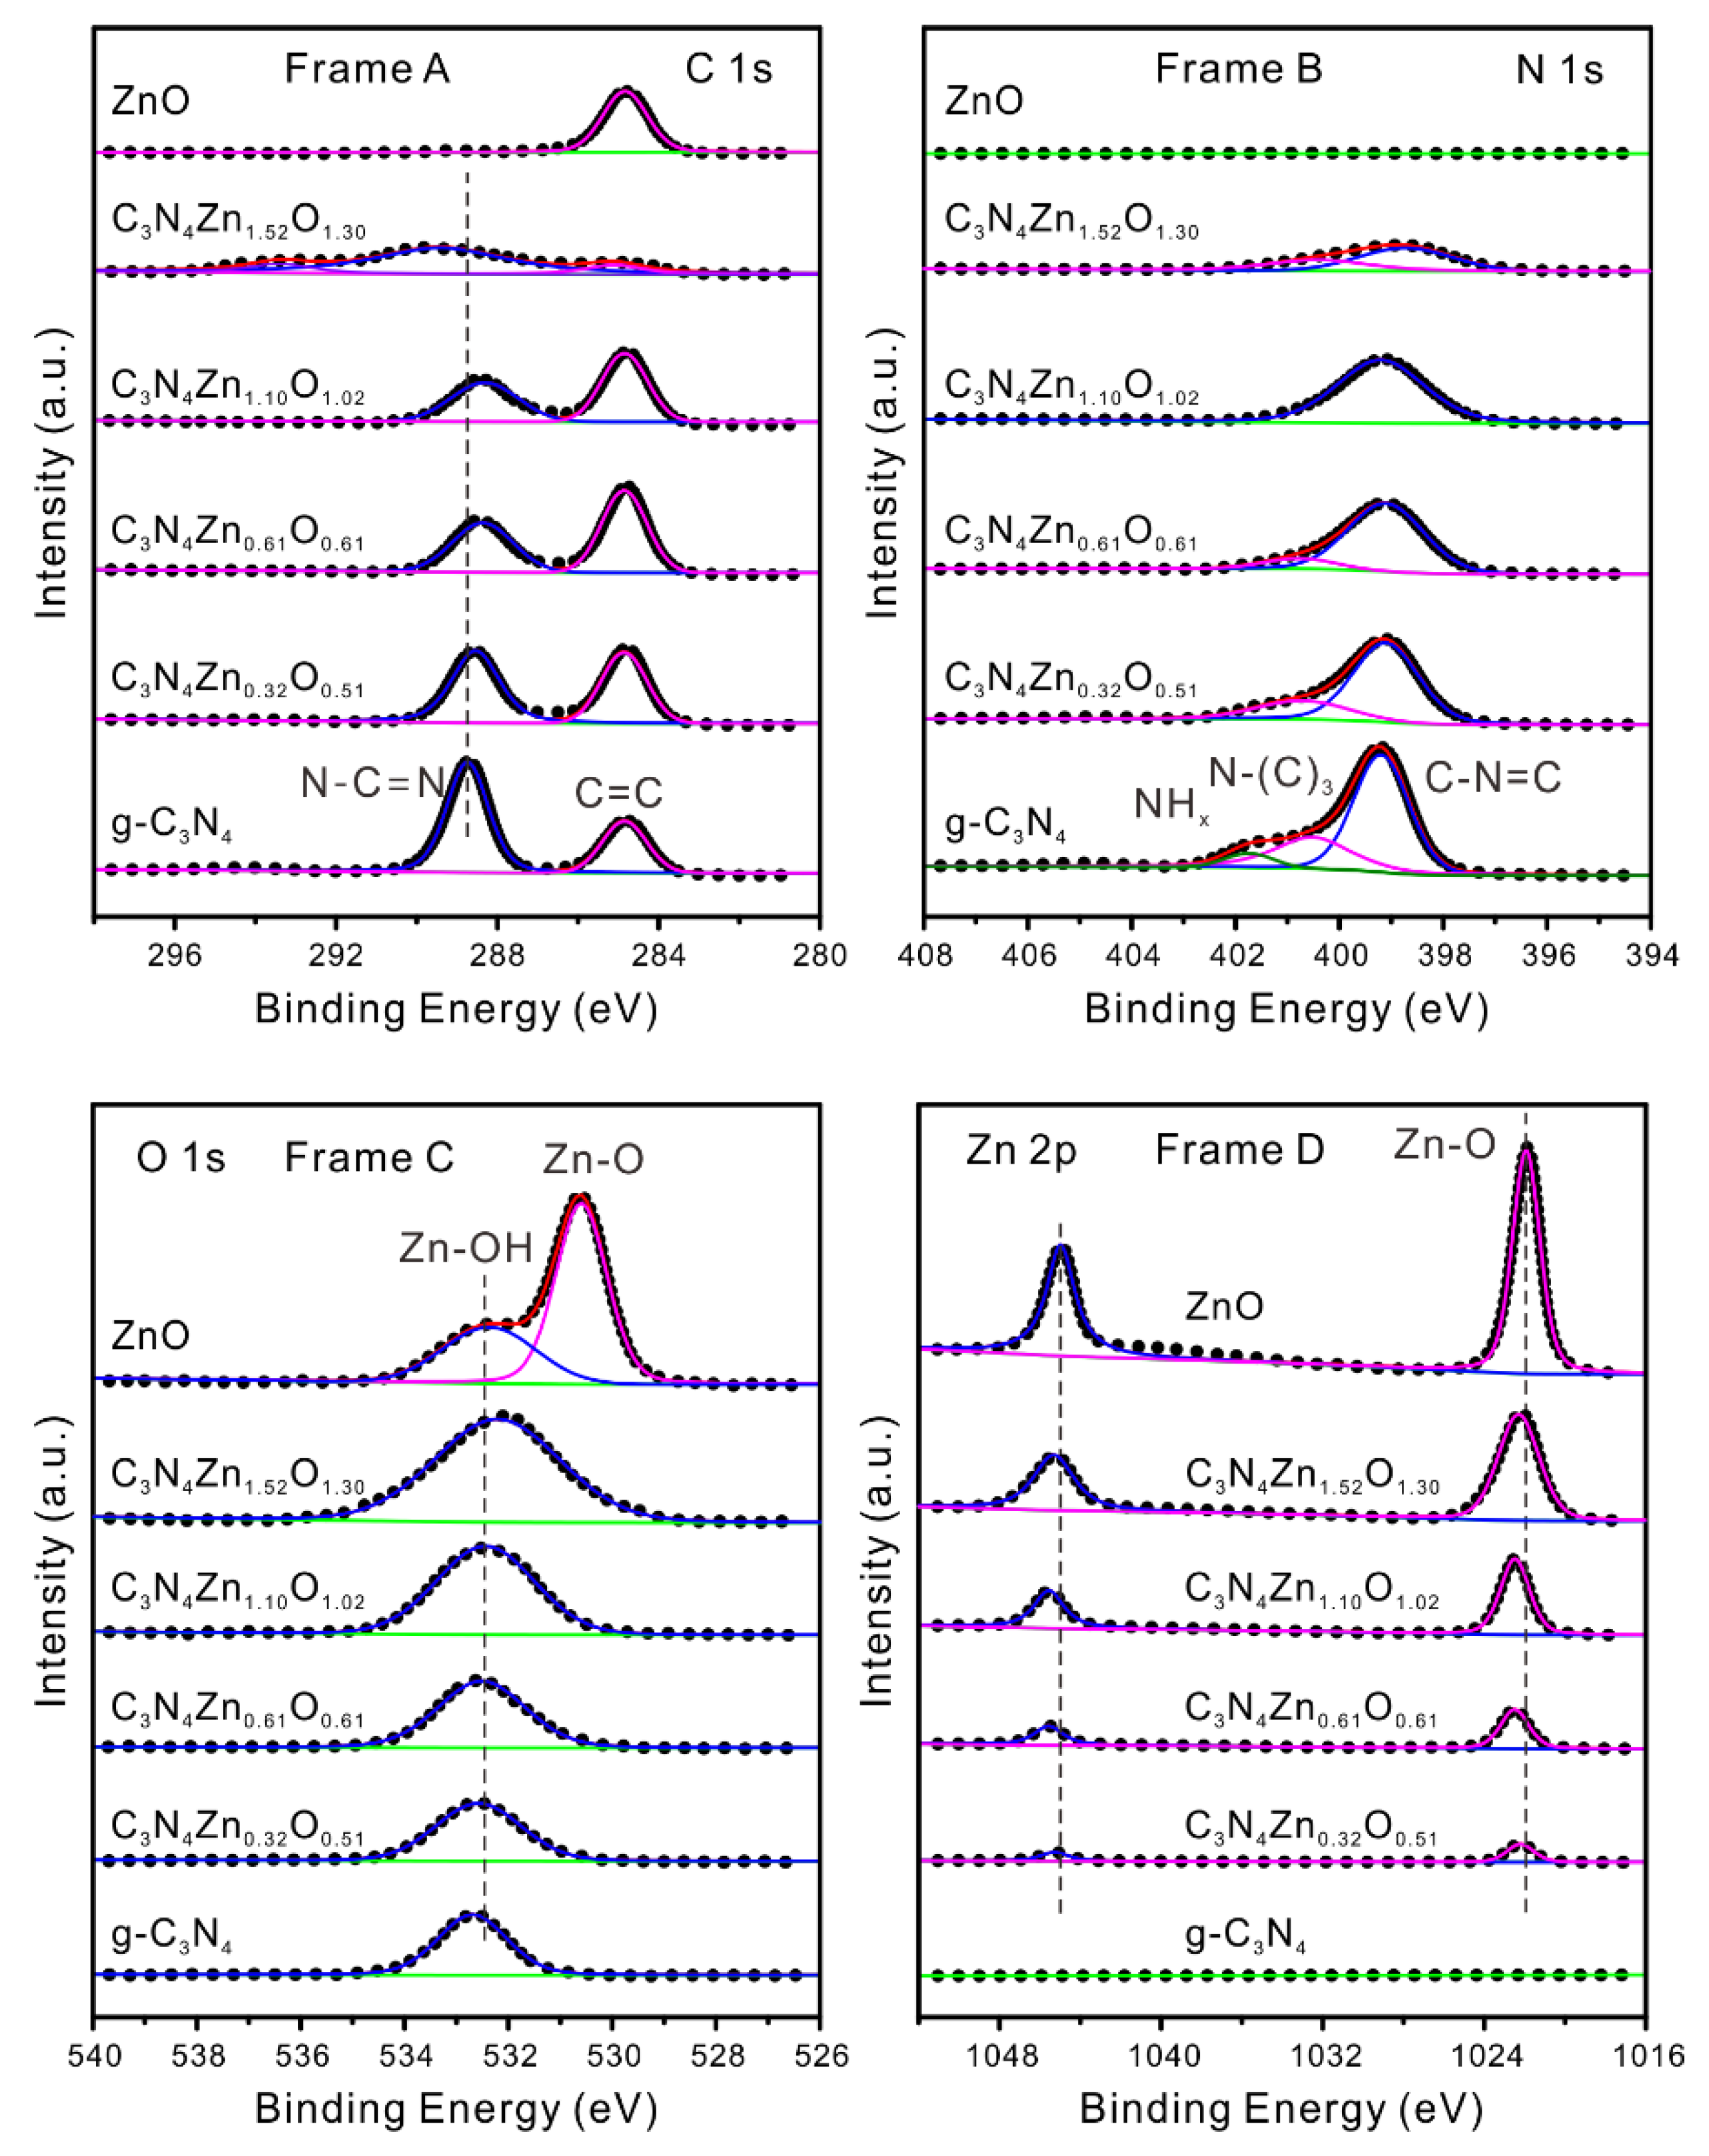
To further investigate the surface composition of C3N4ZnxOy and the change in the chemical states of the C, N, O, and Zn elements, XPS analysis was carried out. Figure 4 shows the XPS spectra arising from the C 1s, N 1s, O 1s, and Zn 2p photoelectrons obtained from the samples of g-C3N4, C3N4ZnxOy, and ZnO. Two peaks were observed in the XPS spectra of C 1s for g-C3N4; the peak with a binding energy of 288.7 eV corresponds to the N–C=N repeat unit of g-C3N4, while the second C peak at 284.6 eV originates from sp2 orbitals in C=C bonds [35]. For the C3N4ZnxOy samples, the existence of the peak at 288.7 eV indicates that the N–C=N functional group remains. The N 1s XPS spectrum for g-C3N4 exhibits three peaks at 399.18 eV, 400.43 eV, and 401.62 eV, which are assigned to the C–N=C repeat unit, N-(C)3 and NHx groups, respectively (Figure 4 N 1s) [35]. The N 1s spectra from C3N4ZnxOy samples exhibit some differences based on ZnO content. With the increase in the Zn constituent, the peaks at 401.62 eV disappear, indicating the absence of the NHx group. It is speculated that the N atom of the NHx group may be connected to the Zn atom instead.
The O 1s spectra for ZnO display two peaks at 530.68 eV and 532.55 eV (Figure 4 O 1s). The peak at 530.32 eV represents the electron binding energy in the Zn–O bond, corresponding to the O2- ions that are surrounded by Zn2+ ions. The peak at 532.55 eV derives from Zn–OH or loosely bound oxygen, such as -CO3, -OH, adsorbed H2O, and O2 [36,37,38,39,40]. The XPS spectra of O 1s from the C3N4ZnxOy samples all show only one peak at 532.55 eV. It is suspected that the O element exists in the form of Zn–OH in the C3N4ZnxOy samples. With the decrease in the Zn and O content, the peak at 532.55 eV slightly shifted to higher binding energy, which may due to the change in the migration of electrons and causes the formation of N–Zn–O covalent bonds [41]. The XPS spectra of Zn 2p for ZnO show two symmetry peaks at 1044.98 eV and 1021.88 eV (Figure 4 Zn 2p). These are attributed to the Zn 2p1/2 and Zn 2p3/2 orbitals, respectively, indicating that the Zn element exists in the form of Zn2+ [36,37,39] The XPS spectra of Zn 2p for the C3N4ZnxOy samples exhibit no significant change with increasing ZnO content except for a small shift, which can be attributed to the formation of N–Zn bonds [42]. The slight peak shifts in O 1s and Zn 2p spectra exist in the g-C3N4/ZnO composite, which demonstrates that the C3N4ZnxOy samples and the g-C3N4/ZnO composite have a lot in common.

2.9. 1H and 13C NMR Spectra

In addition to XPS, solid-state NMR is an important method for structural characterization. As shown in Figure 5, two peaks were observed in the 1H spectrum of g-C3N4, which are assigned to the edge-NH2 groups (8.7 ppm) and water (3.8 ppm), respectively [43]. As the Zn content increases, the peak at 8.7 ppm gradually disappears, which demonstrates that the edge-NH2 groups vanish in C3N4ZnxOy samples. At the same time, a new peak at 0.7 ppm gradually increases. We assign this peak to the Zn–OH group. The 13C spectrum of g-C3N4 also exhibits two peaks at 156.8 and 164.9 ppm that represent the C atoms in melem-CN3 and the C atoms connected to the edge -NHx group (-CN2–NHx) [43]. The peak at 156.8 ppm gradually disappears with an increase in the Zn content, indicating the -CN3 structure gradually disintegrates. The full width at half maxima (FWHM) of the peak at 164.9 ppm becomes broader, which may be related to the changes in the edge -NHx group. An appropriate explanation is that the edge N is connected to Zn to form a -CN2–N–Zn structure. This is well in line with the observations in the XPS experiments.

2.10. Photodegradation of Tetracycline

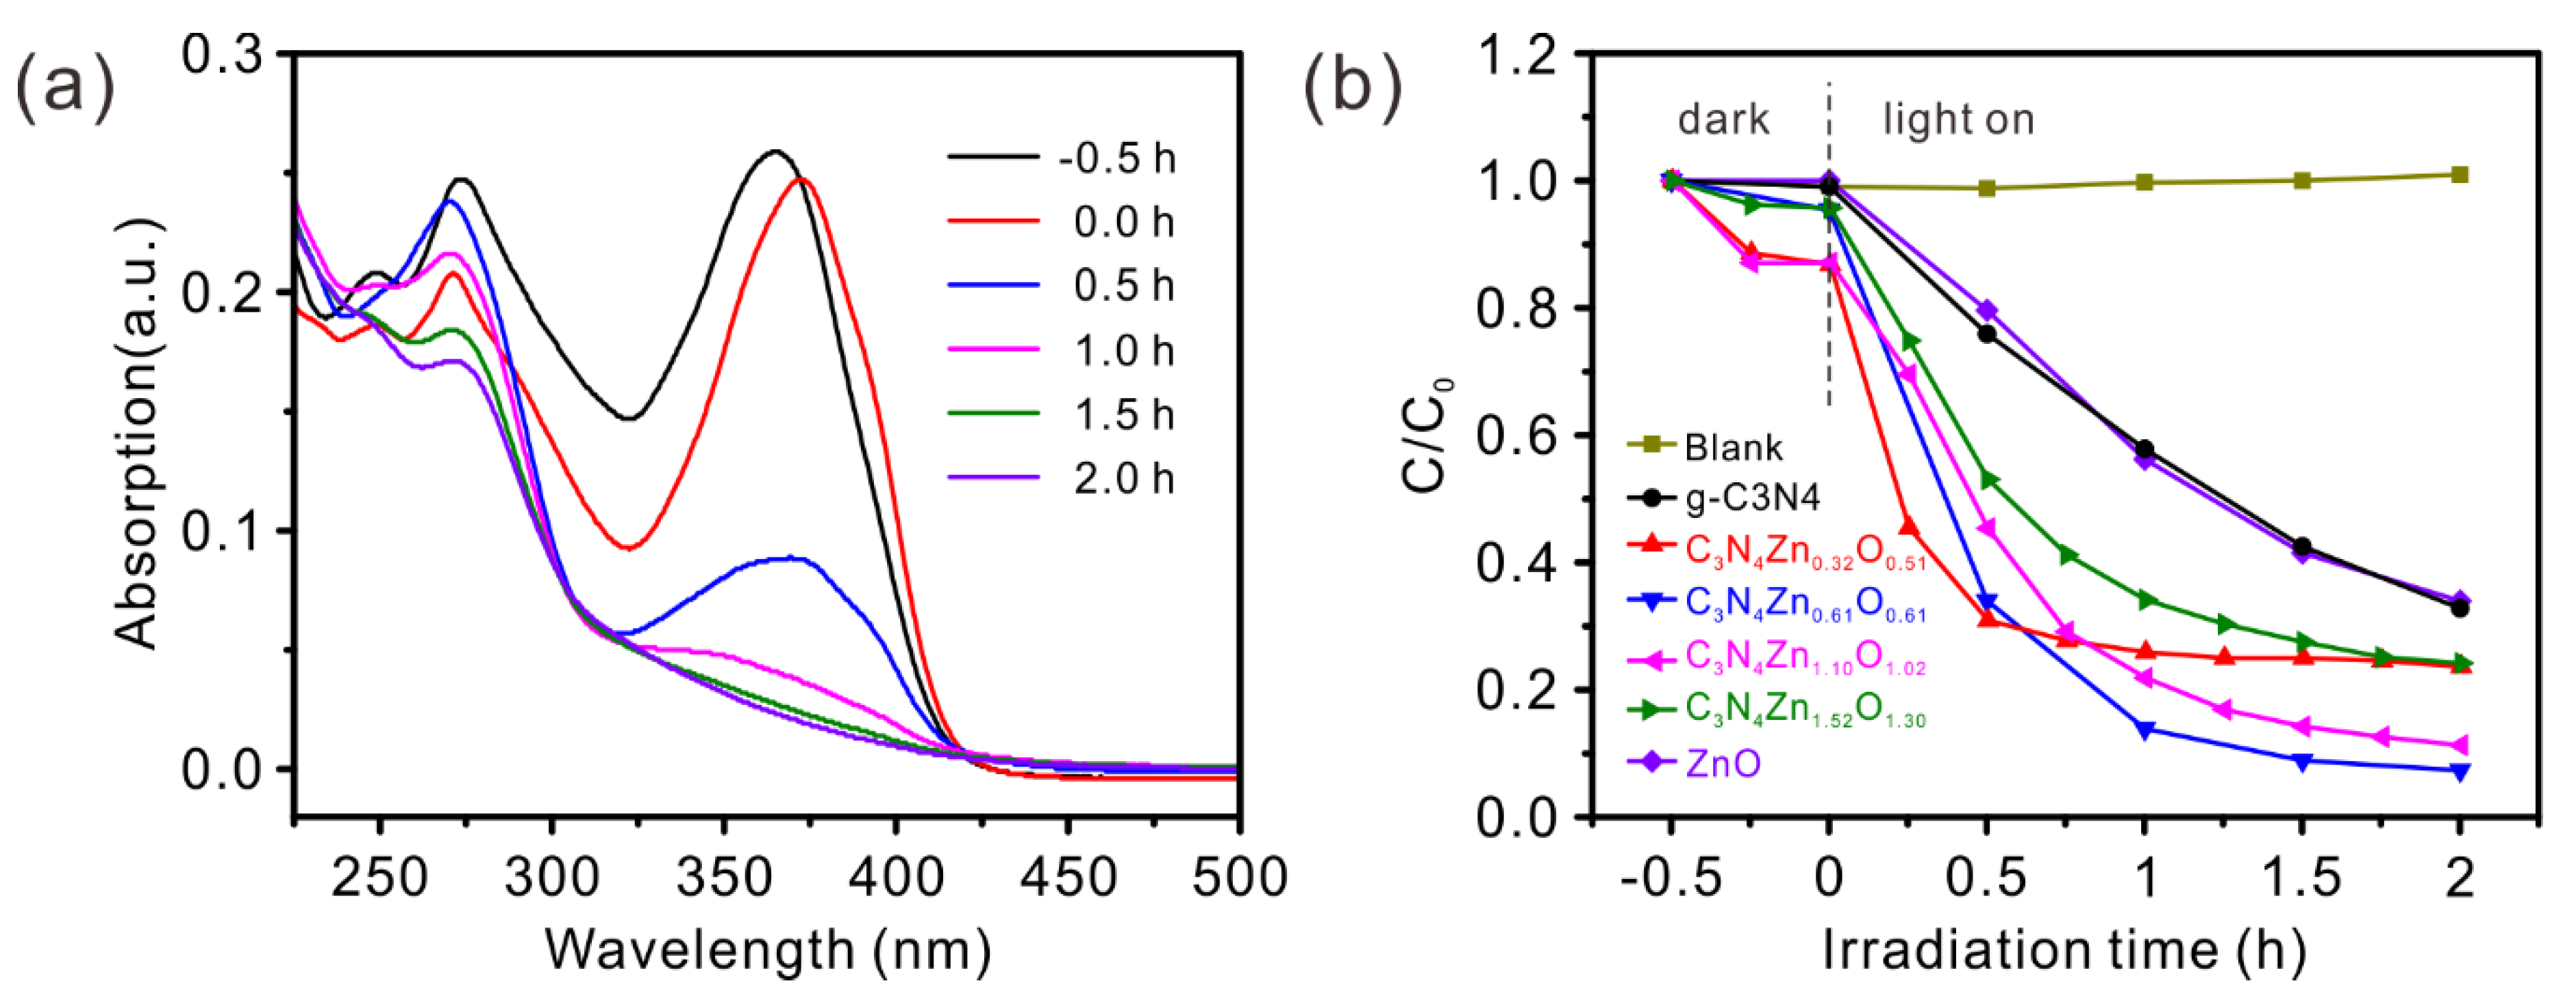
Tetracycline represents a major fraction of the current antibiotic market worldwide, and tetracycline hydrochloride (TC-HCl) was selected as a representative pollutant-toxin to evaluate the photocatalytic performance of the C3N4ZnxOy in detoxification. Figure 6a shows the UV-Vis absorption spectra of TC-HCl at different irradiation times by using C3N4Zn0.61O0.61 as the photocatalyst. It can be found that the maximum absorption peak of the TC-HCl solution is at 365 nm. After 0.5 h absorption in the dark, the peak shifts to 372 nm. When the visible light (λ > 420 nm) is on, the TC-HCl degrades rapidly in the first hour, after which the rate slows down. Figure 6b shows the photocatalytic activities of g-C3N4, C3N4ZnxOy, and ZnO samples in the degradation of TC-HCl under constantly visible light irradiation. The blank sample represents the direct photolysis of TC-HCl in the absence of the photocatalyst and under visible light irradiation for 2 h. TC-HCl was only slightly degraded under such conditions, demonstrating that TC-HCl is stable under visible light irradiation when there is no photocatalyst involved. Pure g-C3N4 and ZnO showed good performance in the degradation of TC-HCl, and pure g-C3N4 exhibited a relatively higher degradation rate than ZnO because it has a better absorption to visible light. Significantly, the C3N4ZnxOy (x, y = 0.32–1.52) photocatalysts samples exhibited much higher activities for photodegrading TC-HCl than either pure g-C3N4 or ZnO. With the addition of the Zn and O element in the composites, the photocatalytic activity of C3N4ZnxOy (x, y = 0.32–1.52) increased remarkably. The C3N4Zn0.61O0.61 sample exhibited the highest photocatalytic activity, which can degrade TC-HCl by 86.1% in 1 h, and 92.7% in 2 h. It should be noticed that the degradation curve of C3N4Zn0.32O0.51 had a very fast response, especially in the first 0.5 h, but the final degradation rate was lower than C3N4Zn0.61O0.61 within 2 h. After 0.5 h, the concentration of the TC-HCl solution was basically unchanged. This may due to the competition between TC-HCl and the intermediate degradation products; it is related to the reactive oxygen species (ROS) formed by the catalyst [44]. As far as we know, the ROS includes singlet oxygen (1O2), hydroxyl radicals (•OH), superoxide anions (•O2–), etc., [45]. Previous researchers have reported that •OH or/and •O2– radicals play important roles in the photodegradation of tetracycline by the g-C3N4/ZnO composite [46,47]. Since the C3N4ZnxOy samples have many similarities with g-C3N4/ZnO, it is suspected that •OH or/and •O2– radicals induced by light irradiation of the C3N4ZnxOy samples also control the degradation rate of TC-HCl. As the degradation reaction proceeds, the concentration of the intermediates gradually increases. The further reaction of the intermediates would cause the •OH and •O2– radicals to be consumed. Therefore, the degradation rate of TC-HCl will be reduced. In general, the results indicate that the C3N4ZnxOy photocatalysts have a better performance in the photodegradation of organic pollutants than either the pristine g-C3N4 or ZnO under the same conditions, especially the completely amorphous C3N4ZnxOy (x, y = 0.32–1.10) samples.
The reusability of the C3N4Zn0.61O0.61 sample was further studied. The sample powders were collected by filtration after photocatalytic reactions and reused in the photocatalytic reaction for 3 times under the same conditions. As shown in Figure 7, the C3N4Zn0.61O0.61 sample displays good stability and maintains a high photocatalytic performance during three reaction cycles. The gradual decrease in the photocatalytic performance may be due to the mass loss during the sampling, transferring, and filtration processes. A 50 mg sample was used in the first reaction cycle. The final powder catalyst was filtered and dried after three reaction cycles, and only about 10 mg of the sample was obtained. This indicates that the powder lost a lot when conducting the next reaction cycle. Similar results have been reported previously [48].
We conducted SEM and EDS tests on the C3N4Zn0.61O0.61 sample before and after the photocatalytic degradation of TC-HCl. The SEM image of the C3N4Zn0.61O0.61 sample exhibits a dense layered structure (Figure S6a). After the degradation of TC-HCl for 1 h under light irradiation, the morphology of the sample did not change much (Figure S6b). The EDS was also employed to better understand the surface element composition and the content of the C3N4Zn0.61O0.61 sample before and after photocatalytic degradation. The SEM images and the corresponding EDS were shown in Figure S7. From the EDS in Figure S7c, it can be known that the surface of the C3N4Zn0.61O0.61 sample contains C, N, O, and Zn elements. After degrading TC-HCl for 1 h under visible light irradiation, the surface element composition is the same as before (Figure S7d). The element contents are depicted in both spectra, from which we can know that the content of each element on the surface of the C3N4Zn0.61O0.61 sample only changed slightly after the degradation experiment. To be more specific, the mass portion of the Zn element changed from 43.05% to 41.55%, but the C and N elements on the surface of the sample also changed slightly. The C/N mass ratio changed from 1.39 to 1.33, indicating that a small amount of C or N elements were lost after the degradation. Therefore, the loss of trace Zn elements in the reaction will be accompanied by the trace loss of C or N elements. Based on the EDS results, the difference in the Zn element before and after degradation is about 1.5%. The initial weight of the C3N4Zn0.61O0.61 sample is 50 mg, and the leaching of Zn into the solution should be 0.75 mg. For a 200 mL solution, the concentration of Zn would be 3.75 mg/L. In the practical experiment, the final volume of the TC-HCl solution is less than 200 mL due to the sampling process. Therefore, the concentration of Zn would be lower than 3.75 mg/L.
To our knowledge, the photoactivity of the commercial ZnO can be seriously deteriorated due to the photocorrosion effect [49,50]. It is reported that 92 % of MB could be degraded within 2 h when ZnO was used for the first time; however, after three recycles, a significant decrease in photocatalytic activity for pure ZnO was found, in which only 16% of MB was degraded [51]. The drastic decrease was explained as the photocorrosion effect. Photocorrosion consists of the partial dissolution of Zn and the collapse of the ZnO structure induced by the light irradiation [52,53]. That is to say, partial Zn elements may get into the solution. In our work, the C3N4ZnxOy samples were fabricated from commercial ZnO. It has been revealed that the Zn–O functional group exists in the C3N4ZnxOy samples. Therefore, photocorrosion cannot be completely absent. Fortunately, the C3N4Zn0.61O0.61 sample is still highly efficient after being reused to degrade TC-HCl, as shown in Figure 7. This indicates that the C3N4Zn0.61O0.61 sample has good stability and photocorrosion has been inhibited.

3. Materials and Methods

3.1. Sample Preparation

The samples were synthesized by a one-step polymerization method according to the literature [54]. In brief, 2.0 g urea (≥98%, Sigma-Aldrich, St. Louis, MO, USA) and a certain amount (0.02, 0.05, 0.08 or 0.20 g) of ZnO (≥99%, Sigma-Aldrich, St. Louis, MO, USA) were mixed in a covered alumina crucible, then, the powders were transferred to a muffle furnace and calcined at 500 °C for 2 h with a heating rate of 10 °/min under air atmosphere. The samples were obtained after cooling to room temperature.

3.2. Material Characterization

The nanoparticle phase and structural information of the as-prepared materials were characterized by X-ray powder diffraction (XRD) measurements. The data were recorded in the 2θ angle range of 5° to 85° with a scan speed of 10°/min on an Ultima IV (Rigaku, Japan) X-ray diffractometer with Cu-Kα radiation (λ = 1.5418 Å, 35 kV, 25 mA). The surface morphologies were obtained using a scanning electron microscope (Hitachi S-4800, Japan). Thermal gravimetric (TG) curves were recorded using an STA 449 F3 Jupiter simultaneous thermo-analyzer (NETZSCH Gerätebau GmbH, Germany) from room temperature to 900 °C with a heating rate of 10 °C/min under air atmosphere. The specific surface properties of the powder samples were obtained by nitrogen adsorption–desorption isotherms, using an ASAP 2020 physical adsorption analyzer (Micromeritics, USA). The specific surface areas were obtained based on the BET equation. The elemental composition and content were characterized by an EA analyzer (Elementar Vario EL cube, Germany). The optical properties were measured by a UV-Vis spectrophotometer (UV-2700, Shimadzu, Japan) at a wavelength range of 200–800 nm. The X-ray photoelectron spectroscopy (XPS) data were recorded using an Escalab 250Xi (Thermo Scientific, USA). All binding energies were calibrated to the C 1s peak at 284.6 eV. The structural information of the powders was analyzed by an AVANCE III 400 NMR spectrometer (Bruker, German), operating at a 1H Larmor frequency of 400 MHz. The 1H spectra have a spectral width of 200 ppm, 90° pulse width of 4 μs, acquisition time of 10 ms, number of scans of 16, and recycle delay of 2 s. The 13C spectra have a spectral width of 300 ppm, 90° pulse width of 4 μs, acquisition time of 20 ms, number of scans of 4 k, and recycle delay of 2 s. A Nexus 670 infrared spectrometer (Nicolet, USA) was used to perform Fourier transform infrared spectroscopy (FTIR) analysis in the wavenumber range of 4000–400 cm−1 in transmission mode. The photoluminescence (PL) spectra within the wavelength range of 350–700 nm were obtained under 325 nm excitation using an F-4500 FL spectrophotometer (Hitachi, Japan).
The photoelectrochemical test was conducted with an electrochemical workstation (CHI660E Instruments, Shanghai, China) in a standard three-electrode cell with 0.2 M Na2SO4 plus 10 vol % triethanolamine (TEOA). The Pt gauze (1 × 1 cm2) and Ag/AgCl (saturated KCl) was used as the counter electrode and reference electrode, respectively. The working electrode was prepared on an indium tin oxide (ITO) conductor glass. Precisely, 10 mg of the as-prepared photocatalyst, N, N-dimethylformamide (DMF, 200 μL), naphthol (50 μL) were blended and sonicated for 30 min to get a homogeneous mixture. Then, 20 μL of the slurry was then injected onto the ITO glass. The exposed area of the working electrode was 1 × 1 cm2. The electrode was dried in air overnight to improve adhesion.

3.3. Photocatalytic Activity Tests

A 50 mg photocatalyst was dispersed in 200 mL tetracycline hydrochloride (TC-HCl) aqueous solution (10 mg/L). The mixed suspension was magnetically stirred for 30 min in the dark to obtain absorption–desorption equilibrium before irradiation. Afterwards, the above suspension was irradiated by a 300 W xenon lamp (PerfectLight, Beijing, China) with a 420 nm cutoff filter. The optical power density was measured to be 0.6 W/cm2, using a PL-MW2000 optical power meter (PerfectLight, Beijing, China). At 15 min intervals, 4 mL of suspension was sampled and filtered through a 0.22 μm PTFE syringe filter to remove the solid particles and obtain a clear liquid. The photocatalytic degradation efficiency of TC-HCl was analyzed on a UV-Vis spectrophotometer (UV-2700, Shimadzu, Japan) by recording the absorption spectrum of the aqueous solution at the wavelength range of 200–500 nm.

4. Conclusions

A photocatalyst C3N4ZnxOy (x, y = 0.32–1.10) synthesized by a calcining process from urea and ZnO precursors produced a completely amorphous product that was found to be useful for breaking down the aromatic compound tetracycline under visible light illumination. XRD, XPS, FTIR, ssNMR and other characterizations revealed that the as-prepared samples contained N–C=N structure, similar to that of g-C3N4. The starting Zn and O elements were believed to be disassembled and coordinated into a new C and N framework. The amorphous structures possess more defects and larger contact areas with reactants than either g-C3N4 or ZnO photocatalysts. This creates more effective active sites and better electron transfer efficiency. In the photocatalytic degradation of TC-HCl, the amorphous samples exhibited superior photocatalytic activities over pure g-C3N4 and ZnO. The new amorphous materials have potential applications in environmental pollution abatement and energy generation, and should provide a new direction for the development of photocatalytic materials in the future.

Supplementary Materials

The following are available online at https://www.mdpi.com/2073-4344/10/5/514/s1, Figure S1: Nitrogen adsorption–desorption isotherm curves of g-C3N4, C3N4ZnxOy, and ZnO samples. Inset: Calculated BET surface area per gram of sample. Figure S2: SEM images of (a) g-C3N4 and (b) ZnO. Figure S3: EDS mapping of (a) g-C3N4, (b) C3N4Zn0.32O0.51, (c) C3N4Zn0.61O0.61, (d) C3N4Zn1.52O1.30 and (e) ZnO. Figure S4: Valence band XPS spectra of (a) g-C3N4, (b) C3N4Zn0.32O0.51, (c) C3N4Zn0.61O0.61, (d) C3N4Zn1.10O1.02, (e) C3N4Zn1.52O1.30 and (f) ZnO. Figure S5: Band gap (a) g-C3N4, (b) C3N4Zn0.32O0.51, (c) C3N4Zn0.61O0.61, (d) C3N4Zn1.10O1.02, (e) C3N4Zn1.52O1.30 and (f) ZnO. Figure S6: SEM images of the C3N4Zn0.61O0.61 sample (a) before and (b) after the degradation of TC-HCl. Figure S7: SEM images of the C3N4Zn0.61O0.61 sample (a) before and (b) after the degradation of TC-HCl. EDS of the C3N4Zn0.61O0.61 sample (c) before and (d) after the degradation of TC-HCl.

Author Contributions

Methodology, software, validation, formal analysis, data curation, R.Z. and G.L.G.; Investigation, R.Z., G.L.G. and J.X.D.; writing—original draft preparation, R.Z.; conceptualization, resources, writing—review and editing, visualization, supervision, project administration, funding acquisition, X.L.W. and Y.-F.Y. All authors have read and agreed to the published version of the manuscript.

Funding

This research was funded by the National Natural Science Foundation of China, grant numbers 21603073 and 21574043.

Conflicts of Interest

The authors declare no conflict of interest.

References

  1. Leong, S.; Li, D.; Hapgood, K.; Zhang, X.; Wang, H. Ni(OH)2 decorated rutile TiO2 for efficient removal of tetracycline from wastewater. Appl. Catal. B Environ. 2016, 198, 224–233. [Google Scholar] [CrossRef] [Green Version]
  2. Zhang, J.; Yan, M.; Yuan, X.; Si, M.; Jiang, L.; Wu, Z.; Wang, H.; Zeng, G. Nitrogen doped carbon quantum dots mediated silver phosphate/bismuth vanadate Z-scheme photocatalyst for enhanced antibiotic degradation. J. Colloid Interface Sci. 2018, 529, 11–22. [Google Scholar] [CrossRef] [PubMed]
  3. Hailili, R.; Wang, Z.-Q.; Li, Y.; Wang, Y.; Sharma, V.K.; Gong, X.-Q.; Wang, C. Oxygen vacancies induced visible-light photocatalytic activities of CaCu3Ti4O12 with controllable morphologies for antibiotic degradation. Appl. Catal. B Environ. 2018, 221, 422–432. [Google Scholar] [CrossRef]
  4. Pan, X.; Lv, N.; Li, C.; Ning, J.; Wang, T.; Wang, R.; Zhou, M.; Zhu, G. Impact of nano zero valent iron on tetracycline degradation and microbial community succession during anaerobic digestion. Chem. Eng. J. 2019, 359, 662–671. [Google Scholar] [CrossRef]
  5. Wang, W.; Tadé, M.O.; Shao, Z. Research progress of perovskite materials in photocatalysis- and photovoltaics-related energy conversion and environmental treatment. Chem. Soc. Rev. 2015, 44, 5371–5408. [Google Scholar] [CrossRef]
  6. Zhu, X.; Liu, Y.; Qian, F.; Zhou, C.; Zhang, S.; Chen, J. Preparation of magnetic porous carbon from waste hydrochar by simultaneous activation and magnetization for tetracycline removal. Bioresour. Technol. 2014, 154, 209–214. [Google Scholar] [CrossRef]
  7. Kakavandi, B.; Takdastan, A.; Jaafarzadeh, N.; Azizi, M.; Mirzaei, A.; Azari, A.; Jaafarzadeh, N. Application of Fe3O4@C catalyzing heterogeneous UV-Fenton system for tetracycline removal with a focus on optimization by a response surface method. J. Photochem. Photobiol. A Chem. 2016, 314, 178–188. [Google Scholar] [CrossRef]
  8. Gómez-Pacheco, C.; Sánchez-Polo, M.; Rivera-Utrilla, J.; Peñalver, J.J.L. Tetracycline removal from waters by integrated technologies based on ozonation and biodegradation. Chem. Eng. J. 2011, 178, 115–121. [Google Scholar] [CrossRef]
  9. Da Silva, L.F.; M’Peko, J.-C.; Andrés, J.; Beltran, A.; Gracia, L.; Bernardi, M.I.B.; Mesquita, A.; Antonelli, E.; Moreira, M.L.; Mastelaro, V.R. Insight into the Effects of Fe Addition on the Local Structure and Electronic Properties of SrTiO3. J. Phys. Chem. C 2014, 118, 4930–4940. [Google Scholar] [CrossRef]
  10. Liu, X.; Lv, P.; Yao, G.; Ma, C.; Huo, P.; Yan, Y. Microwave-assisted synthesis of selective degradation photocatalyst by surface molecular imprinting method for the degradation of tetracycline onto Cl-TiO2. Chem. Eng. J. 2013, 217, 398–406. [Google Scholar] [CrossRef]
  11. Wang, W.; Fang, J.; Shao, S.; Lai, M.; Lu, C. Compact and uniform TiO2@g-C3N4 core-shell quantum heterojunction for photocatalytic degradation of tetracycline antibiotics. Appl. Catal. B Environ. 2017, 217, 57–64. [Google Scholar] [CrossRef]
  12. Liu, W.; Liu, H.; Dang, L.; Zhang, X.; Wu, X.; Yang, B.; Li, Z.; Zhang, X.; Lei, L.; Jin, S. Amorphous Cobalt-Iron Hydroxide Nanosheet Electrocatalyst for Efficient Electrochemical and Photo-Electrochemical Oxygen Evolution. Adv. Funct. Mater. 2017, 27, 1603904. [Google Scholar] [CrossRef]
  13. Kanan, M.W.; Nocera, D.G. In Situ Formation of an Oxygen-Evolving Catalyst in Neutral Water Containing Phosphate and Co2+. Science 2008, 321, 1072–1075. [Google Scholar] [CrossRef] [PubMed] [Green Version]
  14. Smith, R.D.L.; Prévot, M.S.; Fagan, R.D.; Trudel, S.; Berlinguette, C.P. Water Oxidation Catalysis: Electrocatalytic Response to Metal Stoichiometry in Amorphous Metal Oxide Films Containing Iron, Cobalt, and Nickel. J. Am. Chem. Soc. 2013, 135, 11580–11586. [Google Scholar] [CrossRef] [PubMed]
  15. Indra, A.; Menezes, P.W.; Sahraie, N.R.; Bergmann, A.; Das, C.; Tallarida, M.; Schmeißer, D.; Strasser, P.; Driess, M. Unification of Catalytic Water Oxidation and Oxygen Reduction Reactions: Amorphous Beat Crystalline Cobalt Iron Oxides. J. Am. Chem. Soc. 2014, 136, 17530–17536. [Google Scholar] [CrossRef]
  16. Kornienko, N.; Resasco, J.; Becknell, N.; Jiang, C.-M.; Liu, Y.-S.; Nie, K.; Sun, X.; Guo, J.; Leone, S.R.; Yang, P. Operando Spectroscopic Analysis of an Amorphous Cobalt Sulfide Hydrogen Evolution Electrocatalyst. J. Am. Chem. Soc. 2015, 137, 7448–7455. [Google Scholar] [CrossRef] [Green Version]
  17. Tran, P.D.; Tran, T.V.; Orio, M.; Torelli, S.; Truong, Q.D.; Nayuki, K.; Sasaki, Y.; Chiam, S.Y.; Yi, R.; Honma, I.; et al. Coordination polymer structure and revisited hydrogen evolution catalytic mechanism for amorphous molybdenum sulfide. Nat. Mater. 2016, 15, 640–646. [Google Scholar] [CrossRef]
  18. Li, H.; Chen, S.; Jia, X.; Xu, B.; Lin, H.; Yang, H.; Song, L.; Wang, X. Amorphous nickel-cobalt complexes hybridized with 1T-phase molybdenum disulfide via hydrazine-induced phase transformation for water splitting. Nat. Commun. 2017, 8, 15377. [Google Scholar] [CrossRef]
  19. Lee, S.C.; Benck, J.D.; Tsai, C.; Park, J.; Koh, A.L.; Abild-Pedersen, F.; Jaramillo, T.; Sinclair, R. Chemical and Phase Evolution of Amorphous Molybdenum Sulfide Catalysts for Electrochemical Hydrogen Production. ACS Nano 2015, 10, 624–632. [Google Scholar] [CrossRef]
  20. Staszak-Jirkovsky, J.; Malliakas, C.D.; Lopes, P.P.; Danilovic, N.; Kota, S.S.; Chang, K.-C.; Genorio, B.; Strmcnik, D.; Stamenkovic, V.R.; Kanatzidis, M.G.; et al. Design of active and stable Co–Mo–Sx chalcogels as pH-universal catalysts for the hydrogen evolution reaction. Nat. Mater. 2015, 15, 197–203. [Google Scholar] [CrossRef]
  21. Farrow, C.L.; Bediako, D.K.; Surendranath, Y.; Nocera, D.G.; Billinge, S.J.L. Intermediate-Range Structure of Self-Assembled Cobalt-Based Oxygen-Evolving Catalyst. J. Am. Chem. Soc. 2013, 135, 6403–6406. [Google Scholar] [CrossRef] [PubMed]
  22. Hu, X.L.; Piccinin, S.; Laio, A.; Fabris, S. Atomistic Structure of Cobalt-Phosphate Nanoparticles for Catalytic Water Oxidation. ACS Nano 2012, 6, 10497–10504. [Google Scholar] [CrossRef]
  23. Salvatore, D.A.; Dettelbach, K.E.; Hudkins, J.R.; Berlinguette, C.P. Near-infrared–driven decomposition of metal precursors yields amorphous electrocatalytic films. Sci. Adv. 2015, 1, e1400215. [Google Scholar] [CrossRef] [PubMed] [Green Version]
  24. Smith, R.D.L.; Prévot, M.S.; Fagan, R.D.; Zhang, Z.; Sedach, P.A.; Siu, M.K.J.; Trudel, S.; Berlinguette, C.P. Photochemical Route for Accessing Amorphous Metal Oxide Materials for Water Oxidation Catalysis. Science 2013, 340, 60–63. [Google Scholar] [CrossRef] [PubMed]
  25. Zhu, J.; Lambert, F.; Policar, C.; Mavré, F.; Limoges, B. Fast magnetically driven electrodeposition of amorphous metal oxide water oxidation catalysts from carbon-coated metallic nanoparticles. J. Mater. Chem. A 2015, 3, 16190–16197. [Google Scholar] [CrossRef]
  26. Kang, Y.; Yang, Y.; Yin, L.-C.; Kang, X.; Liu, G.; Cheng, H.-M. An Amorphous Carbon Nitride Photocatalyst with Greatly Extended Visible-Light-Responsive Range for Photocatalytic Hydrogen Generation. Adv. Mater. 2015, 27, 4572–4577. [Google Scholar] [CrossRef] [PubMed]
  27. Rahman, M.Z.; Tapping, P.C.; Kee, T.W.; Smernik, R.; Spooner, N.; Moffatt, J.; Tang, Y.; Davey, K.; Qiao, S. A Benchmark Quantum Yield for Water Photoreduction on Amorphous Carbon Nitride. Adv. Funct. Mater. 2017, 27, 1702384. [Google Scholar] [CrossRef] [Green Version]
  28. Zhang, R.; Li, P.; Wang, F.; Ye, L.; Gaur, A.; Huang, Z.; Zhao, Z.; Bai, Y.; Zhou, Y. Atomically dispersed Mo atoms on amorphous g-C3N4 promotes visible-light absorption and charge carriers transfer. Appl. Catal. B Environ. 2019, 250, 273–279. [Google Scholar] [CrossRef]
  29. Han, Q.; Cheng, Z.; Wang, B.; Zhang, H.-M.; Qu, L. Significant Enhancement of Visible-Light-Driven Hydrogen Evolution by Structure Regulation of Carbon Nitrides. ACS Nano 2018, 12, 5221–5227. [Google Scholar] [CrossRef]
  30. Tang, Y.; Zhou, P.; Chao, Y.; Lin, F.; Lai, J.; Li, H.; Guo, S. Face-to-face engineering of ultrathin Pd nanosheets on amorphous carbon nitride for efficient photocatalytic hydrogen production. Sci. China Mater. 2018, 62, 351–358. [Google Scholar] [CrossRef]
  31. Zou, M.; Feng, L.; Pervaiz, E.; Ganeshraja, A.S.; Gao, T.; Jiang, H.; Yang, M. An Amorphous Mn, N-Codoped TiO2 Microspheres Photocatalyst Induced by High Defects with Greatly Extended Visible-Light-Responsive Range for Photocatalytic Degradation. Nano Adv. 2017, 2, 36–44. [Google Scholar] [CrossRef]
  32. Wang, J.; Xia, Y.; Zhao, H.; Wang, G.; Xiang, L.; Xu, J.; Komarneni, S. Oxygen defects-mediated Z-scheme charge separation in g-C3N4/ZnO photocatalysts for enhanced visible-light degradation of 4-chlorophenol and hydrogen evolution. Appl. Catal. B Environ. 2017, 206, 406–416. [Google Scholar] [CrossRef] [Green Version]
  33. Yue, B.; Li, Q.; Iwaï, H.; Kako, T.; Ye, J. Hydrogen production using zinc-doped carbon nitride catalyst irradiated with visible light. Sci. Technol. Adv. Mater. 2011, 12, 34401. [Google Scholar] [CrossRef] [PubMed]
  34. Oh, W.-D.; Chang, V.W.-C.; Hu, Z.-T.; Goei, R.; Lim, T.-T. Enhancing the catalytic activity of g-C3N4 through Me doping (Me = Cu, Co and Fe) for selective sulfathiazole degradation via redox-based advanced oxidation process. Chem. Eng. J. 2017, 323, 260–269. [Google Scholar] [CrossRef]
  35. Li, B.; Si, Y.; Zhou, B.-X.; Fang, Q.; Li, Y.-Y.; Huang, W.-Q.; Hu, W.; Pan, A.; Fan, X.; Huang, G.-F. Doping-Induced Hydrogen-Bond Engineering in Polymeric Carbon Nitride To Significantly Boost the Photocatalytic H2 Evolution Performance. ACS Appl. Mater. Interfaces 2019, 11, 17341–17349. [Google Scholar] [CrossRef]
  36. Al-Gaashani, R.; Radiman, S.; Daud, A.; Tabet, N.; Al-Douri, Y. XPS and optical studies of different morphologies of ZnO nanostructures prepared by microwave methods. Ceram. Int. 2013, 39, 2283–2292. [Google Scholar] [CrossRef]
  37. Aksoy, S.; Caglar, Y.; Ilican, S.; Caglar, M. Sol–gel derived Li–Mg co-doped ZnO films: Preparation and characterization via XRD, XPS, FESEM. J. Alloy. Compd. 2012, 512, 171–178. [Google Scholar] [CrossRef]
  38. Abdei-Wahab, M.S.; Jilani, A.; Yahia, I.; Alghamdi, A. Enhanced the photocatalytic activity of Ni-doped ZnO thin films: Morphological, optical and XPS analysis. Superlattices Microstruct. 2016, 94, 108–118. [Google Scholar] [CrossRef]
  39. Chen, M.; Wang, X.; Yu, Y.; Pei, Z.; Bai, X.; Sun, C.; Huang, R.; Wen, L. X-ray photoelectron spectroscopy and auger electron spectroscopy studies of Al-doped ZnO films. Appl. Surf. Sci. 2000, 158, 134–140. [Google Scholar] [CrossRef]
  40. Jeong, Y.; Bae, C.; Kim, D.; Song, K.; Woo, K.; Shin, H.; Cao, G.; Moon, J. Bias-Stress-Stable Solution-Processed Oxide Thin Film Transistors. ACS Appl. Mater. Interfaces 2010, 2, 611–615. [Google Scholar] [CrossRef]
  41. Yu, W.; Chen, J.; Shang, T.; Chen, L.; Gu, L.; Peng, T. Direct Z-scheme g-C3N4/WO3 photocatalyst with atomically defined junction for H2 production. Appl. Catal. B Environ. 2017, 219, 693–704. [Google Scholar] [CrossRef]
  42. Sun, J.-X.; Yuan, Y.; Qiu, L.-G.; Jiang, X.; Shena, Y.; Shena, Y.; Zhu, J. Fabrication of composite photocatalyst g-C3N4–ZnO and enhancement of photocatalytic activity under visible light. Dalton Trans. 2012, 41, 6756–6763. [Google Scholar] [CrossRef]
  43. Wang, X.L.; Fang, W.Q.; Wang, H.F.; Zhang, H.; Zhao, H.; Yao, Y.; Yang, H.G. Surface hydrogen bonding can enhance photocatalytic H2 evolution efficiency. J. Mater. Chem. A 2013, 1, 14089. [Google Scholar] [CrossRef]
  44. Cao, J.; Lai, L.; Lai, B.; Yao, G.; Chen, X.; Song, L. Degradation of tetracycline by peroxymonosulfate activated with zero-valent iron: Performance, intermediates, toxicity and mechanism. Chem. Eng. J. 2019, 364, 45–56. [Google Scholar] [CrossRef]
  45. Xie, Z.; Feng, Y.; Wang, F.; Chen, D.; Zhang, Q.; Zeng, Y.; Lv, W.; Liu, G. Construction of carbon dots modified MoO3/g-C3N4 Z-scheme photocatalyst with enhanced visible-light photocatalytic activity for the degradation of tetracycline. Appl. Catal. B Environ. 2018, 229, 96–104. [Google Scholar] [CrossRef]
  46. Panneri, S.; Ganguly, P.; Nair, H.; Mohamed, A.A.P.; Warrier, K.G.; Hareesh, U.N.S. Copyrolysed C3N4-Ag/ZnO Ternary Heterostructure Systems for Enhanced Adsorption and Photocatalytic Degradation of Tetracycline. Eur. J. Inorg. Chem. 2016, 2016, 5068–5076. [Google Scholar] [CrossRef]
  47. Rasheed, H.U.; Lv, X.; Wei, W.; Yaseen, W.; Ullah, N.; Xie, J.; Zhu, W. Synthesis and studies of ZnO doped with g-C3N4 nanocomposites for the degradation of tetracycline hydrochloride under the visible light irradiation. J. Environ. Chem. Eng. 2019, 7, 103152. [Google Scholar] [CrossRef]
  48. Hao, R.; Xiao, X.; Zuo, X.; Nan, J.; Zhang, W. Efficient adsorption and visible-light photocatalytic degradation of tetracycline hydrochloride using mesoporous BiOI microspheres. J. Hazard. Mater. 2012, 209, 137–145. [Google Scholar] [CrossRef]
  49. Lee, K.M.; Lai, C.W.; Ngai, K.S.; Juan, J.C. Recent developments of zinc oxide based photocatalyst in water treatment technology: A review. Water Res. 2016, 88, 428–448. [Google Scholar] [CrossRef]
  50. Mamba, G.; Mishra, A.K. Graphitic carbon nitride (g-C3N4) nanocomposites: A new and exciting generation of visible light driven photocatalysts for environmental pollution remediation. Appl. Catal. B Environ. 2016, 198, 347–377. [Google Scholar] [CrossRef]
  51. Zhang, H.; Zong, R.; Zhu, Y. Photocorrosion Inhibition and Photoactivity Enhancement for Zinc Oxide via Hybridization with Monolayer Polyaniline. J. Phys. Chem. C 2009, 113, 4605–4611. [Google Scholar] [CrossRef]
  52. Fu, H.; Xu, T.; Zhu, S.; Zhu, Y. Photocorrosion Inhibition and Enhancement of Photocatalytic Activity for ZnO via Hybridization with C60. Environ. Sci. Technol. 2008, 42, 8064–8069. [Google Scholar] [CrossRef] [PubMed]
  53. Neppolian, B. Solar/UV-induced photocatalytic degradation of three commercial textile dyes. J. Hazard. Mater. 2002, 89, 303–317. [Google Scholar] [CrossRef]
  54. Wang, X.L.; Yang, H.G. Facile fabrication of high-yield graphitic carbon nitride with a large surface area using bifunctional urea for enhanced photocatalytic performance. Appl. Catal. B Environ. 2017, 205, 624–630. [Google Scholar] [CrossRef]
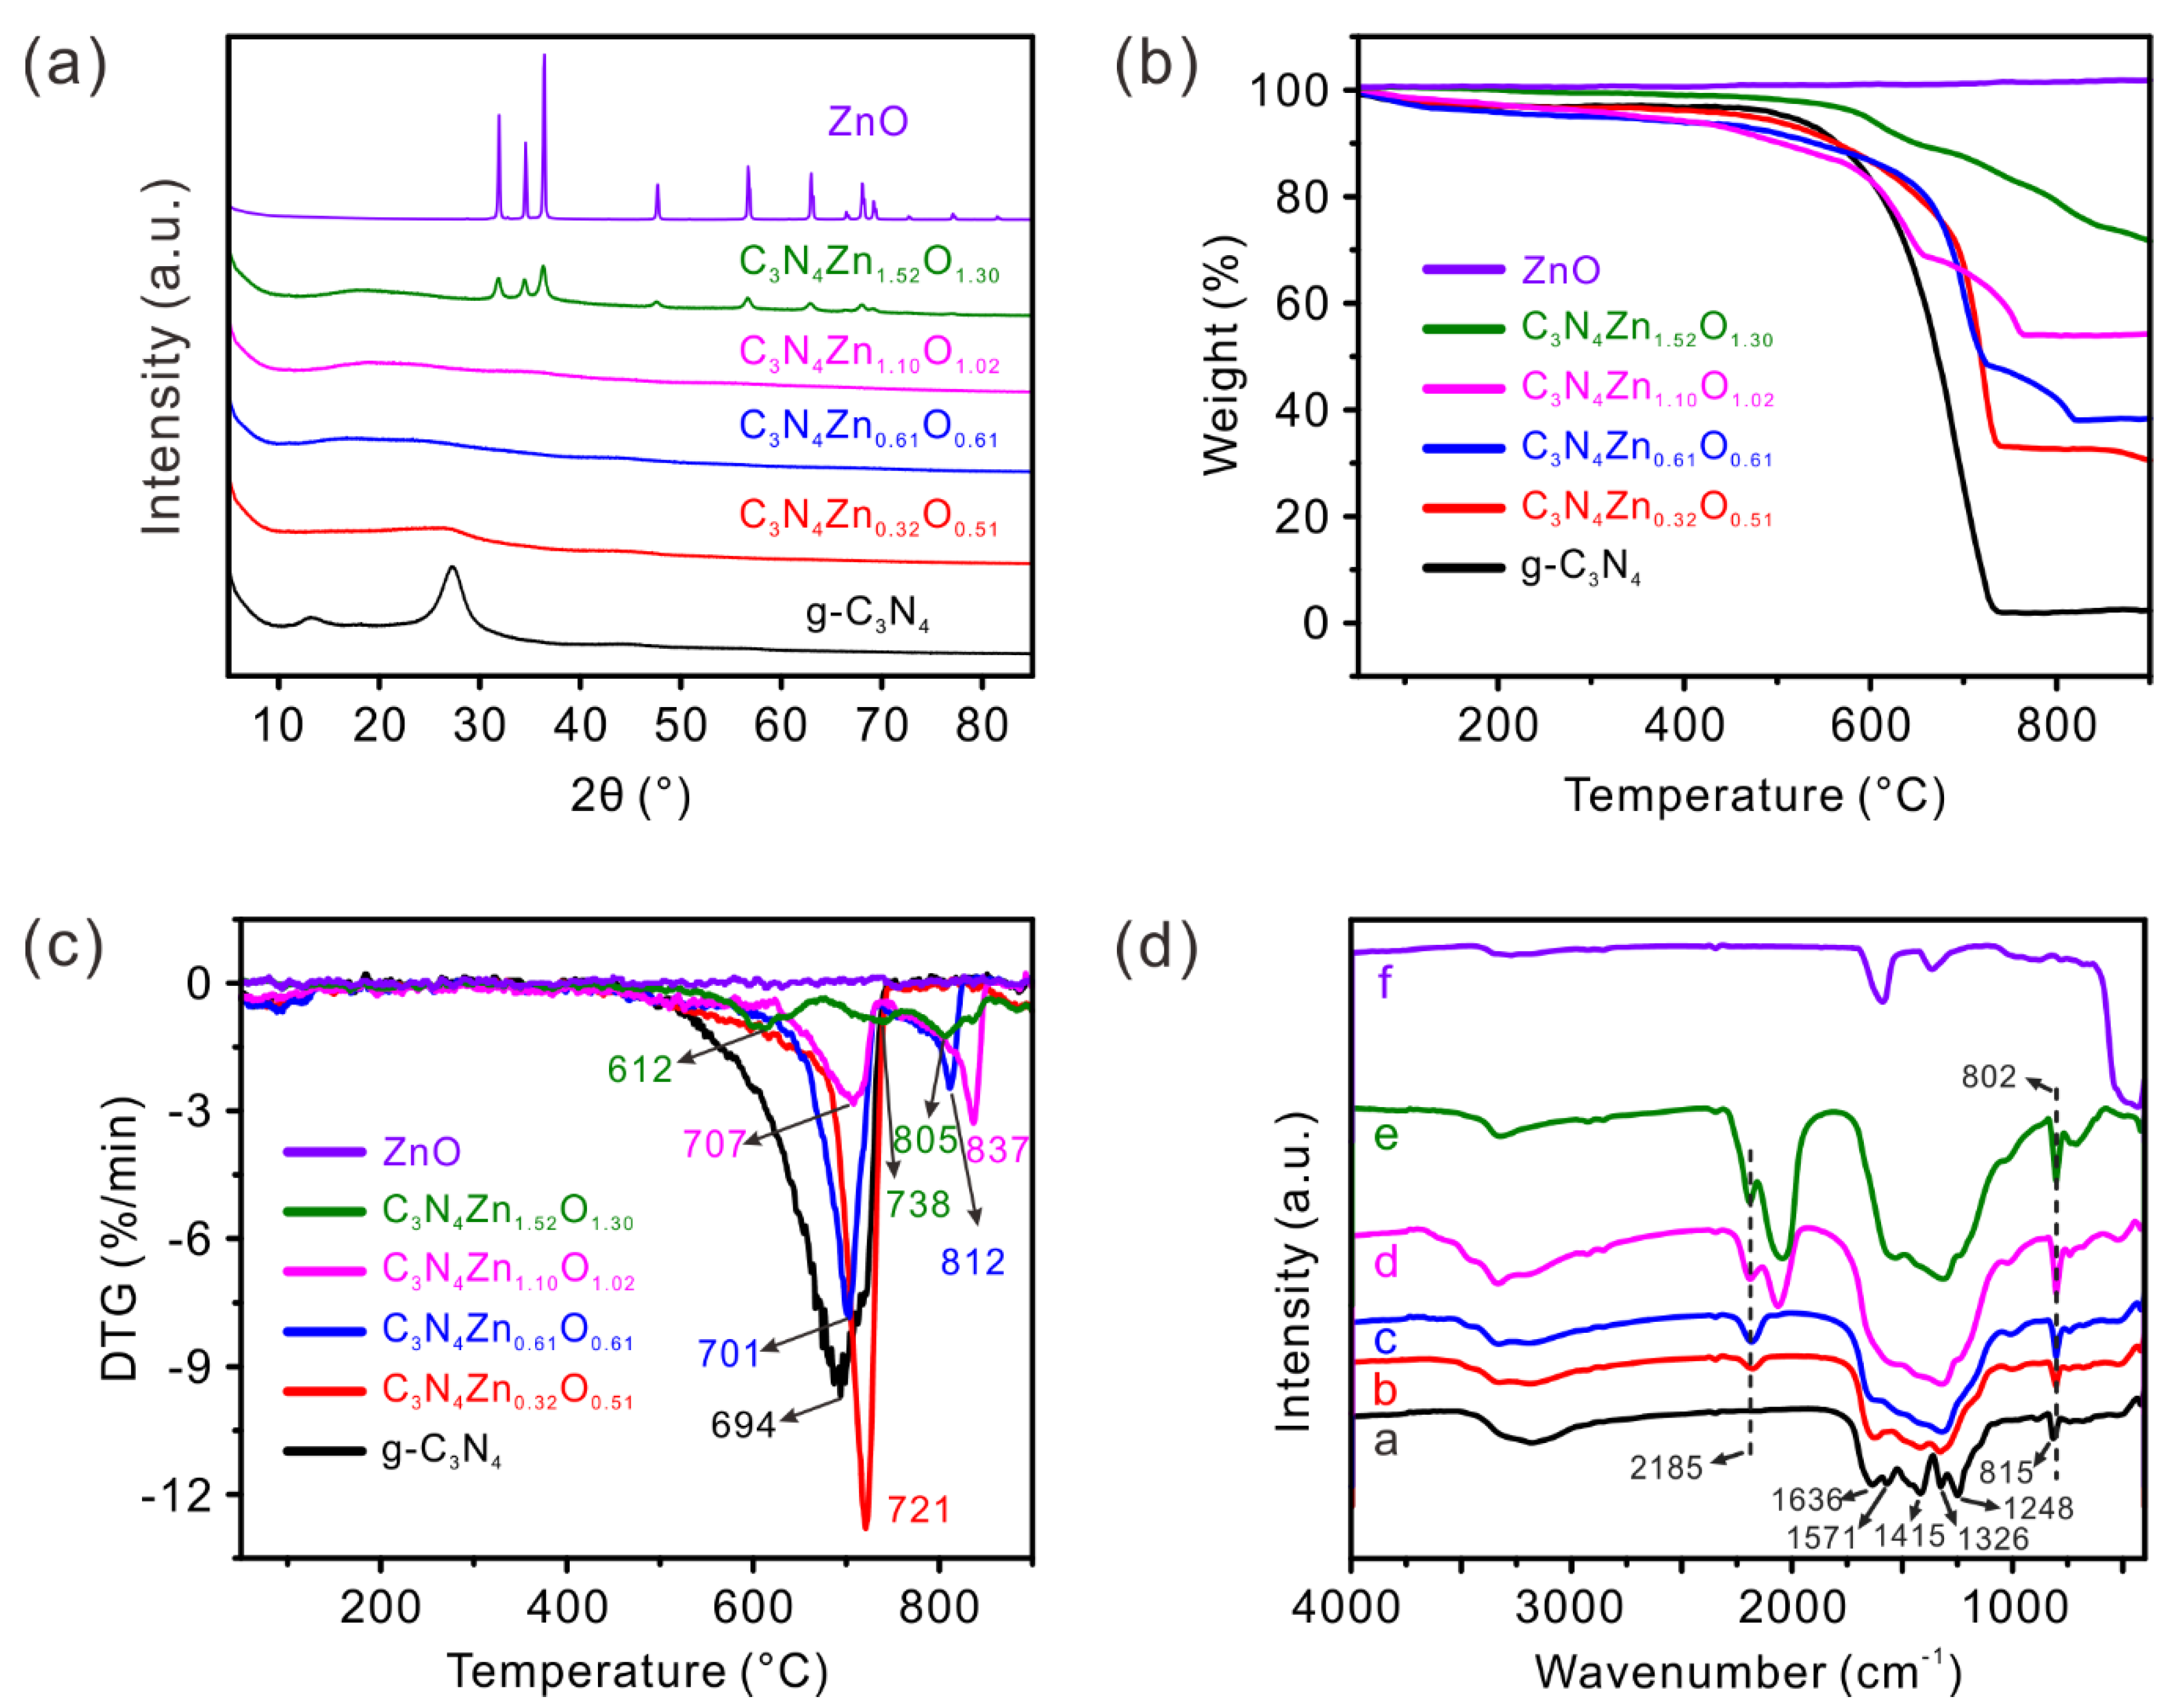
Figure 1. (a) XRD patterns, (b) Thermogravimetric analysis (TGA) curves, and (c) DTG curves of g-C3N4, C3N4ZnxOy, and ZnO samples. (d) Fourier transform infrared spectra (FTIR) of (a) g-C3N4, (b) C3N4Zn0.32O0.51, (c) C3N4Zn0.61O0.61, (d) C3N4Zn1.10O1.02, (e) C3N4Zn1.52O1.30 and (f) ZnO. Recorded in transmission mode.
Catalysts 10 00514 g001
Figure 2. SEM images of (a) C3N4Zn0.32O0.51, (b) C3N4Zn0.61O0.61, (c) C3N4Zn1.10O1.02 and (d) C3N4Zn1.52O1.30; (e) EDS mapping of C3N4Zn1.10O1.02.
Catalysts 10 00514 g002
Figure 3. (a) UV-Vis absorption spectra of g-C3N4, C3N4ZnxOy, and ZnO samples. (b) Tauc plot of g-C3N4, C3N4ZnxOy, and ZnO samples, appropriate for evaluating optical band gap energies of indirectly allowed transitions. (c) Photoluminescence emission spectra of g-C3N4, C3N4ZnxOy, and ZnO at the excitation wavelength of 325 nm. (d) Transient photocurrent generation from C3N4ZnxOy electrodes at 0.6 V versus Ag/AgCl in 0.2 M Na2SO4 plus 10 vol% triethanolamine (TEOA) under a 300 W xenon lamp full spectrum irradiation (320–780 nm, 0.8 W/cm2).
Catalysts 10 00514 g003
Figure 4. XPS spectra of g-C3N4, C3N4ZnxOy, and ZnO samples. Frame A: C 1s photoelectron energies; Frame B: N 1s photoelectron energies; Frame C: O 1s photoelectron energies; Frame D: Zn 2p photoelectron energies.
Catalysts 10 00514 g004
Figure 5. 1H and 13C NMR spectra of g-C3N4, C3N4ZnxOy, and ZnO samples. The spectra were obtained at a MAS spinning rate of 8 kHz and the symbol * represents the spinning sidebands. The chemical shifts of the spectra were calibrated according to adamantane (1H 1.46 ppm, 13C 38.56 ppm).
Catalysts 10 00514 g005
Figure 6. (a) The absorption spectra of TC-HCl solution (10 mg/L) at different irradiation times under visible light, using C3N4Zn0.61O0.61 as the photocatalyst. (b) Photocatalytic degradation efficiencies of TC-HCl using g-C3N4, C3N4ZnxOy, and ZnO as the photocatalysts under visible light irradiation (420–780 nm, 0.6 W/cm2).
Catalysts 10 00514 g006
Figure 7. Recycling properties of the C3N4Zn0.61O0.61 photocatalyst.
Catalysts 10 00514 g007
Table 1. Elemental analysis and specific surface areas of g-C3N4 and C3N4ZnxOy (x, y = 0.32–1.52) samples.
SampleH
(wt %)
C
(wt %)
N
(wt %)
O
(wt %)
Zn
(wt %)
Atom Ratio (C:N:O:Zn)Specific Surface Area (m2/g)
g-C3N41.9434.6059.864.2302.70:4:0.25:0.0089.8
C3N4Zn0.32O0.511.3527.4146.826.8317.602.73:4:0.51:0.3275.5
C3N4Zn0.61O0.610.9823.2140.247.0628.522.69:4:0.61:0.6145.9
C3N4Zn1.10O1.020.8017.6931.729.2840.522.60:4:1.02:1.1042.7
C3N4Zn1.52O1.300.5516.0726.539.8647.002.83:4:1.30:1.5241.5