Article

Contrasting Effects of Potassium Addition on M3O4 (M = Co, Fe, and Mn) Oxides during Direct NO Decomposition Catalysis

by
Torin C. Peck
,
Charles A. Roberts
* and
Gunugunuri K. Reddy
*
Toyota Research Institute of North America, Ann Arbor, MI 48105, USA
*
Authors to whom correspondence should be addressed.
Catalysts 2020, 10(5), 561; https://doi.org/10.3390/catal10050561
Submission received: 24 March 2020 / Revised: 8 May 2020 / Accepted: 15 May 2020 / Published: 19 May 2020
(This article belongs to the Special Issue Catalytic Decomposition of N2O and NO)

Abstract

:
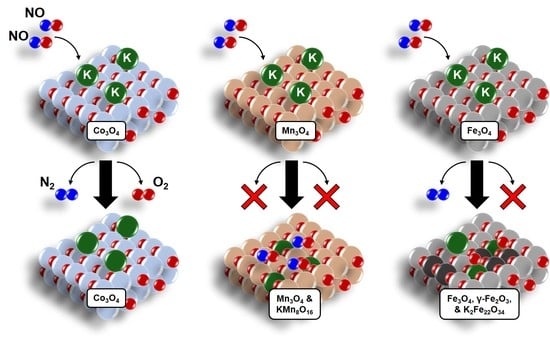
While the promotional effect of potassium on Co3O4 NO decomposition catalytic performance is established in the literature, it remains unknown if K is also a promoter of NO decomposition over similar simple first-row transition metal spinels like Mn3O4 and Fe3O4. Thus, potassium was impregnated (0.9–3.0 wt.%) on Co3O4, Mn3O4, and Fe3O4 and evaluated for NO decomposition reactivity from 400–650 °C. The activity of Co3O4 was strongly dependent on the amount of potassium present, with a maximum of ~0.18 [(µmol NO to N2) g−1 s−1] at 0.9 wt.% K. Without potassium, Fe3O4 exhibited deactivation with time-on-stream due to a non-catalytic chemical reaction with NO forming α-Fe2O3 (hematite), which is inactive for NO decomposition. Potassium addition led to some stabilization of Fe3O4, however, γ-Fe2O3 (maghemite) and a potassium–iron mixed oxide were also formed, and catalytic activity was only observed at 650 °C and was ~50× lower than 0.9 wt.% K on Co3O4. The addition of K to Mn3O4 led to formation of potassium–manganese mixed oxide phases, which became more prevalent after reaction and were nearly inactive for NO decomposition. Characterization of fresh and spent catalysts by scanning electron microscopy and energy dispersive X-ray analysis (SEM/EDX), in situ NO adsorption Fourier transform infrared spectroscopy, temperature programmed desorption techniques, X-ray powder diffraction (XRD), Raman spectroscopy, and X-ray photoelectron spectroscopy (XPS) revealed the unique potassium promotion of Co3O4 for NO decomposition arises not only from modification of the interaction of the catalyst surface with NOx (increased potassium-nitrite formation), but also from an improved ability to desorb oxygen as product O2 while maintaining the integrity and purity of the spinel phase.

Graphical Abstract

1. Introduction

Although the direct decomposition of nitric oxide (NO) to N2 and O2 is thermodynamically favorable, the reaction kinetics are hindered [1,2]. To overcome the slow kinetics, many and various catalyst materials have been studied, such as precious metals [3,4,5], transition metal ion-exchanged zeolites [6,7,8], perovskites [9,10,11], and rare earth oxides [12,13]. However, spinel oxides have emerged as one of the most widely studied catalyst groups for NO decomposition due to their versatile compositions and good redox properties [14,15,16,17,18,19,20,21].
Early reports of Co3O4 for NO decomposition describe it as one of the most promising single element oxides for NO decomposition, albeit with low activity [15,16]. A nickel–chromium spinel was also evaluated for NO decomposition, however it was oxidized by NO, leading to its deactivation [17]. This material could be regenerated via pulses of CO in the reactant feed, but such a result implies the necessity of a reductant to perform catalytic cycles, which is not truly direct NO decomposition. Similar reports of oxidation of the catalyst material via NO have been observed for other catalysts, particularly Pd-based materials [4,5].
A breakthrough in NO decomposition research on spinels occurred by evaluating Co3O4 synthesized via co-precipitation from a sodium carbonate aqueous solution [18]. It was deduced that residual Na was necessary to achieve good catalytic activity due to the tendency for alkali ions such as Na and K to promote nitrate formation. Later, a systematic optimization of the K concentration via impregnation onto Co3O4 led to a higher performance at ≥450 °C and confirmation that the presence of the alkali K was necessary to achieve the result [19]. However, alkali promotion is not the only path to improve NO decomposition performance over spinel oxides, as addition of other transition metals or dopants have yielded increases in activity. Very recently, studies from the authors have shown that doping Co3O4 with Cu, or impregnation of Cu on the surface of Co3O4, yields highly active NO decomposition catalysts at temperatures ≤500 °C, with optimization of the Cu loading during impregnation producing a catalyst with areal activity and N2 selectivity exceeding that of the previous literature benchmark catalysts for NO decomposition, Cu-ZSM5 [20,21].
Potassium promotion and transition metal variation of spinel catalysts has also yielded success for N2O decomposition [20,22,23,24,25]. The simple first-row transition metal spinels Co3O4, Mn3O4, and Fe3O4 spinels with K impregnation have been the focus of much research for N2O decomposition, however to our knowledge, no work has been published regarding the performance of the latter two systems for NO decomposition [25]. Extension of these strategies for N2O decomposition to improvement of NO decomposition performance is reinforced by reports of increased NO decomposition activity via addition of K to more complex spinels containing Co, Mn, and Al [26]. Activity for NO decomposition has been reported over Mn3O4 in the absence of K addition, but the activity was relatively low at 600 °C [27], thus the extension to Mn3O4 is natural. Spinels containing Fe are less frequently reported, however, perovskites based on La, Ti, Mg, and Fe are active from 300 to 550 °C. Characterization of the perovskites by Mössbauer spectroscopy revealed that the most active samples contained an Fe3+ sextet, which was able to form catalytically active complexes via exchange interaction with nearby Fe3+ doublet in octahedral coordination [10].
Thus, this study undertakes to determine the effect of alkali addition on the NO decomposition reactivity of Co3O4, Mn3O4, and Fe3O4 by impregnation of K ions at various loadings and to characterize the effect of K on the structure of the spinel and relevant mechanistic steps.

2. Results and Discussion

2.1. NO Decomposition Catalytic Performance

The NO conversion of Co3O4 based materials is strongly dependent on the presence of K. In the absence of K, NO conversion is below 5% at all temperatures from 400 to 650 °C (Figure 1a, Tables S1–S4). With the addition of K, the NO conversion is unaffected at 400 °C, but NO conversion begins to increase at 450 °C (~1%–2% increase). Conversion increases approximately by a factor of five at 550 °C, and reaches a maximum of ~60% at 650 °C. For all Mn3O4 and Fe3O4 samples without and with K promotion, the NO conversion is non-negligible, but falls below 5% at all temperatures (Figure 1b,c, Tables S1–S4).
Regarding catalytic activity for NO decomposition, it is emphasized that rates were calculated utilizing only the NO converted to the selective product of N2 (calculated by mass-balance) and only from NO conversions of less than 25% to minimize the effect of reactant concentration gradients along the reactor bed length. The latter consideration was specifically addressed for the K Co3O4 catalysts at 650 °C, where conversions were significantly above 25% and additional testing was performed to achieve conversions below 10% (Table S5).
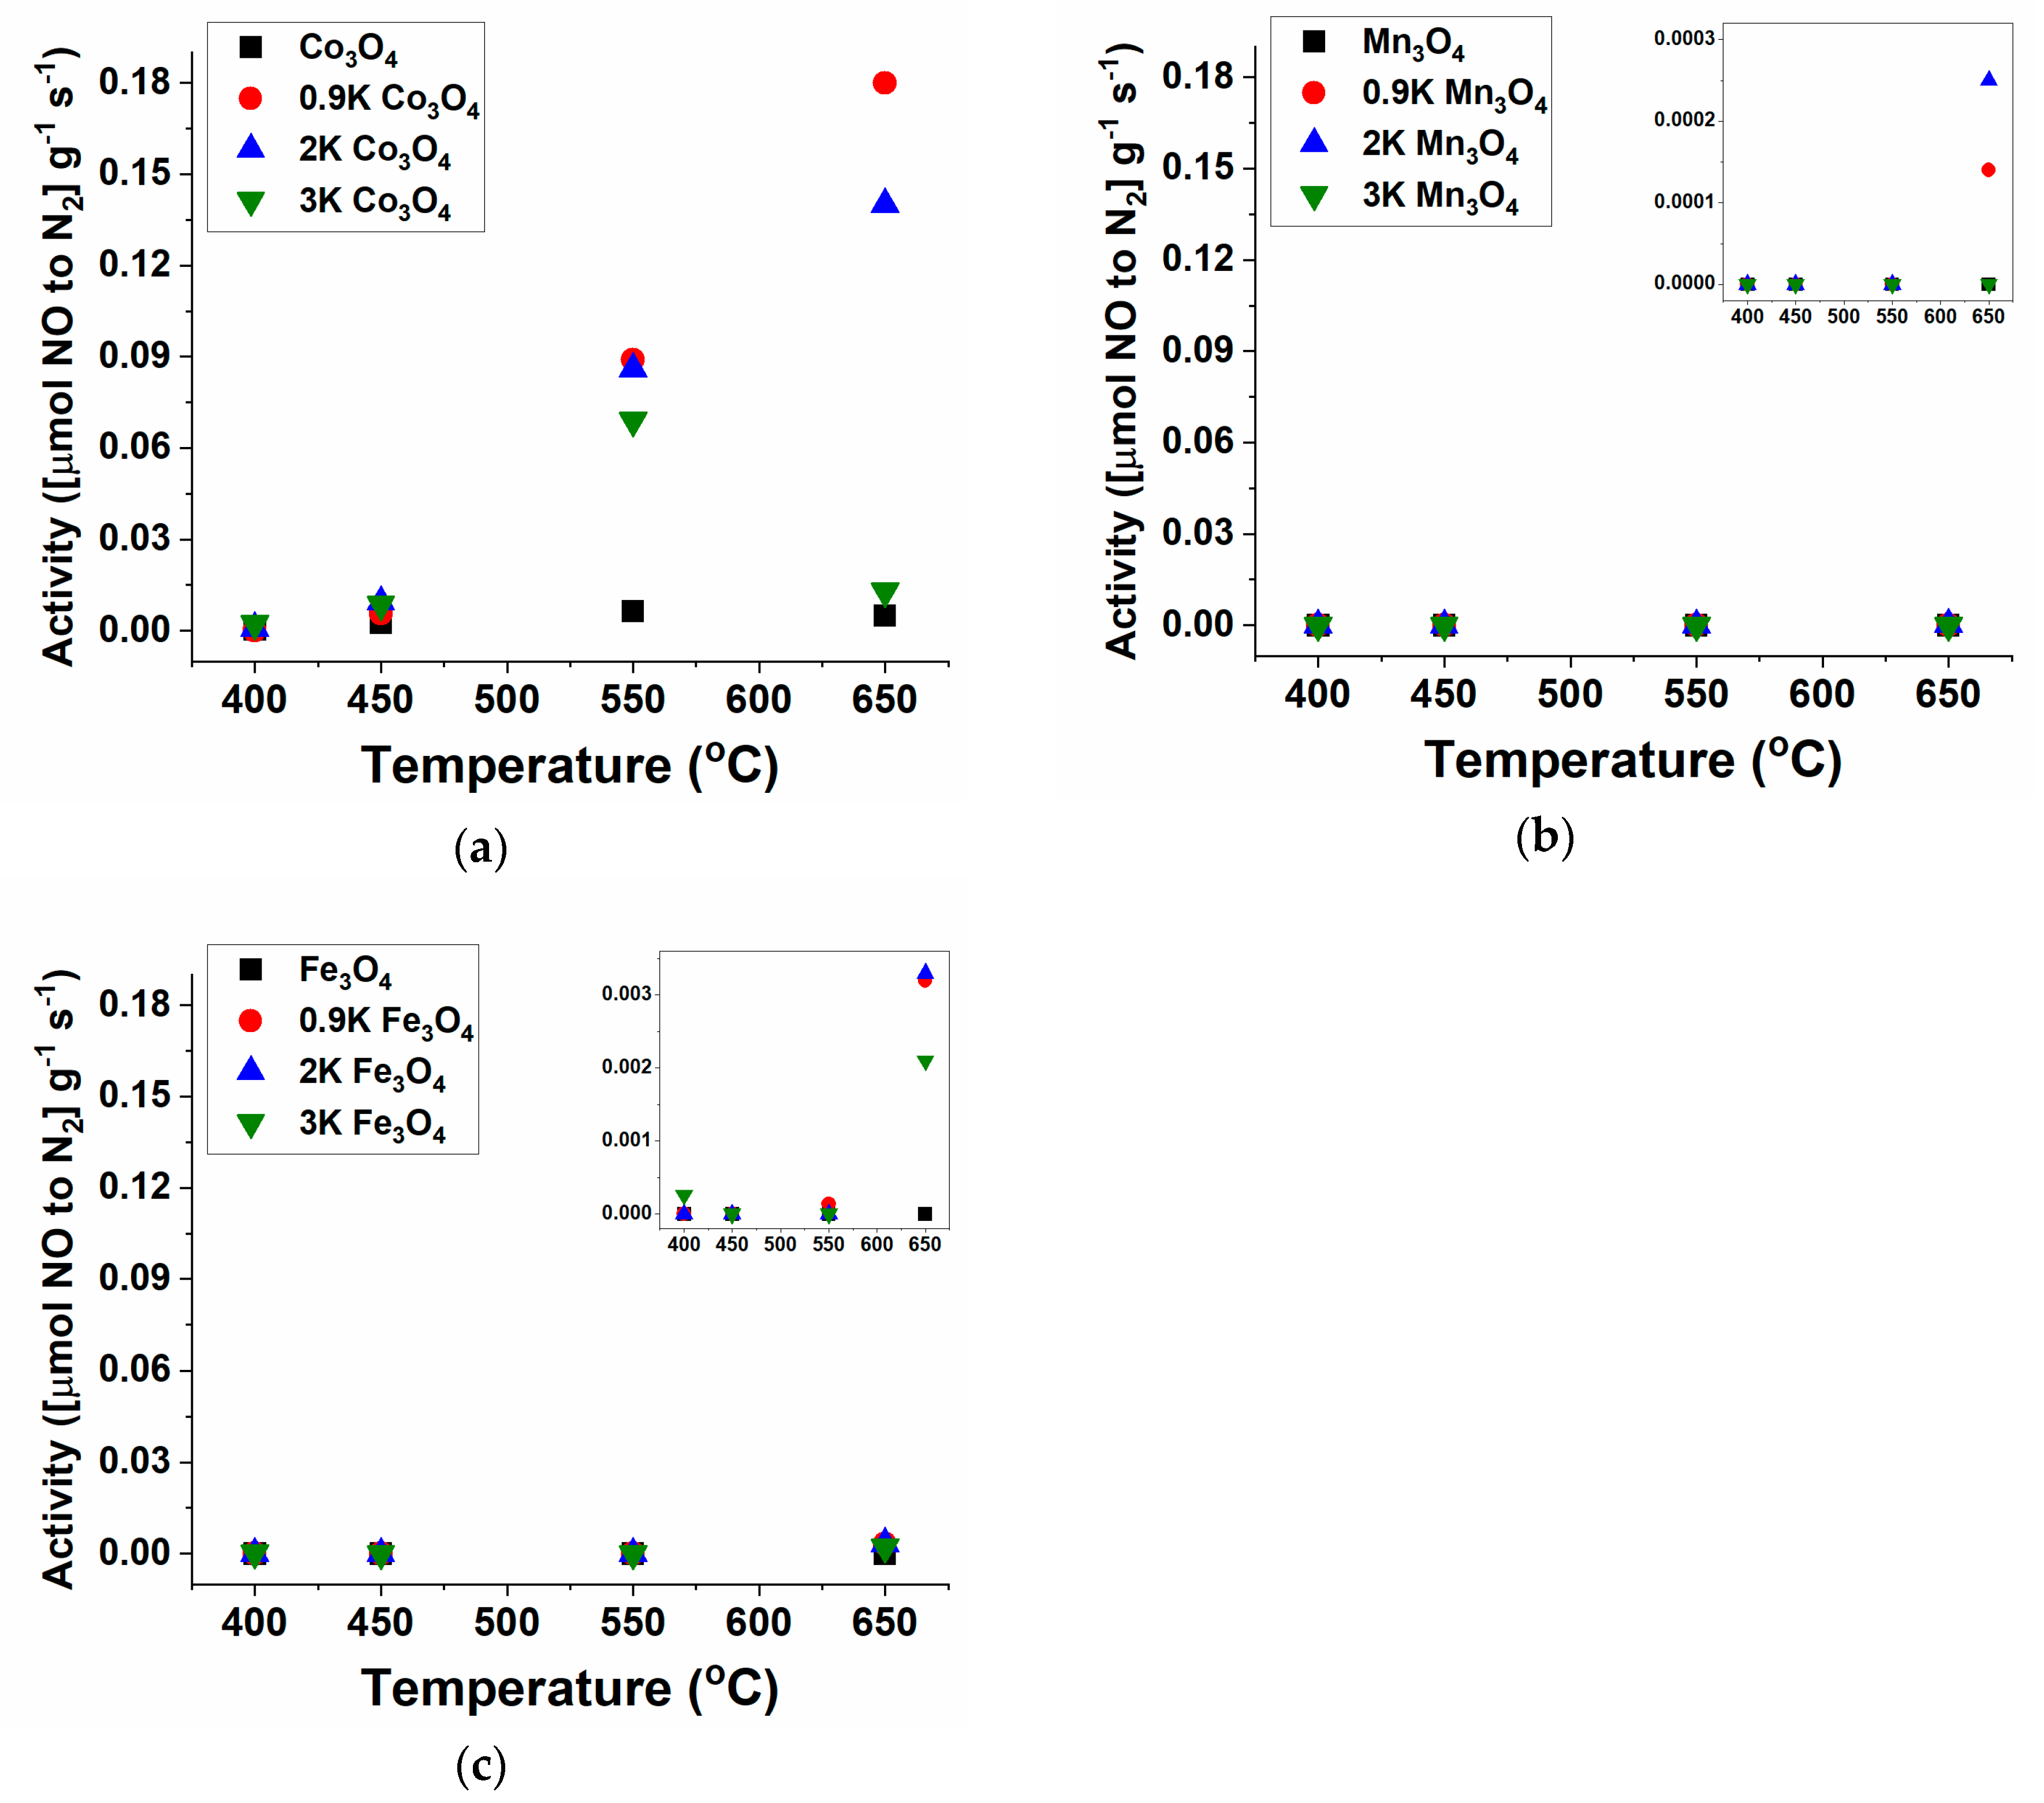
As calculation of activities incorporates the selectivity to N2, additional insight into the catalyst reactivity for direct NO decomposition can be gained, i.e., NO conversion to nitrogen-containing products other than N2 does not contribute to direct NO decomposition activity reported herein. Regarding the catalytic performance at 400 °C, some N2 production was found over the Co3O4-based samples, however, this was only significant for the 3K Co3O4 catalysts (N2 selectivity ~12%, Activity = 2.3 × 10⁻³ [(µmol NO to N2) g−1 s−1], whereas the activity of catalysts with less K can be considered negligible, e.g., on the order of 10−4 [(µmol NO to N2) g−1 s−1] (Figure 2a, Table S1). Moving to higher temperatures, the 0.9K and 2K Co3O4 catalysts proved most active, with the 0.9K Co3O4 sample yielding a maximum of ~0.18 [(µmol NO to N2) g−1 s−1] at 650 °C. This result is in excellent agreement with earlier reports of K promotion of Co3O4 that determined impregnation of ~0.9 wt.% K was optimal to achieve maximum NO decomposition activity at ≥450 °C [19]. While the current study shows that the 0.9 K Co3O4 catalyst displayed the highest NO decomposition activity at both 550 and 650 °C, it was observed that the 2K Co3O4 catalyst was more active at 450 °C (Figure 2a). Higher loadings (2 and 3 wt.% K) were chosen for this study as the maximum N2O decomposition for K promoted Mn3O4 and Fe3O4 occurred at higher loadings than the Co3O4 spinel [25], however, this variation in optimal K loading with temperature was not previously reported.
The selectivity to N2 approached 90% at 550 °C and was nearly 100% at 650 °C for both 0.9K Co3O4 and 2K Co3O4 (Tables S3 and S4). For direct NO decomposition, additional non-selective nitrogen-containing products are typically identified as NO2 and/or N2O. For Co3O4-based catalysts, NO2 was the only non-selective nitrogen-containing product detected (Tables S1–S4). Unfortunately, at the lower temperatures of 400 and 450 °C, the Co3O4-based catalyst produced more NO2 with maximum selectivity to N2 not exceeding 42% over the 2K and 3K Co3O4 catalysts (Tables S1 and S2). Despite this observation, the complete lack of N2O production over Co3O4-based catalysts at these temperatures is of particular note as the undesired formation of this greenhouse gas has been reported as a potential selectivity issue for other direct NO decomposition catalysts exhibiting activity below 500 °C, such as Cu-ZSM5 [7].
Without K addition, both Mn3O4 and Fe3O4 did not display significant activity for NO decomposition to N2 (Figure 2b,c), with calculated activities falling one–two orders of magnitude below those of Co3O4-based catalysts. There is activity for NO decomposition to N2 at 650 °C over all Fe3O4 samples at all K loadings, however, the maximum activity of 3.3 × 10⁻³ [(µmol NO to N2) g−1 s−1] over 2K Fe3O4 is more than 50× lower than that of 0.9 K Co3O4 (Figure 2c). Similarly, while some selectivity to N2 over 0.9K Mn3O4 and 2K Mn3O4 was found at 650 °C (Table S6), the calculated activity values are even less than K Fe3O4 catalysts; corresponding to a reactor outlet concentration of less than 10 ppm N2. At such a low production of N2, the calculated rates are not reliably comparable (Figure 2b, Tables S1–S4). Most of the non-selective NO conversion is to NO2, but unlike Co3O4, trace production of N2O was detected over some of the K Mn3O4 and K Fe3O4 samples from 400 to 550 °C (Tables S1–S3). For N2O decomposition, the maximum promotion effect was reported to occur at slightly higher K loadings for Mn3O4 and Fe3O4 as compared to Co3O4 [25], and indeed the current results agree that the 2 wt.% K loading was optimal compared to 0.9 wt.% for Co3O4. However, the current findings for NO decomposition over K-promoted Mn3O4 and Fe3O4 deviate from those of N2O decomposition regarding the degree of promotion, which was strong for N2O decomposition over Mn3O4 catalysts, and a similar, though milder, for Fe3O4 [25].

2.2. Comparison of Adsorbed Intermediates

Alkali addition is often utilized to increase NO adsorption of materials used as low temperature NOx adsorbers, as nitrites and nitrates of alkalis are often thermally stable [28]. Therefore, it is likely that the addition of K to the spinel catalysts will affect the adsorption of surface NOx species. The in situ NO adsorption Fourier transform infrared (FTIR) spectra at 300 °C of the spinel catalysts with and without K (2 wt.%) are presented in Figure 3. Without K, the spectra for Co3O4, Fe3O4, and Mn3O4 do not contain any strong features indicative of adsorbed NOx species. With the addition of K to Co3O4, Mn3O4, and Fe3O4, several prominent features in the NOx adsorption region 1600–1000 cm−1 are observed and are indicative of the formation of stable nitrates and/or nitrites at 300 °C [28,29]. For K Co3O4, a single broad peak centered at 1375 cm−1 is attributed to the νas(NO3) bulk-like nitrate NO3- anions [29]. Such a species is likely the result of the formation of a potassium nitrate species. Indeed, similar features can be attributed to the FTIR spectra of both K Fe3O4 and K Mn3O4, which exhibit a broad peak overlapping similar wavenumbers. The spectra of K Fe3O4 and K Mn3O4 also contain two additional broad peaks centered at 1360 and 1250 cm−1, which are assigned to the νs(NO2) and νas(NO2) modes of a bulk-like nitrite NO2 anion [29]. Given the absence of these features in the FTIR spectra of the alkali-free Fe3O4 and Mn3O4 catalysts, it is concluded that such species manifest as result of potassium nitrite formation.
Admittedly, the NOx species identified by in situ FTIR during NO adsorption at 300 °C are not useful for identification of the molecular nature of the surface adsorption sites participating in direct NO decomposition as they were collected below the active temperatures for these materials. Thus, it would also be inappropriate to speculate that the NOx adsorption species identified here are intermediates in the decomposition. Rather, the value of this result is to demonstrate and confirm that K addition changes the interaction of the catalyst surface with the NO reactant molecules. Alkali addition has been shown to improve the stability and quantity of adsorbed NOx species over a variety of materials, especially those used as low temperature NOx adsorption materials [28], and the FTIR spectra in Figure 3 strongly agree with those previous observations.
The observation of the surface NOx species alone, however, is insufficient to explain the relatively high activity results only for K promotion of Co3O4 and not for Fe3O4 or Mn3O4. Given all three spinels show a significant increase in NO adsorption upon K addition, it is implied that additional mechanistic step(s) or catalyst properties are promoted when K is added specifically to Co3O4. The desorption of oxygen as product O2 is well-established as a key step of the reaction mechanism for direct NOx decomposition over a myriad of catalysts, including PGMs and spinel oxides [3,4,5,17]. Therefore, an investigation of the oxygen product formation and the effect of oxygen release on the catalyst structure and stability was performed.

2.3. O2 Release and NO Decomposition and the Effect of K Loading

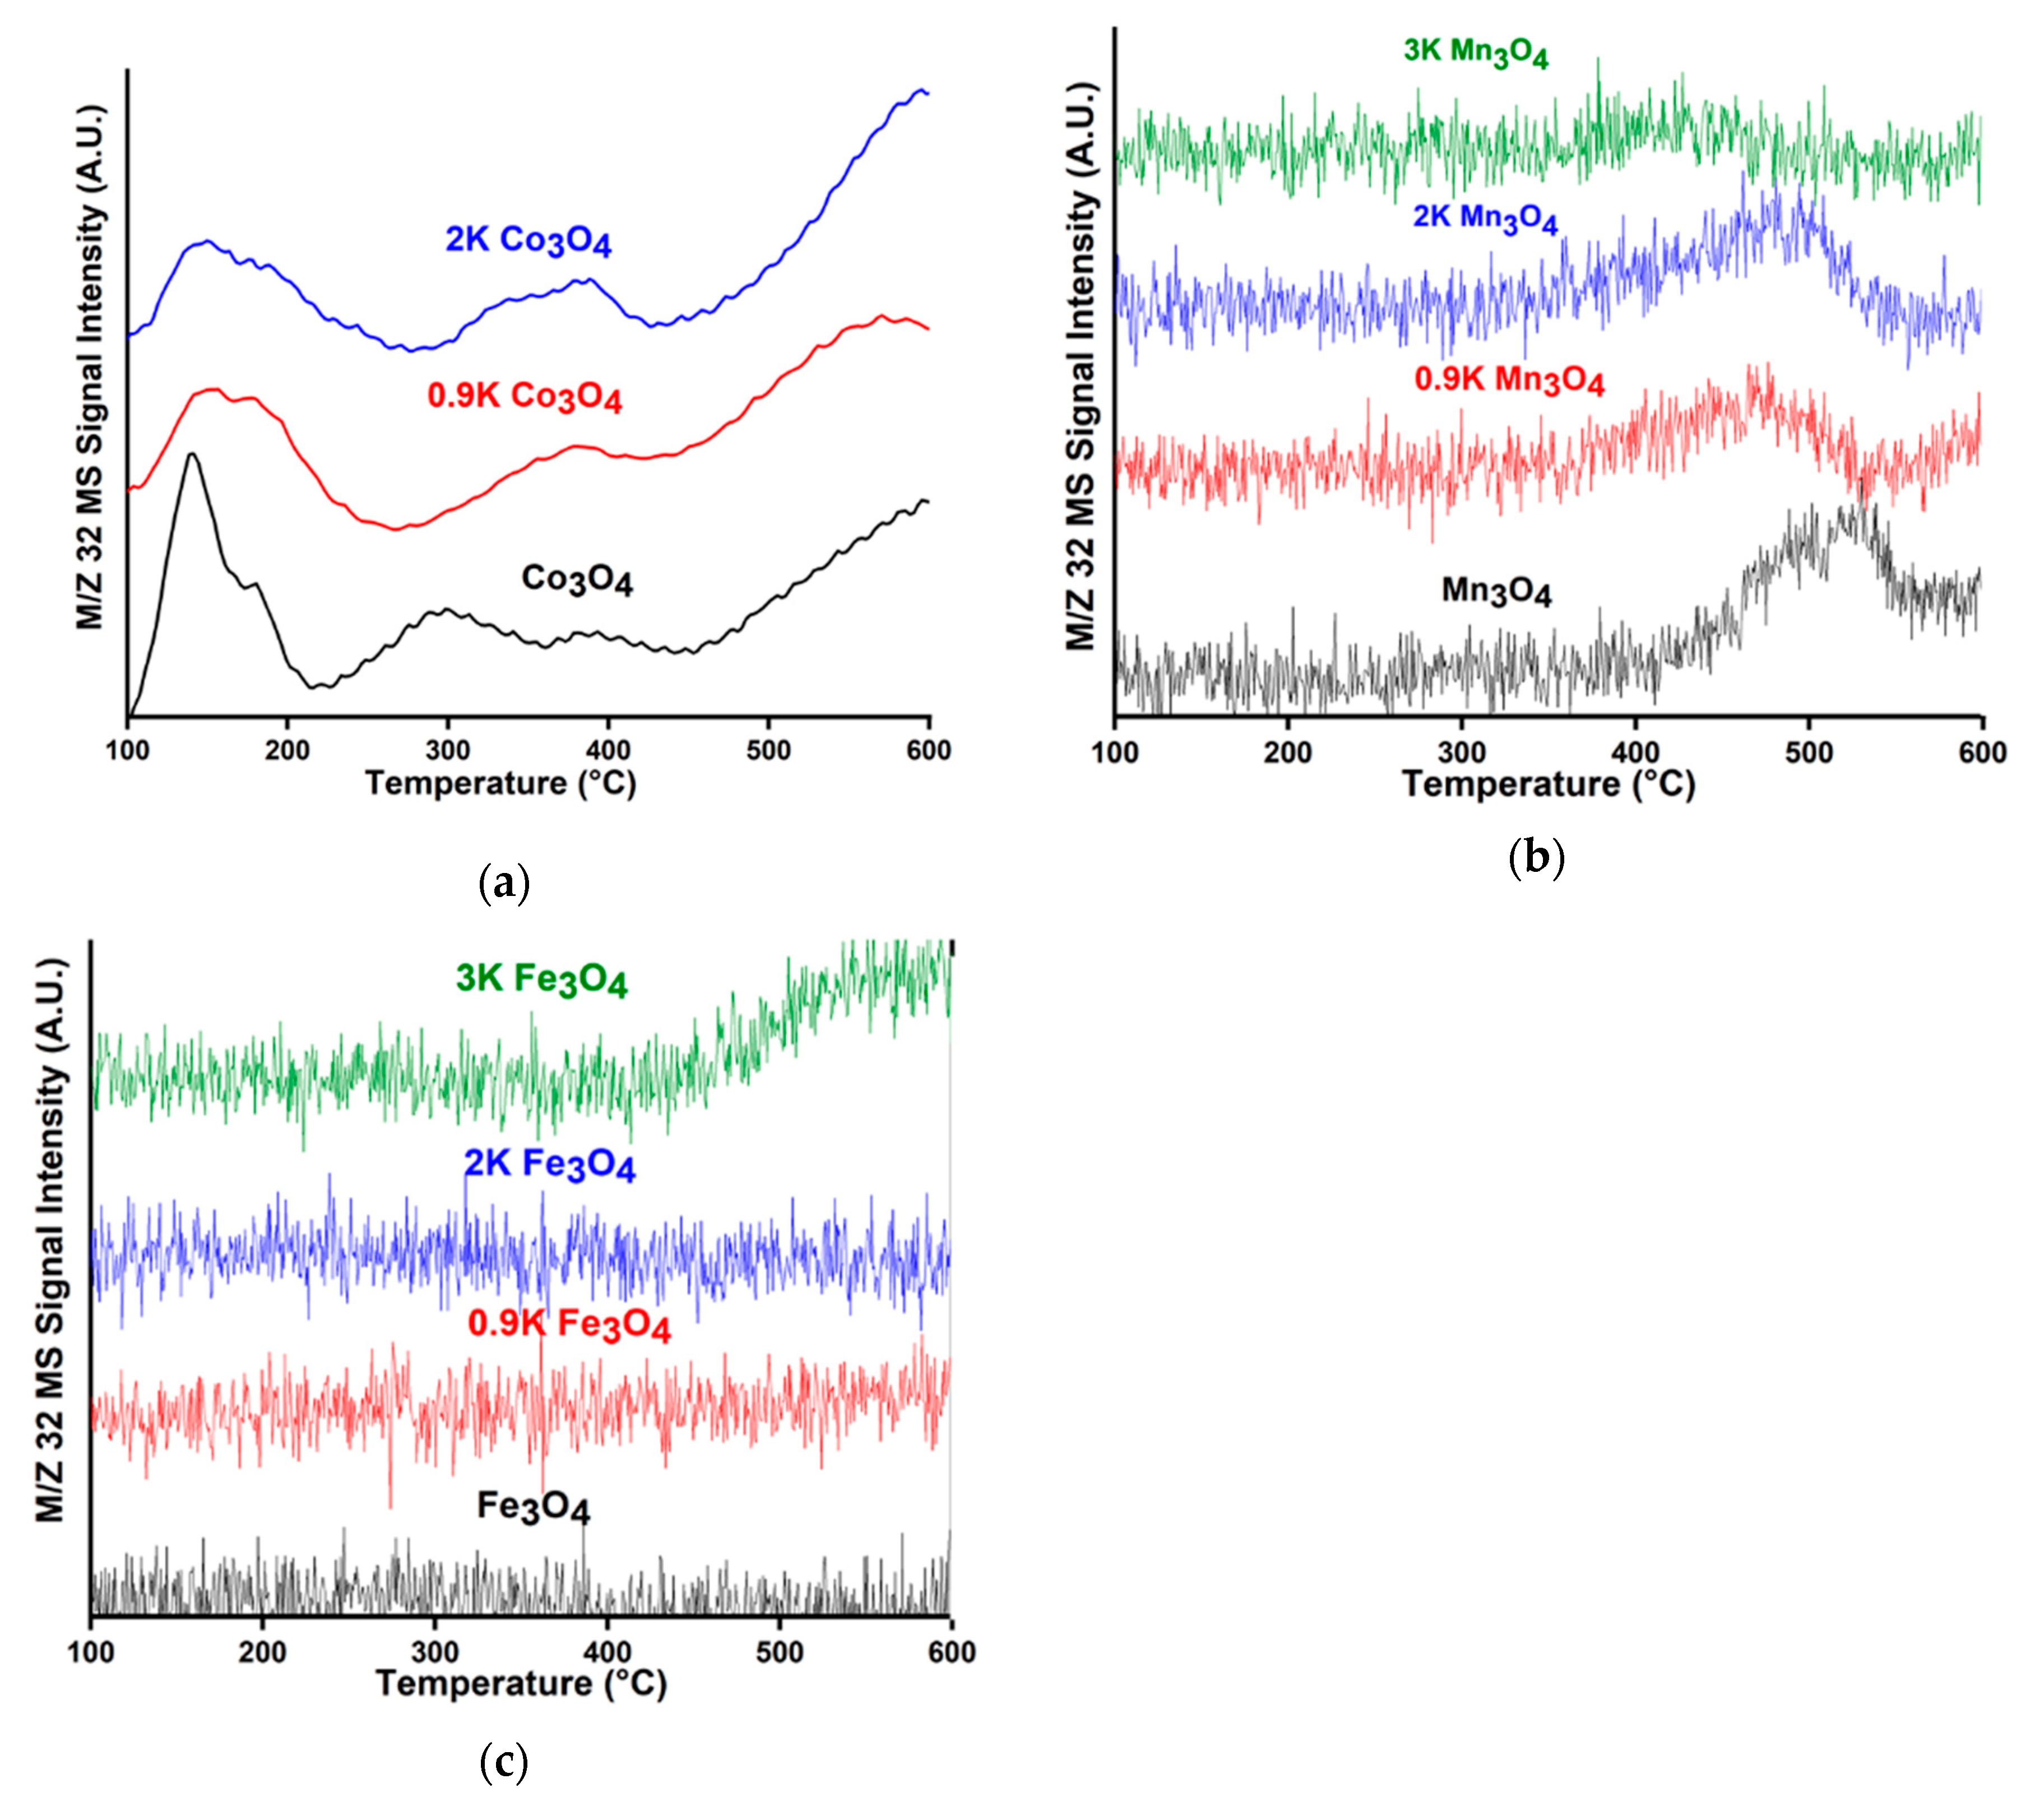
The above activity results emphasized the production of the selective product N2 when assessing the reactivity of direct NO decomposition catalyst materials, but it is of equal importance to confirm that oxygen can desorb from the catalyst as product O2 to complete the catalytic cycle. The effect of K on the release of O2 from Co3O4, Fe3O4, and Mn3O4 was examined via oxygen temperature-programmed desorption (O2-TPD). The release of O2 was qualified by tracking increases in intensity of the O2 mass spectrometer (MS) signal (m/z = 32) during the temperature ramp. Based on this metric, it is observed that Co3O4 releases O2 across all relevant reaction temperatures, i.e., ≥400 °C (Figure 4a). The addition of K of various amounts to Co3O4 leads to some minor differences from ~220 to 400 °C in the O2-TPD profile, but the general observations are largely similar, leading to the conclusion that K does not significantly affect O2 release over Co3O4. Given the relatively large signal-to-noise compared to the O2-TPD profiles of the Co3O4-based catalysts, very little O2 release can said to be observed over the Mn3O4- and Fe3O4-based compounds (compare Figure 4a–c). Slight rises in intensity in the O2-TPD profile can be observed for the Mn3O4 catalysts of all K loadings, but a relative comparison with varying K loading suggests that K actually can decrease O2 release (Figure 4b). For Fe3O4, only the O2-TPD profile of 3K Fe3O4 suggested any oxygen release (Figure 4c). Ultimately, the relatively greater O2 release from Co3O4 compared to Mn3O4 is not unexpected and has been reported previously by others [27]. The O2-TPD experiment is, however, conducted in the absence of the reactant NO, and the ability to release O2 in its absence should not be interpreted as the ability to produce N2 and O2 under direct NO decomposition reaction conditions.
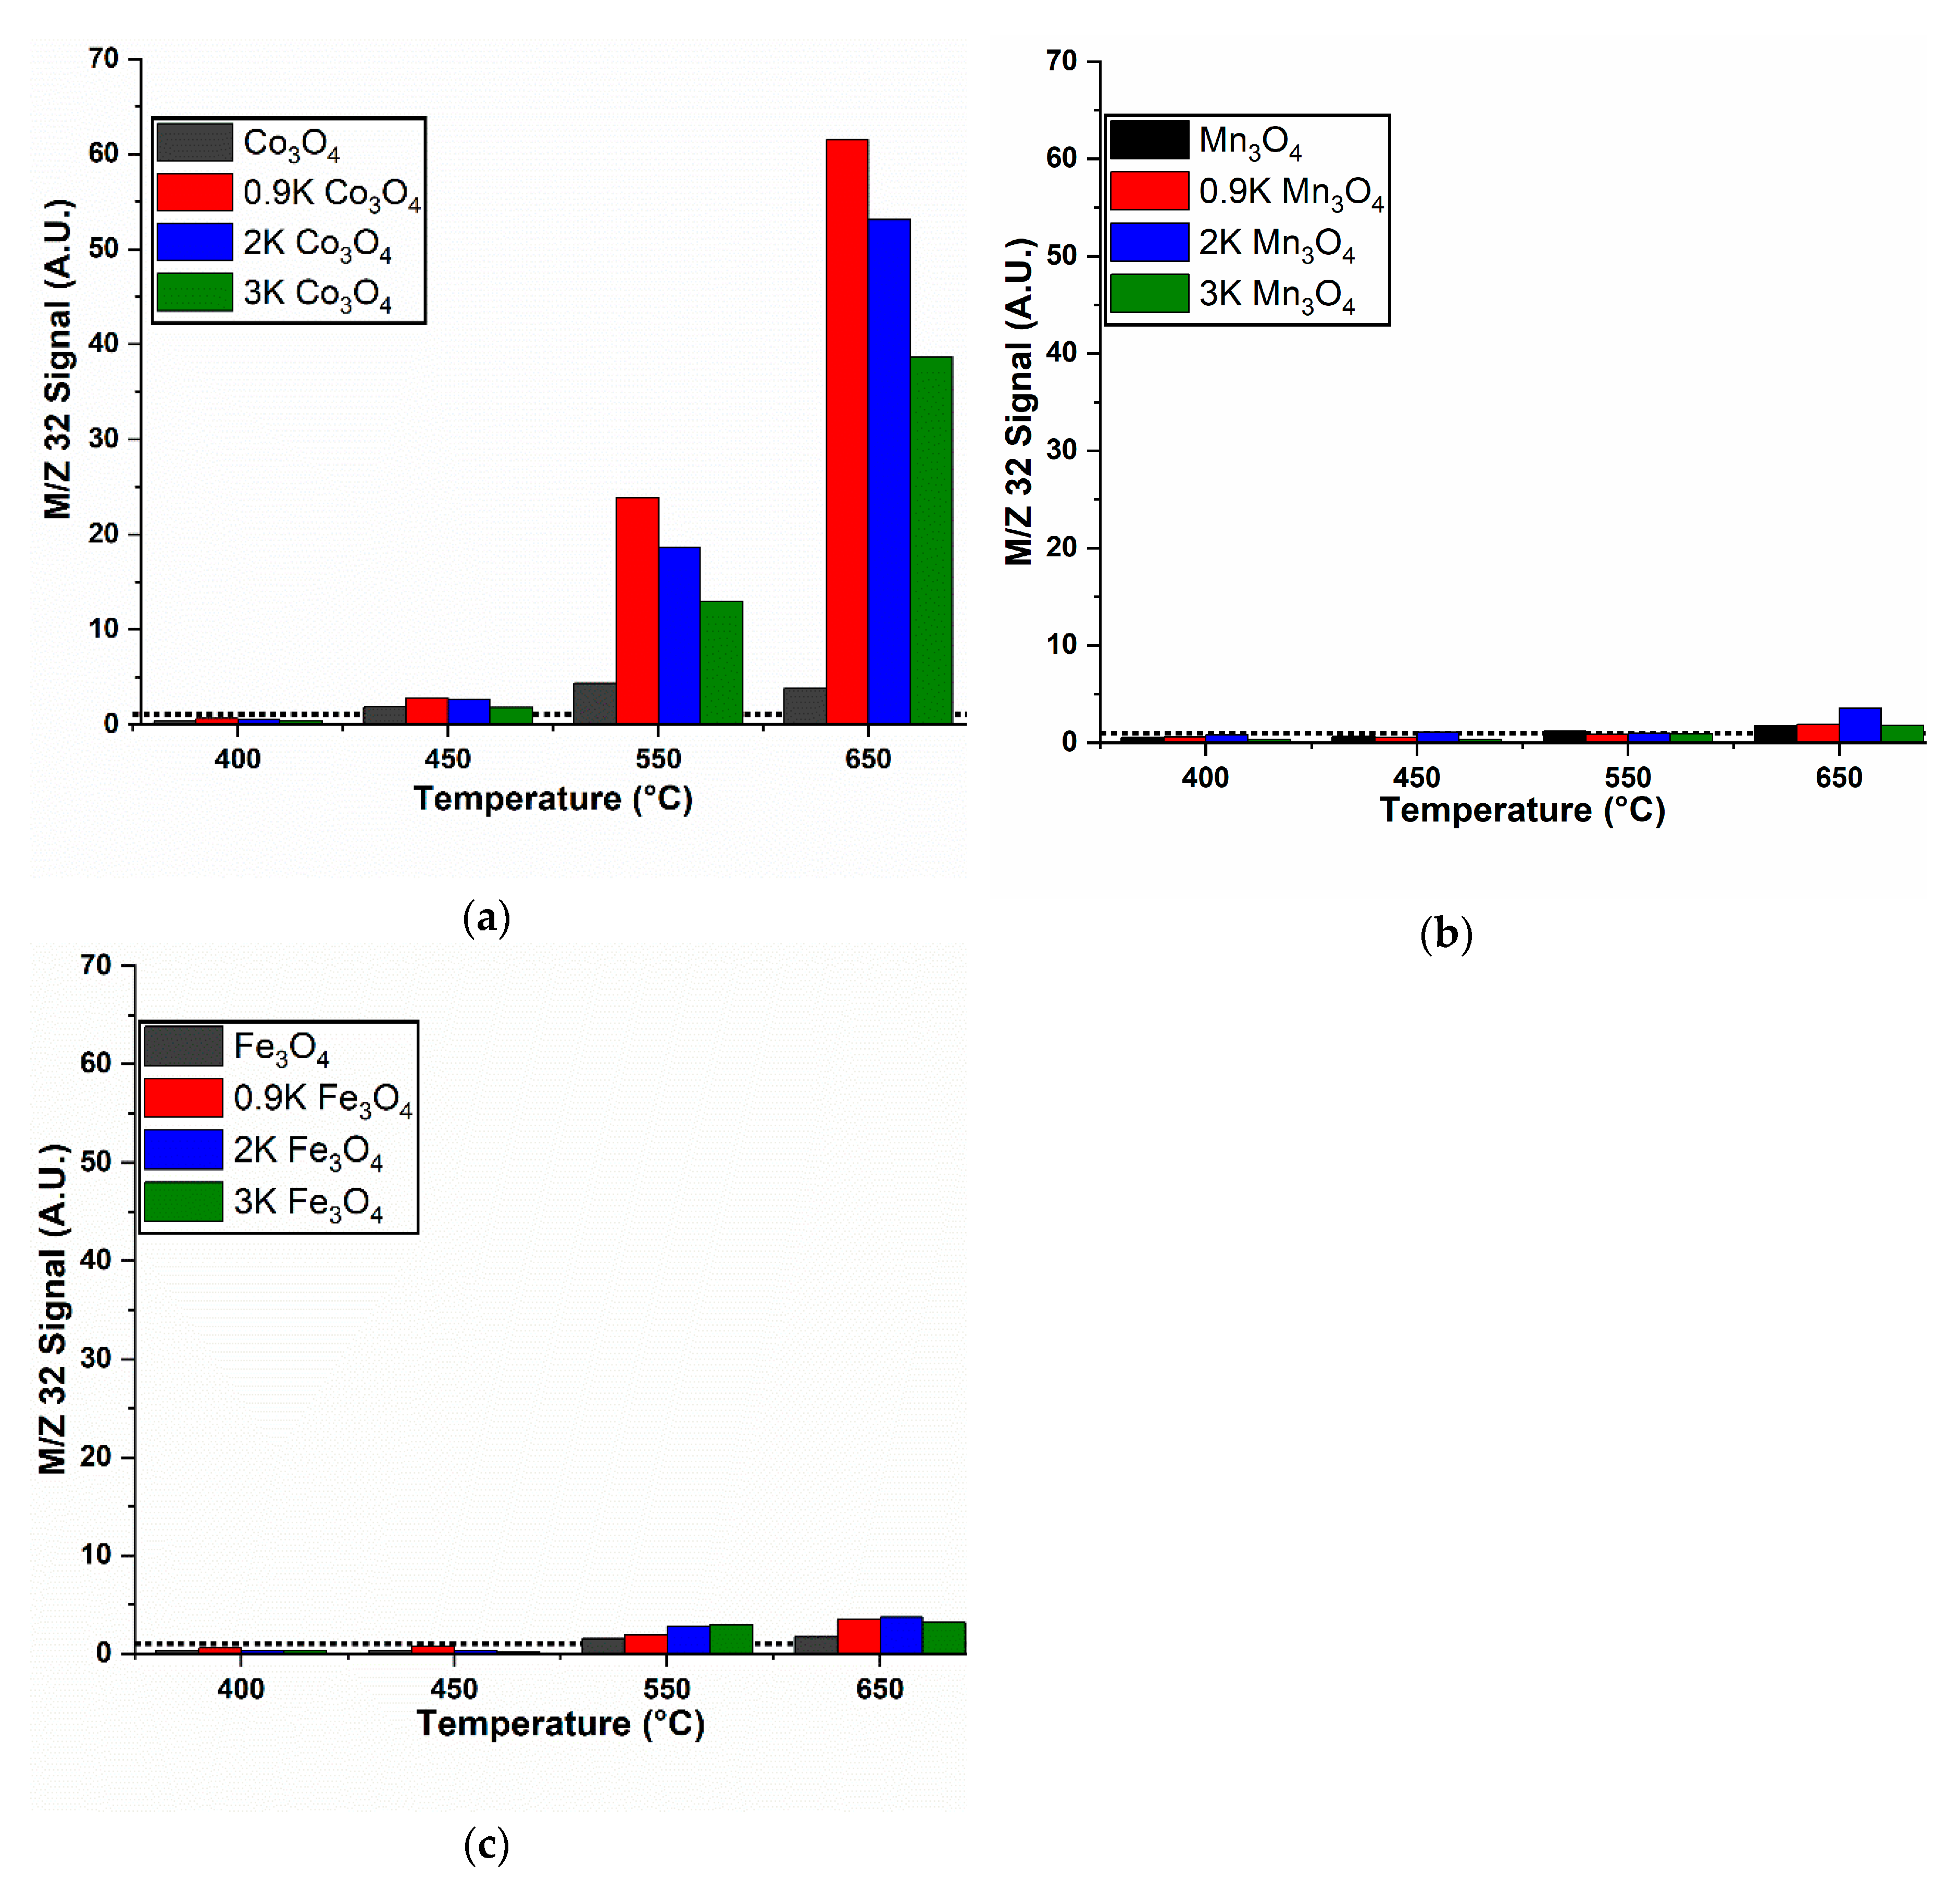
To address potential differences in O2 release behavior in the presence of NO, the intensity of the O2 MS signal (m/z = 32) relative to baseline was examined during NO decomposition under isothermal reactions conditions. These data are presented in Figure 5 with the data normalized to set the baseline intensity equal to unity for all catalyst materials. The baseline was determined by the m/z = 32 signal intensity during flow of the reactant gas mixture through the reactor bypass. Indeed, Figure 5 reveals that for Co3O4 and K Co3O4, O2 release during NO decomposition at isothermal conditions only initiates at higher temperatures compared to O2 release during O2-TPD. Thus, not surprisingly, O2 release is affected by the gas phase environment: at lower reaction temperature NO oxidation by surface oxygen is preferred leading to oxygen release as NO2 (see Tables S1 and S2), and at higher reaction temperature oxygen release as product O2 is preferred. Nonetheless, the increase in the relative intensity of the O2 signal is in good agreement with the trends in activity to N2 for the Co3O4 catalysts with varying K loading (Figure 2a), confirming these materials are active for direct NOx decomposition to N2 and O2.
For Mn3O4, the highest O2 release during NO decomposition is observed at 650 °C over the catalyst with 2 wt.% K at about four times the baseline concentration (Figure 5b). Once again, this is an indicator of NO decomposition catalysis and is in agreement with the activity data in the inset of Figure 2a, which indicated a low catalytic activity at 650 °C.
The promotion of O2 release by K is perhaps best illustrated over Fe3O4. Without K, O2 release is not observed in O2-TPD or during isothermal NO decomposition (Figure 5c). A possible explanation for the lack of O2 release can be found by examining the isothermal product formation over Fe3O4 as a function of time (Figure S1), which shows that the initial NO conversion and production of N2 are quite high, but decrease to nearly zero with time on stream. The implication of this deactivation behavior is that Fe3O4 is likely reacting with the oxygen from the NO reactant molecule in a non-reversible chemical process, similar to the published work on NiCr2O4 [17]. For K Fe3O4, the isothermal NO decomposition results show some O2 production by 650 °C, with the relative intensity of the MS signal increasing up to ~four times the baseline. In this case, it can be confirmed NO decomposition was able to proceed as a result of the K addition, preventing the chemical reaction that deactivated the unpromoted Fe3O4.
In summary, K does indeed promote O2 release, and more importantly, is able to do so in the presence of an oxidizing reactant molecule (NO). The effect of K on the O2 release was perhaps most significant for Fe3O4, which showed no appreciable oxygen release without K, even during O2-TPD. It was observed, however, that only the K Co3O4 catalysts released oxygen in significant measurable quantities in both the O2-TPD (Figure 4) and under reaction conditions in the presence of NO (Figure 5), suggesting additional factor(s) contribute to the inability of K-promoted Mn3O4 and Fe3O4 to release substantial amounts of product O2. Therefore, it is necessary to determine how K affects the structure of the individual spinel catalysts to determine possible changes to stability that might impact O2 release, and ultimately activity.

2.4. Catalyst Structure before and after Reaction—Influence of K Loading

2.4.1. X-ray Diffraction

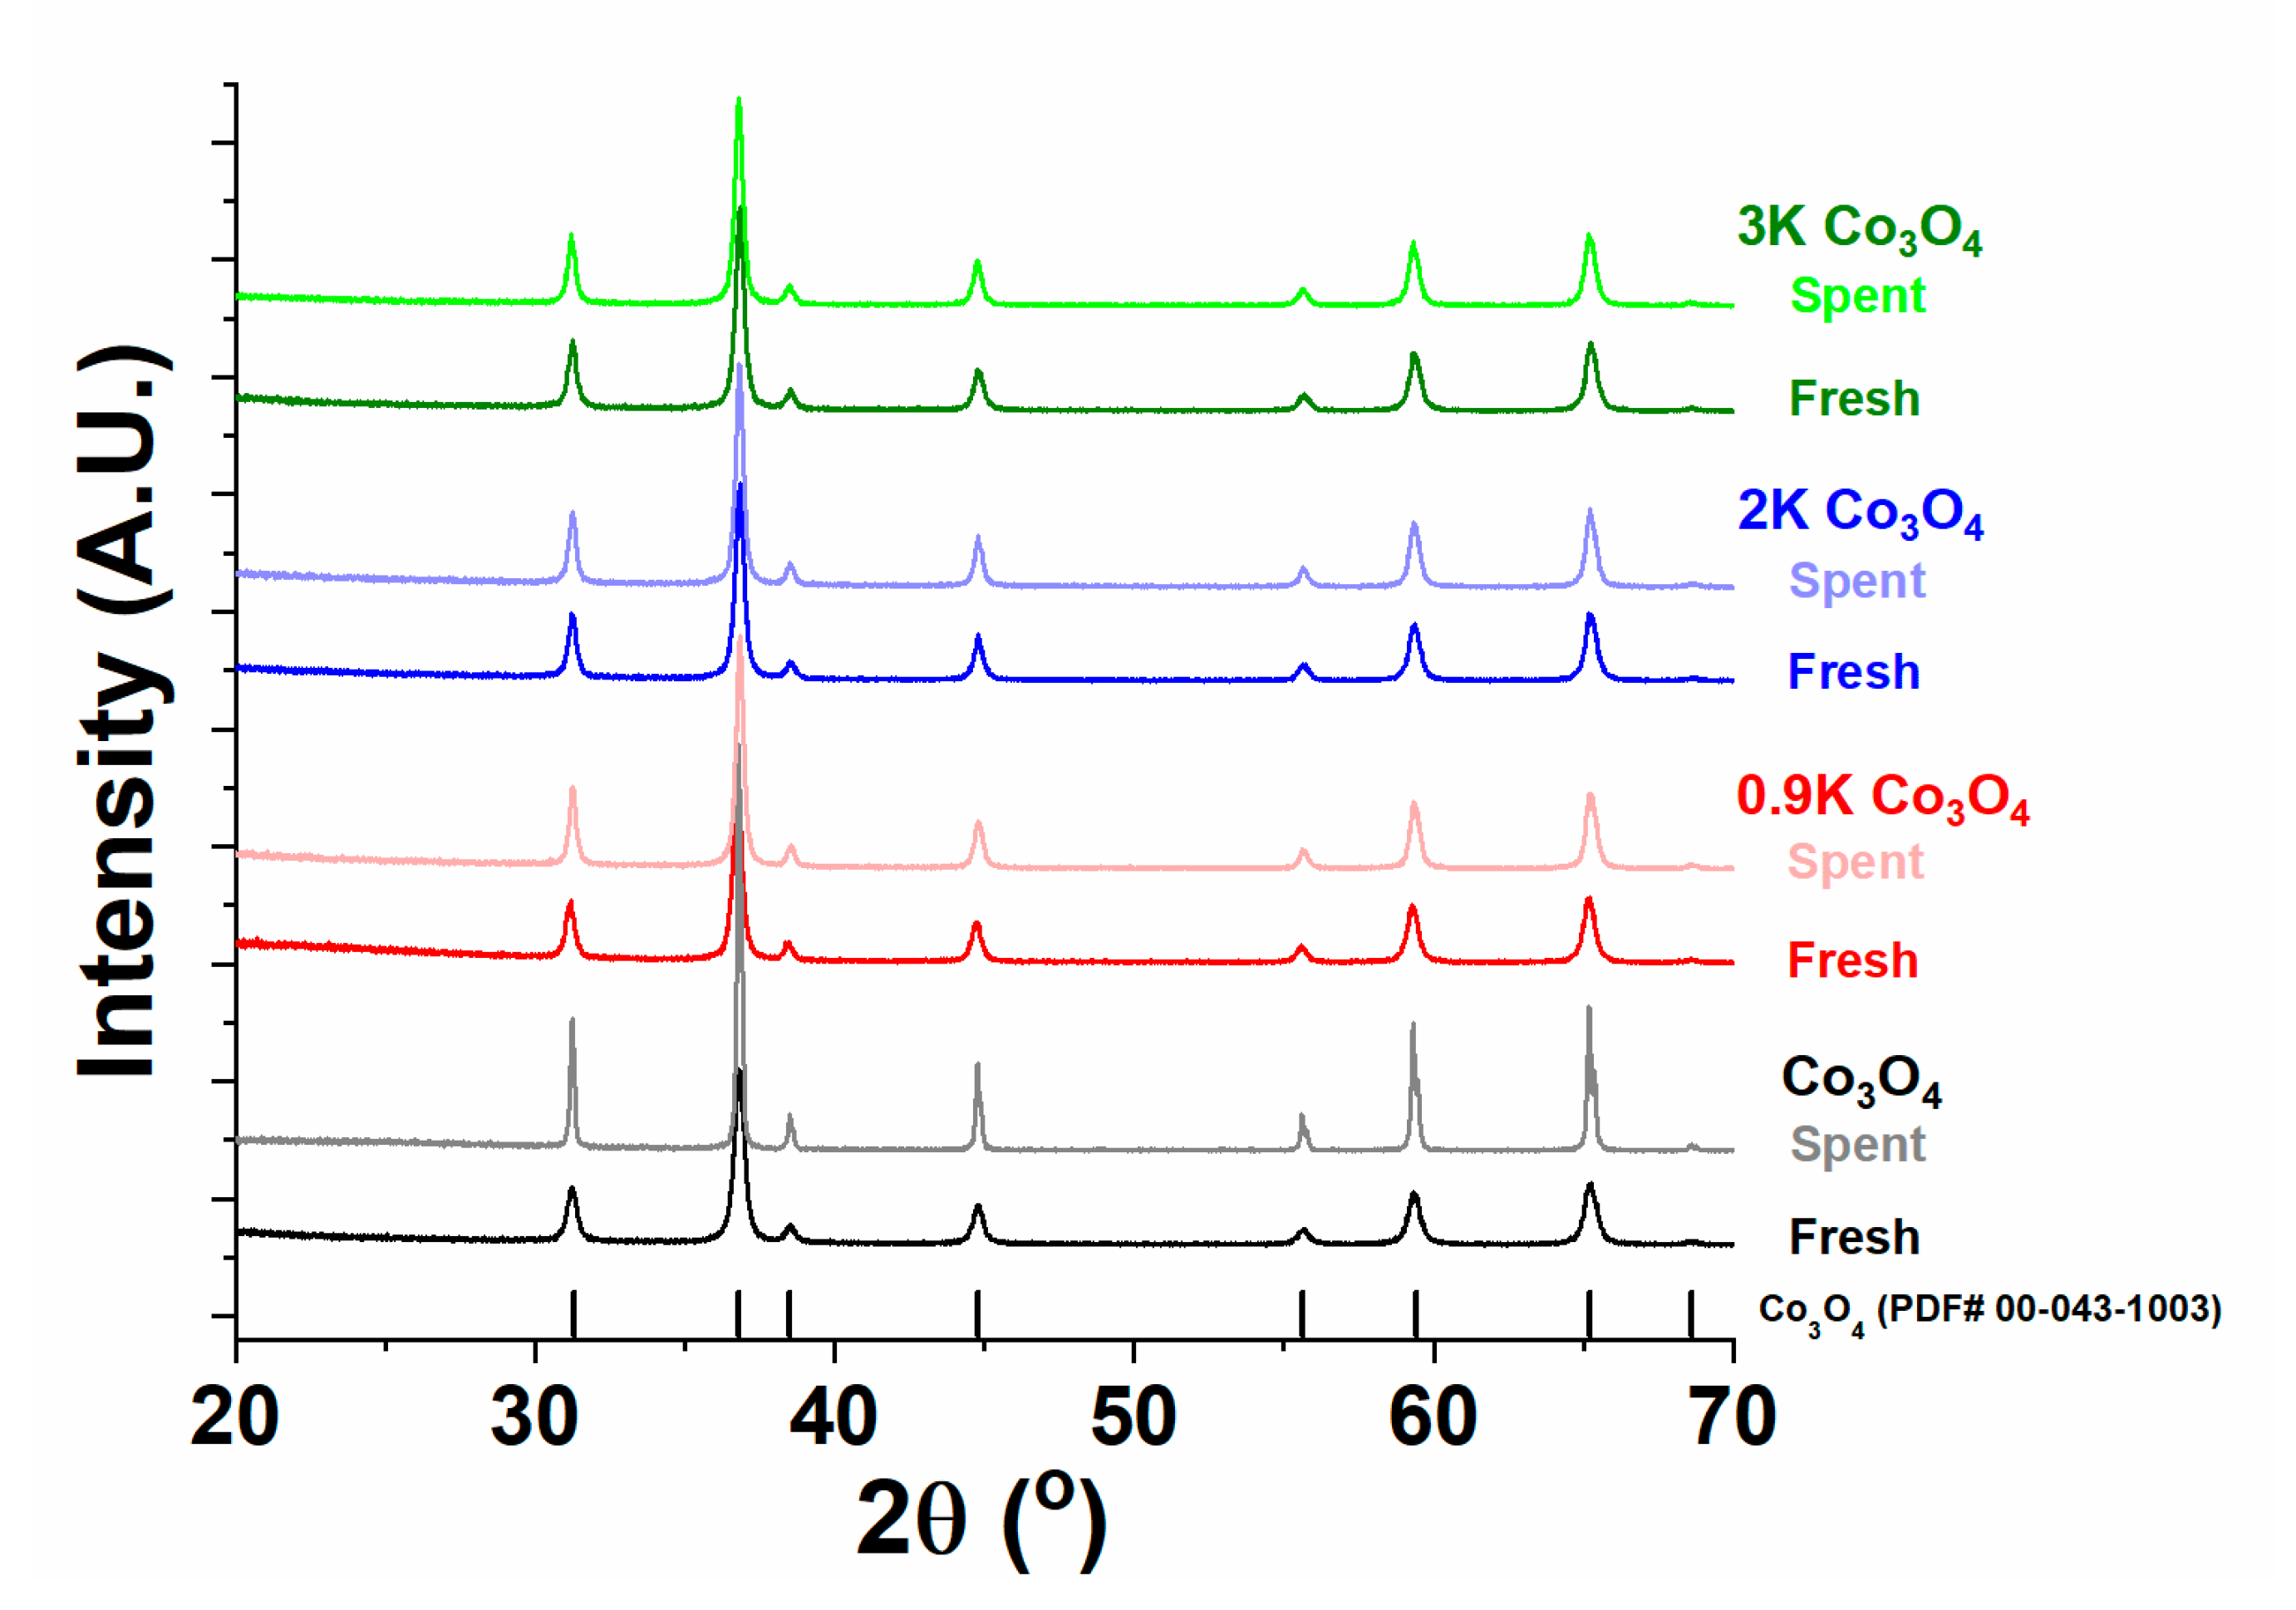
The X-ray powder diffraction (XRD) patterns of the fresh and spent Co3O4 catalysts with varying K loadings presented in Figure 6 were collected to determine if structural changes occur as a result of K addition and/or during exposure to NO decomposition reaction conditions. For all loadings of K (0–3 wt.% K) on Co3O4, the reflections are indexed to the spinel Co3O4 (PDF# 00-043-1003). There are no detectable reflections for K2O or potassium–cobalt mixed oxide species. Furthermore, no discernable phase change was observed after NO decomposition reaction. The observation that the Co3O4 phase is unaffected by K addition or reaction is consistent with the sustained activity and O2 release characteristics observed during NO decomposition (see Figure 5), which would not be the case if additional stable oxide phases were formed. It is observed, however, that in the absence of K (0 wt.% K), the Co3O4 crystallite size as determined by the Scherrer equation (Co3O4 (103), shape factor = 0.89) dramatically increased from ~21 to 65 nm (Table S6). Thus, it is concluded K stabilizes the Co3O4 crystallite size at high temperature, since the crystallite size of samples with 0.9K, 2K, or 3K did not exceed ~31 nm after reaction (see Table S6).
The XRD patterns of the Mn3O4 catalysts with varying K loadings contain both Mn3O4 (PDF# 01-070-9110) and bixbyite Mn2O3 (PDF# 01-071-0636) reflections in all fresh samples (Figure 7), but the primary phase for all samples is Mn3O4. Unlike Co3O4, a monotonic increase in the Mn3O4 crystallite size is observed with increasing K loading (Table S6). After the reaction, the primary Mn3O4 and trace Mn2O3 remain unchanged, but an additional phase is also present (indicated by asterisks in Figure 7). The additional phase is first observed in the spent 0.9K Mn3O4 and the peaks intensify in the spent 2K and 3K Mn3O4. The reflections are likely due to the formation of a potassium–manganese mixed oxide. Based on previous literature reports of similar oxides, these peaks are tentatively indexed to cryptomelane KMn8O16 (PDF# 00-044-1386). Typically, pure-phase cryptomelane is synthesized at elevated pressures via hydrothermal methods, however, its formation has also been observed over CoAlMn-based oxides co-precipitated by KOH [25,30]. Cryptomelane also has tendency to oxidize to bixbyite above 600 °C in air, but this has not been observed under the current reaction conditions (~1% NO/He) as the XRD patterns of the spent K-containing samples displayed no notable increase in relative intensity of bixbyite reflections. Therefore, it appears Mn3O4 by itself is largely inert in NO gas, however the addition of K leads to a reaction between K and Mn3O4, forming potassium–manganese mixed oxides after exposure to the elevated temperatures of the reaction.
Figure 8 contains the XRD patterns of fresh and spent Fe3O4 catalysts with various K loadings. The fresh samples were primarily indexed to magnetite Fe3O4 (PDF# 04-015-3101). With respect to K loading, no change in crystallite size from Scherrer analysis was observed in the fresh or spent (see Table S6). However, K addition to Fe3O4 leads to the presence of additional phases in both fresh and spent samples. An additional XRD reflection is observed in the spent 0.9K Fe3O4, and at higher K loadings this peak intensifies and is accompanied by an additional peak in both fresh and spent samples (see asterisks in Figure 8). Similar to Mn3O4, the additional reflections in the K-containing Fe3O4 catalysts suggest the presence of a potassium–iron mixed oxide, which is tentatively indexed to K2Fe22O34 (PDF# 00-031-1034). But while Mn3O4 did not undergo phase changes after reaction, significant phase changes were observed for Fe3O4, which were dependent on the K loading. In the absence of K, Fe3O4 was completely converted to α-Fe2O3 (PDF# 01-073-3825). With the addition of 0.9 wt.% K, the formation of α-Fe2O3 is mitigated, and 2 and 3 wt.% K appear to prevent the formation of detectable amounts of α-Fe2O3 in the XRD pattern of the spent samples. Instead, K addition leads to the formation of γ-Fe2O3 (PDF# 00-025-1402). Although an impurity phase, γ-Fe2O3 has a similar crystal structure to the spinel and is known to reversibly cycle between γ-Fe2O3, Fe3O4, and Fe1-xO more readily than α-Fe2O3 [31]. However, the major phase by XRD remains that of Fe3O4 spinel. A more facile redox capability indicates greater propensity to release oxygen, and subsequently perform sustained cycles of catalytic NO decomposition, as observed at 650 °C in the γ-Fe2O3 containing K Fe3O4 samples (see Figure 2c). Therefore, XRD indicates both positive negative aspects of the K addition to Fe3O4, i.e., the suppression of a phase transition to inactive α-Fe2O3 and the formation of inactive potassium–iron mixed oxides, respectively.

2.4.2. Raman Spectroscopy

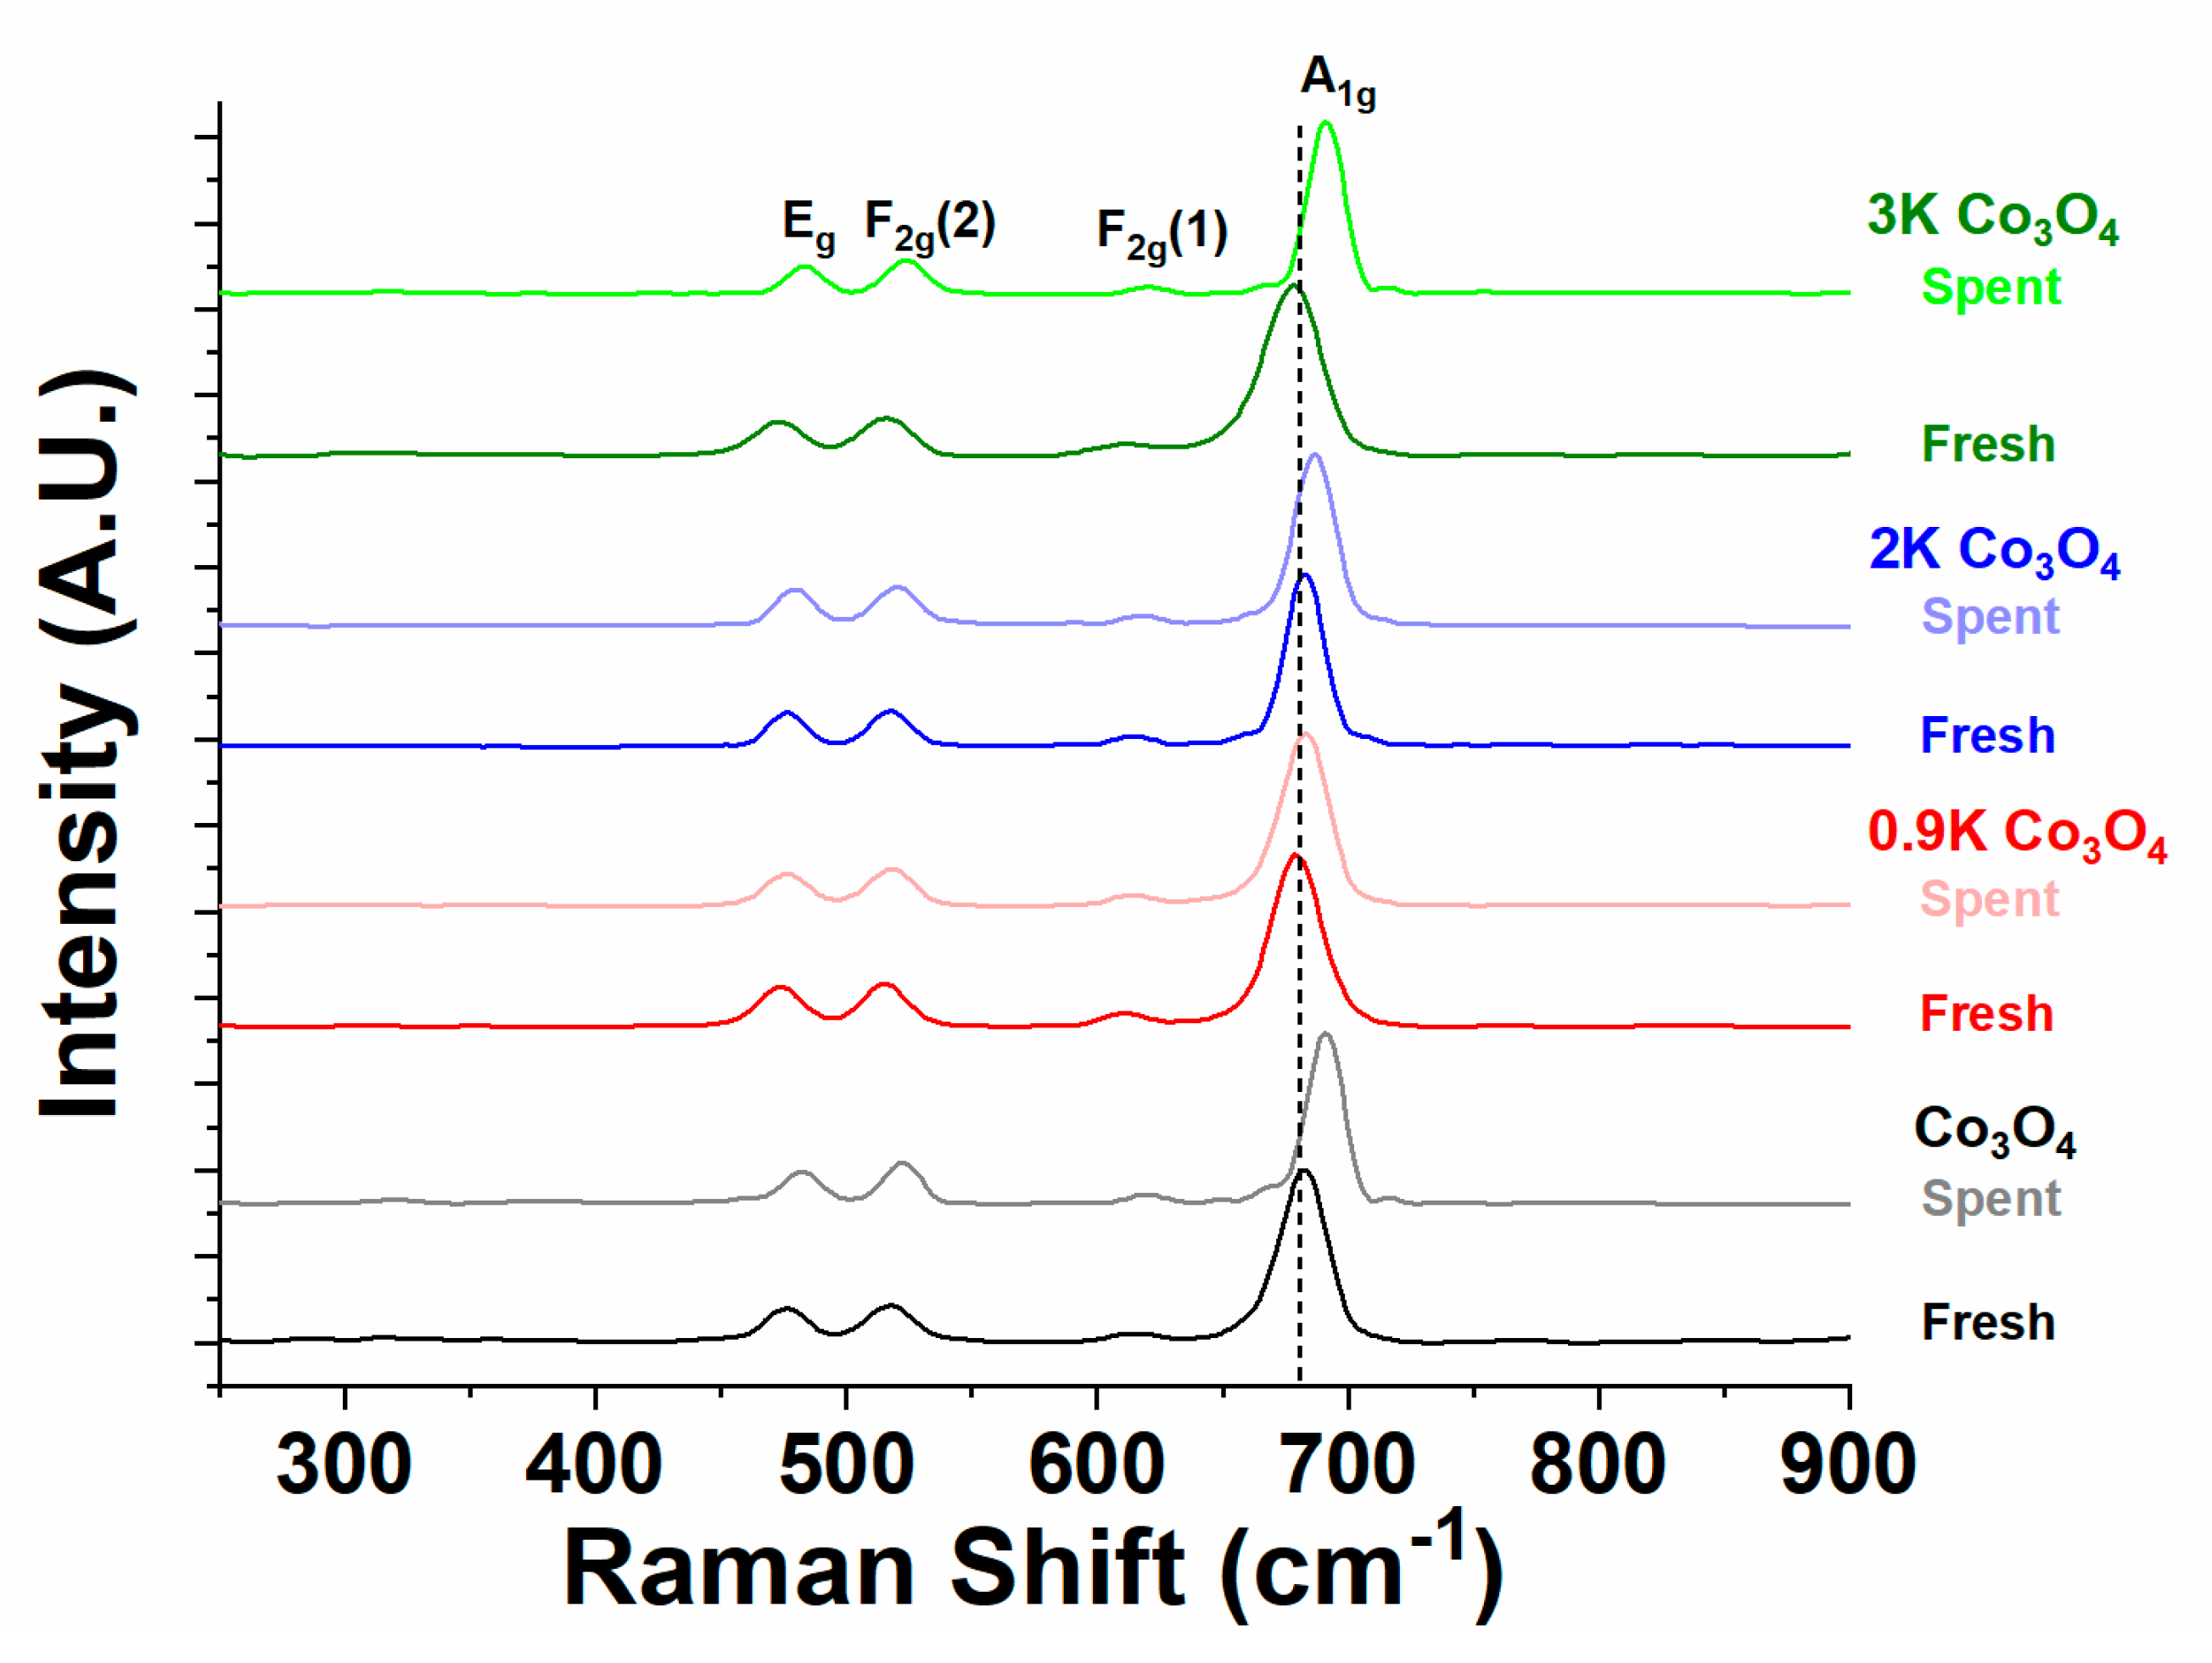
Raman spectroscopy was employed over the fresh and spent catalysts as an additional probe to examine any changes in local M–O bonding, and to corroborate phase assignments made via XRD. For Co3O4 based materials, as expected from the XRD pattern and good O2 release characteristics during the reaction, there are no discernable M–O bonding environments detected in the Raman spectra other than those of Co3O4 (Figure 9). The bands from low to high wavenumbers are 476, 518, 615, and 682 cm−1 labeled as the Eg, F2g(2), F2g(1), and A1g modes, respectively, and all agree with those reported in the literature [32]. The spent Co3O4 catalyst without K displays a shift of ~16 cm−1 to greater wavenumber at the A1g mode (Figure 9). This shift is postulated to be the result of the increase in particle size after the reaction (see Table S6) [33]. For 0.9 and 2K Co3O4, there is very little difference in the A1g mode position. The A1g mode of the 3K Co3O4 sample shifted is at a slightly lower wavenumber (678 cm−1) and the peak shape is visibly broader. It is possible the increase in K at the Co3O4 grain boundaries manifested as this red shift and peak broadening of the A1g mode due to a greater population of unsaturated bonds, which has been similarly attributed with the addition of spectator nickel ions to Co3O4 [34]. This shift is not sustained, however, as after reaction the A1g mode of 3K Co3O4 shifts to 692 cm−1 (similar to spent Co3O4), and the peak shape returns to a width similar to the other K Co3O4 samples. Therefore, it follows that there are fewer unsaturated bonds on 3K Co3O4 after the reaction. Additionally, among the spent samples, the position of the A1g mode shifts from low to high as 0.9K Co3O4 < 2K Co3O4 < 3K Co3O4. A decrease in the Raman shift of the A1g position may suggest a greater population of unsaturated bonds of CoO6 octahedra as a result of the K presence, establishing an explanation for the relative trend in NO decomposition activity of the Co3O4 series.
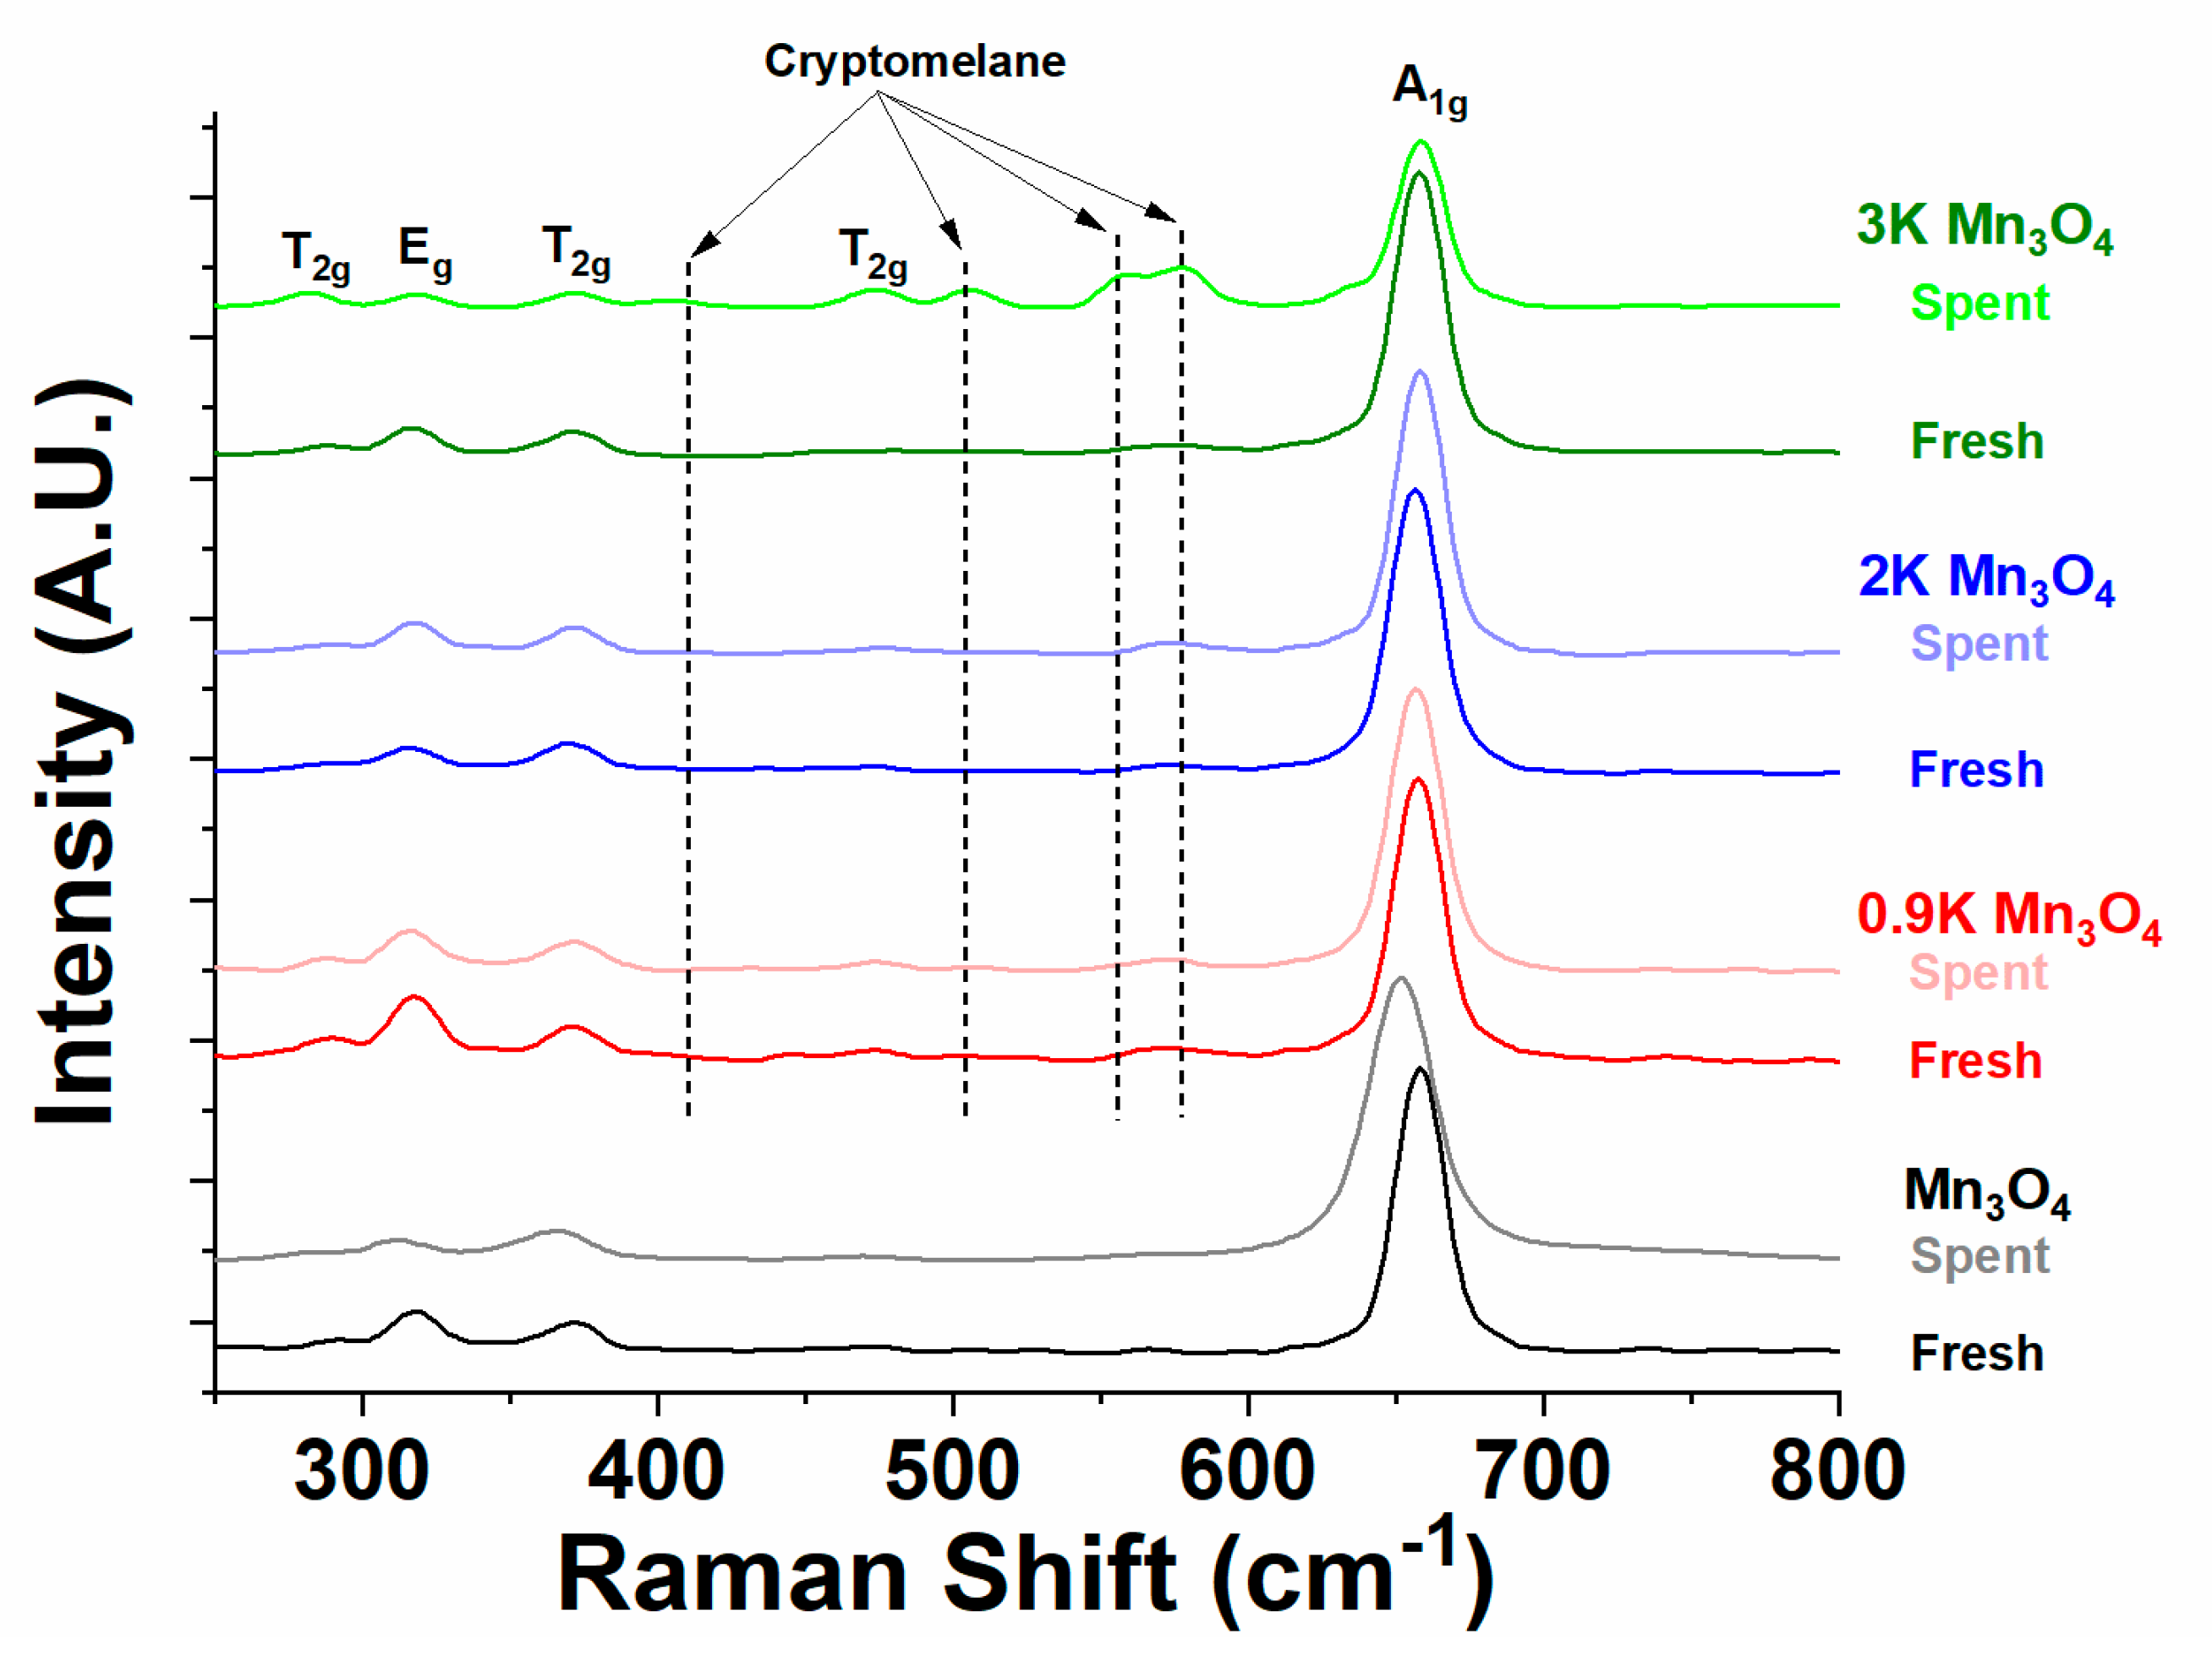
Major changes to the A1g mode (658 cm−1) position were not observed in Mn3O4 based samples with respect to K loading, nor the T2g (285, 372, 474 cm−1) and Eg (318 cm−1) modes (Figure 10), and all positions are similar to those previously reports for Mn3O4 [34]. However, the Raman spectra of the K-containing Mn3O4 catalysts (both fresh and spent) display several new Raman modes. The positions of these modes are most easily identified in the Raman spectrum of the spent 3K Mn3O4 at approximately 398, 500, 551, and 576 cm−1 (Figure 10), and are assigned to cryptomelane [35,36,37]. While some peaks, such as the peak at 551 cm−1, might be ascribed as hollandite MnO2 instead of cryptomelane, hollandite MnO2 presence is unlikely because it also has an intense Raman mode at ~700 cm−1 which is not observed in any of the sample sets [38]. Birnessite MnO2 presence is also not observed by Raman, since Birnessite has a sharp peak at ~740 cm−1 [39]. Thus, the Raman spectroscopy not only corroborates the XRD result that K addition to Mn3O4 facilitates the formation of cryptomelane, but is also more sensitive to smaller amounts of this impurity phase, identifying traces of cryptomelane even at 0.9 wt.% K and before reaction (fresh).
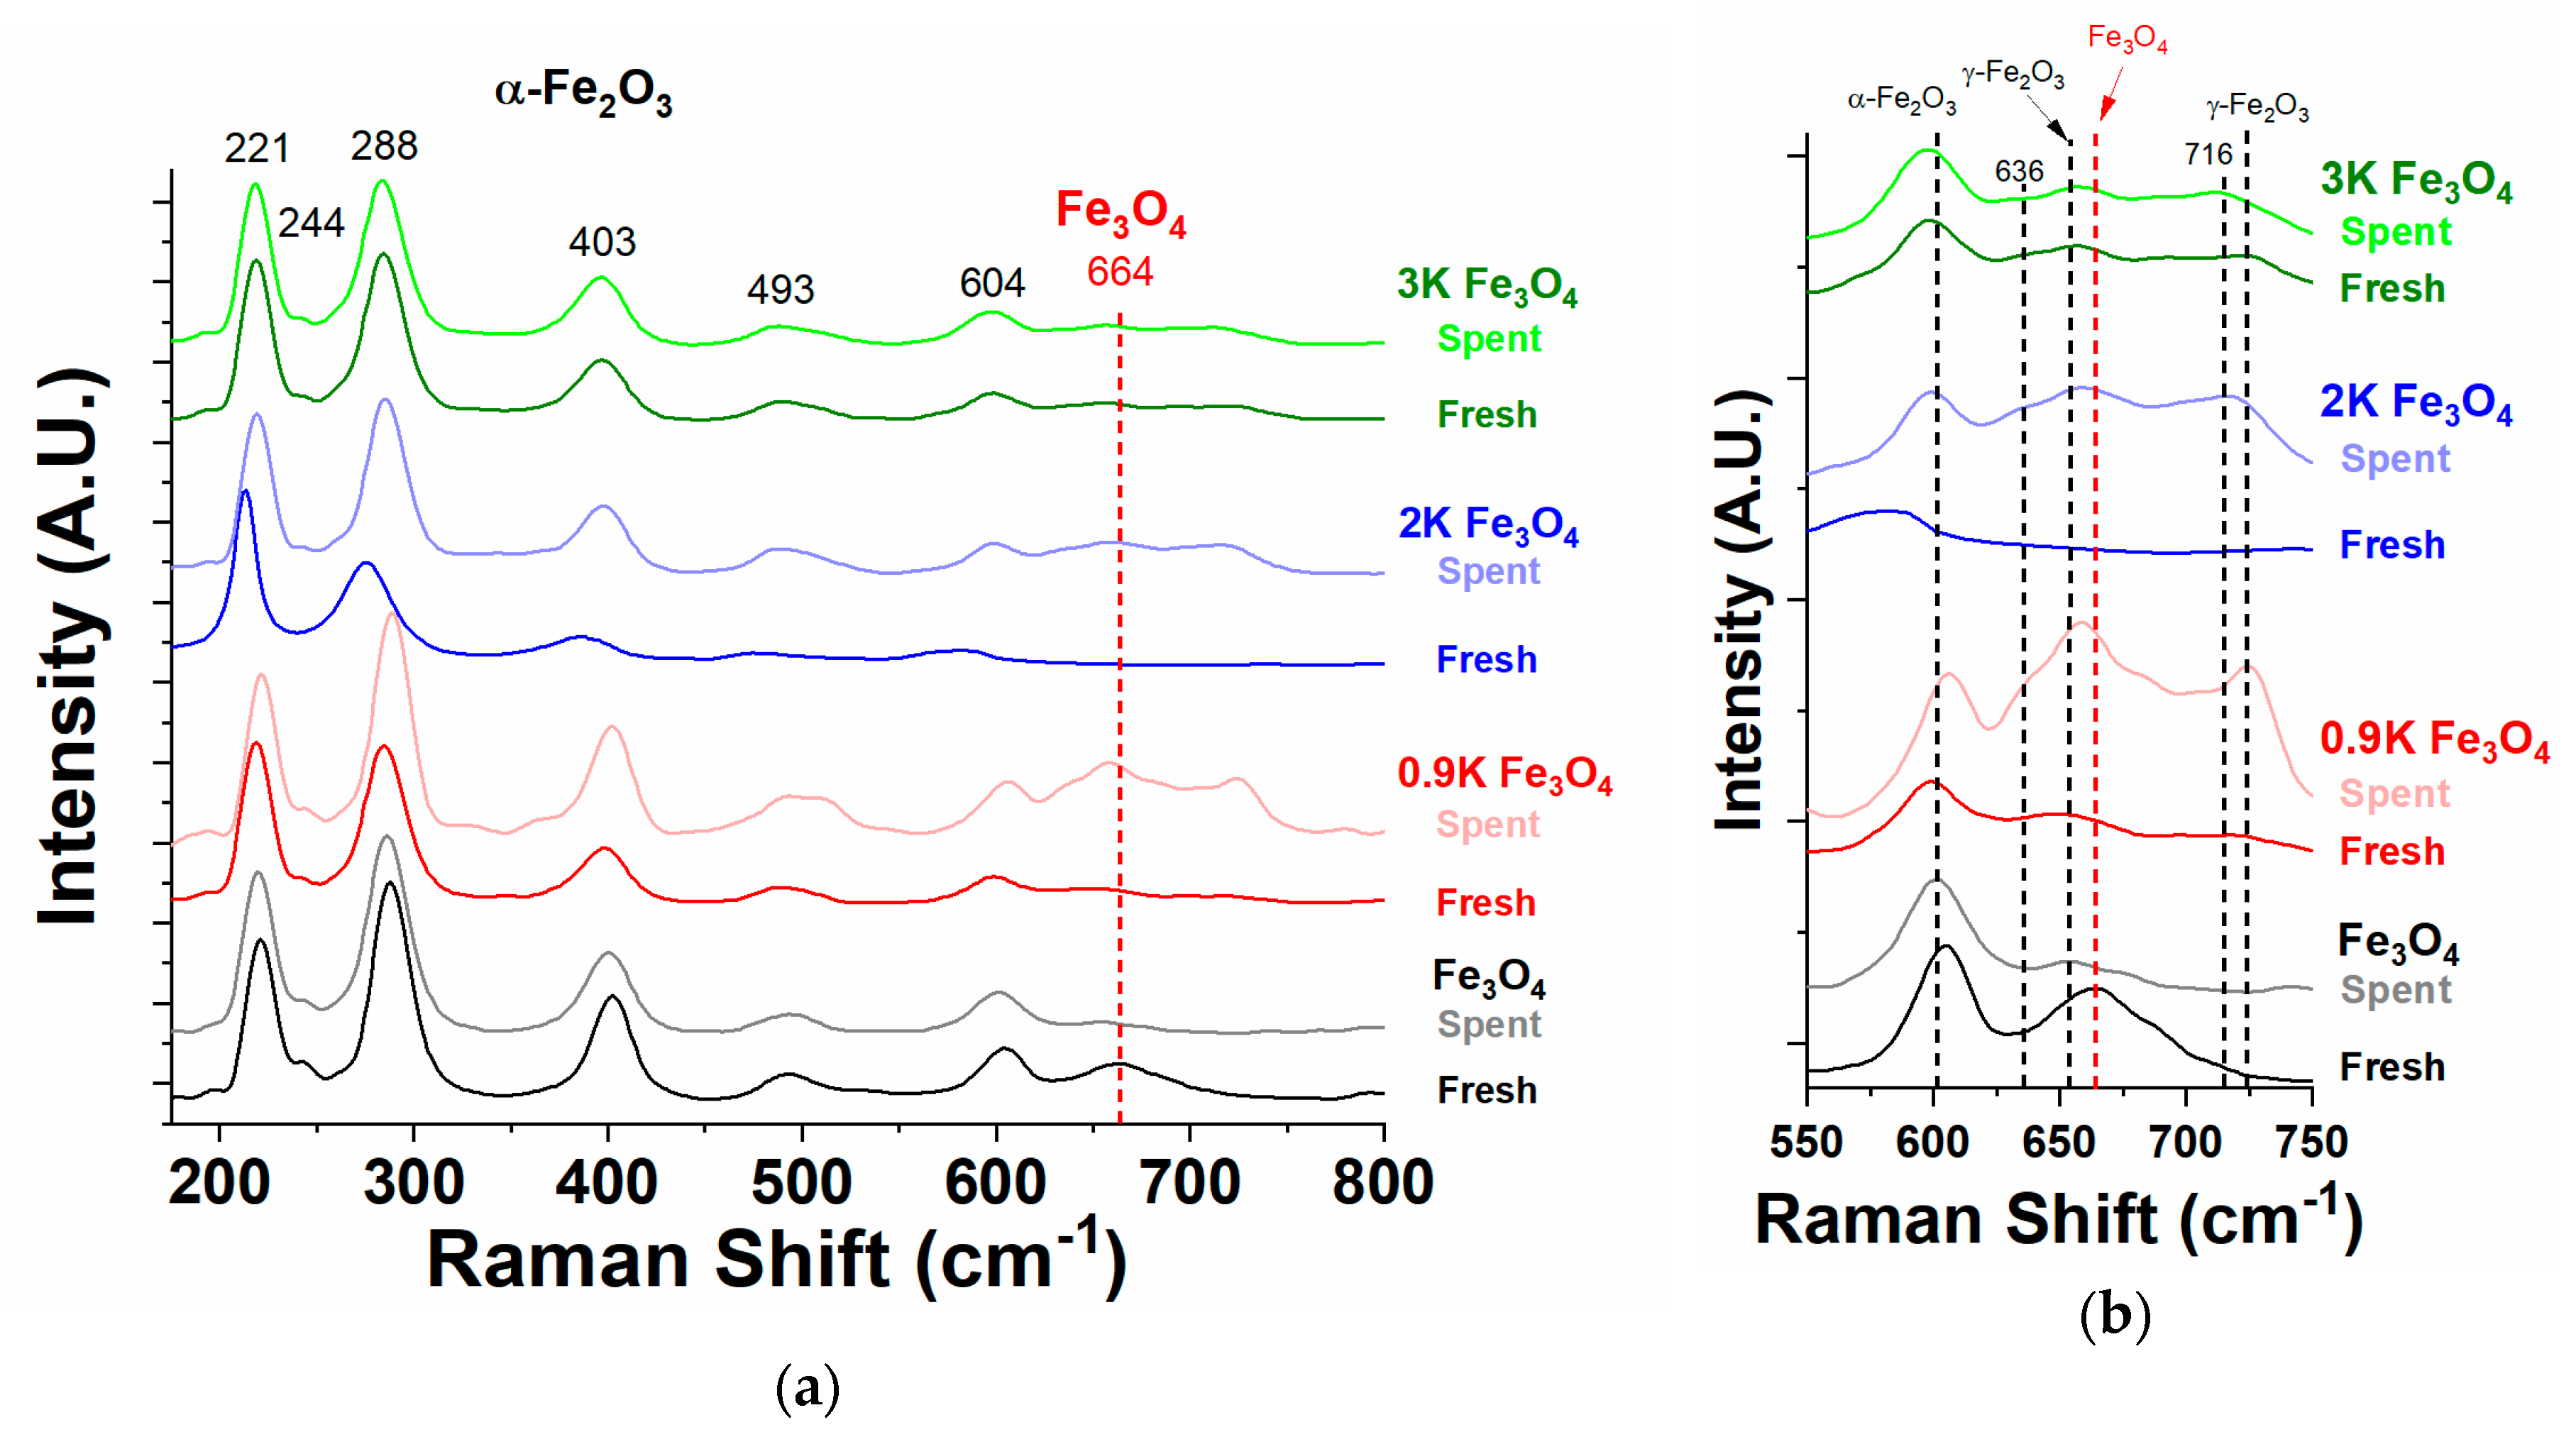
Oxides of iron can be difficult to distinguish via ambient Raman spectroscopy, especially Fe3O4 due to its inconsistent reporting of mode position throughout literature and due to the tendency of Fe3O4 and surface hydroxides of iron to oxidize to α-Fe2O3 via laser exposure [40]. Therefore, Raman spectroscopu is not expected to be useful in this study as a measurement of relative Fe3O4 and α-Fe2O3 content among the various fresh and spent Fe3O4-based samples. Indeed, Figure 11a shows the most intense features of the full Raman spectra of the Fe-based samples are attributed to α-Fe2O3, which was not observed in the XRD. A peak centered at 664 cm−1 is typically assigned to the Fe3O4 spinel, and the current results are in agreement as this feature is most pronounced in the fresh Fe3O4 sample without K. Rather than identify iron-oxide phase changes, the Raman spectrum in the range of 550 to 750 cm−1 (Figure 11b) was employed primarily to confirm the presence of potassium–iron mixed oxides observed in the XRD of fresh and spent Fe3O4 samples with K (Figure 11b). While it was difficult to discern additional Raman bands in the fresh samples, the spectra of the spent Fe3O4 catalysts with K exhibit several new features. First, the presence of γ-Fe2O3 in spent catalysts was confirmed by the features at ~655 and ~724 cm−1 [41]. The spent samples also exhibit features at 636 and 716 cm−1 that cannot be attributed to an iron oxide phase. These peaks are similar to those reported for the A1g modes of K2Fe22O34 and the presence of this phase is in agreement with the XRD [39].

2.4.3. X-ray Photoelectron Spectroscopy

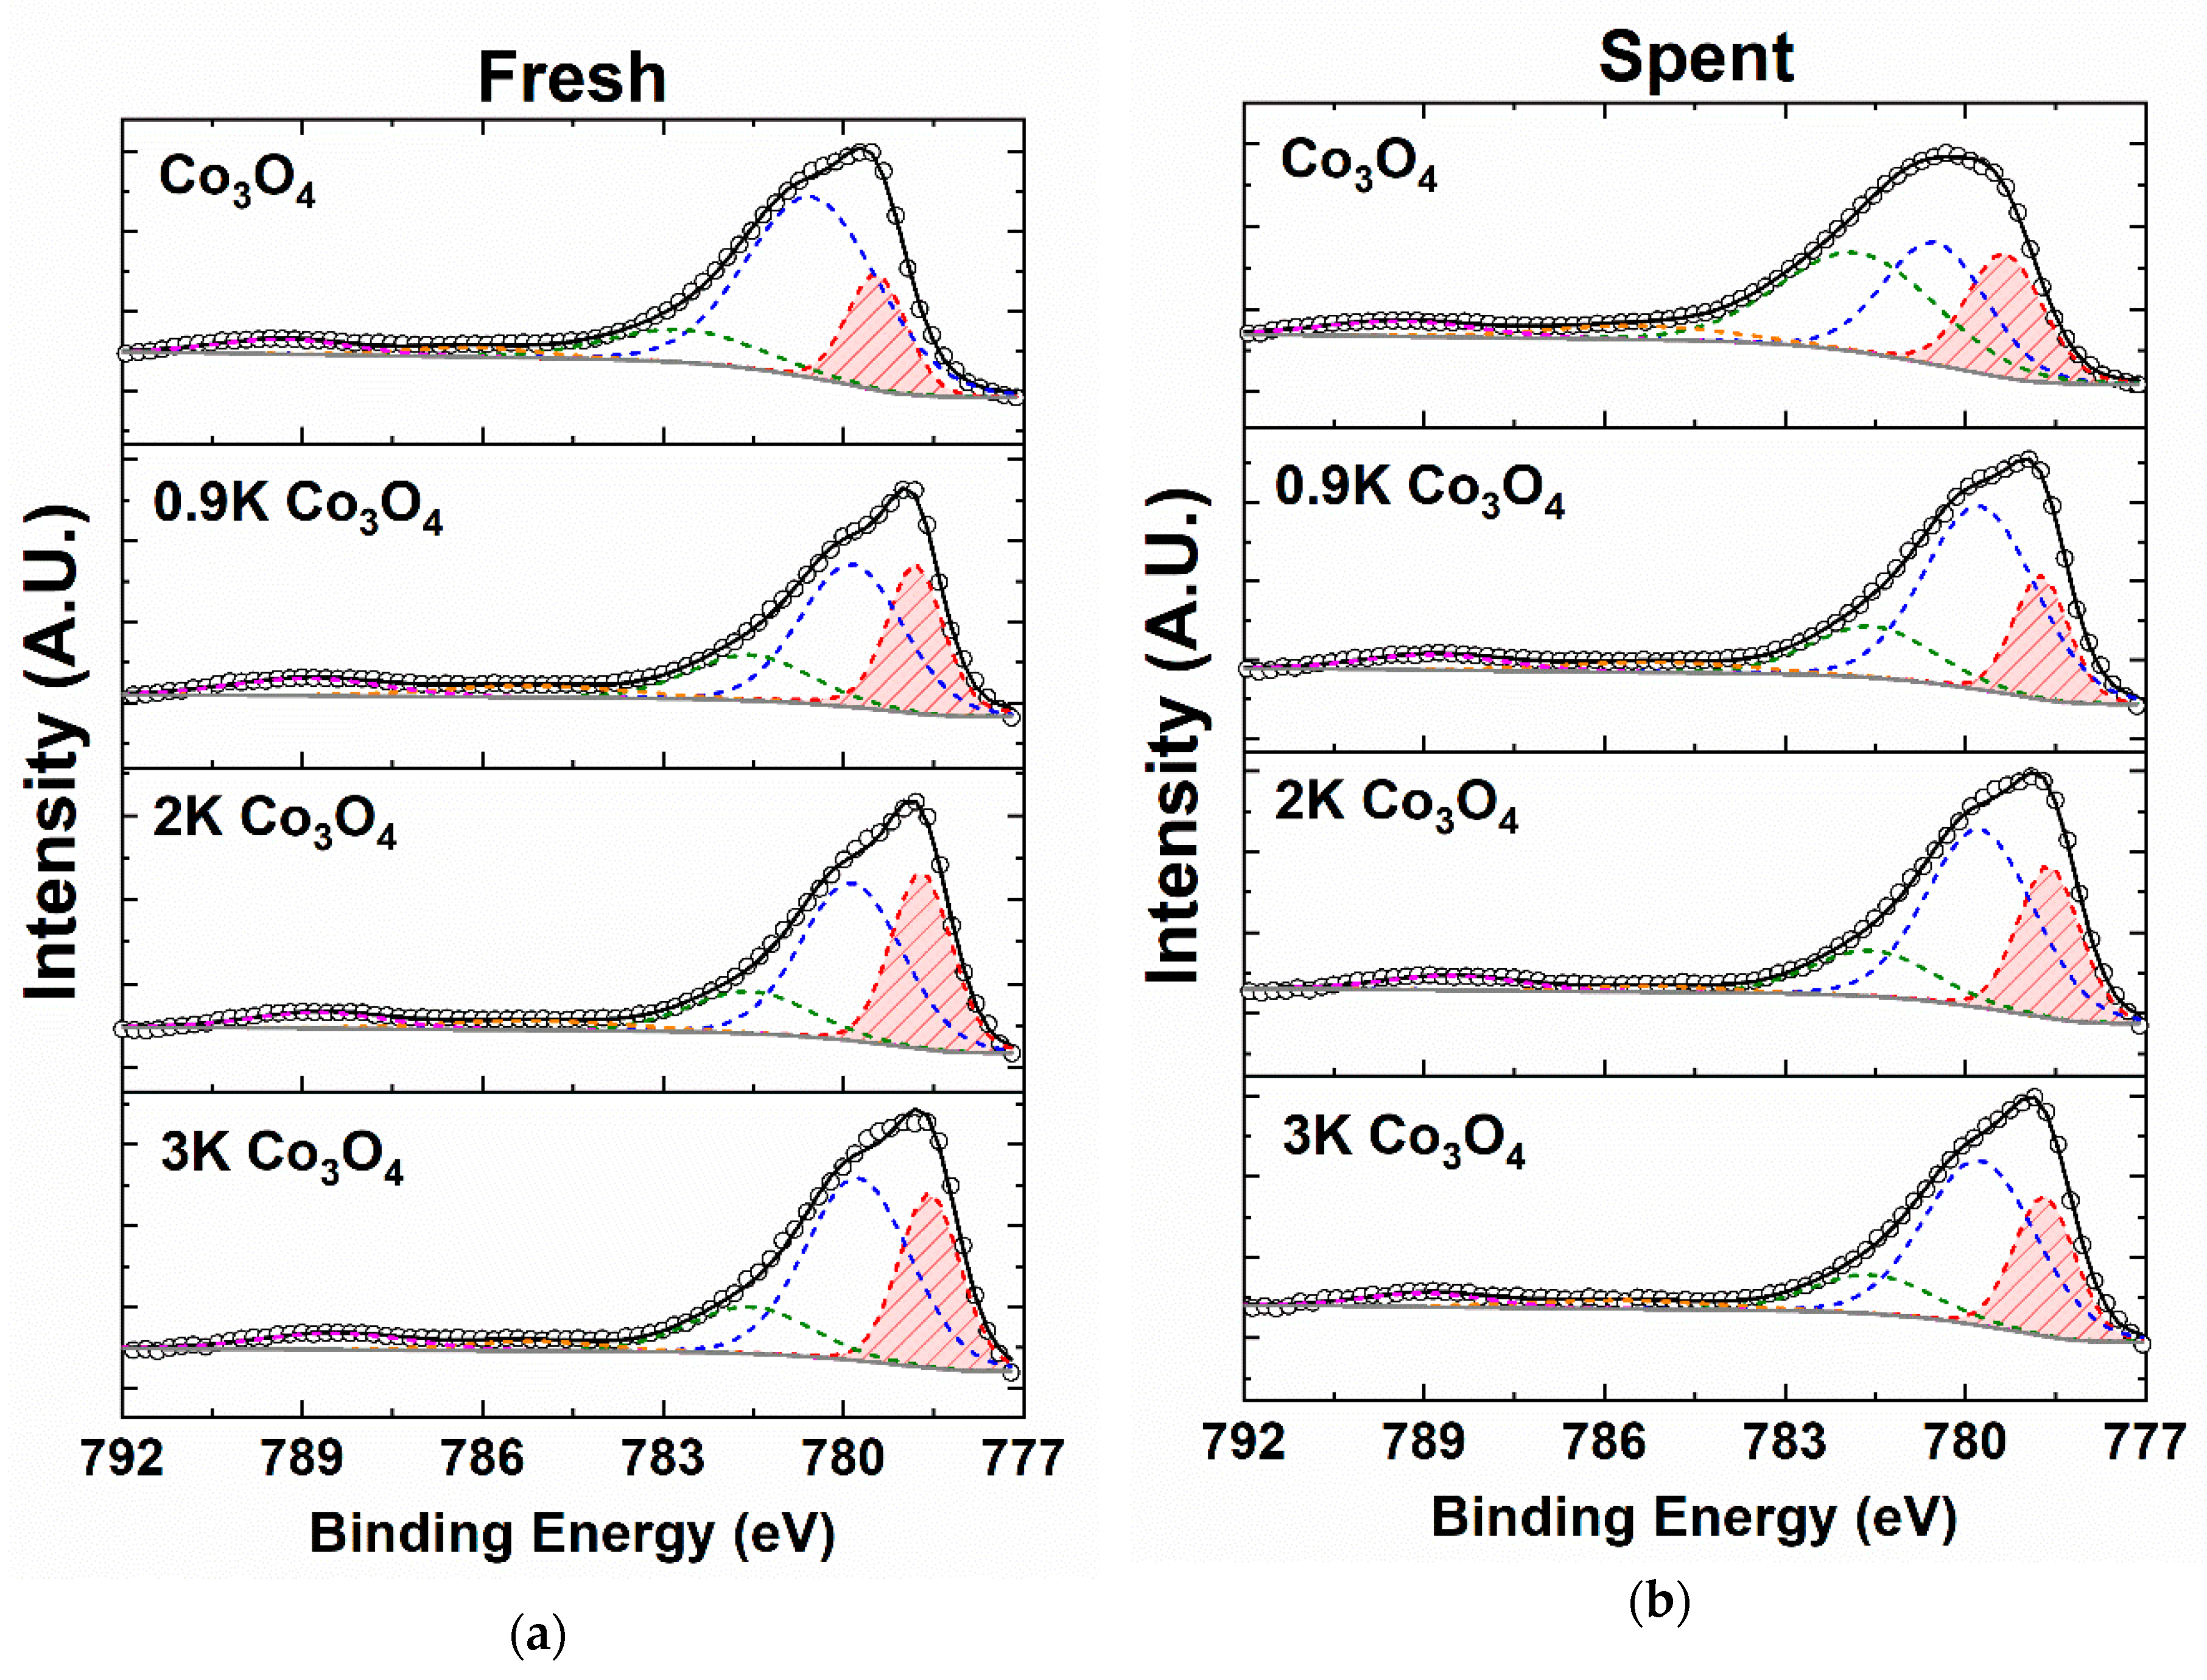
X-ray photoelectron spectroscopy (XPS) was employed to lend further support to the phase assignments made by XRD and Raman, and to aid interpretation of the O2-TPD and the O2 release profiles observed during NO decomposition. For Co3O4 without K addition, the peak at the lowest binding energy of the Co2p3/2 spectrum maintained a similar first peak position before and after the reaction (Figure 12, Table S7). Both values were within ±0.3 eV of previously reported position at 779.6 eV, with sufficient peak area indicating surface Co2+ remains before and after reaction (Table S8) [42]. With increasing alkali addition (Figure 12a), the peak at low binding energy shifts to even lower energies, obtaining a minimum of 778.6 eV at 3K Co3O4. With respect to spent K Co3O4 (Figure 12b), a similar decrease in energy of the low binding energy peak is observed with increasing K, but no systematic differences in the trends are observed when comparing the spent and fresh spectra, indicating little change in the surface chemical state of Co occurred during NO decomposition. This finding, in conjunction with the observation that O2 is detected in the product stream of the reaction at 650 °C (see Figure 5a), is a strong indicator of catalytic NO decomposition over Co3O4, i.e., no loss or change of the catalyst phase or surface structure. The slight decrease in binding energy resulting from K addition indicates a different electronic environment around Co than exists in Co3O4 without alkali and has been similarly interpreted in the literature [19]. Such a difference in electronic environment undoubtedly affects the ability to perform redox cycles between Co2+ and Co3+ during NO decomposition and is likely to play a critical role in the catalytic mechanism. Specifically, the release of product O2 necessary to close the catalytic cycle [21]. Thus, K addition is established as a promoter of the NO decomposition over Co3O4.
The position of the peak at the lowest binding energy of the fresh and spent Mn3O4 varies from 640.7 to 640.2 eV, however the relative area of this peak (shaded red in Figure 13) remains the same (see numerical data for peaks in Tables S9 and S10). These results show that Mn3O4 without K maintains a similar oxidation state through the evaluation of catalytic activity for NO decomposition, corroborating the XRD patterns and Raman spectra that also showed similar fresh and spent results for this catalyst. The addition of K to Mn3O4 did not produce any change in the position of the low binding peak regardless of K loading (640.4–640.6 eV), however, it should be noted that the relative area of this peak is decreased upon K addition while the area of the high binding energy peak of the Mn2p3/2 peak centered at ~643.2 eV (shaded green in Figure 13) is increased in both the fresh and spent samples (see numerical peak areas in Table S10). Based on peak positions and relative areas from previously reported XPS spectra for Mn3+ and Mn4+ containing materials [42], increases in the relative area of the higher binding energy peak is most likely an indication of increased contribution of Mn3+ and Mn4+. As suggested by the XRD and Raman spectroscopy, it is possible the potassium reacts with the Mn in the spinel and forms cryptomelane, which has both Mn3+ and Mn4+. This is particularly true of the spent 2K and 3K Mn3O4 samples, which show at least a ~19% higher contribution of the high binding energy peak; this is compared to only a 7% difference in relative area for the spent Mn3O4 without K (see Table S10). Thus, the XPS showing peaks related to Mn4+ [30,36,42] provides additional evidence of an impurity phase, likely cryptomelane as indicated in the XRD and Raman, that occurs as a result of oxidation of K and Mn and its formation is further accelerated in the NO decomposition reaction environment.
In the absence of K, the strongest contribution to the Fe2p3/2 XPS peak of the Fe3O4 catalyst is the lowest binding energy peak centered at 709.8 eV (shaded in red in Figure 12). After reaction, the dominate feature of the Fe2p3/2 peak shifts to 710.5 eV (shaded blue in Figure 12) in the spent Fe3O4 without K. This overall increase binding energy in consistent with transformation of Fe3O4 to α-Fe2O3 phase (Fe3+), which was also observed in the XRD patterns and Raman spectra of spent Fe3O4 catalysts (see Figure 8 and Figure 11). The presence α-Fe2O3 phase in the spent sample is also consistent with deactivation and inactivity of the same sample due to the inability to release oxygen (see Figure 4, Figure 5 and Figure S1). Upon addition of K, the position and contribution of the low binding energy peak shows some stabilization, especially for 0.9K and 2K Fe3O4 (Figure 14 and Tables S11 and S12). The high relative contribution of the lower binding energy feature to the Fe2p3/2 peak in the K-containing spent Fe3O4 catalysts is indicative of the continued presence of Fe2+ even after reaction [42], which was also observed in the XRD (see Figure 8). This implies K presence on Fe3O4 may have provided some means to promote O2 release by mitigating the oxidation to α-Fe2O3 (see Figure 5c inset and Figure 8). Nonetheless, there is a more significant contribution of the higher binding energy peak in the Fe2p3/2 peak for all K-containing samples, even prior to reaction, and the presence of this peak coincides with low activity and oxygen release relative to the higher values of K Co3O4. Thus, even though some stabilization of the spinel Fe3O4 is observed, the γ-Fe2O3 and the potassium–iron mixed oxide detected by XRD and Raman likely contribute to the presence of this XPS feature and are concluded to be responsible for inactivity of K Fe3O4 catalysts.
When considering the myriad of characterization techniques with respect to the catalytic activity, a self-consistent set of conclusions emerge. The success of K as a promoter of Co3O4 is related to three aspects: (1) improved potential for interaction with NO at the catalysts surface (FTIR), (2) consistent and stable release of product O2 from the catalysts surface (O2-TPD), and (3) resistance to structural or phase changes as a result of K addition and/or reaction environment (XRD, Raman spectroscopy, XPS). While K improved NO adsorption for Mn3O4, it failed as a promoter of NO decomposition because either NO oxidation to NO2 was dominant (lower temperature) or O2 release was poor (higher temperature). The poor release of O2 at high temperature could be linked to the formation of potassium–manganate mixed oxides both before (Raman spectroscopy) and after reaction (XRD, Raman spectroscopy, XPS). Addition of K to Fe3O4 improves the NO adsorption and O2 release, however the O2 release is at higher temperatures (≥550 °C for K Fe3O4 compared to ≥450 °C for K Co3O4) and is lower in relative magnitude than the K Co3O4 samples. At higher K loadings, some stabilization of the Fe3O4 spinel structure is observed preventing the formation of an excess of α-Fe2O3 (XRD and XPS), but potassium–iron oxide and γ-Fe2O3 impurities form as a result of the K addition (XRD and Raman spectroscopy), so ultimately the promoter effect of K for oxygen release was insufficient to overcome the deficiencies introduced by the impurity formation. Thus, maintaining a structure with labile redox pairs is essential for O2 release, and this function is critical to maintain catalytic turnovers of the NO decomposition mechanism.

3. Materials and Methods

3.1. Catalyst Synthesis

The K Co3O4, K Mn3O4, and K Fe3O4 samples were synthesized by wet impregnation. Approximately 2 g of Co3O4, Mn3O4, and Fe3O4 (99.5%, 97%, and 99.5%, respectively, Sigma-Aldrich, St. Louis, MO, USA) were, placed in 500 mL beakers. Next, approximately 200 mL of millipure deionized water (18.2 megaohm and 3 ppb total organic carbon) were added to the beakers along with magnetic stirrers. Next, potassium carbonate monohydrate (99%, Sigma Aldrich) was added to the samples to yield loadings of 0.9, 2, and 3 wt.% K. The materials were stirred on hot plates under mild heating (~70 °C) until the water was evaporated. A more thorough drying step was conducted at 120 °C in an oven, and subsequently the materials were ground fine with a mortar and pestle and calcined at 400 °C for 4 h, which is consistent with reported calcination procedures [25]. Scanning electron microscopy (SEM) and energy dispersive X-ray analysis (EDX) were collected utilizing a JEOL JSM 7800F (Peobody, MA, USA), and Aztec EDX Analyzer (Oxford Instruments, Concord, MA, USA), and confirmed the empirical K loading of the samples was within ±10% of the nominal K loading (Table S13). The EDX also provided a simple survey of the K distribution to confirm co-location with Co, Mn, or Fe (Figures S2–S4). Brunauer–Emmett–Teller (BET) surface area measurements were conducted utilizing a Micromeritics 3Flex instrument. Initially, 200 mg of each sample was degassed at 200 °C for 2 h, and then nitrogen physisorption was conducted at 76 K, calculating the BET utilizing 11 points between P/P0 = 0.05–0.3 (Table S14).

3.2. Catalytic Evaluation

Evaluation of NO decomposition catalytic rates was performed using a fixed bed reactor system, (PID/Particulate Systems Effi Microreactor, Norcross, GA, USA) equipped with a quartz tubular reactor with 1 cm diameter. The NO, N2O, and NO2 concentrations were monitored by an online Fourier transform infrared detector (CAI 600 SC FTIR California Analytical Instruments, Inc., Orange CA, USA), and O2 production (m/z = 32) was confirmed using an online Mass Spectrometer (MKS Instruments, Inc. Cirrus-2, Andover, MA, USA). The total flow rate was 27.8 mL/min of a reaction gas composed of approximately 9,700 ppm NO, 30–70 ppm NO2, and 12–25 ppm N2O in a ultra high purity (UHP) He balance. The catalyst mass was held constant at 500 mg of each sample, yielding a bed length of ~1 cm and a gas hourly space velocity (GHSV) of ∼2100 h−1. Additional measurements were performed for the K Co3O4 samples using significantly less sample mass (80 mg) with 420 mg of quartz sand diluent to maintain constant GHSV in order to obtain differential conversions over these catalyst materials. The catalysts were first pretreated in 10% O2/He for 60 min at 500 °C and cooled at 10 °C/min in He to the initial reaction temperature of 400 °C. The measurement at 400 °C was conducted for 6 h in an isothermal condition in order to obtain a near steady-state, and afterwards a 15 min He purge/ramp step to the next reaction temperature was performed. Additional reaction measurements were conducted at 450, 550, and 650 °C for two hours.
Steady-state NO conversion is taken as the average conversion over the final 5 min of time on stream. The NO conversions were determined by analyzing NO inlet feed concentration (bypass) and the NO outlet feed concentration after passing through the catalyst bed (reaction). The conversion was calculated using the following equation:
N O   C o n v e r s i o n   ( % ) = [ NO   bypass ] [ NO   reaction ] [ NO   bypass ] × 100 %
All numerical values of NO conversions are reported in Figure 1 (as well as Tables S3–S6) and all are below 25% in order to maintain differential conditions to calculate and report catalytic activity. The N2 (ppm) produced during the reaction was calculated by the mass balance of the total nitrogen species, and only N2 solely produced from NO decomposition, rather than decomposition of the trace N2O impurity in the feed, was considered in reporting N2 production as described from the following equation:
N 2   P r o d u c e d   ( p p m ) = [ N O   c o n v e r t e d ]     2 [ N 2 O   p r o d u c e d ] [ N O 2   p r o d u c e d ] 2 [ N 2 O   p p m   c o n v e r t e d ]
The selectivity to N2 is calculated as the percentage of NO converted to N2. Rates for NO decomposition are therefore calculated only from the NO converted to the desired N2 product using N2 selectivity and, thus are displayed in units of μmol of NO converted to N2 per second [(μmol NO to N2) s−1]. Specific activities [(μmol NO to N2) g−1 s−1] are calculated by normalization of rates by the catalyst mass. All numerical values of specific activity and product selectivity are reported in Tables S3–S7.

3.3. In Situ FTIR

A Harrick Praying Mantis accessory equipped with a High Temperature Cell with gas flow and temperature control capabilities was used to collect in situ diffuse reflectance FTIR spectra of samples in powder form. A Thermo Scientific Nicolet 8700 Research FTIR Spectrometer with a liquid nitrogen cooled MCT detector was utilized to collect the spectra. Spectra were obtained with a resolution of 4 cm−1 and by averaging 64 scans.
In situ diffuse reflectance FTIR spectra were collected during NO adsorption at 300 °C in a feed of 1% NO/He at 30 mL/min for 20 min with a spectrum obtained every minute in series collection mode. Prior to NO adsorption, the sample was first pretreated in 30 sccm of 10% O2/He to 400 °C (calcination temperature). The background spectrum (64 scans) was of the catalyst after cooling to 300 °C in 30 sccm UHP He. The spectral intensities were normalized to the NO gas phase peak at ~1875 cm−1 for comparison of relative peak intensity between samples.

3.4. Oxygen Temperature Programmed Desorption

Oxygen temperature-programmed desorption (O2-TPD) profiles of the samples were collected utilizing a Micromeritics 3flex instrument equipped with a U-shaped quartz tube. Approximately 100 mg of each sample was loaded, pretreated to 500 °C to remove water and adventitious carbon, and cooled in UHP He to 100 °C. Subsequently, a purge utilizing UHP He was conducted for one hour to flush the system to remove physiosorbed oxygen and to obtain a suitable baseline for the mass spectrometer detector (MKS Instruments, Inc., Cirrus-2). Next, the temperature was ramped to 600 °C linearly at 10 °C/min in UHP He, and O2 release was monitored via the intensity of the signal at m/z = 32.

3.5. X-ray Diffraction

X-ray powder diffraction (XRD) patterns of fresh and spent catalysts were collected with a Rigaku Smartlab (Auburn Hills, MI, USA) with a Cu Kα source over a 2θ range of 10–80° at 0.25 °/min with a step size of 0.01 °. XRD patterns were collected after flattening the powder onto a zero background quartz sample holder. Phase assignments were made using Rigaku PDXL2 Version 2.1.3.6. Crystallite size was determined using the Scherrer equation, holding the shape factor constant at 0.89.

3.6. Raman Spectroscopy

Raman spectra of fresh and spent catalysts were recorded utilizing a Horiba-Jobin Yvon LabRAM HR high-resolution Raman microscope instrument utilizing a 532 nm laser (Laser Quantum Ventus 532 Dedicated Raman laser, diode pumped laser, Kyoto, Japan), a confocal microscope with a 50× objective (Olympus MPlan N 50×, Center Valley, PA, USA) and a back illuminated CCD detector (Horiba-Jobin Yvon Synapse 1024 × 256, Kyoto, Japan). The spectrometer response was calibrated to 520.7 cm−1 utilizing a silica reference with spectral resolution of 2 cm−1 using a 600 grooves/mm grating, and with a holographic notch filter to reject Rayleigh scattering.

3.7. X-ray Photoelectron Spectroscopy

X-ray photoelectron spectroscopy (XPS) analysis was carried out using a PHI Versaprobe II XPS system (Chanhassen, MN, USA) equipped with an Al Kα source (1486.7 eV) and a multichannel energy analyzer. High resolution spectra were collected using a pass energy of 29.35 eV at 10−6 Pa. The Co2p (805–760 eV), Mn2p (660–625 eV), and Fe2p (735–690 eV) peak envelopes were collected, and the binding energies were aligned to the signal for adventitious carbon at 284.6 eV (~0.1–0.2 eV error). The resulting peak positions and areas contributing to the Co2p3/2, Mn2p3/2, and Fe2p3/2 peaks were calculated using Multipak (Version 9.3.03). The background was subtracted utilizing an Iterated Shirley method, and the spectral deconvolution was performed utilizing Gauss–Lorentz Function, with χ2 < 5 achieved in most cases.

4. Conclusions

The investigation of K promotion of simple first-row transition metal spinels (Co3O4, Mn3O4, and Fe3O4) for NO decomposition was completed in this study. The promoter effect of K on the activity of Co3O4 was confirmed, and the 0.9 wt.% K Co3O4 catalyst was the most active at 550 and 650 °C. It was revealed that K addition led to increased interaction of the catalysts surface with the reactant NO molecule, stabilization of the Co3O4 crystallite size during reaction, and a greater population of unsaturated bonds of CoO6 octahedra—all of which contribute to the increased reactivity over the unpromoted Co3O4. It is also critical that the K addition did not lead to any modification of the spinel phase or formation of any impurity phases during synthesis or after reaction. The addition of K was identified as a universal promoter of NO adsorption as additional NOx surface species were also observed over Mn3O4 and Fe3O4, but this aspect alone is insufficient to establish K as an overall promoter for direct NO decomposition. The Mn3O4 catalysts were nearly inactive for NO decomposition across all temperatures and K loadings. This poor performance was attributed to an oxidation reaction between Mn and K at higher synthesis or reaction temperature to form a stable and inactive cryptomelane phase. Without K, the Fe3O4 phase oxidizes to α-Fe2O3 in a chemical interaction with NO, and a product stream lacking in O2. The K presence on Fe3O4 facilitated some stabilization of the Fe3O4 phase, but was coupled by formation of γ-Fe2O3 and a reaction to form a potassium–iron mixed oxide. While the stabilization of the Fe3O4 spinel led to some trace detectable activity at 650 °C, the K Fe3O4 samples only released a small amount of O2 at elevated temperatures.
Thus, this work provides a poignant demonstration of the major challenge in developing NO decomposition catalysts—sustainable release of oxygen from the surface as product O2 in the presence of NO. While the NO adsorption and dissociation are obvious steps in the NO decomposition mechanism, the current results suggest that improving the interaction of the catalysts surface with the reactant NO molecule via alkali addition is, by itself, insufficient to increase activity. Additionally, development of improved direct NO decomposition catalyst materials remains challenging due to the lack of a consistent rational approach to design. Addition of K was generally well-suited to aid design of improved N2O decomposition catalyst, but this is not universally true for direct NO decomposition. Nonetheless, it remains of interest to investigate other spinel compositions that might be well-suited to K impregnation, and this study establishes some criteria for the spinel suitability, e.g., it is largely phase stable after reaction with K, does not react with K to form mixed oxides, and releases the O2 product during NO decomposition. Alternatively, one might consider strategies to improve the Fe3O4 spinel properties prior to K addition to improve O2 release characteristics, possibly by doping the spinel structure directly. These results are, therefore, expected to help guide future design of spinel catalysts for direct NO decomposition, and it is expected that these strategies can be extended to other oxide catalyst systems such as perovskites.

Supplementary Materials

The following are available online at https://www.mdpi.com/2073-4344/10/5/561/s1, Table S1: NO Decomposition Catalytic Performance at 400 °C, Table S2: NO Decomposition Catalytic Performance at 450 °C, Table S3: NO Decomposition Catalytic Performance at 550 °C, Table S4: NO Decomposition Catalytic Performance at 650 °C, Table S5: NO Decomposition at 650 °C 0.9K Co3O4, 2K Co3O4, and 3K Co3O4 Under Differential Conditions, Figure S1: NO Decomposition over Fe3O4 as a function of time at 400 °C, Table S6: Crystallite Size From X-Ray Diffraction Patterns as Calculated Via Scherrer Equation, Table S7: XPS Peak Position Summary of Cobalt 2p3/2 Curve Fits, Table S8: XPS Peak Area Percentage Summary of Cobalt 2p3/2 Curve Fits, Table S9: XPS Peak Position Summary of Manganese 2p3/2 Curve Fits, Table S10: XPS Peak Area Percentage Summary of Manganese 2p3/2 Curve Fits, Table S11: XPS Peak Position Summary of Iron 2p3/2 Curve Fits, Table S12: XPS Peak Area Percentage Summary of Iron 2p3/2 Curve Fits, Table S13: Summary of Potassium Weight Loading on Fresh and Spent Catalysts, Table S14: BET Specific Surface Area, Figure S2: EDX map of K distribution on 0.9K Co3O4 (left), 2K Co3O4 (middle), and 3K Co3O4 (right), Figure S3: EDX map of K distribution on 0.9K Fe3O4 (left), 2K Fe3O4 (middle), and 3K Fe3O4 (right), Figure S4: EDX map of K distribution on 0.9K Mn3O4 (left), 2K Mn3O4 (middle), and 3K Mn3O4 (right).

Author Contributions

Conceptualization, T.C.P., C.A.R., and G.K.R.; investigation, T.C.P. and G.K.R.; writing—original draft preparation, T.C.P. and C.A.R.; writing—review and editing, T.C.P., C.A.R., and G.K.R.; visualization, T.C.P. and C.A.R. All authors have read and agreed to the published version of the manuscript.

Funding

This research received no external funding.

Acknowledgments

The authors appreciate the support of Naoto Nagata of Toyota Motor Corporation and Hongfei Jia of Toyota Research Institute–North America.

Conflicts of Interest

The authors declare no conflict of interest. The funders had no role in the design of the study; in the collection, analyses, or interpretation of data; in the writing of the manuscript, or in the decision to publish the results

References

  1. Howard, C.S.; Daniels, F. The Stability of Nitric Oxide Over a Long Time Interval. J. Phys. Chem. 1958, 62, 320–321. [Google Scholar] [CrossRef]
  2. Boreskov, G.K. Forms of oxygen bonds on the surface of oxidation catalysts. Discuss. Faraday Soc. 1966, 41, 263. [Google Scholar] [CrossRef]
  3. Amirnazmi, A. Oxygen inhibition in the decomposition of NO on metal oxides and platinum. J. Catal. 1973, 30, 55–65. [Google Scholar] [CrossRef]
  4. Cónsul, J.M.D.; Peralta, C.A.; Benvenutti, E.V.; Ruiz, J.A.; Pastore, H.O.; Baibich, I. Direct decomposition of nitric oxide on alumina-modified amorphous and mesoporous silica-supported palladium catalysts. J. Mol. Catal. A: Chem. 2006, 246, 33–38. [Google Scholar] [CrossRef]
  5. Reddy, G.K.; Ling, C.; Peck, T.; Jia, H. Understanding the chemical state of palladium during the direct NO decomposition—Influence of pretreatment environment and reaction temperature. RSC Adv. 2017, 7, 19645–19655. [Google Scholar] [CrossRef] [Green Version]
  6. Li, Y.; Hall, W. Catalytic decomposition of nitric oxide over Cu-zeolites. J. Catal. 1991, 129, 202–215. [Google Scholar] [CrossRef]
  7. Modén, B.; Da Costa, P.; Fonfé, B.; Lee, D.K.; Iglesia, E. Kinetics and Mechanism of Steady-State Catalytic NO Decomposition Reactions on Cu–ZSM5. J. Catal. 2002, 209, 75–86. [Google Scholar] [CrossRef]
  8. Groothaert, M.H.; Lievens, K.; Leeman, H.; Weckhuysen, B.M.; Schoonheydt, R.A. An operando optical fiber UV–vis spectroscopic study of the catalytic decomposition of NO and N2O over Cu-ZSM-5. J. Catal. 2003, 220, 500–512. [Google Scholar] [CrossRef] [Green Version]
  9. Tofan, C.; Klvana, D.; Kirchnerova, J. Direct decomposition of nitric oxide over perovskite-type catalystsPart I. Activity when no oxygen is added to the feed. Appl. Catal. A: Gen. 2002, 223, 275–286. [Google Scholar] [CrossRef]
  10. Stoyanova, D.D.; Petrovic, S.P.; Georgieva, P.Z.; Tarlecki-Baricevic, A.; Mehandjiev, D.R. Direct Decomposition of Nitric Oxide on Perovskite Type Catalysts. J. Chem. Technol. Metall. 2017, 52, 75–80. [Google Scholar]
  11. Zhu, Y.; Wang, N.; Yuan, F.; Zhang, G.; Fu, H. Direct NO decomposition over La2−xBaxNiO4 catalysts containing BaCO3 phase. Appl. Catal. B: Environ. 2008, 82, 255–263. [Google Scholar] [CrossRef]
  12. Tsujimoto, S.; Nishimura, C.; Masui, T.; Imanaka, N. Direct decomposition of nitrogen monoxide on (Ho, Zr, Pr)2O3+δ Catalysts. Catal. Commun. 2014, 43, 84–87. [Google Scholar] [CrossRef]
  13. Masui, T.; Uejima, S.; Tsujimoto, S.; Nagai, R.; Imanaka, N. Direct NO decomposition over C-type cubic Y2O3–Pr6O11–Eu2O3 solid solutions. Catal. Today 2015, 242, 338–342. [Google Scholar] [CrossRef]
  14. Sun, Q.; Wang, Z.; Wang, D.; Hong, Z.; Zhou, M.-D.; Li, X. A review on the catalytic decomposition of NO to N2 and O2: Catalysts and processes. Catal. Sci. Technol. 2018, 8, 4563–4575. [Google Scholar] [CrossRef]
  15. Shelef, M.; Otto, K.; Gandhi, H. The heterogeneous decomposition of nitric oxide on supported catalysts. Atmos. Environ. (1967) 1969, 3, 107–122. [Google Scholar] [CrossRef]
  16. Winter, E. The catalytic decomposition of nitric oxide by metallic oxides. J. Catal. 1971, 22, 158–170. [Google Scholar] [CrossRef]
  17. Gassan-Zade, G.Z.; Wood, M.Y.; Alkhazov, T.G. Interaction of nitric oxide with NiCr2O4. React. Kinet. Catal. Lett. 1985, 28, 167–171. [Google Scholar] [CrossRef]
  18. Park, P.; Kil, J.; Kung, H.H.; Kung, M. NO decomposition over sodium-promoted cobalt oxide. Catal. Today 1998, 42, 51–60. [Google Scholar] [CrossRef]
  19. Haneda, M.; Kintaichi, Y.; Bion, N.; Hamada, H. Alkali metal-doped cobalt oxide catalysts for NO decomposition. Appl. Catal. B: Environ. 2003, 46, 473–482. [Google Scholar] [CrossRef]
  20. Roberts, C.A.; Paidi, V.K.; Shepit, M.; Peck, T.C.; Stamm-Masias, K.L.; van Lierop, J.; Reddy, G.K. Effect of Cu Substitution on the Structure and Reactivity of CuxCo3-xO4 Spinel Catalysts for Direct NOx Decomposition. Catal. Today. submitted manuscript.
  21. Peck, T.; Reddy, G.K.; Roberts, C.A. Monolayer supported CuOx/Co3O4 as an active and selective low temperature NOx decomposition catalyst. Catal. Sci. Technol. 2019, 9, 1132–1140. [Google Scholar] [CrossRef]
  22. Abu-Zied, B.M.; Soliman, S.A.; Abdellah, S.E. Enhanced direct N2O decomposition over CuxCo1−xCo2O4 (0.0 ≤ x ≤ 1.0) spinel-oxide catalysts. J. Ind. Eng. Chem. 2015, 21, 814–821. [Google Scholar] [CrossRef]
  23. Abu-Zied, B.M.; Soliman, S.A.; Abdellah, S.E. Pure and Ni-substituted Co3O4 spinel catalysts for direct N2O decomposition. Chin. J. Catal. 2014, 35, 1105–1112. [Google Scholar] [CrossRef]
  24. Wójcik, S.; Grzybek, G.; Stelmachowski, P.; Sojka, Z.; Kotarba, A. Bulk, Surface and Interface Promotion of Co3O4 for the Low-Temperature N2O Decomposition Catalysis. Catalysts 2019, 10, 41. [Google Scholar] [CrossRef] [Green Version]
  25. Maniak, G.; Stelmachowski, P.; Zasada, F.; Piskorz, W.; Kotarba, A.; Sojka, Z. Guidelines for optimization of catalytic activity of 3d transition metal oxide catalysts in N2O decomposition by potassium promotion. Catal. Today 2011, 176, 369–372. [Google Scholar] [CrossRef]
  26. Jirátová, K.; Pacultová, K.; Balabánová, J.; Karásková, K.; Klegová, A.; Bílková, T.; Jandová, V.; Kostejn, M.; Martaus, A.; Kotarba, A.; et al. Precipitated K-Promoted Co–Mn–Al Mixed Oxides for Direct NO Decomposition: Preparation and Properties. Catalysts 2019, 9, 592. [Google Scholar] [CrossRef] [Green Version]
  27. Yamashita, T. NO Decomposition over Mn2O3 and Mn3O4. J. Catal. 1996, 163, 158–168. [Google Scholar] [CrossRef]
  28. Jones, S. Ceria Based Catalysts for Low Temperature NOx Storage and Release. Theses and Dissertations−Chemistry, University of Kentucky, Lexington, KY, USA, 2016. Available online: https://uknowledge.uky.edu/cgi/viewcontent.cgi?article=1073&context=chemistry_etds (accessed on 29 June 2019).
  29. Hadjiivanov, K.I. Identification of Neutral and Charged N x O y Surface Species by IR Spectroscopy. Catal. Rev. 2000, 42, 71–144. [Google Scholar] [CrossRef]
  30. Legutko, P.; Pęza, J.; Rossi, A.V.; Marzec, M.; Jakubek, T.; Kozieł, M.; Adamski, A. Elucidation of Unexpectedly Weak Catalytic Effect of Doping with Cobalt of the Cryptomelane and Birnessite Systems Active in Soot Combustion. Top. Catal. 2019, 62, 599–610. [Google Scholar] [CrossRef] [Green Version]
  31. Parkinson, G.S. Iron Oxide Surfaces. Surf. Sci. 2016, 71, 272–365. [Google Scholar] [CrossRef] [Green Version]
  32. Hadjiev, V.G.; Iliev, M.; Vergilov, I.V. The Raman spectra of Co3O4. J. Phys. C: Solid State Phys. 1988, 21, L199–L201. [Google Scholar] [CrossRef]
  33. Gawali, S.R.; Gandhi, A.C.; Gaikwad, S.; Pant, J.; Chan, T.-S.; Cheng, C.-L.; Ma, Y.-R.; Wu, S.Y. Role of cobalt cations in short range antiferromagnetic Co3O4 nanoparticles: A thermal treatment approach to affecting phonon and magnetic properties. Sci. Rep. 2018, 8, 249. [Google Scholar] [CrossRef] [PubMed]
  34. Gwag, J.-S.; Sohn, Y. Interfacial Natures and Controlling Morphology of Co Oxide Nanocrystal Structures by Adding Spectator Ni Ions. Bull. Korean Chem. Soc. 2012, 33, 505–510. [Google Scholar] [CrossRef] [Green Version]
  35. Larbi, T.; Doll, K.; Manoubi, T. Density functional theory study of ferromagnetically and ferrimagnetically ordered spinel oxide Mn3O4. A quantum mechanical simulation of their IR and Raman spectra. J. Alloy Compd. 2016, 688, 692–698. [Google Scholar] [CrossRef]
  36. Sada, K.; Senthilkumar, B.; Barpanda, P. Cryptomelane K1.33Mn8O16 as a cathode for rechargeable aqueous zinc-ion batteries. J. Mater. Chem. A 2019, 7, 23981–23988. [Google Scholar] [CrossRef]
  37. Sepúlveda, M.; Gutiérrez, S.; Vallette, M.C.; Standen, V.G.; Arriaza, B.T.; Cárcamo, J. Micro-Raman spectral identification of manganese oxides black pigments in an archaeological context in Northern Chile. Heritage Sci. 2015, 3, 3447. [Google Scholar] [CrossRef] [Green Version]
  38. Akkopru-Akgun, B.; Trolier-McKinstry, S.; Lanagan, M.T. MnO2 Thin Film Electrodes for Enhanced Reliability of Thin Glass Capacitors. J. Am. Ceram. Soc. 2015, 98, 3270–3279. [Google Scholar] [CrossRef]
  39. Freitas, R.M.; Perilli, T.A.G.; Ladeira, A.C.Q. Oxidative Precipitation of Manganese from Acid Mine Drainage by Potassium Permanganate. J. Chem. 2013, 2013, 1–8. [Google Scholar] [CrossRef]
  40. Hanesch, M. Raman spectroscopy of iron oxides and (oxy)hydroxides at low laser power and possible applications in environmental magnetic studies. Geophys. J. Int. 2009, 177, 941–948. [Google Scholar] [CrossRef]
  41. De smit, E.; Weckhuysen, B.M. The renaissance of Iron-based Fischer-Tropsch Synthesis: On the multifaceted catalyst deactivation behavior. Chem. Soc. Rev. 2008, 37, 2758–2781. [Google Scholar] [CrossRef]
  42. Biesinger, M.C.; Payne, B.P.; Grosvenor, A.P.; Lau, L.W.; Gerson, A.R.; Smart, R.S. Resolving surface chemical states in XPS analysis of first row transition metals, oxides and hydroxides: Cr, Mn, Fe, Co and Ni. Appl. Surf. Sci. 2011, 257, 2717–2730. [Google Scholar] [CrossRef]
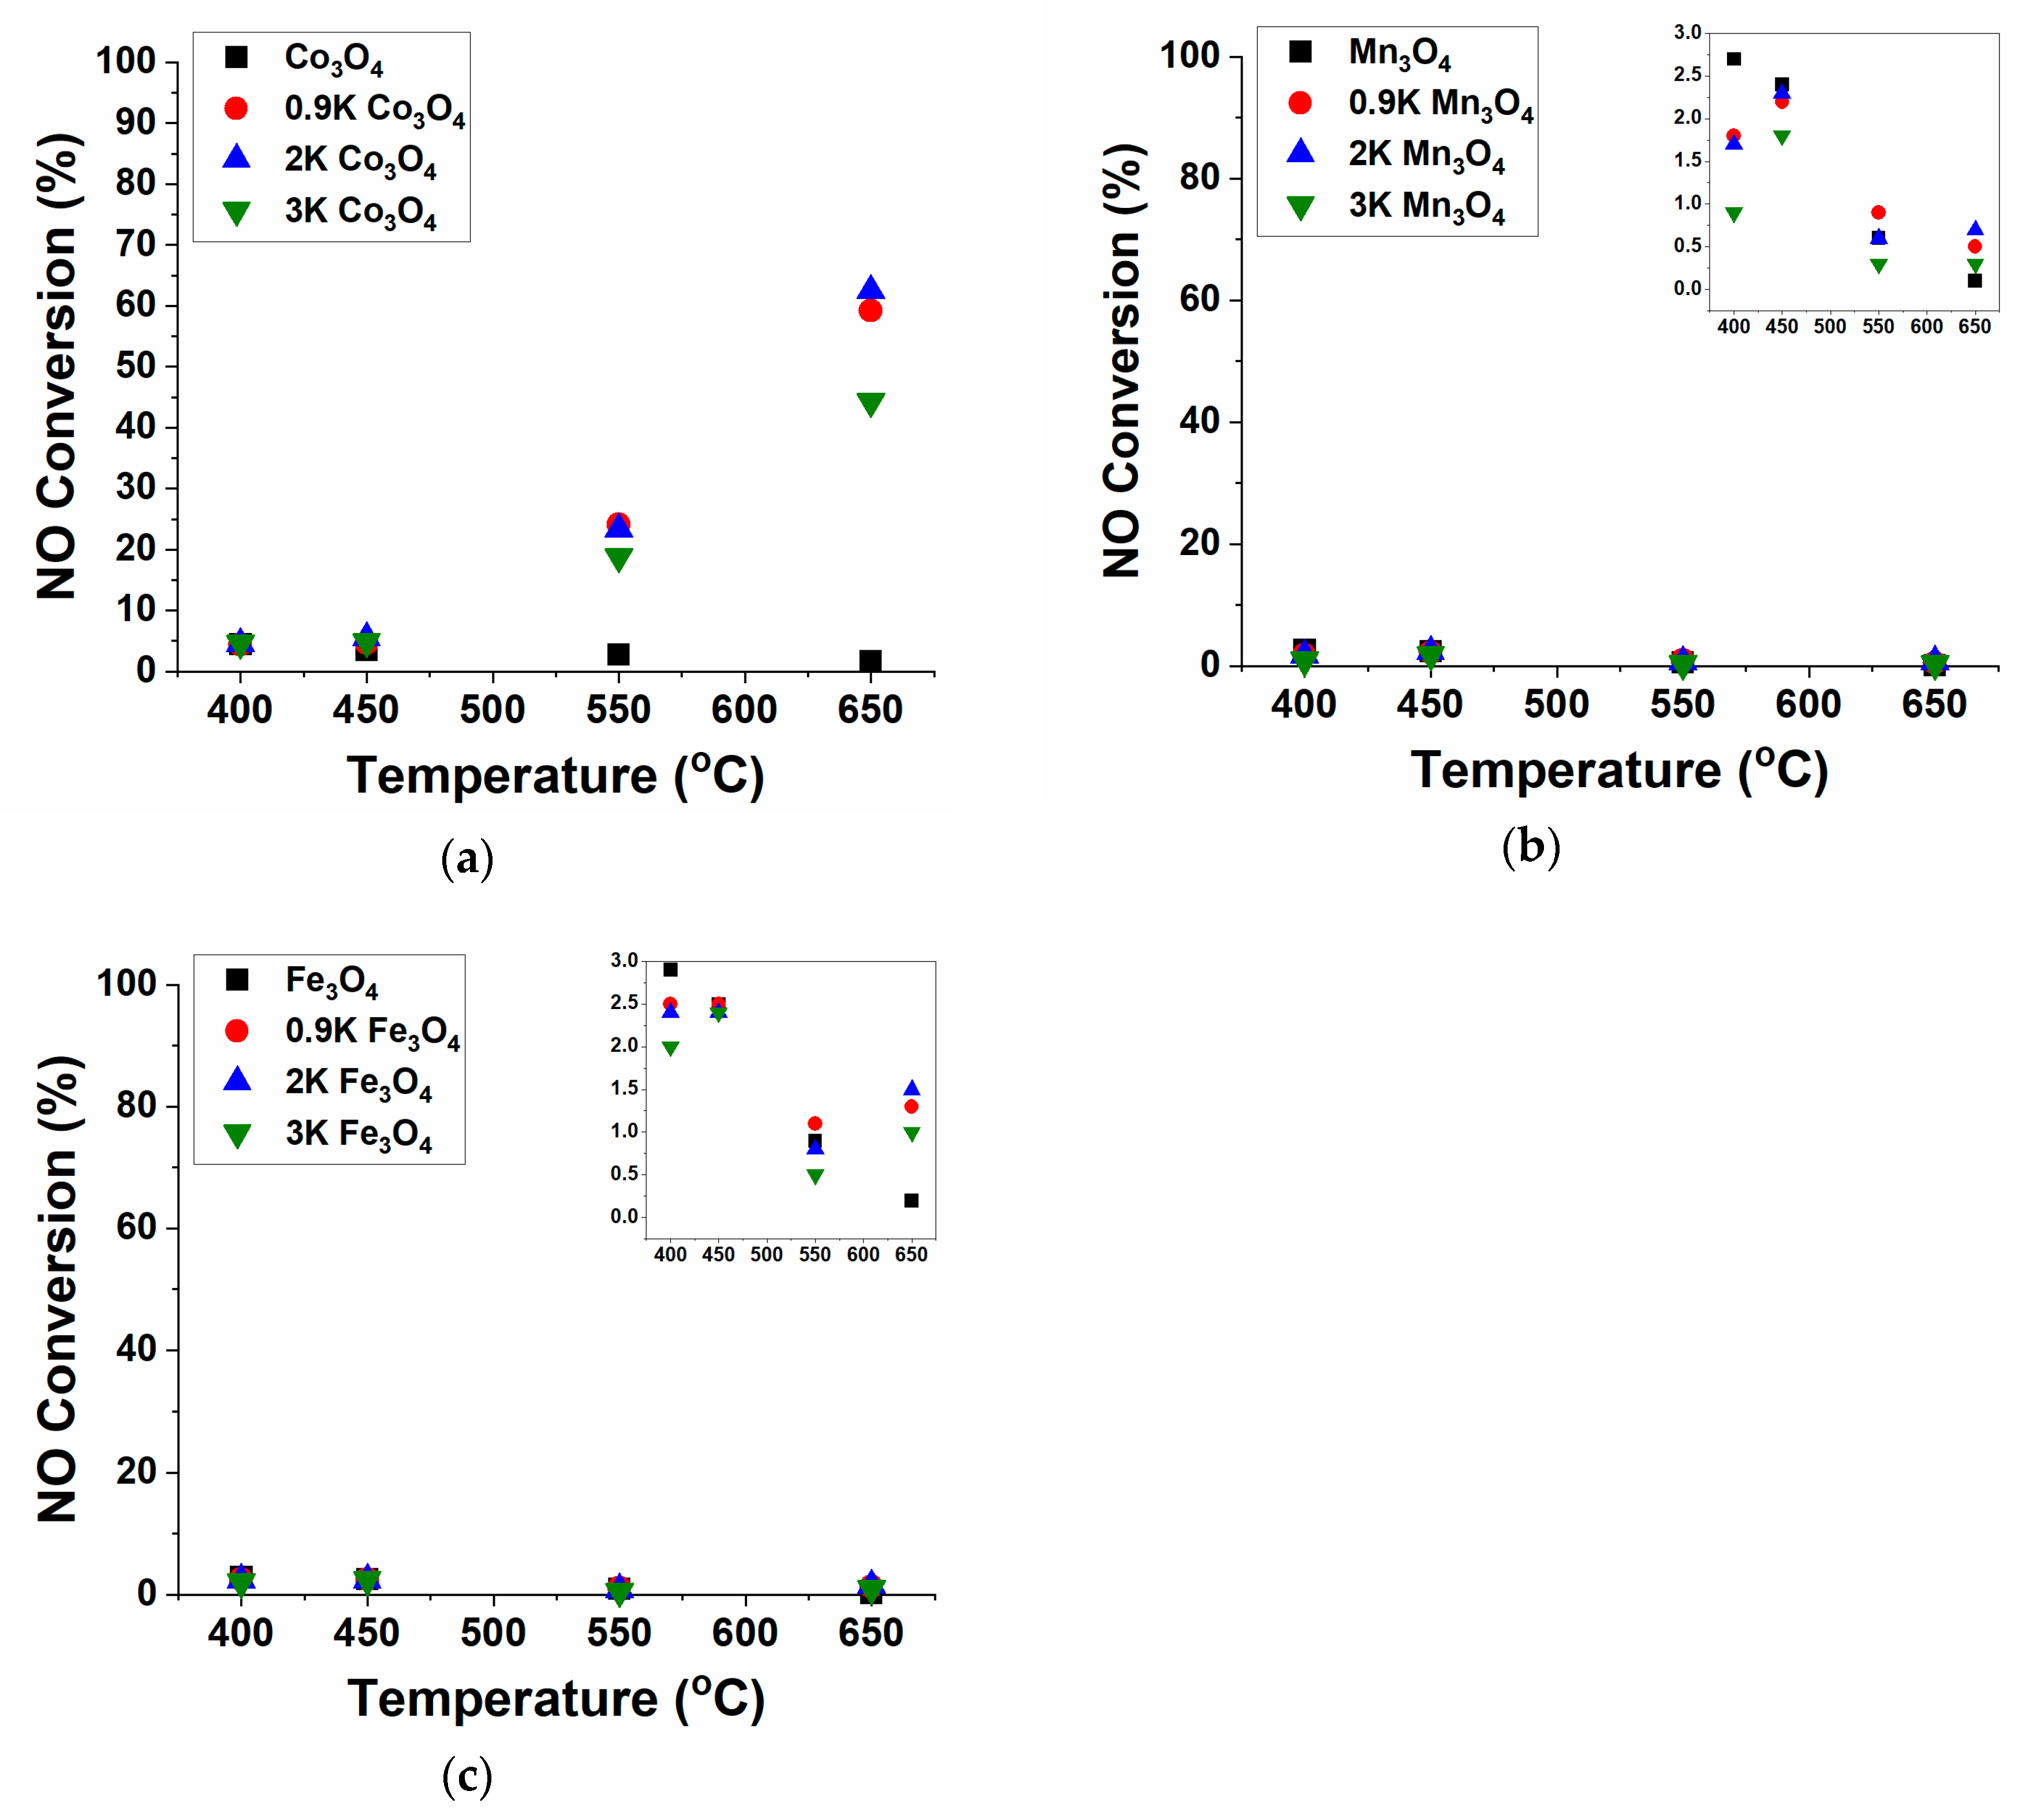
Figure 1. NO conversion as a function of temperature over (a) Co3O4-based catalysts, (b) Mn3O4-based catalysts, and (c) Fe3O4-based catalysts with varying K promotion (0–3 wt.% K); insets for (b) and (c) present the low NO conversion region (0–3%) as a function of temperature to magnify small changes in conversion.
Catalysts 10 00561 g001
Figure 2. NO decomposition activity in units of [(µmol NO to N2) g−1 s−1] as a function of temperature over (a) Co3O4-based catalysts, (b) Mn3O4-based catalysts, and (c) Fe3O4-based catalysts with varying amounts of K promotion (0–3 wt.% K); insets for (b) and (c) present the low activity regions (0–0.003 and 0–0.003, respectively) as a function of temperature to magnify minor changes in activity.
Catalysts 10 00561 g002
Figure 3. In situ Fourier transform infrared (FTIR) of transition metal spinels during NO adsorption with and without K (2 wt. %) at 300 °C.
Catalysts 10 00561 g003
Figure 4. Oxygen temperature-programmed desorption (O2-TPD) profiles as a function of temperature over (a) Co3O4-based catalysts, (b) Mn3O4-based catalysts, and (c) Fe3O4-based catalysts with varying amounts of K promotion (0–3 wt.% K).
Catalysts 10 00561 g004
Figure 5. The O2 mass spectrometer (MS) signal intensity (m/z = 32) during isothermal NO decomposition at 400, 450, 550, and 600 °C over: (a) Co3O4-based catalysts, (b) Mn3O4-based catalysts, and (c) Fe3O4-based catalysts. The baseline m/z = 32 signal is indicated with a dashed line, and data are normalized to set the baseline value to unity.
Catalysts 10 00561 g005
Figure 6. X-ray diffraction patterns of fresh and spent Co3O4 catalysts with varying K loadings. Short vertical lines indicate the position of reflections of Co3O4 (PDF# 00-043-1003) for reference.
Catalysts 10 00561 g006
Figure 7. X-ray diffraction patterns of fresh and spent Mn3O4 catalysts with varying K loadings. Short vertical lines indicate the position of reflections of Mn3O4 (PDF# 01-070-9110) and Mn2O3 (PDF# 01-071-0636) for reference. Asterisks indicate reflections related to the presence of an additional potassium–manganate oxide phase in spent K-containing samples.
Catalysts 10 00561 g007
Figure 8. X-ray diffraction patterns of fresh and spent Fe3O4 catalysts with varying K loadings. Short vertical lines indicate the position of reflections of Fe3O4 (PDF# 04-015-3101), α-Fe2O3 (PDF# 01-073-3825), and γ-Fe2O3 (PDF# 00-025-1402) for reference. Asterisks indicate reflections related to the presence of an additional iron-potassium oxide phase in all spent K-containing samples and in fresh 2K and 3K samples.
Catalysts 10 00561 g008
Figure 9. Raman spectra of fresh and spent Co3O4 catalysts with varying K loading. The A1g, Eg, and two F2g Raman bands of Co3O4 are labelled for reference. The drop line is extended to emphasize the shift in the A1g peak for fresh vs. spent catalysts.
Catalysts 10 00561 g009
Figure 10. Raman spectra of fresh and spent Mn3O4 catalysts with varying K loading. The A1g, Eg, and three T2g bands of Mn3O4 are labeled for reference. Drop lines are extended to emphasize the Raman bands attributed to the presence of cryptomelane (KMn8O16) for samples containing K.
Catalysts 10 00561 g010
Figure 11. (a) Raman spectra of fresh and spent Fe3O4 catalysts with varying K loading from 175 to 800 cm−1 and (b) the same spectra zoomed in to the region from 550 to 750 cm−1. Drop lines are extended for reference to the assigned bands for Fe3O4, α-Fe2O3, γ-Fe2O3, and the bands at 636 and 716 cm−1 are tentatively assigned to the potassium–iron oxide phase in K-containing samples.
Catalysts 10 00561 g011
Figure 12. Co2p3/2 X-ray photoelectron spectroscopy (XPS) spectra of: (a) fresh and (b) spent Co3O4 catalysts with varying K loadings. Colored dashed lines are the peaks utilized identified during fitting, the solid gray line is the background, and the solid black line is the fit. The low binding energy peak is shaded red to emphasize changes with K loading and the effect of reaction environment.
Catalysts 10 00561 g012
Figure 13. Mn2p XPS spectra of: (a) fresh and (b) spent Mn3O4 catalysts with varying K loadings. Colored dashed lines are the peaks utilized identified during fitting, the solid gray line is the background, and the solid black line is the fit. The low and high binding energy peaks comprising the Mn2p3/2 peak are shaded red and green to emphasize changes with K loading and the effect of reaction environment.
Catalysts 10 00561 g013
Figure 14. Fe2p XPS spectra of: (a) fresh and (b) spent Fe3O4 catalysts with varying K loadings. Colored dashed lines are the peaks utilized identified during fitting, the solid gray line is the background, and the solid black line is the fit. The two lowest binding energy peaks comprising the Fe2p3/2 peak are shaded red and blue to emphasize changes with K loading and the effect of reaction environment.
Catalysts 10 00561 g014