Article

Catalytic Pyrolysis of Tetra Pak over Acidic Catalysts

1
Department of Environmental Sciences and Biotechnology, Hallym University, Chuncheon 24252, Korea
2
Unit of Research for Practical Application, Korea Polar Research Institute (KOPRI), Incheon 21990, Korea
3
School of Environmental Engineering, University of Seoul, Seoul 02504, Korea
4
Department of Environmental Engineering, Daegu University, Gyeongsan 38453, Korea
*
Authors to whom correspondence should be addressed.
Co-first authors (These authors contributed equally to this work).
Catalysts 2020, 10(6), 602; https://doi.org/10.3390/catal10060602
Submission received: 17 March 2020 / Revised: 20 May 2020 / Accepted: 26 May 2020 / Published: 29 May 2020
(This article belongs to the Special Issue Catalytic Fast Pyrolysis II)

Abstract

:
The thermal and catalytic pyrolysis of two kinds of Tetra Pak waste (TP-1 and TP-2) over three different acidic catalysts—HZSM-5(SiO2/Al2O3, 30), HBeta (38), and Al-MCM-41(20)—were investigated in this study. Tetra Pak (TP) wastes consist of composite material comprising kraft paper, polyethylene (PE) film, and aluminum foil. Thermal decomposition behaviors during the pyrolysis of TPs were monitored using a thermogravimetric (TG) analyzer and tandem micro reactor-gas chromatography/mass spectrometry (TMR-GC/MS). Neither the interaction between the non-catalytic pyrolysis intermediates of kraft paper and PE, nor the effect of aluminum foil have been monitored during the non-catalytic TG analysis of TPs. The maximum decomposition temperatures of PE in TP-1 shifted from 465 °C to 432 °C by HBeta(38), 439 °C by HZSM-5(30), and 449 °C by Al-MCM-41(20), respectively. The results of the TMR-GC/MS analysis indicate that the non-catalytic pyrolysis of TPs results in the formation of large amounts of furans and heavy hydrocarbons and they are converted efficiently to aromatic hydrocarbons over the acidic catalysts. Among the three catalysts, HZSM-5(30) produced the largest amount of aromatic hydrocarbons, followed by HBeta(38) and Al-MCM-41(20) owing to their different acidity and pore size. Compared to TP-1, TP-2 produced a larger amount of aromatic hydrocarbons via catalytic pyrolysis because of its relatively larger PE content. The synergistic formation of aromatic hydrocarbons was also enhanced during the catalytic pyrolysis of TPs due to the effective role of PE as hydrogen donor to kraft paper. In terms of their catalytic effectiveness, HZSM-5(30) had a longer lifetime than HBeta(38).

1. Introduction

Owing to the rapid population increase and accelerated industrialization, the use of consumable products has increased considerably and the continuous accumulation of waste resulting from these products has become a critical issue worldwide. Efforts to manage and process the waste more appropriately have led to the expansion of the basic concept for managing municipal solid waste (MSW) from 3R (reduce, reuse, and recycle) to 6R (reduce, reuse, recycle, redesign, remanufacture, and recover). Here, redesign, remanufacture, and recover are the expanded version of the newly applied concept of extended producer responsibility (EPR) [1,2]. Because of the ongoing energy crisis and severe environmental pollution, the concept of ‘recover’ has become the most essential aspect of the treatment of MSW because of its high heating value (HHV) and the possibility of obtaining valuable chemicals and fuels via appropriate processing [3,4]. Although various kinds of other renewable energy production technologies can be considered to mitigate the energy crisis [5], most of them are being applied to generate electricity. From this viewpoint, the importance of MSW as an energy or chemical feedstock resource is being emphasized in many countries [6].
Waste plastic is one of the types of MSW that can be converted to fuel or chemical feedstock by the proper conversion technology [7]. Owing to the widespread use of plastic in many industries—such as the packaging, construction, healthcare, and agricultural industries [8]—the amount of waste plastic has increased enormously in recent decades [9]. However, processing plastic efficiently with the use of conventional technology is limited and the government policies of many countries prohibit its direct disposal in landfills or by way of incineration. The implementation of effective policies has resulted in the recycling efficiency of collected waste plastic increasing largely in recent years. Although the need to recycle waste plastics has been emphasized and recycling has increased, the actual recycling ratio has been approximately 75% in the last 10 years. European countries are focusing on preventing the leakage of plastics into the environment and also on improving resource recovery efficiency and the circularity of plastic packaging applications. For this purpose, they have started emphasizing the lifecycle approach for plastics, which targets the reuse and recycling of 60% of all plastic packaging systems by 2030, with the aim of increasing this amount to 100% of all plastic packaging systems by 2040 [10].
Tetra Pak (TP)—a type of aluminum–kraft paper–plastic laminate—is used as packaging material for beverages and liquid food and is widely used as aseptic packaging material. Owing to its typical composition of kraft paper (about 75%), polyethylene (about 20%), and aluminum (about 5%), TP is comparable to other aseptic packaging systems because it can extend the storage period of consumables to six months or more [11]. The portion of TPs in consumable packaging materials is increasing and most of them are being incinerated at the post-consumer stage because it is difficult to separate and recover the respective layers (aluminum, paper, and plastics) [12,13]. For the efficient recycling of TPs, a separation of the different layers needs to be performed [14]. Various separation methods, such as mechanical separation and solvent extraction, were attempted by many researchers. Although mechanical separation is being regarded as a candidate method, it is complicated by the high binding strength between layers [15]. Therefore, solvent extraction methods were suggested by many researchers because the respective layers of TPs can be separated easily by the use of an appropriate solvent [16,17,18,19,20,21,22]. Various kinds of chemicals, such as super-critical water, inorganic acids and bases, hydrochloric acid, sodium hydroxide, nitric acid, and organic solvents, such as formic acid, acetic acid, benzene, acetone, methanoic acid, and mixed solvents, were tested for the separation of aluminum from TPs. An aqueous mixture of organic solvents (i.e., benzene:ethanol:water) was also suggested to separate the TP layers [23]. Although the successful separation of the layers of TP is possible by the use of an appropriate solvent, the large amount of solvent required in this process can be regarded as a disadvantage of solvent extraction process.
Pyrolysis was also suggested as a potential method to recover aluminum and pyrolysis oil from TPs [11,24]. Wu and Chang [24] analyzed the pyrolysis kinetics of TP and its main components using a thermogravimetric (TG) analyzer. They used TG analysis and X-ray powder diffraction (XRPD) measurements to show that pure aluminum foil could be recovered as solid residue after the pyrolysis of TP. Korkmaz et al. [11] reported the yields of gases, wax, carbon residue, and pure aluminum obtained from the pyrolysis of TP. They indicated that the organic parts of TP have high calorific value, suggesting the potential use of the organic components in addition to recycling the separated aluminum. However, the large proportion of oxygen-containing pyrolyzates and large-molecule hydrocarbons in the pyrolysis oil of the TP makes its actual commercialization difficult. Although the additional application of a catalytic process could be considered for the purpose of obtaining value-added fuel or chemical feedstock together with the recovery of aluminum from TP, intensive research on the catalytic pyrolysis of TP has not yet been reported.
This motivated us to investigate the thermal and catalytic pyrolysis of TPs consisting of different amounts of kraft paper and polyethylene (PE), by using a TG analyzer and tandem micro reactor-gas chromatography/mass spectrometry (TMR-GC/MS). To understand the overall pyrolysis reaction, the pyrolysis behavior of each of the TP layers (i.e., kraft paper, PE, and aluminum), separated using a solvent separation method [23], was also examined in this study. Three types of catalysts (HZSM-5(SiO2/Al2O3, 30) HBeta (38), and Al-MCM-41(20)) with different structures and pore sizes are used to determine the optimal conditions for the in-situ and ex-situ catalytic reactions of TPs for the production of aromatic hydrocarbons and recovery of aluminum. In addition, the lifetimes of the catalysts were compared by performing sequential ex-situ catalytic pyrolysis of TPs.

2. Results and Discussion

2.1. Potential Use of TPs as Pyrolysis Feedstock

The proximate, ultimate, and higher heating values (HHVs) analysis results of both TPs are shown in Table 1. Both TPs contained large amounts of carbon and oxygen with a small amount of hydrogen due to the presence of PE and kraft paper [25,26]. The volatile contents of both TPs, higher than 80%, suggest that a large amount of gas or liquid could be obtained by using appropriate pyrolysis conditions in the reaction system. The fixed carbon contents of TP-1 and TP-2 were 8.1 and 7.2%, respectively, suggesting the need to consider the additional separation of carbon char from the pyrolysis residuals of TPs to obtain high-purity aluminum. The ash contents of both TPs were larger than 10%, indicating that a large amount of aluminum, at least 10% of waste TPs, could be recovered via the pyrolysis process. Owing to the presence of kraft paper, both TPs had high O contents, 47.3% and 45.0% in TP-1 and TP-2, respectively, together with C and H. The high O content of TPs suggests that large amounts of oxygen-containing pyrolyzates could be produced from the pyrolysis of both TPs and that an upgrade to stable hydrocarbons via an additional catalytic reaction process would be necessary. The HHVs of both TPs exceeded 3700 kcal/kg, indicating their potential use as fuel feedstock.
The results of the proximate analysis of separated layers of kraft paper (SKP), PE (SPE), and aluminum (SAF) from TPs are shown in Table S1. The volatile content of SPE and SKP of TP-1, approximately 94% and 85%, respectively, was similar to the values generally reported as those of PE [27,28,29] and wood paper [30,31]. Although SPE has no fixed carbon content, SKP was found to contain 8.8% (TP-1) and 7.7% (TP-2) of fixed carbon contents, indicating that the fixed carbon in TPs is caused by the presence of kraft paper. Interestingly, the volatile contents of SAF were 57.7% (TP-1) and 62.2% (TP-2), indicating the presence of considerable amounts of organic components in SAFs. This suggests that the complete separation of aluminum foil from TPs by solvent separation is difficult and points to the limited value of solvent extraction technology for the complete recovery of aluminum. This could also increase the potential value of the pyrolysis process to recover aluminum foil from TPs even though residual carbon remained in the pyrolysis reactor with the aluminum foil after the pyrolysis of TPs, because the volatiles in SAFs are eliminated from the solid residue via the pyrolysis process.

2.2. Catalysts

The temperature programmed desorption of ammonia (NH3-TPD) results (Figure S1 and Table S2) of the catalysts revealed that HZSM-5(30) has the highest acidity followed by HBeta (38) and Al-MCM-41(20). The pore size, BET surface area, and external surface area of Al-MCM-41 (2.8 nm, 843 m2/g, and 140 m2/g) [32] were the largest followed by those of HBeta (38) (0.76 × 0.64, 0.56 × 0.56 nm, 567 m2/g, and 44–58 m2/g) and HZSM-5(30) (0.56 × 0.53, 0.55 × 0.51 nm, 415 m2/g, and 50 m2/g) [33,34].

2.3. TG Analysis

The TG and derivative TG (DTG) analysis curves of TPs, manufactured in different companies, are shown in Figure 1. Although both TPs underwent weight loss in three reaction stages, which were attributed to the decomposition of kraft paper (first stage), PE (second stage), and other additives such as CaCO3 (third stage), the weight loss of TP-1 and TP-2 at each stage (between 210 and 390 °C) on the TG curves were different as a result of their different composition ratio of kraft paper and PE. Kraft paper mainly consists of cellulose, which decomposes between 200 °C and 400 °C [35,36]. PE rapidly decomposes between 400 °C and 520 °C, i.e., at a higher temperature than cellulose [37,38]. The non-isothermal thermal decomposition property of aseptic packages was also reported by other researchers [39]. They also considered the first and second weight loss to be the decomposition of kraft paper and PE, respectively. Wu and Chang [24] obtained kinetic model expressions for the non-isothermal TG analysis of TP and CaCO3. They found that CaCO3 dissociates to CaO and CO2 at temperatures higher than 600 °C.
The weight loss of TP-1 in the first stage of the TG analysis was 50.2% of the initial mass of TP-1, which is larger than that of TP-2 (41.8%), indicating the larger content of kraft paper in TP-1 than in TP-2. In contrast, TP-2 underwent larger weight loss (35.4%) than TP-1 (23.8%) in the second stage, suggesting a larger PE content of TP-2 compared to TP-1. After the TG analysis, 20.0% and 17.4% of the initial sample mass remained in the TG sample cup as a solid residue, respectively. The larger solid residue of TP-1 compared to TP-2 can be explained by considering the larger content of kraft paper and aluminum. Compared to PE, kraft paper is known to produce a much larger amount of thermally stable char [40] and this char would have to be separated from the aluminum after pyrolysis. This may require an additional post-treatment process after the pyrolysis of TPs. In this respect, TP-2, with its smaller content of kraft paper, could be considered a more appropriate feedstock, not only for the production of valuable fuel and/or chemical feedstock, but also to minimize the burden of implementing a post-separation or calcination process for the char. Although the peak heights of each stage on the DTG curve of TP-1 differed from those of TP-2 because of their different compositional ratio, the maximum decomposition peak temperatures (Tmaxs) were not different. This indicates that the decomposition of kraft paper does not influence the decomposition of PE during non-catalytic pyrolysis.
To define the mutual interaction of kraft paper and PE depending on their compositional ratio by comparing Tmax shift of each component of TP, additional TG analysis for artificial mixtures of SKP and SPE prepared by the solvent separation of TP-1, was conducted. As shown in Figure S2 and Table S3, the values of Tmax at first and second stage were not changed by differentiating the compositional ratio of SKP and SPE in their mixtures. This confirms the absence of mutual interaction between kraft paper and PE during the TG analysis [41]. Park et al. [42] also commented that the decomposition temperature of biomass and PE does not change even when they are co-pyrolyzed non-isothermally in a TG analyzer. The addition of SAF to the SKP/SPE mixture for the TG analysis also had no influence on their thermal decomposition behavior, suggesting that aluminum foil had no catalytic effect during the pyrolysis of TPs.
Figure 2 reveals the DTG curves of TPs obtained from their thermal and catalytic TG analysis over HZSM-5(30), HBeta (38), and Al-MCM-41(20) at 10 °C/min. Although acidic catalysts were used in the TG analysis of TP-1, the Tmax values of TPs for the first and third stages, the decomposition regions of kraft paper and CaCO3, remained unchanged (Table S4). Park et al. [43] explained that the decomposition temperature of wood does not shift to a lower temperature over acidic catalysts because the biomass is decomposed first thermally. After that, the thermal decomposition products diffused into the pores of the acidic catalysts because the kinetic diameter of cellulose is larger than the pore size of the catalyst. In contrast, PE molecules can easily diffuse into the pores of the catalyst and the catalytic reaction efficiencies largely depend on the acidity of the catalyst [44]. In our results, the Tmax values of TPs for the second stage, obtained from the catalytic TG analysis over all the catalysts used in this study, shifted to lower temperatures compared to those in the thermal TG analysis. The Tmax for the second stage on the DTG curve of TP-1 shifted to the lowest temperature by the use of HBeta (38), 432 °C, followed by HZSM-5(30), 439 °C, and Al-MCM-41(20), 449 °C. The catalytic DTG curves of TP-2 also exhibited a temperature shift similar to that of TP-1 over the same catalyst. This order is coincident with that of the catalyst acidity (Figure S1), suggesting the important role of catalyst acidity in the decomposition of PE. The pore size of the catalyst is another important factor in the catalytic decomposition of a polymer because of the easier diffusion of catalytic reaction intermediates of PE when the pore size of the catalyst is sufficiently larger than the kinetic diameter of reactant molecules. Du et al. [45] indicated that HBeta has a larger pore size than HZSM-5 and attributed the higher decomposition efficiency to its larger pore size. Marcilla et al. [46] also reported that the diffusion of primary products obtained from the catalytic pyrolysis from HBeta was easily observed as a result of the larger pore size of HBeta as compared to HZSM-5. Although Al-MCM-41(20), a mesoporous catalyst, has a much larger pore size than HBeta(38) and HZSM-5(30), it is much less acidic than HBeta(38) and HZSM-5(30). This can be the reason for its lower decomposition efficiency as shown by the DTG curve of PE in TPs. The lower decomposition efficiency of Al-MCM-41(20), having a larger pore size than HBeta(38) and HZSM-5(30), can also be understood in the role of external acid sites of the catalysts. Although HBeta(38) and HZSM-5(30) have smaller pore sizes than Al-MCM-41(20), they can provide the high decomposition efficiency at the external acid sites of catalysts and these decomposed products can be diffused to their small pores for further reaction [47,48].

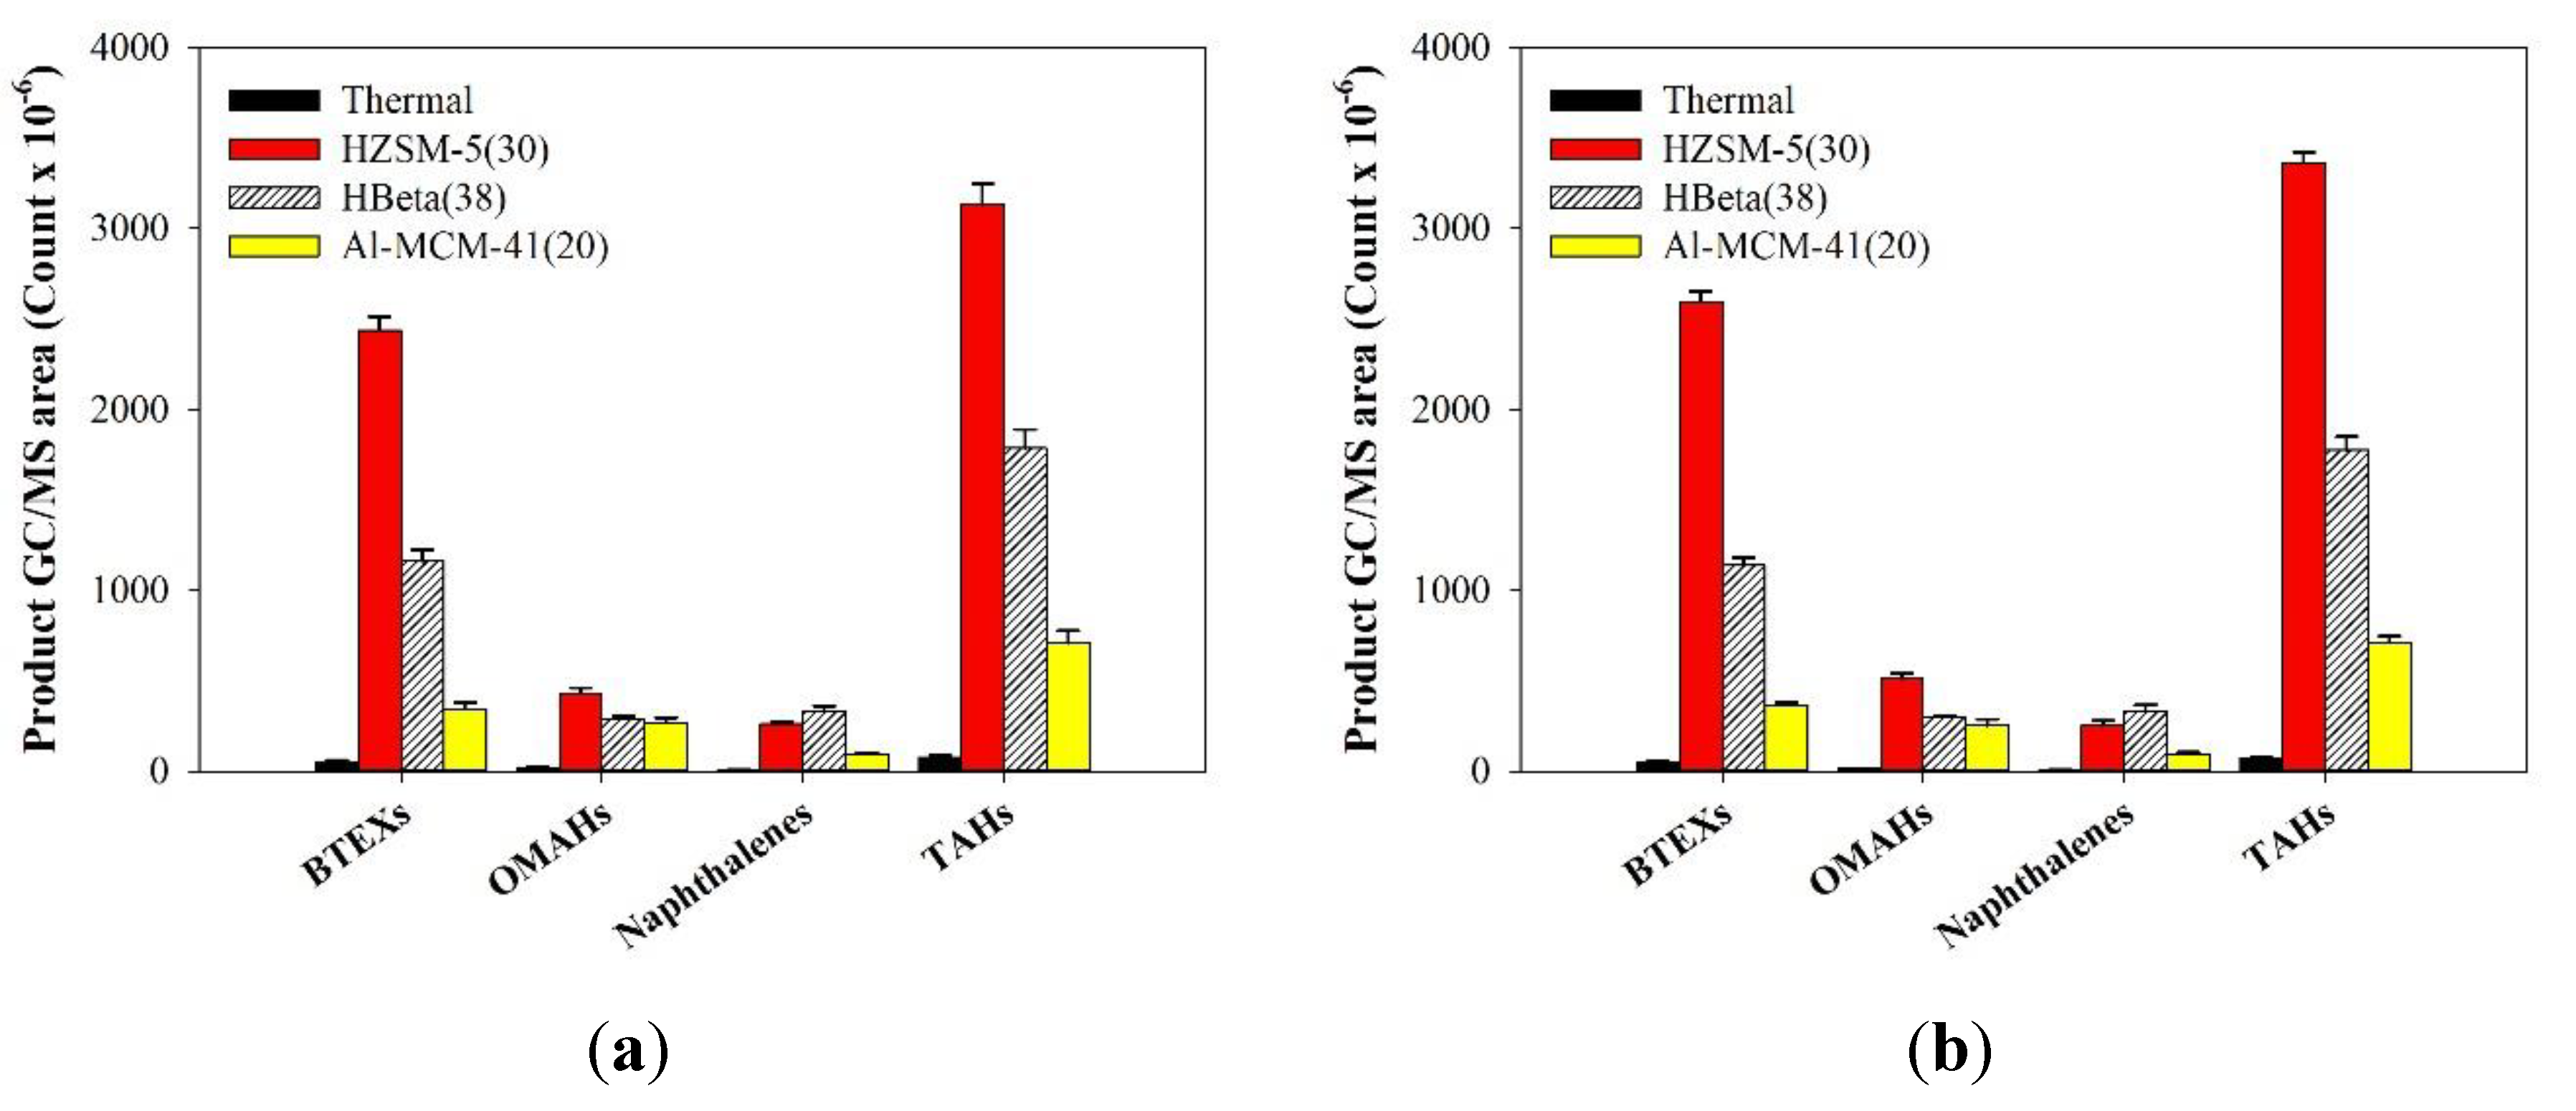
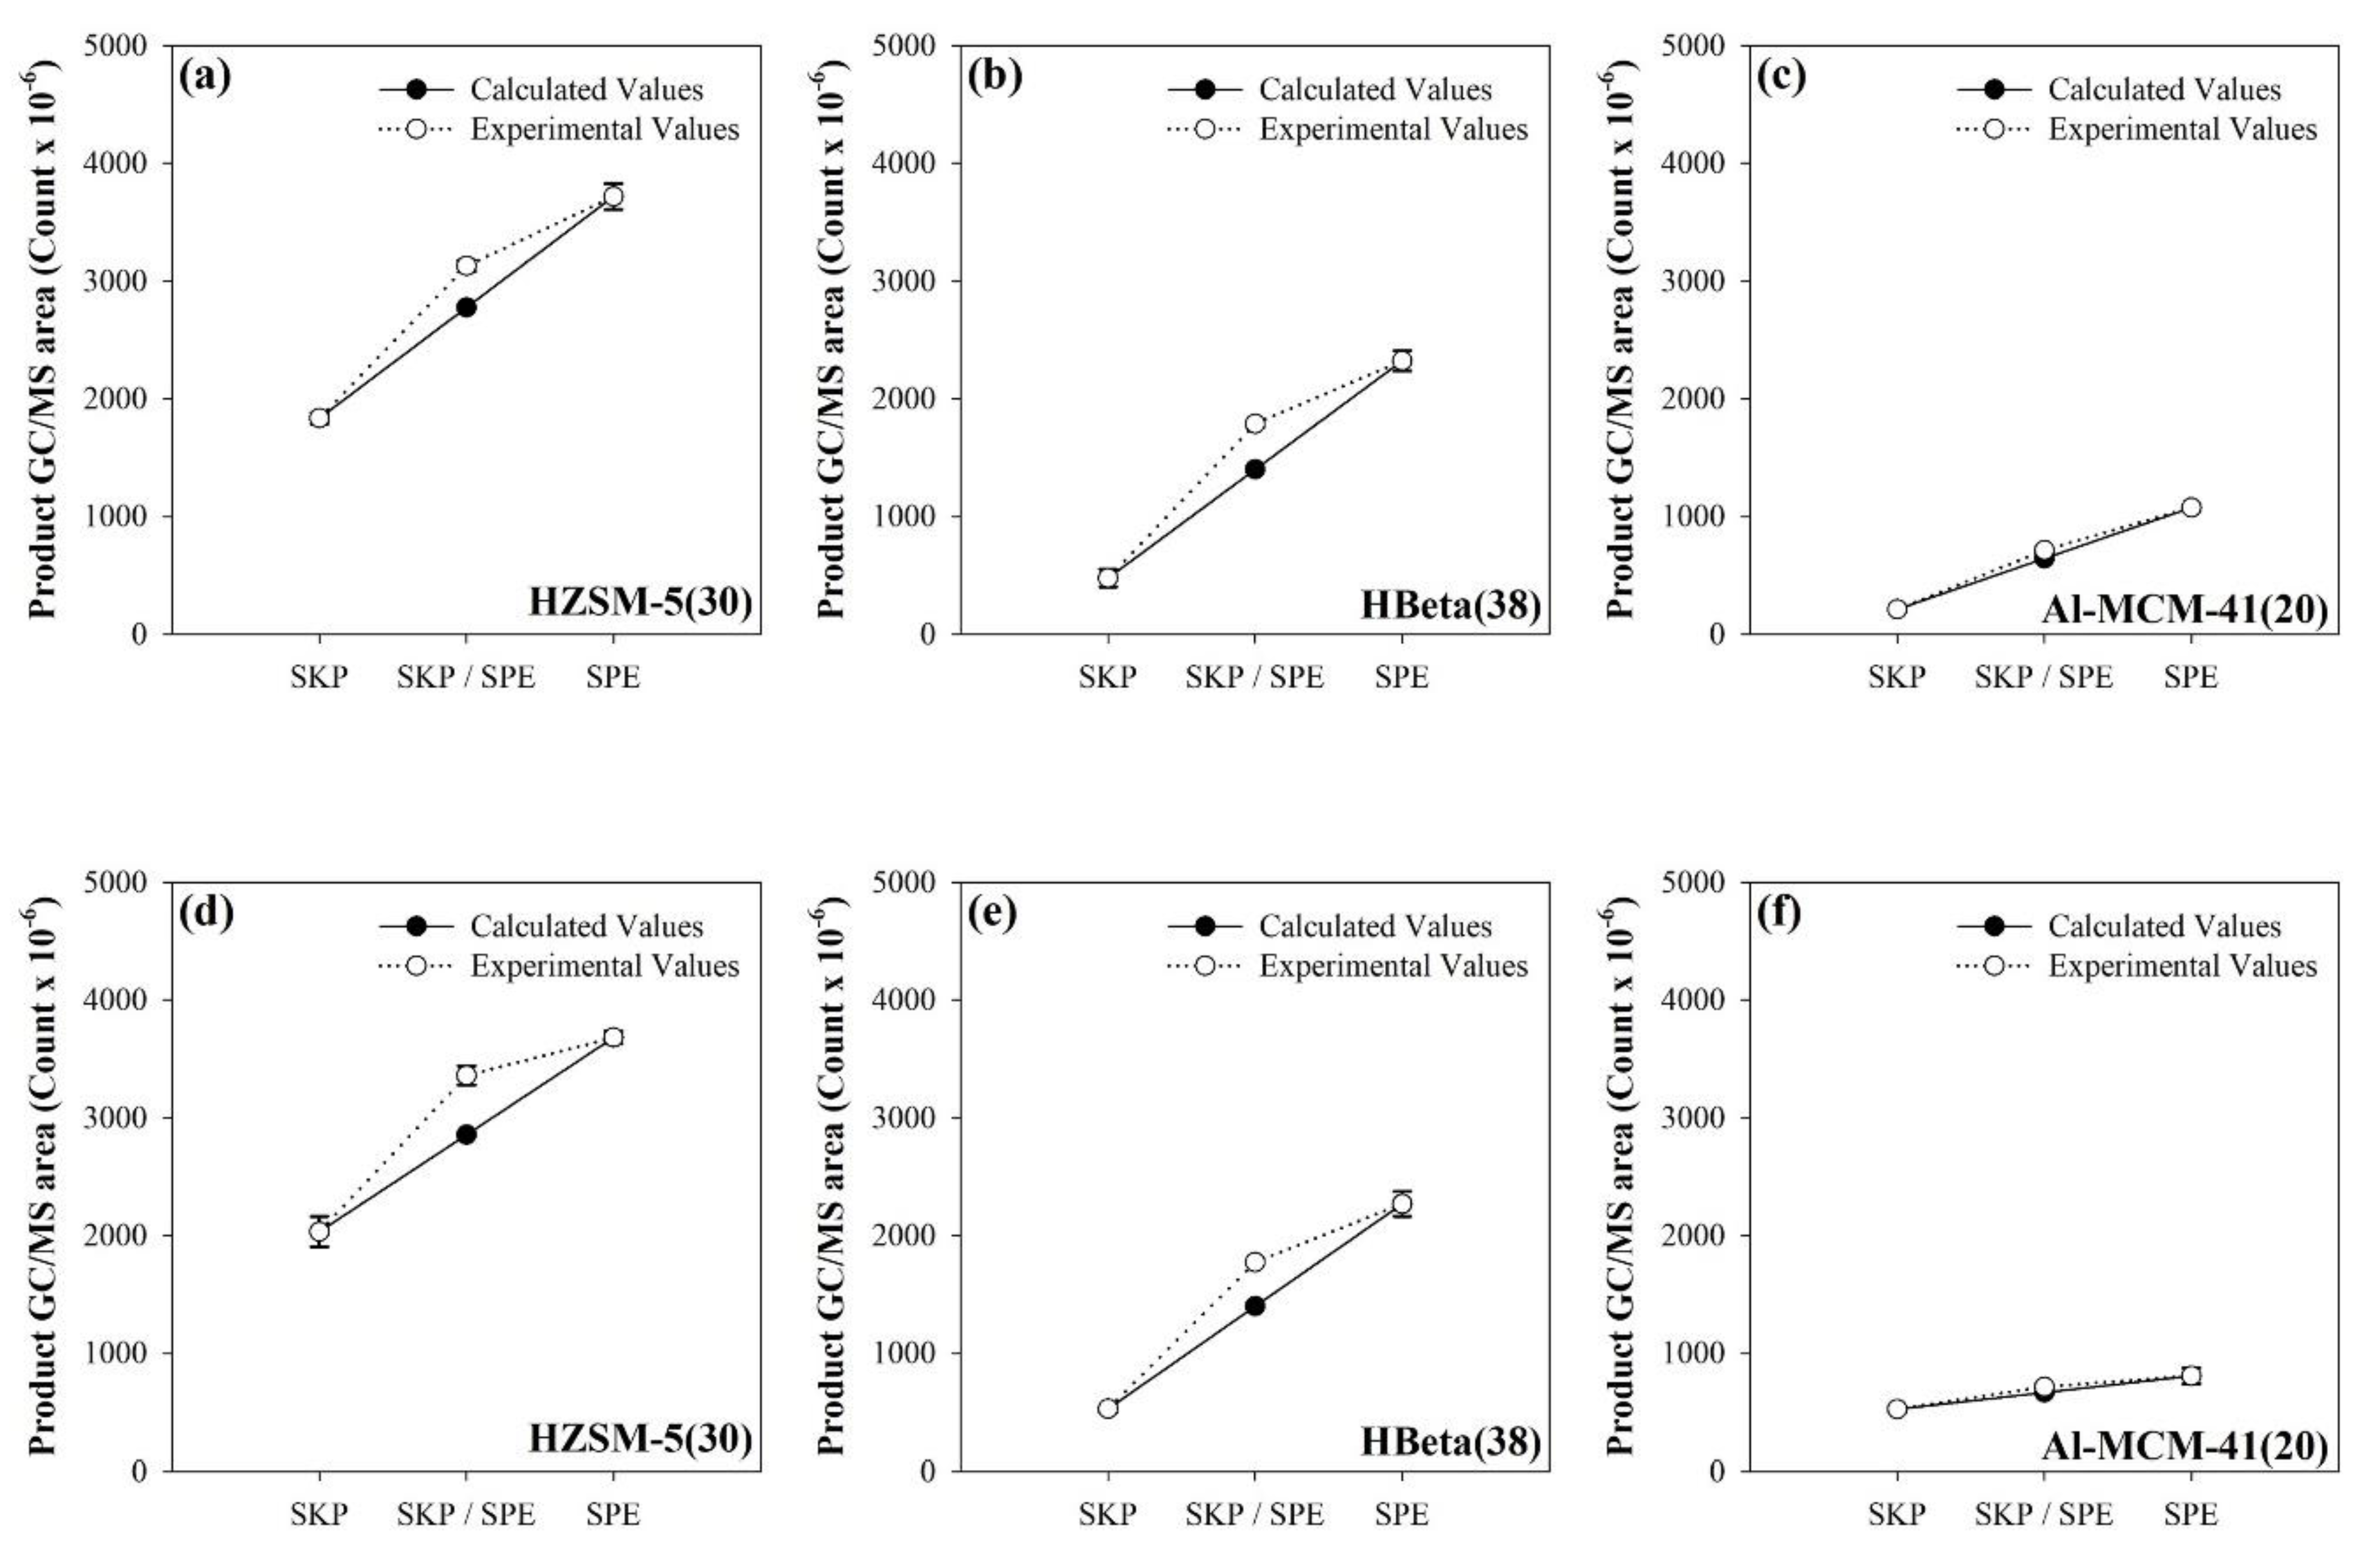
2.4. TMR-GC/MS Measurement

Figure 3 shows the MS chromatograms for the non-catalytic pyrolysis of TPs at 650 °C. Both TP-1 and TP-2 contained the typical pyrolyzates of cellulose—e.g., methylfuran and furfural [45,49]—and those of PE, paraffins, and olefins in wide carbon range up to C20 [50,51], confirming the co-presence of kraft paper and PE in both TPs. Although levoglucosan is known to be a typical pyrolyzate of cellulose, the pyrolyzates of kraft paper in both TPs were mainly detected as furans. This possibly suggests that levoglucosan underwent additional hydration during the pyrolysis of TPs at 650 °C.
The chromatograms for the non-catalytic pyrolysis of SPE, SKP, and a mixture thereof, separated from TP-1 and TP-2, are shown in Figures S3 and S4, respectively. As expected, both SPE and SKP produced the typical pyrolyzates of PE and biomass via their Py-GC/MS analysis. The mixture of SPE and SKP produced the typical pyrolyzates of PE and biomass and their peak areas were not largely different from half of those obtained in their individual Py-GC/MS analysis (Tables S5 and S6). This suggests no distinct integration between the pyrolyzates of SKP and SPE during their co-pyrolysis [41]. Although the main pyrolyzates of TPs consisted of hydrocarbons, most of them are large-molecule hydrocarbons, which are difficult to use directly as fuel or chemical feedstock. In addition, these waxy hydrocarbons can cause the oil condensing line of the pyrolysis plant to become blocked [52]. The formation amount of wax can be reduced by increasing the reaction temperature [53] or the use of catalyst [54]. The effect of aluminum foil on the pyrolysis of the separated constituents of TP samples—i.e., SKP and SPE—was negligible (data not shown).
The GC/MS chromatograms and peak area counts for the product obtained from the catalytic pyrolysis of TP-1 and TP-2 over different catalysts are shown in Figure S5 and Table S7, respectively. Among the three catalysts used in this study, HZSM-5(30) revealed the highest efficiency on the production of aromatics (GC/MS peak area count: 2378 × 106 for TP-1 and 3203 × 106 for TP-2) via the catalytic pyrolysis of TP-1 and TP-2 followed by HBeta(38), 958 × 106 for TP-1 and 1436 × 106 for TP-2, and Al-MCM-41(20), 562 × 106 for TP-1 and 596 × 106 for TP-2. Mesoporous Al-MCM-41(20), with the largest pore size (2.8 nm) and lowest acidity (0.2272 mmol NH3/g) among the catalysts, revealed the lowest efficiency on the production of benzene, toluene, ethylbenzene, and xylenes (BTEXs) and a large amount of waxy hydrocarbon with a large carbon number distribution. HBeta(38) and HZSM-5(30) produced aromatic hydrocarbons, mainly owing to their high acidity (Figure S1) and appropriate pore size for the formation of aromatics [54]. The higher production efficiency of HZSM-5(30) on the production of aromatics can be explained by its stronger acidity (1.1931 mmol NH3/g) than HBeta(38) (1.0372 mmol NH3/g) and appropriate shape selectivity [45]. It was reported that catalytic pyrolysis over HZSM-5, having small pore diameter (<5.6 Å) compared with Beta (<6.7 Å), could produce larger amounts aromatics compared with that over HBeta, because HZSM-5 has a MFI structure and similar kinetic diameter of BTEXs (5.85–6.80 Å) [55]. Between the two TPs, TP-2 produced a larger amount of total aromatics over all three catalysts (GC/MS peak area count: 3203 × 106 over HZSM-5(30), 1436 × 106 over HBeta(38), and 596 or × 106 over Al-MCM-41(20)) than those produced from TP-1 (2378 over HZSM-5(30), 958 × 106 over HBeta(38), and 562 × 106 over Al-MCM-41(20)). This suggests that the higher percentage of PE in TP-2, contrary to TP-1, favored the more efficient formation of total aromatic hydrocarbons.
Figure 4 presents the summed MS peak areas of aromatic hydrocarbons obtained from the catalytic co-pyrolysis of SKP and SPE, separated from TP-1 and TP-2, over catalysts. The performance of HZSM-5(30) in the catalytic co-pyrolysis was the highest, followed by HBeta(38) and Al-MCM-41(20), in common with the catalytic pyrolysis of TP-1 and TP-2. This indicates that HZSM-5(30) is the most suitable catalyst, not only for the catalytic pyrolysis of TPs, but also for the catalytic co-pyrolysis of SKP and SPE.
The synergistic effect between the catalytic pyrolysis intermediates of SKP and SPE during their catalytic co-pyrolysis was also evaluated in this study by comparing the theoretical and calculated GC/MS peak area of total aromatic hydrocarbons. The experimental values were obtained by injecting the same amounts of SKP and SPE into the sample cup with the same amount of catalyst. The calculated yields were obtained by summation of the peak areas of the aromatic hydrocarbons obtained from the individual catalytic pyrolysis of SKP and SPE. As shown in Figure 5, the experimental GC/MS peak areas of total aromatics obtained from the catalytic co-pyrolysis of SKP and SPE over HZSM-5(30) and HBeta(38) were much higher than the calculated ones, suggesting the synergistic formation of aromatics by co-feeding the SKP and SPE on the formation of aromatic hydrocarbons. The synergistic effect was also differentiated by the properties of the catalyst. Microporous catalysts, such as HZSM-5(30) and HBeta(38), enable a sufficiently high Diels–Alder reaction efficiency by providing high shape selectivity and sufficient amounts of acid [32,45]. The additional formation of aromatics on the catalytic co-pyrolysis of biomass and thermo-plastics could be enhanced by the additional Diels–Alder reactions between the catalytic pyrolysis intermediates from biomass, mainly furans, and those of plastics, i.e., light olefins [54]. Large amounts of light olefins could react with the furans, which would lead to the additional formation of aromatics over HZSM-5(30) and HBeta(38). Al-MCM-41(20) produced smaller amounts of aromatic hydrocarbons and light olefins than HZSM-5(30) and HBeta(38) because an efficient Diels–Alder reaction efficiency during catalytic pyrolysis would be decreased by the large pores and the weakly acidic catalyst, as shown in Figure S1 [56,57].
Figure 6 shows the results of the catalyst deactivation test during five sequential catalytic pyrolysis cycles of TP-2. During the sequential pyrolysis, HZSM-5(30) produced a larger amount of aromatic hydrocarbons than HBeta(38). The decrease of GC/MS peak area of total aromatics over HZSM-5(30), 33.1% of first run after the fifth run, was lower than that (55.5% decrease) over HBeta(38). This suggests that HZSM-5(30) allows a longer lifetime than HBeta(38) during the sequential catalytic pyrolysis process of TPs.
Figure 7 presents a comparison of the in-situ and ex-situ use of the catalysts for the pyrolysis of TP-1 and TP-2. The in-situ catalytic pyrolysis of TPs produced a larger amount of aromatic hydrocarbons compared to the ex-situ reaction. Other researchers [58,59] also determined the efficiency of in-situ catalytic pyrolysis to be higher and attributed this to more effective contact between the reactant and catalyst in the in-situ reaction and the possibility of radical reactions which may limit further reactions in catalyst pores in the ex-situ configuration.

3. Materials and Methods

3.1. TP and Their Separation

Two kinds of waste TP containers, TP-1 and TP-2, produced by different manufacturers and used as packaging materials for milk, were selected as the test samples. The waste TPs were washed with warm distilled water at approximately 40 °C to remove residual milk and other impurity particles from the surface, and then dried in air atmosphere for two days. The three layers (kraft paper, PE, and aluminum) of the TPs were separated using a solvent separation method. Specifically, the TPs were subjected to sonication for 15 min at 50 °C in an aqueous mixture of organic solvents (benzene/ethanol/water: 30/20/50) according to a reported procedure [23]. The separated layers (SKP, SPE, and SAF) were shown in Figures S6 and S7. All samples, TP-1, TP-2, SKP, SPE, and SAF, were shredded into small particles (particle size < 1 mm2), dried at 60 °C for 48 h to eliminate the residual solvent, and stored in a desiccator. The proximate, ultimate, and HHV analysis of TPs and their separated layers were performed according to the procedures reported in other literature [60,61] and explained in the Supplementary Materials.

3.2. Catalysts

Microporous HZSM-5(30, SiO2/Al2O3 ratio), microporous HBeta(38), and mesoporous Al-MCM-41(20) were used as the catalysts in this study. HZSM-5(30) and HBeta(38) were purchased from Zeolyst and Al-MCM-41(20) was synthesized using a published procedure [62]. All catalysts (particle size < 10 mm) were calcined at 600 °C for 6 h under air before the experiments. The acidic property of the catalysts was analyzed by NH3-TPD measurement according to the procedure explained in the Supplementary Materials.

3.3. TG Analysis

Non-isothermal TG analysis was performed by heating the sample (2 mg) from ambient temperature to 800 °C at 10 °C/min under nitrogen flow (100 mL/min) using a TG analyzer (TGA55 Discovery, TA Instruments, New Castle, DE, USA) to study the thermal decomposition characteristics. The co-pyrolysis effect of SKP and SPE was examined by testing mixtures of SKP and SPE with different weight ratios (SKP/SPE: 3/1, 1/1, and 1/3). The effect of the presence of SAF on the TG analysis of the SKP/SPE mixture was also tested by adding 2 mg of SAF to 2 mg of the SKP/SPE mixture. The catalytic pyrolysis of the TPs was carried out by blending 6 mg of catalyst with 2 mg of TPs (Catalyst/sample: 3/1).

3.4. TMR-GC/MS Analysis

A commercial TMR (Rx-3050TR, Frontier Laboratories Ltd., Fukushima, Japan)-GC/MS (7890A/5975C inert, Agilent Technology, Santa Clara, CA, USA) was used to determine the properties of the products obtained from the thermal and catalytic pyrolysis of TPs by using a published procedure [48]. For thermal TMR-GC/MS analysis, 1 mg of sample was inserted into the first TMR. In the case of in-situ catalytic TMR-GC/MS measurement, 3 mg of catalyst was blended with 1 mg of sample in a pyrolysis sample cup (catalyst/sample: 3/1) and allowed to free-fall into the first TMR (650 °C). During the in-situ catalytic TMR-GC/MS analysis, the temperature of the second TMR—of which the catalyst tube was empty—was maintained at 320 °C to prevent additional secondary cracking of the pyrolysis products. For the ex-situ catalytic TMR-GC/MS analysis, 3 mg of catalyst was loaded onto the catalyst bed located in the second TMR (650 °C) to allow the pyrolysis vapor of the TPs emitted from the first TMR to pass through the catalyst tube at 650 °C. All data were obtained from the average values of duplicates to confirm data reproducibility. Additional details of the operating conditions of the TMR-GC/MS analysis are summarized in Table S4.
To know the catalyst deactivation behavior on the production of aromatic hydrocarbons, the sequential catalytic TMR-GC/MS analysis over HZSM-5(30) and HBeta(38) was also performed under the same experimental condition applied on the ex-situ catalytic TMR-GC/MS analysis. For this, 1 mg of TP-2 was continuously fed to the first TMR with the measurement of GC/MS peak area of aromatic hydrocarbons, however, the catalyst in the catalyst bed of second TMR was not changed during the sequential catalytic TMR-GC/MS analysis.

4. Conclusions

This study used TG and TMR-GC/MS analysis to investigate the thermal and catalytic pyrolysis of TPs. The conditions under which TPs could be effectively decomposed, and under which the formation of a large amount of aromatics was possible, were demonstrated. Although the co-presence of aluminum in TPs could not lead the higher efficiency on the decomposition of TPs, the decomposition temperature of PE in TPs was shifted to a lower temperature by using an appropriate catalyst. The catalytic pyrolysis of TPs over microporous catalysts, HZSM-5(30) and HBeta(38), produced large amounts of aromatic hydrocarbons owing to the small pore size and high acidity of these catalysts. The synergistic formation of aromatic hydrocarbons during the catalytic pyrolysis of TPs was also enhanced by the use of microporous catalysts resulting from the co-presence of kraft paper and PE in TPs, suggesting the hydrogen sufficiency of TPs. Compared to TP-1, TP-2 produced a larger amount of aromatic hydrocarbons because of its larger PE content. Among the three catalysts, HZSM-5(30) yielded the largest amount of aromatic hydrocarbons followed by HBeta(38) and Al-MCM-41(20) because of the strong acidity and suitable pore structure of HZSM-5(30). Compared to HBeta(38), HZSM-5(30) also exhibited a longer lifetime during the sequential catalytic pyrolysis of TPs, suggesting the stable catalytic activity of HZSM-5(30).

Supplementary Materials

The following are available online at https://www.mdpi.com/2073-4344/10/6/602/s1, Table S1: Proximate analysis results of SPE, SKP, and SAF; Table S2: NH3-TPD results over acidic catalysts; Table S3: Tmax values (°C) of first and second decomposition stages of SKP/SPE and SKP/SPE/SAF; Table S4: Tmax values (°C) of each weight loss stage on the thermal and catalytic DTG curves of TP-1 and TP-2; Table S5. GC/MS peak areas for the compounds obtained from the non-catalytic TMR-GC/MS analysis of SKP, SPE, and their mixture extracted from TP-1; Table S6. GC/MS peak areas for the compounds obtained from the non-catalytic TMR-GC/MS analysis of SKP, SPE, and their mixture extracted from TP-2; Table S7. GC/MS peak areas for the compounds obtained from the catalytic pyrolysis of TP-1 and TP-2 over acidic catalysts; Table S8: TMR-GC/MS conditions applied in this study; Figure S1: NH3-TPD curves of HZSM-5(30), HBeta(38), and Al-MCM-41(20) used in this study; Figure S2: DTG curves of SKP/SPE mixtures (a) without SAF and (b) with SAF obtained from their TG analysis at 10 °C/min; Figure S3: TICs obtained from non-catalytic TMR-GC/MS analysis of SKP, SPE, and their mixture extracted from TP-1 at 650 °C; Figure S4: TICs obtained from non-catalytic TMR-GC/MS analysis of SKP, SPE, and their mixture extracted from TP-2 at 650 °C; Figure S5: TIC obtained from the catalytic pyrolysis of TP-1 and TP-2 over different catalysts at 650 °C; Figure S6: SAF, SKP, and SPE separated from TP-1 by solvent separation; Figure S7: SAF, SKP, and SPE separated from TP-2 by solvent separation.

Author Contributions

Conceptualization, M.Z.S. and T.U.H.; Data curation, M.Z.S. and T.U.H.; Formal analysis, M.Z.S.; Investigation, T.U.H.; Methodology, Y.-K.P.; Supervision, S.K.; Validation, Y.-K.P., S.K., and Y.-M.K.; Visualization, M.Z.S. and T.U.H; Writing—original draft preparation, M.Z.S. and T.U.H.; Writing—review and editing, S.K. and Y.-M.K. All authors have read and agreed to the published version of the manuscript.

Funding

This research was supported by the Hallym University Research Fund (HRF-201904-009).

Conflicts of Interest

The authors declare no conflict of interest.

References

  1. Da Cruz, N.F.; Ferreira, S.; Cabral, M.; Simoes, P.; Marques, R.C. Packaging waste recycling in Europe: Is the industry paying for it? Waste Manag. 2014, 34, 298–308. [Google Scholar] [CrossRef] [PubMed] [Green Version]
  2. Liu, Z.; Adams, M.; Walker, T.R. Are exports of recyclables from developed to developing countries waste pollution transfer or part of the global circular economy? Resour. Conserv. Recycl. 2018, 136, 22–23. [Google Scholar] [CrossRef]
  3. Baggio, P.; Baratieri, M.; Gasparella, A.; Longo, G.A. Energy and environmental analysis of an innovative system based on municipal solid waste (MSW) pyrolysis and combined cycle. Appl. Thermal Eng. 2008, 28, 136–144. [Google Scholar] [CrossRef] [Green Version]
  4. Velghe, I.; Carleer, R.; Yperman, J.; Schreurs, S. Study of the pyrolysis of municipal solid waste for the production of valuable products. J. Anal. Appl. Pyrolysis 2011, 92, 366–375. [Google Scholar] [CrossRef]
  5. Kim, S.; Ko, D.; Mun, J.; Kim, T.H.; Kim, J. Techno-economic evaluation of gas separation processes for long-term operation of CO2 injected enhanced coalbed methane (ECBM). Korean J. Chem. Eng. 2018, 35, 941–955. [Google Scholar] [CrossRef]
  6. Matsakas, L.; Gao, Q.; Jansson, S.; Rova, U.; Christakopoulos, P. Green conversion of municipal solid wastes into fuels and chemicals. Electron. J. Biotechnol. 2017, 26, 69–83. [Google Scholar] [CrossRef]
  7. Al-Salem, S.M.; Lettieri, P.; Baeyens, J. Recycling and recovery routes of plastic solid waste (PSW): A review. Waste Manag. 2009, 29, 2625–2643. [Google Scholar] [CrossRef]
  8. Cepeliogullar, O.; Putun, A.E. Thermal and kinetic behaviors of biomass and plastic wastes in co-pyrolysis. Energy Convers. Manag. 2013, 75, 263–270. [Google Scholar] [CrossRef]
  9. Ozsin, G.; Putun, A.E. Co-pyrolytic behaviors of biomass and polystyrene: Kinetics, thermodynamics and evolved gas analysis. Korean J. Chem. Eng. 2018, 35, 428–437. [Google Scholar] [CrossRef]
  10. Europe, P. An Analysis of European Plastics Production, Demand and Waste Data. Plast. Fact 2018. [Google Scholar]
  11. Korkmaz, A.; Yanik, J.; Brebu, M.; Vasile, C. Pyrolysis of the tetra pak. Waste Manag. 2009, 29, 2836–2841. [Google Scholar] [CrossRef] [PubMed]
  12. Fan, F.J.; Ping, Z.P.; Shi, F.X. Discussion on recovery and reuse of Tetra pak package. J. Agr. Eng. Res. 2007, 79, 221–223. [Google Scholar]
  13. Xie, M.H.; Li, L.; Huang, Z.C.; Zhu, X.M.; Zhang, J.F.; Sun, T.C. Life cycle assessment of environ mental impacts of Al-PE-Pa laminated packaging and waste treatments. Res. Environ. Sci. 2009, 22, 1299–1304. [Google Scholar]
  14. Bertoluci, G.; Leroy, Y.; Olsson, A. Exploring the environmental impacts of olive packaging solutions for the European food market. J. Clean. Prod. 2014, 64, 234–243. [Google Scholar] [CrossRef]
  15. Kaiser, K.; Schmid, M.; Schlummer, M. Recycling of polymer-based multilayer packaging: A review. Recycling 2018, 3, 1. [Google Scholar] [CrossRef] [Green Version]
  16. Gente, V.; Marca, F.L.; Lucci, F.; Massacci, P. Electrical separation of plastics coming from special waste. Waste Manag. 2003, 23, 951–958. [Google Scholar] [CrossRef]
  17. Lopes, C.M.A.; Felisberti, M.I. Composite of low-density polyethylene and aluminum obtained from the recycling of postconsumer aseptic packaging. J. Appl. Polym. Sci. 2006, 101, 3183–3191. [Google Scholar] [CrossRef]
  18. Zhang, J.; Yan, D.; Li, L.; Yang, Z.; Li, Z. Research on the effect of separation reagent concentration and reaction temperature on Al-PE wet separation technics. Chin. J. Environ. Eng. 2010, 4, 665–670. [Google Scholar]
  19. Kulkarni, A.K.; Daneshvarhosseini, S.; Yoshida, H. Effective recovery of pure aluminum from waste composite laminates by sub- and super-critical water. J. Supercrit. Fluids 2011, 55, 992–997. [Google Scholar] [CrossRef]
  20. Zhang, S.F.; Mei, X.X.; Zhang, L.L. Research progress of separations technology of aluminum-plastic in aseptic composite packaging. China Pulp Pap. 2012, 31, 65–68. [Google Scholar]
  21. Yan, D.; Peng, Z.; Liu, Y.; Li, L.; Huang, Q.; Xie, M.; Wang, Q. Optimizing and developing a continuous separation system for the wet process separation of aluminum and polyethylene in aseptic composite packaging waste. Waste Manag. 2015, 35, 21–28. [Google Scholar] [CrossRef] [PubMed]
  22. Johansson, H.; Ackermann, P.W. Method of Recovering Individual Component Parts from Packaging Material Waste. U.S. Patent 5421526 A, 6 June 1995. [Google Scholar]
  23. Zhang, S.F.; Zhang, L.L.; Luo, K.; Sun, Z.X.; Mei, X.X. Separation properties of aluminium-plastic laminates in post-consumer Tetra Pak with mixed organic solvent. Waste Manag. Res. 2014, 32, 317–322. [Google Scholar] [CrossRef] [PubMed]
  24. Wu, C.H.; Chang, H.S. Pyrolysis of tetra pack in municipal solid waste. J. Chem. Technol. Biotechnol. 2001, 76, 779–792. [Google Scholar]
  25. Ebadi, M.; Farsi, M.; Narchin, P.; Madhoushi, M. The effect of beverage storage packets (Tetra PakTM) waste on mechanical properties of wood-plastic composites. J. Thermoplast. Compos. Mater. 2016, 29, 1601–1610. [Google Scholar] [CrossRef]
  26. Lokahita, B.; Aziz, M.; Yoshikawa, K.; Takahashi, F. Energy and resource recovery from Tetra Pak waste using hydrothermal treatment. Appl. Energy 2017, 207, 107–113. [Google Scholar] [CrossRef] [Green Version]
  27. Kumar, S.; Singh, R.K. Recovery of hydrocarbon liquid from waste high density polyethylene by thermal pyrolysis. Braz. J. Chem. Eng. 2011, 28, 659–667. [Google Scholar] [CrossRef] [Green Version]
  28. Kumar, S.; Singh, R.K. Thermolysis of high-density polyethylene to petroleum products. J. Petrol. Eng. 2013, 1–7. [Google Scholar] [CrossRef] [Green Version]
  29. Miandad, R.; Barakat, M.A.; Aburiazaiza, A.S.; Rehan, M.; Ismail, I.M.I.; Nizami, A.S. Effect of plastic waste types on pyrolysis liquid oil. Int. Biodeterior. Biodegrad. 2017, 119, 239–252. [Google Scholar] [CrossRef]
  30. Braz, C.E.M.; Crnkovic, P.C.G.M. Physical-Chemical characterization of biomass samples for application in pyrolysis process. Chem. Eng. Trans. 2014, 37, 523–528. [Google Scholar]
  31. Viana, H.F.S.; Rodrigues, A.M.; Godina, R.; Matias, J.C.O.; Nunes, L.J.R. Evaluation of the physical, chemical and thermal properties of Portuguese maritime pine biomass. Sustainability 2018, 10, 2877. [Google Scholar] [CrossRef] [Green Version]
  32. Kim, B.S.; Kim, Y.M.; Jae, J.; Watanabe, C.; Kim, S.; Jung, S.C.; Park, Y.K. Pyrolysis and catalytic upgrading of Citrus unshiu peel. Bioresour. Technol. 2015, 194, 312–319. [Google Scholar] [CrossRef] [PubMed]
  33. Pyra, K.; Tarach, K.A.; Janiszewska, E.; Majda, D.; Góra-Marek, K. Evaluation of the textural parameters of zeolite beta in LDPE catalytic degradation: Thermogravimetric analysis coupled with FTIR operando studies. Molecules 2020, 25, 916. [Google Scholar] [CrossRef] [PubMed] [Green Version]
  34. Krans, N.A.; Weber, J.L.; van den Bosch, W.; Zecević, J.; de Jongh, P.E.; de Jong, K.P. Influence of promotion on the growth of anchored colloidal iron oxide nanoparticles during synthesis gas conversion. ACS Catal. 2020, 10, 1913–1922. [Google Scholar] [CrossRef] [PubMed]
  35. Yao, C.; Tian, H.; Hu, Z.; Yin, Y.; Chen, D.; Yan, X. Characteristics and kinetics analyses of different genus biomass pyrolysis. Korean J. Chem. Eng. 2018, 35, 511–517. [Google Scholar] [CrossRef]
  36. Xu, F.; Zhong, L.; Xu, Y.; Feng, S.; Zhang, C.; Zhang, F.; Zhang, G. Highly efficient flame-retardant kraft paper. J. Mater. Sci. 2019, 54, 1884–1897. [Google Scholar] [CrossRef]
  37. Kim, Y.M.; Jae, J.; Kim, B.S.; Hong, Y.; Jung, S.C.; Park, Y.K. Catalytic co-pyrolysis of torrefied yellow poplar and high-density polyethylene using microporous HZSM-5 and mesoporous Al-MCM-41 catalysts. Energy Convers. Manag. 2017, 149, 966–973. [Google Scholar] [CrossRef]
  38. Yuan, H.; Fan, H.; Shan, R.; He, M.; Gu, J.; Chen, Y. Study of synergistic effects during co-pyrolysis of cellulose and high-density polyethylene at various ratios. Energy Convers. Manag. 2018, 157, 517–526. [Google Scholar] [CrossRef]
  39. Haydary, J.; Susa, D.; Dudas, J. Pyrolysis of aseptic packages (tetrapak) in a laboratory screw type reactor and secondary thermal/catalytic tar decomposition. Waste Manag. 2013, 33, 1136–1141. [Google Scholar] [CrossRef]
  40. Grieco, E.M.; Baldi, G. Pyrolysis of polyethylene mixed with paper and wood: Interaction effects on tar, char and gas yields. Waste Manag. 2012, 32, 833–839. [Google Scholar]
  41. Zhou, Z.; Chen, X.; Wang, Y.; Liu, C.; Ma, H.; Zhou, C.; Qi, F.; Yang, J. Online photoionization mass spectrometric evaluation of catalytic co-pyrolysis of cellulose and polyethylene over HZSM-5. Bioresour. Technol. 2019, 275, 130–137. [Google Scholar] [CrossRef]
  42. Park, Y.K.; Siddiqui, M.Z.; Kang, Y.; Watanabe, A.; Lee, H.W.; Jeong, S.J.; Kim, S.; Kim, Y.M. Increased aromatics formation by the use of high-density polyethylene on the catalytic pyrolysis of mandarin peel over HY and HZSM-5. Catalysts 2018, 8, 656. [Google Scholar] [CrossRef] [Green Version]
  43. Park, Y.K.; Jung, J.; Ryu, S.; Lee, H.W.; Siddiqui, M.Z.; Jae, J.; Watanabe, A.; Kim, Y.M. Catalytic co-pyrolysis of yellow poplar wood and polyethylene terephthalate over two stage calcium oxide-ZSM-5. Appl. Energy 2019, 250, 1706–1718. [Google Scholar]
  44. Auxilio, A.R.; Choo, W.L.; Kohli, I.; Srivatsa, S.H.; Bhattacharya, S. An experimental study on thermo-catalytic pyrolysis of plastic waste using a continuous pyrolyser. Waste Manag. 2017, 67, 143–154. [Google Scholar] [CrossRef] [PubMed]
  45. Du, Z.; Ma, X.; Li, Y.; Chen, P.; Liu, Y.; Lin, X.; Lei, H.; Ruan, R. Production of aromatic hydrocarbons by catalytic pyrolysis of microalgae with zeolites: Catalyst screening in a pyroprobe. Bioresour. Technol. 2013, 139, 397–401. [Google Scholar] [CrossRef]
  46. Marcilla, A.; Gomez-Siurana, A.; Valdes, F. Catalytic pyrolysis of LDPE over H-beta and HZSM-5 zeolites in dynamic conditions. Study of the evolution of the process. J. Anal. Appl. Pyrolysis 2007, 79, 433–442. [Google Scholar] [CrossRef]
  47. Cardona, S.C.; Corma, A. Tertiary recycling of polypropylene by catalytic cracking in a semibatch stirred reactor: Use of spent equilibrium FCC commercial catalyst. Appl. Catal. B Environ. 2000, 25, 151–162. [Google Scholar] [CrossRef]
  48. Park, Y.K.; Jung, J.S.; Jae, J.; Hong, S.B.; Watanabe, A.; Kim, Y.M. Catalytic fast pyrolysis of wood plastic composite over microporous zeolites. Chem. Eng. J. 2019, 377, 119742. [Google Scholar] [CrossRef]
  49. Zhang, L.; Li, S.; Ding, H.; Zhu, X. Two-step pyrolysis of corncob for value-added chemicals and high-quality bio-oil: Effects of alkali and alkaline earth metals. Waste Manag. 2019, 87, 709–718. [Google Scholar] [CrossRef]
  50. Hujuri, U.; Ghoshal, A.K.; Gumma, S. Temperature-dependent pyrolytic product evolution profile for low-density polyethylene from gas chromatographic study. Waste Manag. 2010, 30, 814–820. [Google Scholar] [CrossRef]
  51. Gracida-Alvarez, U.R.; Mitchell, M.K.; Sacramento-Rivero, J.C.; Shonnard, D.R. Effect of temperature and vapor residence time on the micropyrolysis products of waste high density polyethylene. Ind. Eng. Chem. Res. 2018, 57, 1912–1923. [Google Scholar] [CrossRef]
  52. Fukushima, M.; Shioya, M.; Wakai, K.; Ibe, H. Toward maximizing the recycling rate in a Sapporo waste plastics liquefaction plant. J. Mater. Cycles Waste Manag. 2009, 11, 11–18. [Google Scholar] [CrossRef]
  53. Mastral, F.J.; Esperanza, E.; Garcia, P.; Juste, M. Pyrolysis of high-density polyethylene in a fluidised bed reactor. Influence of the temperature and residence time. J. Anal. Appl. Pyrolysis 2002, 63, 1–15. [Google Scholar] [CrossRef]
  54. Xue, Y.; Kelkar, A.; Bai, X. Catalytic co-pyrolysis of biomass and polyethylene in a tandem micropyrolyzer. Fuel 2016, 166, 227–236. [Google Scholar] [CrossRef]
  55. Jae, J.; Tompsett, G.A.; Foster, A.J.; Hammond, K.D.; Auerbach, S.M.; Lobo, R.F.; Huber, G.W. Investigation into the shape selectivity of zeolite catalysts for biomass conversion. J. Catal. 2011, 279, 257–268. [Google Scholar] [CrossRef]
  56. Chang, Y.T.; Huber, G.W. Chemistry of furan conversion into aromatics and olefins over HZSM-5: A model biomass conversion reaction. ACS Catal. 2011, 1, 611–628. [Google Scholar] [CrossRef] [Green Version]
  57. Zhang, L.; Bao, Z.; Xia, S.; Lu, Q.; Walters, K.B. Catalytic pyrolysis of biomass and polymer wastes. Catalysts 2018, 8, 659. [Google Scholar] [CrossRef] [Green Version]
  58. Wang, K.; Johnston, P.A.; Brown, R.C. Comparison of in-situ and ex-situ catalytic pyrolysis in a micro-reactor system. Bioresour. Technol. 2014, 173, 124–131. [Google Scholar] [CrossRef]
  59. Gamliel, D.P.; Du, S.; Bollas, G.M.; Valla, J.A. Investigation of in situ and ex situ catalytic pyrolysis of miscanthus × giganteus using a PyGC-MS microsystem and comparison with a bench-scale spouted-bed reactor. Bioresour. Technol. 2015, 191, 187–196. [Google Scholar] [CrossRef] [Green Version]
  60. Kim, Y.M.; Lee, H.W.; Lee, S.-H.; Kim, S.-S.; Park, S.H.; Jeon, J.-K.; Kim, S.; Park, Y.-K. Pyrolysis properties and kinetics of mandarin peel. Korean J. Chem. Eng. 2011, 28, 2012–2016. [Google Scholar] [CrossRef]
  61. Kim, Y.M.; Kim, S.; Han, T.U.; Park, Y.-K.; Watanabe, C. Pyrolysis reaction characteristics of Korean pine (Pinus koraiensis) nut shell. J. Anal. Appl. Pyrolysis 2014, 110, 435–441. [Google Scholar] [CrossRef]
  62. Ryoo, R.; Kim, J.M. Structural order in MCM-41 controlled by shifting silicate polymerization equilibrium. J. Chem. Soc. Chem. Commun. 1995, 711–712. [Google Scholar] [CrossRef]
Figure 1. (a) TG and (b) derivative TG (DTG) curves of TPs obtained from their non-isothermal pyrolysis at a heating rate of 10 °C/min.
Catalysts 10 00602 g001
Figure 2. DTG curves of (a) TP-1 and (b) TP-2 obtained from their thermal and catalytic pyrolysis at 10 °C/min.
Catalysts 10 00602 g002
Figure 3. TICs obtained from non-catalytic Py-GC/MS analysis of (a) TP-1 and (b) TP-2 at 650 °C.
Catalysts 10 00602 g003
Figure 4. GC/MS peak areas (Count × 10−6) of aromatic hydrocarbons obtained from the thermal and catalytic co-pyrolysis of SKP and SPE from (a) TP-1 and (b) TP-2 over HZSM-5(30), HBeta(38), and Al-MCM-41(20). BTEXs: benzene, toluene, ethylbenzene, xylenes; OMAHs: other mono-aromatic hydrocarbons; TAHs: Total aromatic hydrocarbons.
Catalysts 10 00602 g004
Figure 5. Experimental and calculated GC/MS areas (count × 10-6) of total aromatic hydrocarbons obtained from the catalytic co-pyrolysis of SKP and SPE of TP-1 and TP-2 over HZSM-5(30), HBeta(38), and Al-MCM-41(20). TP-1 over (a) HZSM-5(30), (b) HBeta(38), and (c) Al-MCM-41(20); and TP-2 over (d) HZSM-5(30), (e) HBeta(38), and (f) Al-MCM-41(20). The calculated values were estimated by the experimental values of each product obtained from the individual catalytic pyrolysis of SKP and SPE separated from TP-1 and TP-2 according to the equation: Calculated value = (Experimental value of SKP + Experimental value of SPE)/2.
Catalysts 10 00602 g005
Figure 6. Comparison of GC/MS areas (count × 10−6) for total aromatic hydrocarbons (TAHs) obtained from the five times sequential catalytic pyrolysis reactions of TP-2 over (a) HZSM-5(30) and (b) HBeta(38).
Catalysts 10 00602 g006
Figure 7. Comparison of GC/MS areas (count × 10-6) for total aromatic hydrocarbons (TAHs) obtained from the catalytic pyrolysis of (a) TP-1 and (b) TP-2 at 650 °C.
Catalysts 10 00602 g007
Table 1. Proximate, ultimate, and HHV analysis results of TP-1 and TP-2.
SampleTP-1TP-2
Proximate
Analysis
(wt. %) a
Water1.11.5
Volatiles80.780.3
Fixed carbon8.17.2
Ash10.111.0
Sum100.0100.0
Ultimate
Analysis
(wt. %) a
C45.647.6
H7.07.3
O b47.345.0
N0.10.1
S0.00.0
Sum100.0100.0
HHV (kcal/kg)37593712
a On a dry basis, b By difference.

