Article

Morphological and Optical Properties of Cobalt Ion-Modified ZnO Nanowires

1
Department of Process Development, LG Electronics, Gumi, Gyeongsangbuk-do 3938, Korea
2
School of Advanced Materials Science and Chemical Engineering, Daegu Catholic University, Gyeongsan, Gyeongsangbuk-do 38430, Korea
3
Department of Physics, Kyungpook National University, Daegu 41566, Korea
*
Authors to whom correspondence should be addressed.
Catalysts 2020, 10(6), 614; https://doi.org/10.3390/catal10060614
Submission received: 28 April 2020 / Revised: 21 May 2020 / Accepted: 27 May 2020 / Published: 1 June 2020
(This article belongs to the Special Issue Nanotechnology in Catalysis)

Abstract

:
In this study, we prepared cobalt (Co) ion-modified ZnO nanowires using hydrothermal synthesis with zinc acetate dehydrate and Co (II) acetate hydrate precursors in ethanol solutions. Their morphological and optical properties were investigated with varying Co precursor concentration. The morphological changes of the ZnO nanowires depended positively on the concentration of the Co precursor. The ZnO nanowires showed modified crystal orientations and nanostructure shapes depending on the Co concentration in the solutions. Variations in the optical properties of the Co ion-modified ZnO nanowires could be explained by the interaction of the Co ions with the band electrons, oxygen vacancies, and zinc interstitials. The overall growth and characteristics of ZnO nanowires synthesized in solutions containing low levels of Co ions were related to Co doping into the ZnO bulks. In solutions containing high levels of Co ions, these were additionally related to the Co oxide cluster.

1. Introduction

Many research groups have studied the wide band-gap semiconductors of zinc oxide (ZnO) doped with a transition metal such as Co, Cu, Fe, or Ni [1,2,3,4]. Among these materials, Co-doped ZnO is one of the most interesting due to its high redox potential and because of its photosensitivity being applicable in photocatalysts [5,6,7]. For enhancing photocatalytic efficiency, ZnO modifications are investigated [8].
Recently, intensive studies were conducted to fabricate and determine the characteristics of Co-doped ZnO nanomaterials such as nanoparticles [9], nanorods [10], and nanowires [11]. Various methods can be used for the fabrication of Co-doped ZnO nanostructures, including chemical-vapor deposition [12], thermal evaporation [13], coprecipitation [14], the hydrothermal procedure [15], the sol–gel process [16], and electrodeposition [17]. The hydrothermal method has been widely used because of its low cost and simple operation. Hydrothermal synthesis also proved to be useful for the fabrication of one-dimensional ZnO nanostructures such as nanorods and nanowires [18].
It was suggested that the addition of dopants or impurities in the synthesis of semiconductor nanomaterials changes their growth and shape, resulting in the possibility of controlling the morphology of nanomaterials [19]. For Co-doped ZnO nanorods fabricated using a hydrothermal method, C. Zou et al. [20] reported that Co doping up to 3.1 at % did not result in obvious changes on the morphology of ZnO nanorods. However, beyond the limit of solubility of Co in ZnO, X. He et al. [21] observed that the addition of Co2+ within the 10 mol % range resulted in a large variation in the morphology of ZnO nanorod arrays grown by hydrothermal synthesis. Nevertheless, to our best knowledge, few studies have been conducted on the optical properties of ZnO nanowires containing high Co content in relation to structural properties. Because the morphological and optical properties of Co-modified ZnO nanomaterials are important for their practical application to a photocatalyst, a detailed investigation on the influences of Co ion modification in ZnO nanowires over the range of Co solubility limit is needed. Furthermore, it can be expected that Co ion modification can offer tunability in the surface, morphological, and optical properties of Co ion-modified ZnO nanowires.
In this work, Co ion-modified ZnO nanowires were prepared by hydrothermal synthesis, and their morphological, structural, and optical properties were investigated with respect to the concentration of Co precursor.

2. Results and Discussion

Figure 1 shows field-emission scanning-electron-microscope (FE-SEM) images of ZnO nanowires grown with varying concentrations of the Co precursor in the solution. In Figure 1a, ZnO nanowires grown in the solution without Co ions exhibited a strongly preferred orientation with respect to the c plane. ZnO nanowires synthesized within 3 and 6 at % Co precursor-containing solution linked slightly with other nanowires to form the bundled ZnO nanowires, as shown in Figure 1b,c. These results suggested that the top surfaces of vertically aligned ZnO nanowires can be either positively or negatively charged in solutions containing the Co precursor, and electrostatic interactions among these local charges cause the bending and bundling of the ZnO nanorods [22]. ZnO nanowires synthesized within 9 and 12 at % of the Co precursor-containing solutions have largely bundled shapes compared to that of the other samples. These facts indicate that the Co precursor can modify the morphology of the ZnO nanowires. Changes in the morphology of the ZnO nanowires caused by the Co precursor can be explained by the variation of the surface energy of the host material during growth due to the adsorption of the impurity [23]. It can be inferred that impurity incorporation gives rise to variations in the surface energy of the ZnO nanowire, causing modifications in the adsorption and reactivity of the atoms on the surfaces. Accordingly, because the adsorption energies of atoms depend on the condition of the surface to which the atoms are adsorbing, growth rates are changed on the compositions of the surface during growth, resulting in the irregular growth of ZnO nanowires. From energy-dispersive X-ray spectroscopy (EDS) data as shown in Figure 1f, it was confirmed that ZnO nanowires synthesized at a high concentration level (i.e., 12 at %) of the Co precursor contained the Co element. Therefore, Co ions in the growth of the ZnO nanowire can control their morphology, originating from surface modifications during growth.
Figure 2 shows X-ray diffraction (XRD) patterns of ZnO nanowires grown with varying Co precursors in the solution. All XRD patterns indicated diffraction peaks of the (100), (002), and (101) planes, which was consistent with the hexagonal wurtzite structure of ZnO. No other secondary phases corresponding to metallic cobalt, cobalt oxides, or zinc cobalt phases were observed despite the existence of the Co element, as revealed in Figure 1f. There were also no cluster-associated peaks under the detection limit of the XRD measurement. This fact indicates that the Co precursor added to the solutions seldom affected the crystal structure of the ZnO nanowires. All samples showed preferentially oriented structures with respect to the c plane, even if there was a difference in the peak intensities. Diffraction peaks of the (100), (002), and (101) planes shifted to a lower 2theta, depending on Co concentrations. By using Bragg’s law and the data obtained in the insets of Figure 2, the interplanar spacing of the (002) crystal planes was estimated. Bragg’s law can be represented by
2 d sin(theta) = n λ,
where n, λ, d, and theta are the order, X-ray wavelength, the interplanar distance of crystal plane, and diffraction angle, respectively. Here, n was 2 for (002) crystal plane, λ was 1.5406 Å in Cu–Kα radiation, and theta was the half of diffraction 2theta measured by XRD method. This was obvious because the 2theta-theta measurement method is used for the same angle of incidence and diffraction. As indicated in Table 1, the interplanar spacing of the (002) crystal planes increased with increasing concentrations of the Co precursor. These observations implied that the addition of the Co precursor to the solution seemed to yield an increase in the lattice constant of the ZnO nanowires. Although the ionic radius of Co was similar to Zn (Zn2+ ≈ 0.60 Å, Co2+ ≈ 0.56 Å) [24], the increase in the lattice constant of the ZnO nanowires showed that Co ions can be incorporated as the substitutional and interstitial atoms in a ZnO matrix, which was in a good agreement with those reported studies [21,25]. Table 1 lists the structural characteristics of the ZnO nanowires synthesized in Co precursor-containing solutions. Denominations A through E show ZnO nanowires fabricated under different Co concentration conditions. The interplanar spacing of the ZnO (002) crystal planes of the nanowires increased in the following order: A, B, C, D, and E. This probably originated from an enhanced lattice constant caused by the Co doping into the ZnO nanowires. The omega full width at half maximum (FWHM) of the ZnO (002) crystal plane for the ZnO nanowires increased in the order of A, B, C, D, and E. The degree of angular misorientation among the nanowires can be characterized by the (002) rocking curve [26]. Therefore, this result demonstrated that the misorientation of the (002) crystal plane of the ZnO nanowires increased as the concentration of Co precursor increased. This indicated that a larger misorientation of the (002) crystal plane of the ZnO nanowires produced more defects on or into the nanowires. On the basis of FE-SEM and XRD results, larger Co ions added to the solution led to more modification with misorientation during the synthesis of the ZnO nanowires.
Figure 3 shows transmission electron microscopy (TEM) and high-resolution transmission electron microscopy (HR-TEM) images of the ZnO nanowires modified with the Co ion. We selected Samples A and E for ease of analysis. In addition, the selected-area electron-diffraction (SAED) pattern inserted in Figure 3 and the EDS spectra of the ZnO nanowires were measured to investigate the lattice constants and elements contained in the nanowires, respectively. From the TEM and HR-TEM images, we observed the nanowire-type ZnO images in both Samples A and E, and found that compared to Sample A, Sample E had a slightly larger lattice constant of the (0001) plane caused by the Co ion modification. From the SAED patterns, we observed that the ZnO nanowire had the typical single-crystal nature of hexagonal ZnO, and found that Sample E exhibited poorer distribution due to the Co ion modification when compared to Sample A. The EDS spectra demonstrated that the Co element was only observed in Sample E. Considering that the structure of the ZnO nanowire was hexagonal, the relationship between lattice parameter and interplanar spacing was given by
1/d2 = 4/3((h2+hk+k2)/a2) + (l2/c2),
where (h, k, l) are Miller indices, a and c are the lattice parameters, and d is interplanar spacing [27]. For the (002) crystal plane, substituting h = 0, k = 0, l = 2 in the above equation, the final relation is d(002) = c/2. We confirmed the final relation with lattice parameter c from HR-TEM and d(002) from XRD as follows. In the case of Sample A, d(002) was 2.5586 Å and c was 5.117 Å; in the case of Sample E, d(002) was 2.569 Å and c was 5.138 Å.
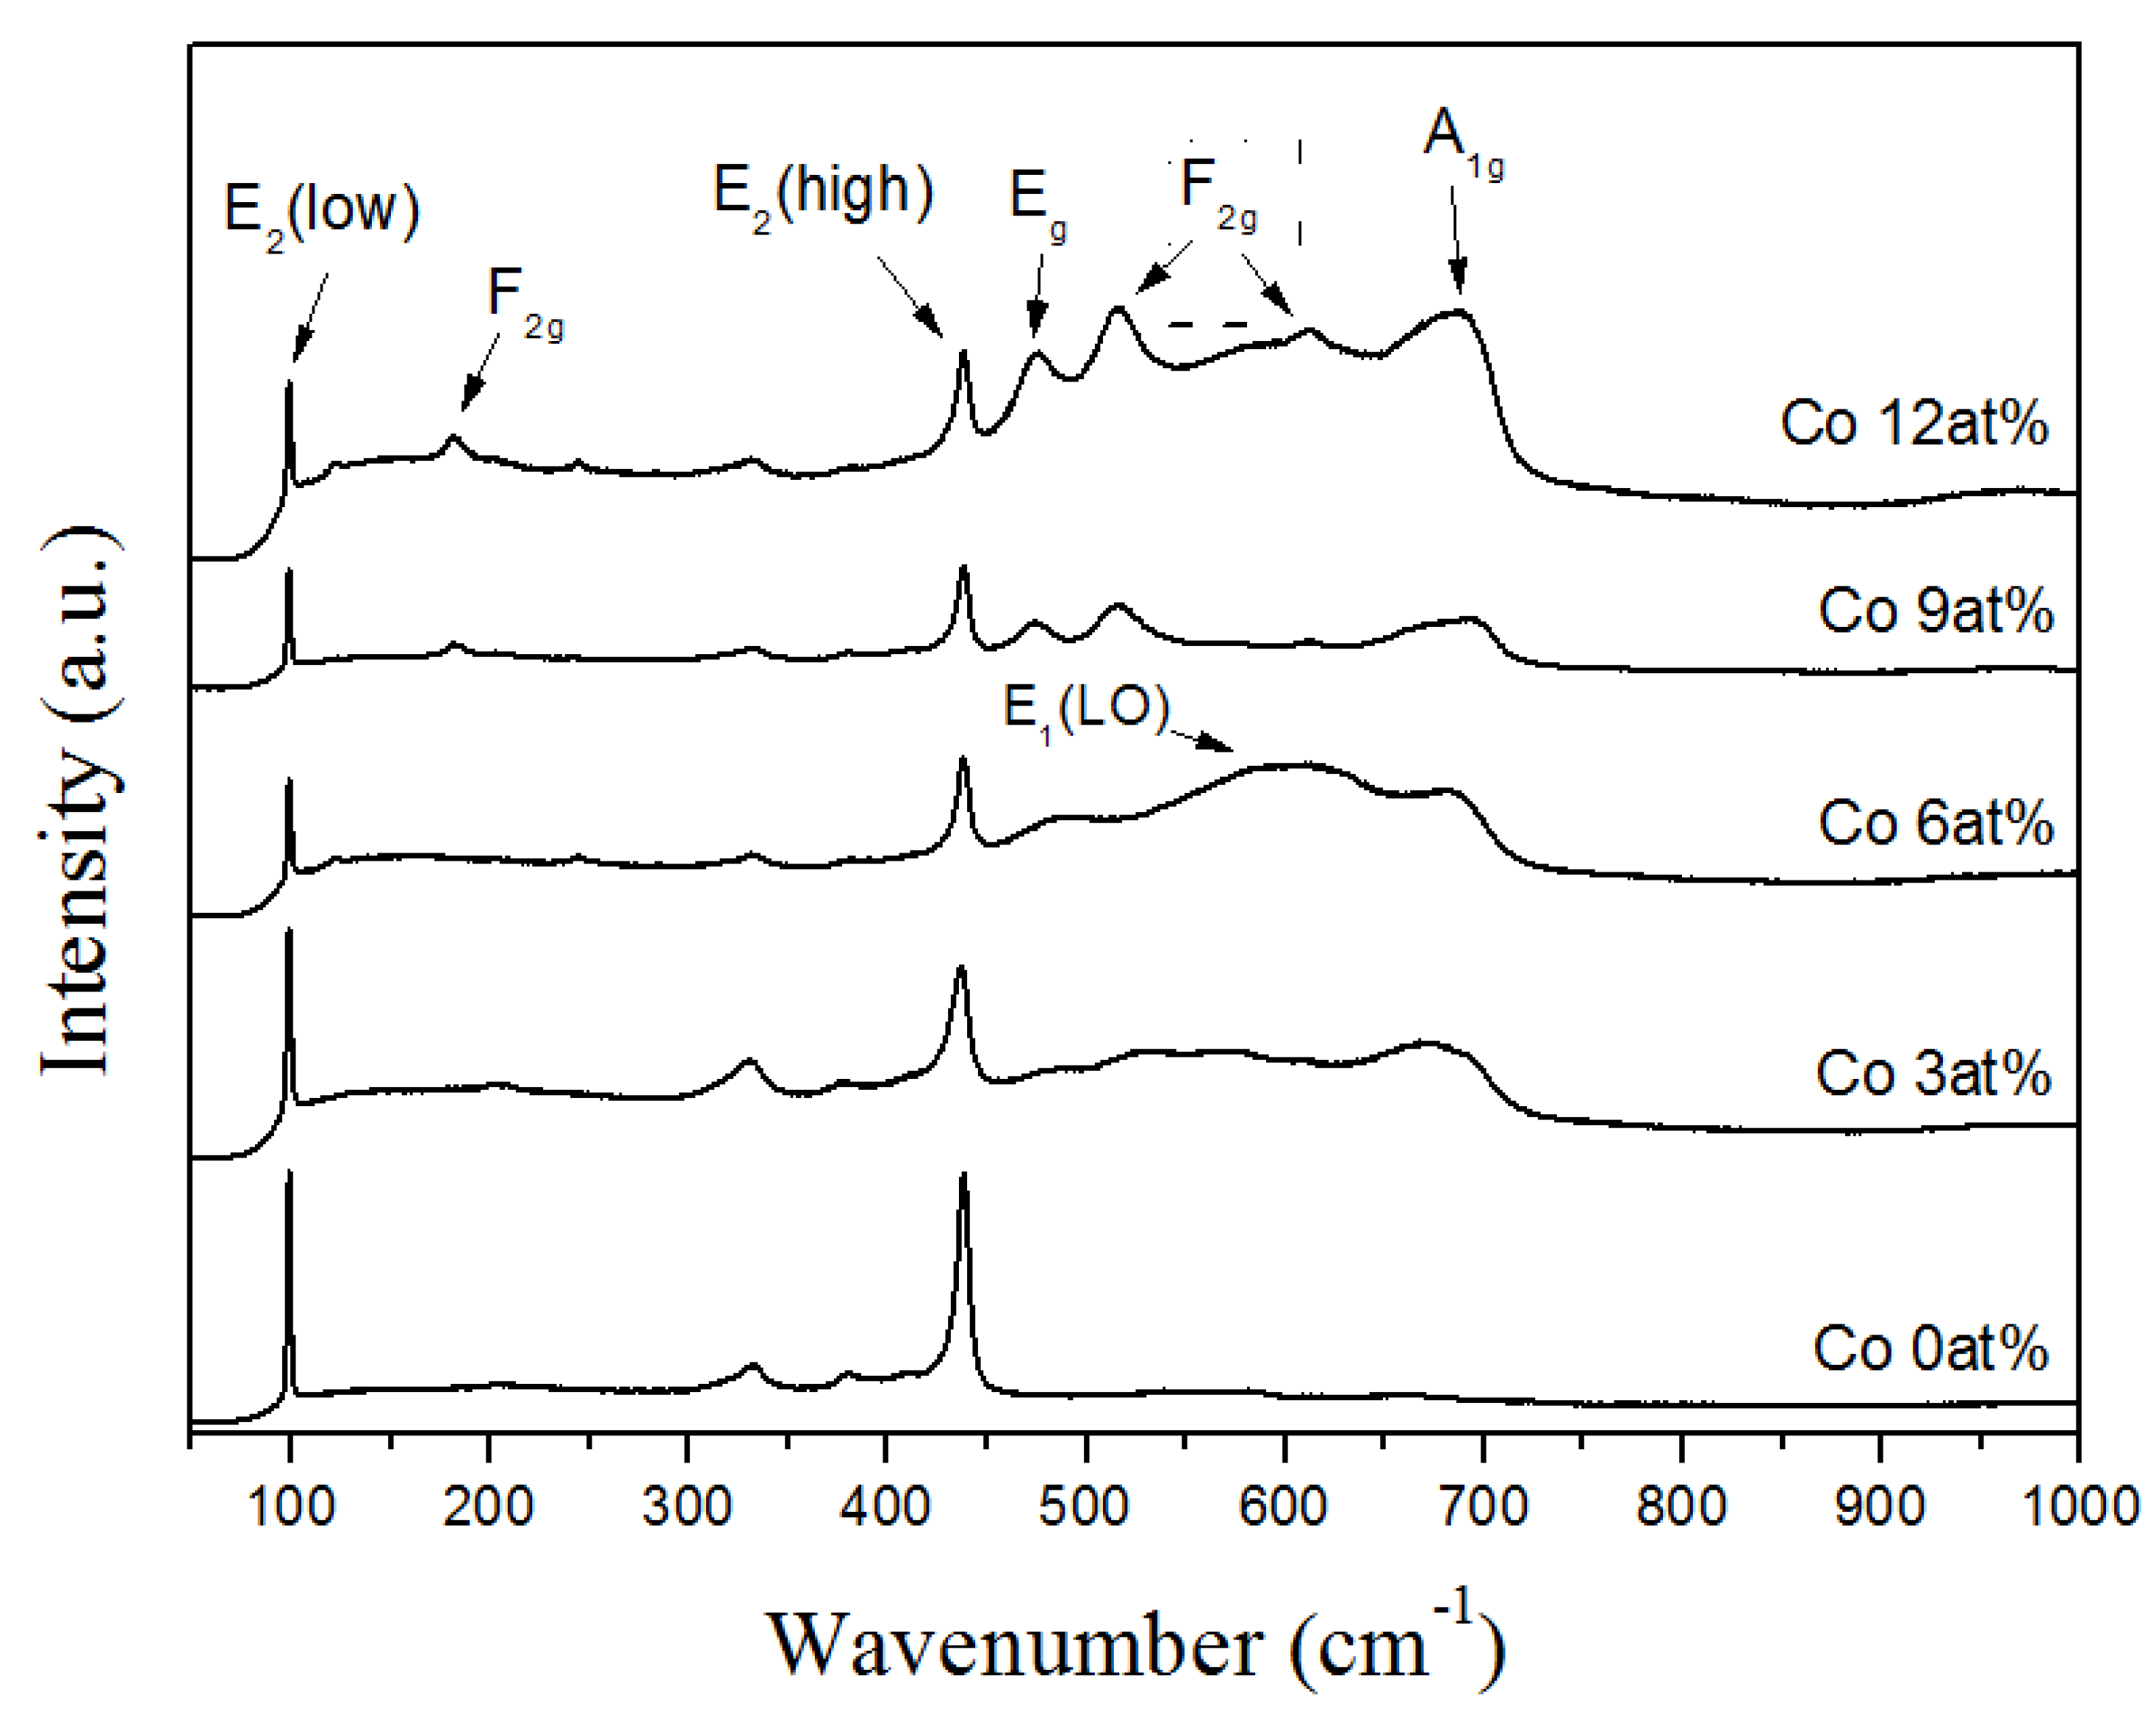
Figure 4 shows the Raman spectra of ZnO nanowires synthesized with varying Co precursor concentrations in the solution in the range of 50 to 1000 cm−1. As shown in Figure 4, two nonpolar Raman active modes designated as E2 (low) and E2 (high) were related with the motions of zinc (Zn) sublattice and oxygen (O) atoms, respectively [28]. Peaks corresponding to A1g, Eg, and three F2g were other Raman active modes [29]. For the nonmodified ZnO nanowires, the sharpest and strongest peaks, E2 (low) and E2 (high), appeared at ~98.8 and ~437.4 cm−1, consistent with the strongest modes in the wurtzite crystal structure of ZnO. In all Co ion-modified ZnO nanowires, the peak positions corresponding to the E2 (high) and E2 (low) modes were very similar to those of the nonmodified ones, representing that any expected shift in the lattice constant would be beyond the resolution of our Raman spectrometer. The broad peak that appeared at ~580 cm−1 corresponded to the E1 (LO) mode originating from the defects of zinc interstitials and oxygen vacancies [30]. The peak intensity of the E1 (LO) mode increased in order in the nanowires modified with 0, 3, and 6 at % of the Co precursor, while it decreased in the nanowires modified with 9 and 12 at % of the Co precursor. This strongly suggested that the growth of ZnO nanowires in the solutions with Co 3 and 6 at % was related to the Co doping into the ZnO bulks, whereas in solutions with Co 9 and 12 at %, it was related to the Co oxide surface modification. This matched the results of the omega rocking curves as shown in Figure 2. Thus, the appearance of a broad E1 (LO) peak confirmed the existence of Co ions doped into the ZnO lattice. The peak intensity of the Eg and F2g modes originated from impurity-phase Co3O4 increasing in the order of 0, 3, 6, 9, and 12 at % Co ion-modified ZnO nanowires, although these phases were not detected in the XRD measurements. These two modes appeared clearly in 9 and 12 at % Co ion-modified ZnO nanowires, probably due to the small Co oxide cluster formations either in the grain boundary or interstitial position. Hence, at over 9 at % Co concentration, the Co/ZnO composite nanowires could be grown, resulting from the segregation of oxides [31]. To summarize the Raman spectrum experiments, with solutions up to Co 6 at %, the lattice defects in the ZnO were activated, and thereby Co-doped ZnO nanowires were formed [32]. Contrary to this, when Co concentration was beyond 6 at %, Co oxides were formed in the ZnO nanowires. Thus, the morphological change from Co doping to Co oxide cluster formation in the ZnO nanowires depended on the Co content in the precursor.
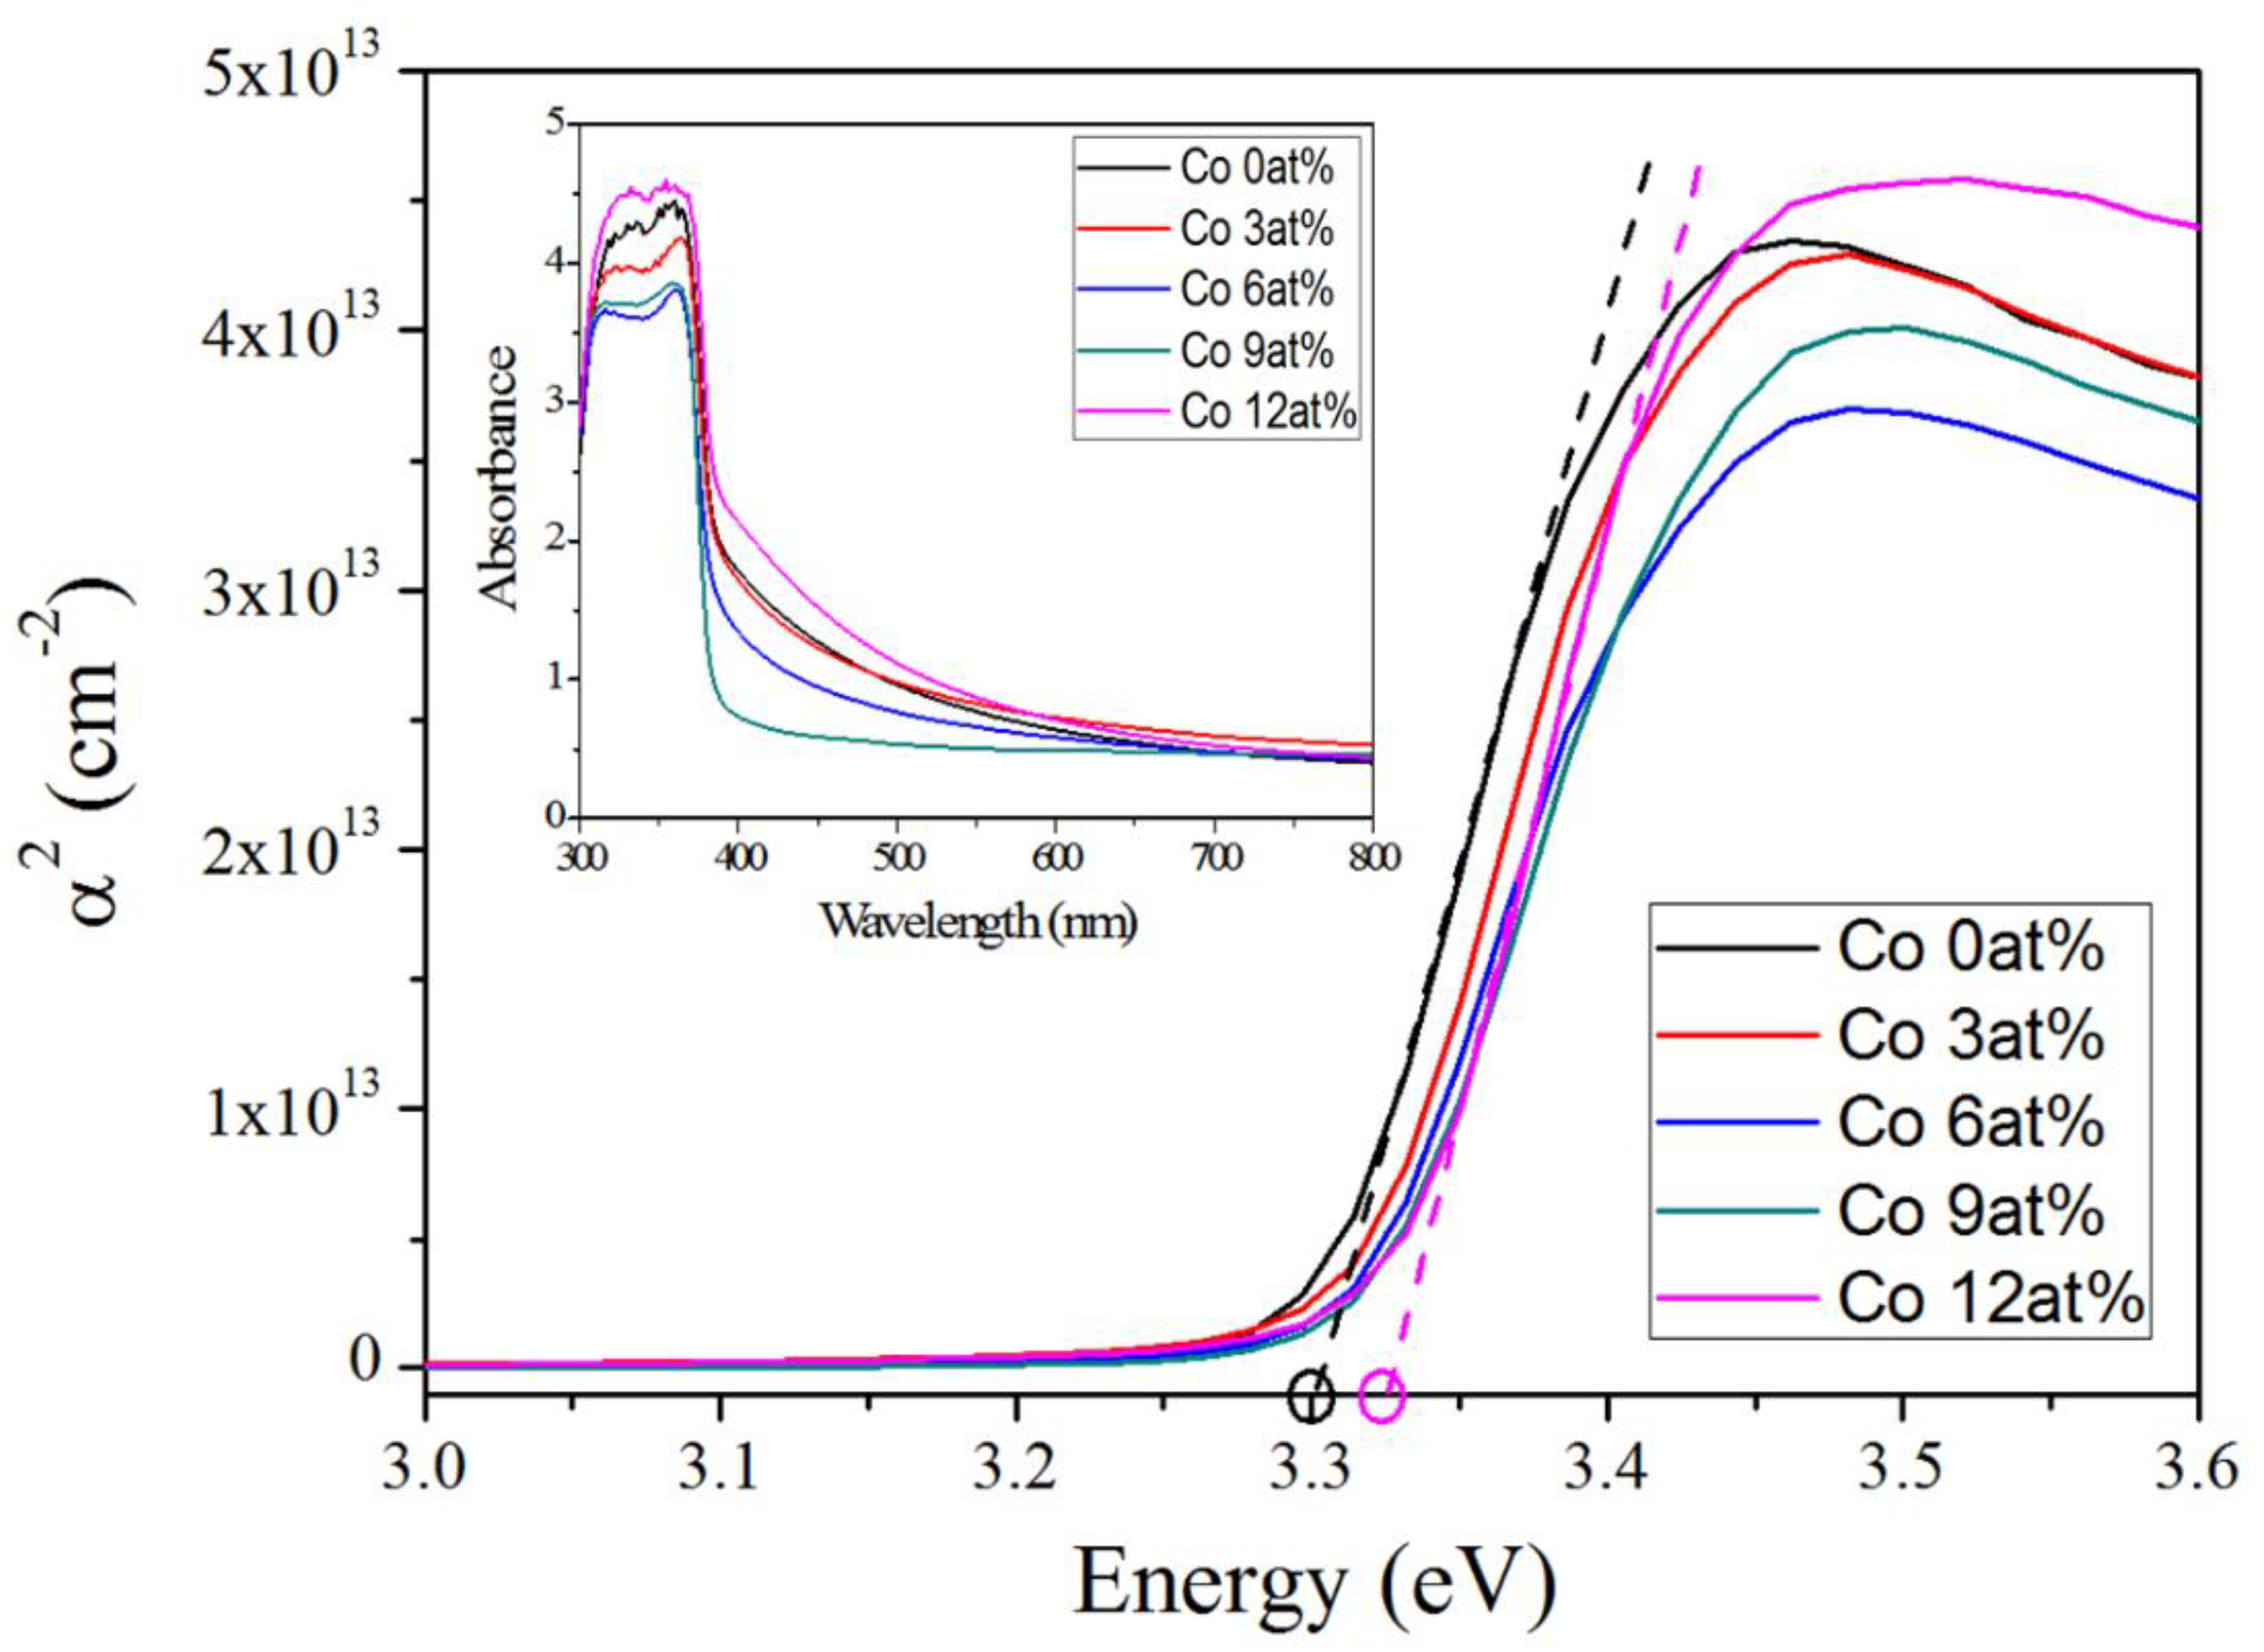
Meanwhile, the absorption coefficient could be calculated from the following relation [33]: T = A exp(-αd), where T, A, α, and d are optical transmittance, a constant, absorption coefficient, and film thickness, respectively. The optical band gap of the ZnO nanowires could be obtained by introducing the Tauc model [34], and the Davis and Mott model [35], in the large absorption region:
αhv = D (hv − Eg)n,
where hv, Eg, and D are photon energy, optical band gap, and a constant, respectively. Since ZnO is a semiconductor with a nature of direct allowed transition, substituting n = 1/2 into the formula resulted in the best linear curve in the band-edge region [33,36]. Figure 5 represents the relationship between α2 and hv, which is plotted by absorption spectra as shown in the inset of Figure 5. The value of the optical band gap could be obtained by extrapolating the linear portion to the photon-energy axis. The obtained Eg values are listed in the third column of Table 2. As Co concentration increased, the optical band gap revealed the blue shift from 3.310 eV (Sample A) to 3.327 eV (Sample E). The sp–d exchange between the ZnO band electrons and localized d-electrons of the doped Co2+ cations led to a change in their band structure, and this was responsible for the blue shift [37]. The blue shift can be described by the Burstein–Moss effect due to an increase in the carrier concentration, which was attributed to shifting the Fermi level to the conduction band [38,39].
Figure 6 shows the room-temperature photoluminescence (PL) spectra of the ZnO nanowires synthesized with varying Co precursor concentrations in the solution. Every sample exhibited distinctive band-edge emission in the ultraviolet (UV) region, and a defect-related emission in the visible region, as is commonly observed with ZnO nanowires. The UV emission band originated in a near band-edge transition of the wide band-gap ZnO nanowires [40]. With increasing Co concentrations, the UV emission peak was somewhat blue-shifted, and intensity was rapidly reduced. This behavior can be explained as follows: the blue shift indicated a higher band gap for the modified nanowire because the widths of the nanowire were much larger than the excitonic Bohr diameter of ZnO [41]. The visible band emission was red-shifted from 500 to 580 nm, and became broader and more intense as the Co concentration increased. The visible band emission was strongly related to oxygen vacancy, oxygen interstitial, or zinc interstitial [42]. The green band emission was originated from the oxygen vacancies and zinc interstitials [43], while orange–red band emission was associated with oxygen interstitials [42]. Therefore, our observations can be analyzed and explained as follows. The visible emission seen in Sample B occurred via the combination of oxygen vacancies, zinc interstitials, and oxygen interstitials, suggesting that 3 at % Co ions mainly yield a doping effect in ZnO nanowires. Contrary to this, a strong visible emission found in Sample E suggested that 12 at % Co ions may lead to two types of Co ion modification effect, a doping effect and the formation of Co oxide cluster in the ZnO nanowires due to sufficient Co content. The ratio of the UV peak intensity to the visible peak intensity in the PL spectra implied the levels of impurities and defects in the energy bandgap of ZnO nanowire. As indicated in Table 2, the decrease in intensity ratio meant the increase in the levels of impurities and defects, indicating the decrease in the probability of UV emission and the increase in the probability of visible and nonradiative emission. This matched the FE-SEM, XRD, and Raman spectrum results shown in Figure 1, Figure 2 and Figure 4. The optical characteristics obtained from Figure 6 are listed in Table 2. Here, an increase in the band gap, a decrease in the UV peak position, a red shift of the visible peak position, and a decrease in the intensity ratio between the UV and visible peaks can all be observed, which matched the aforementioned results. Co ions could affect both the internal structure and the surface of ZnO nanowires via an interaction with oxygen vacancies, zinc interstitials, and oxygen interstitials.

3. Experiments

Synthesis of Co ion-modified ZnO nanowires was carried out using zinc acetate dihydrate ((C2H3O2)2Zn·2H2O, Sigma-Aldrich, Saint Louis, MO, USA) and cobalt (II) acetate hydrate (Co(CH3CO2)2·xH2O, Sigma-Aldrich) as the precursors.
Prior to the growth of the ZnO nanowires, ZnO seed layers were coated onto fluorine-doped tin oxide (FTO) glasses (2 × 2 cm2 in size) using a spin-coating method, and then dried at 100 °C for 30 min. Subsequently, the ZnO seed-layer-coated FTO glasses were immersed in 150 mL ethanol solutions containing Zn and Co precursors at 70 °C for 3 h, yielding ZnO nanowires with and without Co ion modification, respectively. The molar concentration of the Zn precursor was fixed at 0.025 M, while the molar concentrations of the Co precursor were adjusted from 0 to 12 at % by changing the weight added in the mixed aqueous solution. The resulting ZnO nanowires were carefully washed with ethanol and dried at 100 °C for 30 min in an oven.
The morphologies of the ZnO nanowires were investigated by FE-SEM (S-4800, Hitachi) and TEM (F20, Fei Tecnai) with EDS. To examine the crystallinity and lattice constant of the ZnO nanowire in more detail, we used HR-TEM analysis. XRD (X’Pert MPD) using Cu–Kα radiation was used to examine the crystal structures, crystallinity, and crystal orientation of the ZnO nanowires at room temperature. To investigate changes in the degree of misorientation of ZnO nanowires synthesized under different Co concentrations, we also measured the omega rocking curves. For the investigation on the structure and vibrational properties of the ZnO nanowires, Raman scattering experiments were performed at room temperature using a Raman spectrometer (SPEX 1403) with a 532 nm line of an Ar+ laser. In order to investigate the effects of Co ion-modification on the band gap of the ZnO nanowires, ultraviolet–visible–near-infrared (UV–Vis–NIR, Cary 5 spectrophotometer) spectra were measured using an integrated sphere. Additionally, the room-temperature PL characteristics of the ZnO nanowires were measured. In the PL measurement, a He–Cd laser (30 mW) with a wavelength of 325 nm and a GaAs photomultiplier tube were used for excitation and detection, respectively.

4. Conclusions

In summary, a hydrothermal technique was used to synthesize Co ion-modified ZnO nanowires arrays in various solutions. In FE-SEM analysis, it was observed that the morphology of the Co-modified ZnO nanowires could be controlled by the Co concentration used in the solution. The interplanar spacing of the ZnO (002) crystal planes of the nanowires increased as Co concentration increased due to Co doping. In addition, it was confirmed that the misorientation of ZnO (002) planes increased with the increase of Co concentrations due to defects in the nanowires. The Raman spectra suggested that Co doping or Co oxide cluster formation in the ZnO nanowires relied on the Co content in the precursors. With increasing Co concentrations, the optical band gap showed blue shifts due to the sp–d exchange between ZnO band electrons and Co2+ cations. The PL spectra showed blue shifts of the UV emission peaks resulting in the increase in the band gap with increasing Co concentrations; however, the visible emission, occurring via oxygen vacancies, zinc interstitials, and oxygen interstitials, showed red shifts due to the modification effect.

Author Contributions

Conceptualization, S.C.C., D.K.L., and S.H.S.; investigation, S.C.C.; writing—original-draft preparation, S.C.C.; writing—review and editing, D.K.L. and S.H.S.; funding acquisition, S.H.S. All authors have read and agreed to the published version of the manuscript.

Funding

This research was supported by the Basic Science Research Program through the National Research Foundation of Korea (NRF), funded by the Ministry of Education (NRF-2019R1I1A3A01041101).

Conflicts of Interest

The authors declare no conflict of interest.

References

  1. Li, L.; Guo, Y.; Cui, X.Y.; Zheng, R.K.; Ohtani, K.; Kong, C.; Ceguerra, A.V.; Moody, M.P.; Ye, J.D.; Tan, H.H.; et al. Magnetism of Co-doped ZnO epitaxially grown on a ZnO substrate. Phys. Rev. B 2012, 85, 174430. [Google Scholar] [CrossRef] [Green Version]
  2. De Carvalho, H.B.; deGodoy, M.P.F.; Paes, R.W.D.; Mir, M.; OrtizdeZevallos, A.; Iikawa, F.; Brasil, M.J.S.P.; Chitta, V.A.; Ferraz, W.B.; Boselli, M.A.; et al. Absence of ferromagnetic order in high quality bulk Co-doped ZnO samples. J. Appl. Phys. 2010, 108, 033914. [Google Scholar] [CrossRef] [Green Version]
  3. Pearton, S.J.; Abernathy, C.R.; Thaler, G.T.; Frazier, R.M.; Norton, D.P.; Ren, F.; Park, Y.D.; Zavada, J.M.; Buyanova, I.A.; Chen, W.M.; et al. Wide bandgap GaN-based semiconductors for spintronics. J. Phys. Condens. Matter 2004, 16, R209. [Google Scholar] [CrossRef]
  4. Sonoda, S.; Tanaka, I.; Ikeno, H.; Yamamoto, T.; Oba, F.; Araki, T.; Yamamoto, Y.; Suga, K.; Nanishi, Y.; Akasaka, Y.; et al. Coexistence of Mn2+ and Mn3+ in ferromagnetic GaMnN. J. Phys. Condens. Matter 2006, 18, 4615. [Google Scholar] [CrossRef]
  5. Sutka, A.; Kaambre, T.; Parna, R.; Juhnevica, I.; Maiorov, M.; Joost, U.; Kisand, V. Co doped ZnO nanowires as visible light photocatalysts. Solid State Sci. 2016, 56, 54–62. [Google Scholar] [CrossRef]
  6. Nair, M.G.; Nirmala, M.; Rekha, K.; Anukaliani, A. Structural, optical, photo catalytic and antibacterial activity of ZnO and Co doped ZnO nanoparticles. Mater. Lett. 2011, 65, 1797–1800. [Google Scholar] [CrossRef]
  7. Kuriakose, S.; Satpati, B. Mohapatra Enhanced photocatalytic activity of Co doped ZnO nanodisks and nanorods prepared by a facile wet chemical method. Phys. Chem. Chem. Phys. 2014, 16, 12741–12749. [Google Scholar] [CrossRef]
  8. Víctor-Román, S.; García-Bordejé, E.; Hernández-Ferrer, J.; González-Domínguez, J.M.; Ansón-Casaos, A.; Silva, A.M.T.; Maser, W.K.; Benito, A.M. Controlling the surface chemistry of graphene oxide: Key towards efficient ZnO-GO photocatalysts. Catal. Today 2019, in press. [Google Scholar]
  9. Liu, T.; Xu, H.R.; Chin, W.S.; Yong, Z.H.; Wee, A.T.S. Local Structural Evolution of Co-Doped ZnO Nanoparticles upon Calcination Studied by in Situ Quick-Scan XAFS. J. Phys. Chem. C 2008, 112, 3489–3495. [Google Scholar] [CrossRef]
  10. Phan, T.L.; Vincent, R.; Cherns, D.; Yu, N.H.D.S.C. Enhancement of multiple-phonon resonant Raman scattering in Co-doped ZnO nanorods. Appl. Phys. Lett. 2008, 93, 082110. [Google Scholar] [CrossRef]
  11. Liang, W.J.; Yuhas, B.D.; Yang, P.D. Magnetotransport in Co-Doped ZnO Nanowires. Nano Lett. 2009, 9, 892–896. [Google Scholar] [CrossRef] [PubMed]
  12. Pung, S.Y.; Choy, K.L.; Hou, X. Tip-growth mode and base-growth mode of Au-catalyzed zinc oxide nanowires using chemical vapor deposition technique. J. Cryst. Growth 2010, 312, 2049–2055. [Google Scholar] [CrossRef]
  13. Chen, S.J.; Wang, G.R.; Liu, Y.C. The structure and photoluminescence properties of ZnO nanobelts prepared by a thermal evaporation process. J. Lumin. 2009, 129, 340–343. [Google Scholar] [CrossRef]
  14. Fabbiyola, S.; Kennedy, L.J.; Aruldoss, U.; Bououdina, M.; Dakhel, A.A.; Vijaya, J.J. Synthesis of Co-doped ZnO nanoparticles via co-precipitation: Structural, optical and magnetic properties. Powder Technol. 2015, 286, 757–765. [Google Scholar] [CrossRef]
  15. Lu, Y.; Lin, Y.; Wang, D.; Wang, L.; Xie, T.; Jiang, T. A high performance cobalt-doped ZnO visible light photocatalyst and its photogenerated charge transfer properties. Nano Res. 2011, 4, 1144–1152. [Google Scholar] [CrossRef]
  16. Caglar, Y. Sol–gel derived nanostructure undoped and cobalt doped ZnO: Structural, optical and electrical studies. J. Alloys Compd. 2013, 560, 181–188. [Google Scholar] [CrossRef]
  17. Wang, A.; Zhong, Z.; Lu, C.; Lv, L.; Wang, X.; Zhang, B. Study on field-emission characteristics of electrodeposited Co-doped ZnO thin films. Phys. B Condens. Matter. 2011, 406, 1049–1052. [Google Scholar] [CrossRef]
  18. Wang, L.L.; Lin, B.Z.; Zhou, L.; Shang, Y.X.; Panin, G.N.; Fu, D.J. Nitrogen-doped ZnO nanorods prepared by hydrothermal diffusion. Mater. Lett. 2012, 85, 171–174. [Google Scholar] [CrossRef]
  19. Guria, A.K.; Pradhan, N. Doped or Not Doped: Ionic Impurities for Influencing the Phase and Growth of Semiconductor Nanocrystals. Chem. Mater. 2016, 28, 5224–5237. [Google Scholar] [CrossRef]
  20. Zou, C.; Liang, F.; Xue, S. Synthesis and oxygen vacancy related NO2 gas sensing properties of ZnO:Co nanorods arrays gown by a hydrothermal method. Appl. Surf. Sci. 2015, 353, 1061–1069. [Google Scholar] [CrossRef]
  21. He, X.; Yang, H.; Chen, Z.; Lia, S.S.Y. Effect of Co-doping content on hydrothermal derived ZnO array films. Phys. B Condens. Matter 2012, 407, 2895–2899. [Google Scholar] [CrossRef]
  22. Liu, J.; Lee, S.I.; Lee, K.M.; Ahn, Y.H.; Park, J.Y.; Koh, K.H. Bending and bundling of metal-free vertically aligned ZnO nanowires due to electrostatic interaction. Nanotechnology 2008, 19, 185607. [Google Scholar] [CrossRef] [PubMed]
  23. Erwin, S.C.; Zu, L.; Haftel, M.I.; Efros, A.L.; Kennedy, T.A.; Norris, D.J. Doping semiconductor nanocrystals. Nature 2005, 436, 91–94. [Google Scholar] [CrossRef] [PubMed]
  24. Yuhas, B.D.; Zitoun, D.O.; Pauzauskie, P.J.; He, R.; Yang, P.D. Transition-Metal Doped Zinc Oxide Nanowires. Angew. Chem. Int. Ed. 2006, 45, 420–423. [Google Scholar] [CrossRef]
  25. Djerdj, I.; Garnweitner, G.; Arcon, D.; Pregeli, M.; Jaqlicic, Z.; Niedegrberger, M. Diluted magnetic semiconductors: Mn/Co-doped ZnO nanorods as case study. J. Mater. Chem. 2008, 18, 5208–5217. [Google Scholar] [CrossRef]
  26. Lee, S.Y.; Lee, W.J.; Nahm, C.W.; Kim, J.M.; Byun, S.J.; Hwang, T.H.; Lee, B.K.; Jang, Y.I.; Lee, S.G.; Lee, H.M.; et al. Nanostructural analysis of ZnO:Al thin films for carrier-transport mechanisms. Curr. Appl. Phys. 2013, 13, 775–778. [Google Scholar]
  27. Yilmaz, M.; Caldiran, Z.; Deniz, A.R.; Aydogan, S.; Gunturkun, R.; Turut, A. Preparation and characterization of sol–gel-derived n-ZnO thin film for Schottky diode application. Appl. Phys. A 2015, 119, 547–552. [Google Scholar] [CrossRef]
  28. Samanta, K.; Bhattacharya, P.; Katiyar, R.S.; Iwamoto, W.; Pagliuso, P.G.; Rettori, C. Raman scattering studies in dilute magnetic semiconductor Zn1−xCoxO. Phys. Rev. B 2006, 73, 245213. [Google Scholar] [CrossRef] [Green Version]
  29. Hadjiev, V.G.; Iliev, M.N.; Vegilov, I.V. The Raman spectra of Co3O4. J. Phys. C Solid State Phys. 1988, L199, 21. [Google Scholar] [CrossRef]
  30. Alaria, J.; Bieber, H.; Colis, S.; Schmerber, G.; Dinia, A. Absence of ferromagnetism in Al-doped Zn0.9Co0.10O diluted magnetic semiconductors. Appl. Phys. Lett. 2006, 88, 112503. [Google Scholar] [CrossRef]
  31. Ansón-Casaos, A.; Sampaio, M.J.; Jarauta-Córdoba, C.; Martínez, M.T.; Silva, C.G.; Faria, J.L.; Silva, A.M.T. Evaluation of sol–gel TiO2 photocatalysts modified with carbon or boron compounds and crystallized in nitrogen or air atmospheres. Chem. Eng. J. 2015, 277, 11–20. [Google Scholar] [CrossRef] [Green Version]
  32. Hadzic, B.; Romcevic, N.; Romcevic, M.; Kuryliszyn-Kudelska, I.; Dobrowolski, W.; Trajic, J.; Timotijevic, D.; Narkiewicz, U.; Sibera, D. Surface optical phonons in ZnO(Co) nanoparticles: Raman study. J. Alloys Compd. 2012, 540, 49–56. [Google Scholar] [CrossRef]
  33. Lu, J.G.; Ye, Z.Z.; Wang, L.; Huang, J.Y.; Zhao, B.H. Structural, electrical and optical properties of N-doped ZnO films synthesized by SS-CVD. Mater. Sci. Semicond. Process. 2002, 5, 491–496. [Google Scholar] [CrossRef]
  34. Tauc, J. Amorphous and Liquid Semiconductors; Plenum: London, UK, 1974. [Google Scholar]
  35. David, E.A.; Mott, N.F. Conduction in non-crystalline systems V. Conductivity, optical absorption and photoconductivity in amorphous semiconductors. Philos. Mag. 1970, 22, 903. [Google Scholar]
  36. Tan, S.T.; Chen, B.J.; Fan, W.J.; Kwok, H.S.; Zhang, X.H.; Chua, S.J.; Sun, X.W. Blueshift of optical band gap in ZnO thin films grown by metal-organic chemical-vapor deposition. J. Appl. Phys. 2005, 98, 013505. [Google Scholar] [CrossRef] [Green Version]
  37. Guha, S.; Ghosh, K.; Keeth, J.G.; Ogale, S.B.; Shinde, S.R.; Simpson, J.R.; Drew, H.D.; Venkatesan, T. Temperature-dependent optical studies of Ti1−xCoxO2. Appl. Phys. Lett. 2003, 83, 3296. [Google Scholar] [CrossRef] [Green Version]
  38. Ali, R.N.; Naz, H.; Li, J.; Zhu, X.; Liu, P.; Xiang, B. Band gap engineering of transition metal (Ni/Co) codoped in zinc oxide (ZnO) nanoparticles. J. Alloys Compd. 2018, 744, 90–95. [Google Scholar] [CrossRef]
  39. Hammad, T.M.; Salem, J.K.; Harrison, R.G. Structure, optical properties and synthesis of Co-doped ZnO superstructures. Appl. Nanosci. 2013, 2013 3, 133–139. [Google Scholar] [CrossRef] [Green Version]
  40. Kong, Y.C.; Yu, D.P.; Zhang, B.; Fang, W.; Feng, S.Q. Ultraviolet-emitting ZnO nanowires synthesized by a physical vapor deposition approach. Appl. Phys. Lett. 2001, 78, 407. [Google Scholar] [CrossRef]
  41. Pal, B.; Giri, P.K. High temperature ferromagnetism and optical properties of Co doped ZnO nanoparticles. J. Appl. Phys. 2010, 108, 084322. [Google Scholar] [CrossRef] [Green Version]
  42. Liu, X.; Wu, X.; Cao, H.; Chang, R.P.H. Growth mechanism and properties of ZnO nanorods synthesized by plasma-enhanced chemical vapor deposition. J. Appl. Phys. 2004, 95, 3141. [Google Scholar] [CrossRef] [Green Version]
  43. Vanheusden, K.; Warren, W.L.; Seager, C.H.; Tallant, D.K.; Voigt, J.A.; Gnade, B.E. Mechanisms behind green photoluminescence in ZnO phosphor powders. J. Appl. Phys. 1996, 79, 7983. [Google Scholar] [CrossRef]
Figure 1. FE-SEM images of ZnO nanowires synthesized in solution with (a) 0, (b) 3, (c) 6, (d) 9, and (e) 12 at % Co precursor. (f) EDS spectra of ZnO nanowires modified with 12 at % Co precursor.
Catalysts 10 00614 g001
Figure 2. XRD patterns of ZnO nanowires synthesized with varying concentration of Co precursor in the solution. (left inset) Magnified XRD patterns at a 2theta range of ZnO (002) crystal plane. (right inset) Rocking curve at fixed 2theta of ZnO (002) crystal plane.
Catalysts 10 00614 g002
Figure 3. (a,d) TEM, (b,e) HR-TEM, and (a,d insets) selected-area electron-diffraction (SAED) patterns; (c,f) EDS spectra of (ac) nonmodified and (df) 12 at % Co ion-modified ZnO nanowires.
Catalysts 10 00614 g003
Figure 4. Raman spectra of ZnO nanowires synthesized with varying concentrations of Co precursor in solution.
Catalysts 10 00614 g004
Figure 5. α2 vs. photon-energy plots of ZnO nanowires synthesized with varying concentrations of Co precursor in solution.
Catalysts 10 00614 g005
Figure 6. Photoluminescence (PL) spectra of ZnO nanowires synthesized with varying concentrations of Co precursor in solution.
Catalysts 10 00614 g006
Table 1. Structural characteristics of ZnO nanowires synthesized with varying content of Co precursor.
SamplesConcentrations
of Co Precursor
Nanowire Shapes2Theta
(degrees)
d002 1
(Å)
Omega FWHM 2
(degrees)
A0 at%Vertical34.4882.55868.02
B3 at%Vertical34.4712.56028.22
C6 at%Vertical34.4622.56108.28
D9 at%Bundle34.3912.56568.65
E12 at%Bundle34.3452.56908.97
1 d002 defined as interplanar spacing of the ZnO (002) crystal plane for nanowires and calculated from XRD patterns seen in Figure 2b. 2 Omega full width at half maximum (FWHM) calculated from rocking curves of ZnO (002) crystal plane inserted in Figure 2.
Table 2. Optical characteristics of ZnO nanowires with varying content of Co precursor.
SamplesCo Precursor ConcentrationsBand Gap 1 (eV)Peak Position at UV Band (nm)Peak Position at Visible Band (nm)Intensity Ratio 2
A0 at %3.310386.1~503~12.8
B3 at %3.312384.9~497~1.1
C6 at %3.313382.1~565~0.7
D9 at %3.318381.4~571~0.4
E12 at %3.327381.1~578~0.2
1 Band gap was estimated from absorption data as shown in inset of Figure 5. 2 Intensity ratio defined as ratio of UV peak intensity to visible peak intensity in PL spectra, as shown in Figure 6.