Abstract
The present paper reports AC impedance spectroscopic/Tafel polarization and cyclic voltammetry study on the influence of acetonitrile concentration on the kinetics of UPD of H (underpotential deposition of hydrogen) and HER (hydrogen evolution reaction), examined on polycrystalline and polyoriented single-crystal sphere Pt electrode surfaces in 0.5 M H2SO4 and 0.1 M NaOH supporting solutions. The resulted data provided confirmation of the destructive role of Pt surface-electrosorbed acetonitrile on the kinetics of underpotentially deposited hydrogen, as well as cathodic hydrogen evolution reaction. The above was exclusively elucidated through evaluation of the associated charge-transfer resistance and capacitance (and complementary exchange current-density and Tafel slope) parameters, derived comparatively on Pt for pure and acetonitrile-modified acidic and alkaline electrolytes.
1. Introduction
Hydrogen and oxygen evolution (HER and OER), hydrogen oxidation (HOR) and oxygen reduction (ORR) reactions at metal-based surfaces are some of the most significant electrochemical processes [1,2,3,4,5,6], primarily due to fast expansion of PEM: proton-exchange membrane fuel-cell and water electrolysis (alkaline and PEM systems) technologies. The presence of some airborne inorganic (e.g., SO2, NOx and H2S) and literary hundreds of organic (both aromatic and aliphatic) compounds could have a significant impact on the performance of the PEM fuel cell and water electrolyzer systems. Acetonitrile, CH3CN (AcN) is a simple-structure, highly polar and volatile organic solvent, commonly used in numerous industrial applications, including: extraction, plastics molding and casting and battery technologies. Its presence in the air could have a substantial detrimental effect on the catalytic performance of otherwise highly reactive, noble metal-based electrochemical catalysts [7,8,9,10,11,12].
The electrochemical reactivity of acetonitrile on polycrystalline platinum electrode in acidic solution was originally studied at the University of Ottawa by the group of Conway [13]. CH3CN was then found to initially undergo irreversible chemisorption on the Pt surface, which in the adsorbed state is followed by a reversible reduction and re-oxidation cycles, a phenomenon eventually given a name of “reactive chemisorption”. In their later works published by Morin and Conway [14] and by Morin et al. [15], the authors extended their initial study to the examination of the reactive chemisorption of AcN on Pt single-crystal planes along with elucidation of its mechanism by means of supplementary in-situ infrared spectroscopy. There are a few more recently published works on the adsorption of acetonitrile and its mechanism, examined on various Pt surfaces (including stepped single-crystal planes), in conjunction with different supporting electrolytes; however, none of them provides detailed information on how AcN electrosorption on the Pt surface would affect the kinetics of underpotential-deposited hydrogen (UPD H), HER or ORR processes [6,7,11,12,16,17,18,19].
The process of so-called underpotential-deposited hydrogen (UPD H) at Pt (but also at other noble/semi-noble metals, e.g., Ir, Rh and Pd) appears at potentials positive to the H2 reversible potential, when the Gibbs energy of H atoms binding with the metal surface is numerically greater than half the Gibbs energy of bonding in the hydrogen molecule, thus:
In contrast, the overpotential deposition (OPD) process, which results in cathodic H2 evolution, could apparently pass much greater currents than the UPD process. This is because the rates of the Faradaic reactions involved in the OPD process are not limited by the approach to full monolayer coverage by the adsorbed H intermediate, as is the case for the process of UPD of H. Continuous desorption of previously electrosorbed H takes place, forming H2 molecules and this is how HER: hydrogen evolution reaction commences. In acidic solution, the process of UPD of H at Pt is represented by the reaction:
where E is the applied potential, CH+ is the proton concentration, θH is the fraction of site occupancy for adsorbed H and 1 − θH is the corresponding fraction of free sites of Pt, available for adsorption, where 0 ≤ θH ≤ 1 [20,21,22,23].
Then the hydrogen evolution reaction leads to the generation of bulk H2 species and proceeds at potentials negative to the H2 reversible potential. The HER mechanism at metal (Me) electrode is based on a 2-step reaction (typically through the Volmer–Heyrovsky route), which involves an adsorbed H intermediate, as presented here for acidic and alkaline media [23,24,25,26]:
Acidic media:
Alkaline media:
In this work, the authors would most importantly like to give some additional insight into the relationship between the Pt surface adsorption of acetonitrile and the kinetics of two utterly important electrochemical processes, namely: underpotential deposition of hydrogen and hydrogen evolution reaction, examined in 0.5 M H2SO4 and 0.1 M NaOH solutions. Here, the AC impedance-derived Faradaic resistance and capacitance parameters (along with the Tafel polarization-derived exchange current densities and slope values), obtained in unmodified acidic and alkaline electrolytes (including comparative, literature available data), were compared with those recorded in the presence of AcN.
2. Results and Discussion
2.1. Cyclic Voltammetry Behaviour of Pt in the Presence of Acetonitrile in Sulphuric Acid and Sodium Hydroxide Solutions
Figure 1a,b below present the cyclic voltammetric current response for the acetonitrile adsorption behavior on polycrystalline Pt wire (or Pt polyoriented single-crystal sphere) electrode, at two concentrations of AcN in 0.5 M H2SO4 and 0.1 M NaOH solutions, respectively. A primary adsorption effect of acetonitrile introduction into sulphuric acid was evidenced (especially at the concentration of [AcN] = 1.85 × 10⁻³ M) through significant depletion of the voltammetric charge (understandably, much more pronounced for higher concentration of AcN in the electrolyte) assigned to the reversible process of UPD of H, over the potential range ca. 50–350 mV vs. RHE (reversible hydrogen electrode) (Figure 1a). In addition, a pair of fairly reversible (oxidation/reduction) and broad peaks (centered at ca. 0.50 V) appeared over the double-layer charging potential range of the CV profile (0.40–0.60 V/RHE). The latter observations are in-line with those originally presented in [7,8], where a two-electron reduction-oxidation process occurs over the potential range about 0.40–0.60 V with a reactive species being in the chemisorbed state.
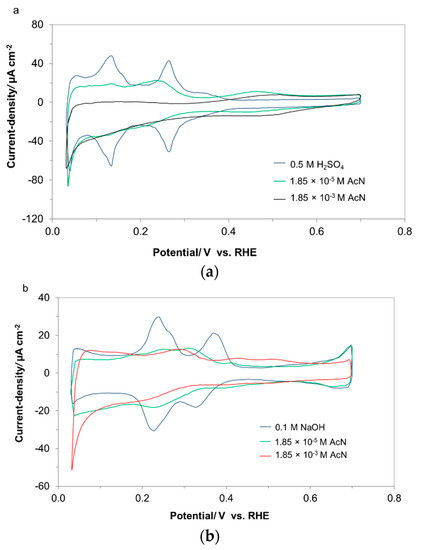
Figure 1.
(a) Cyclic voltammograms for polycrystalline Pt electrode in 0.5 M H2SO4 at a sweep-rate of 0.050 V·s−1 (at 293 K) and in the presence of AcN at the concentrations indicated; voltammograms were recorded on the second cycle and (b) as above, but recorded for Pt polyoriented single-crystal sphere electrode in 0.1 M NaOH.
On the other hand, the degree of Pt surface blockage by AcN-based adsorbed species (over the UPD of H potential range) was much less pronounced in 0.1 M NaOH solution (especially at higher acetonitrile concentration); however, some voltammetric current increase could clearly be observed over the potential range for double-layer charging (see Figure 1b). These conclusions are similar to those given by Briega-Martos et al. in [2], but it has to be stated that very little information could be found in literature on the electrochemical behavior of acetonitrile under alkaline conditions.
2.2. Electrochemical Behaviour at Poly Pt Electrode in Pure 0.5 M H2SO4 and in the Presence of Acetonitrile
Electrochemical behavior of polycrystalline Pt electrode in 0.5 M H2SO4, examined over the potential range positive and negative to the reversible potential for hydrogen evolution (thus including surface processes of underpotential deposition of hydrogen, double-layer charging zone, as well as the cathodic process of hydrogen evolution, accompanied by the presence of the so-called overpotentially deposited hydrogen species) in the absence and in the presence of acetonitrile is shown in Figure 2a through Figure 2d and Table 1 below.
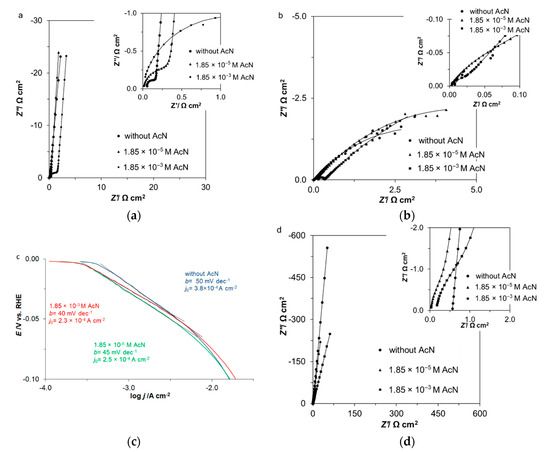
Figure 2.
(a) Complex-plane impedance plots for the process of underpotential deposition of hydrogen (UPD of H) on polycrystalline Pt electrode in contact with 0.5 M H2SO4 and in the presence of AcN for the concentrations indicated, recorded at 293 K for the potential of 100 mV vs. RHE. The solid lines correspond to representation of the data according to the equivalent circuit shown in Figure 3a and (b) as above, but for the process of hydrogen evolution reaction (HER), recorded at the potential of −50 mV vs. RHE. The solid lines correspond to representation of the data according to the equivalent circuit shown in Figure 3b; (c) quasi-potentiostatic cathodic polarization curves (recorded at a rate of 0.5 mV·s−1) under the same conditions as above; (d) as in (a) above, but recorded over the double-layer charging potential range (500 mV vs. RHE), exhibiting the AcN reversible oxidation process. The solid lines correspond to representation of the data according to the equivalent circuit shown in Figure 3c.

Table 1.
Resistance and capacitance parameters for UPD of H, HER and AcN reversible oxidation/reduction processes on polycrystalline Pt electrode surface in contact with 0.5 M H2SO4 and in the presence of acetonitrile (at 293 K), obtained by fitting the equivalent circuits shown in Figure 3a through Figure 3c to the recorded impedance data (recorded values of dimensionless φ parameters for the CPE circuit components oscillated between 0.81–0.99 and 0.97–0.99 for UPD of H; impedance reproducibility usually below 10%; χ2 = 9 × 10⁻⁵ to 4 × 10⁻⁴).
In the impedance spectra, the process of UPD of H gave rise to a semicircle observable throughout the high and intermediate frequency range of the Nyquist plot along with a vertical line characterizing purely capacitive (although it often deviates from a 90° angle due to a capacitance dispersion effect) behavior at sufficiently low frequencies (Figure 2a and Figure 3a). Hence, in the present work, the recorded results on the kinetics of the UPD of H process (see Table 1) follow in general other literature-available data [27,28,29,30,31]. Thus, over the potential range 100–200 mV/RHE, the double-layer capacitance values, Cdl for poly Pt electrode fluctuated around 20–70 μF·cm−2. The H adsorption pseudocapacitance, CpH changed (decreased) with increasing potential in a similar way to the current–density changes in the CV profiles of Figure 1a. Then, the corresponding charge-transfer resistance, RH (a parameter proportional to the inverse of the exchange rate for the process of UPD of H) significantly increased from 0.48 (at 100 mV) to reach 1.37 Ω·cm2 at 200 mV.
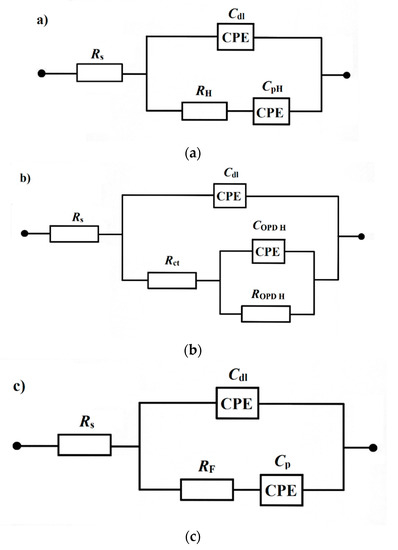
Figure 3.
(a) Equivalent circuit for UPD of H adsorption process, exhibiting Faradaic pseudocapacitance, CpH, charged via a Faradaic resistance, RH, in a parallel combination with the double-layer capacitance, Cdl (both capacitance parameters are CPE: constant phase element-modified), jointly in series with an uncompensated solution resistance, RS and (b) two CPE-modified C-R element equivalent circuit used for fitting the HER impedance data recorded on Pt electrode surface. The circuit includes Rct and Cdl elements corresponding to the HER charge-transfer resistance and double-layer capacitance components, and RS is solution resistance; ROPD H and COPD H elements correspond to the resistance and capacitance components of the so-called OPD H: overpotentially deposited hydrogen species; (c) equivalent circuit used for fitting the impedance data for the reversible process of AcN oxidation on Pt electrode surface, where RF and Cp (CPE-modified) elements correspond to the Faradaic charge-transfer resistance and distributed pseudocapacitance, Cdl (also reported as CPE) to interfacial double-layer capacitance and RS is solution resistance.
However, introduction of acetonitrile into a base sulphuric acid electrolyte caused a radical increase of the recorded RH parameter, which for an analogue potential span: 100–200 mV/RHE ranged: 0.77–2.93 Ω·cm2 ([AcN] = 1.85 × 10⁻⁵ M) and 2.29–18.99 Ω cm2 for the AcN concentration of 1.85 × 10⁻³ M. At the same time, understandably, the CpH parameter exhibited significant reduction at the corresponding potentials, e.g., at 200 mV from an initial value of 119 μF·cm−2 in AcN-free H2SO4 to 75.0 μF·cm−2 for the AcN content of 1.85×10⁻³ M. Conversely, introduction of acetonitrile did not cause substantial changes over the recorded values of double-layer capacitance parameter (Table 1).
Furthermore, it is well-known that the cathodic process of hydrogen evolution at Pt electrode surfaces proceeds in the presence of the more weakly bonded (than the UPD), the so-called overpotentially deposited (OPD) hydrogen atoms [29,30]. The latter is evidenced through the presence of two time constants in Figure 2b, where a higher frequency response is associated with the electron charge-transfer process and a lower frequency component is assigned to the OPD hydrogen coverage (θH) modulation with potential oscillation (see somewhat distorted semicircles in the Nyquist diagrams of Figure 2b and the corresponding equivalent circuit in Figure 3b). Most importantly, a significant detrimental impact of AcN on the kinetics of the HER process could be observed for the higher AcN concentration of 1.85 × 10⁻³ M, where the Rct charge-transfer resistance parameter rose ca. 7.6× and 14×, as compared to those values recorded in pure 0.5 M H2SO4, at the potential of −25 and −50 mV vs. RHE, correspondingly (Table 1). In addition, the significant presence of acetonitrile in the supporting solution becomes (generally) manifested through the reduction of the OPD of H corresponding capacitance (COPD H) and rising of the relevant resistance (ROPD H) parameters. However, it should also be noted that for cathodic overpotentials exceeding 75 mV, the low frequency impedance loop (the OPD H response) disappeared from the spectra, thus indicating that the coverage of OPD H had reached its saturation limit.
Figure 2c below presents the results of supplementary potentiostatic Tafel polarizations carried-out on polycrystalline Pt electrode in contact with 0.5 M H2SO4 and in the presence of acetonitrile, at two AcN concentrations. The calculated values of exchange current-density (j0) parameter for the HER reached: 3.8 × 10⁻⁴, 2.5 × 10⁻⁴ and 2.3 × 10⁻⁴ A cm−2 in pure H2SO4, in the presence of 1.85 × 10⁻⁵ and 1.85 × 10⁻³ M AcN, correspondingly (the recorded Tafel b slope values fluctuated between −40 and −50 mV·dec−1). It should be stated here that the calculated here exchange current–density and cathodic Tafel slope for the HER in pure H2SO4 are within the range that is commonly quoted for Pt in literature ([32] and other papers cited there). Most importantly, it could unquestionably be concluded that introduction of acetonitrile into sulphuric acid supporting solution causes a concentration-dependent and significant drop in the kinetics of the hydrogen evolution reaction.
In summary, it has to be stated that acetonitrile present at significant quantities (ca. 10−5–10−3 M) in sulphuric acid causes substantial detrimental effects to the kinetics of both UPD of H and HER electrode processes. The above is clearly the result of the Pt surface partial blockage by surface-adsorbed acetonitrile molecules. As originally argued by the group of Conway [13,14,15], in sulphuric acid solution acetonitrile molecule becomes reactively chemisorbed on platinum via a donative (-C≡N:) or an associative (=C=Ṇ:) reaction mechanism (along with anodic UPD H displacement by the AcN molecules). Then, in the chemisorbed state AcN was claimed to undergo reversibly reduction and re-oxidation processes [14] over the double-layer potential region, without being desorbed from the Pt surface (Equation (9)):

The latter process is clearly illustrated in the voltammetric profiles of Figure 1a (see the potential range 0.40–0.60 V there), Nyquist impedance plots of Figure 2d and the corresponding, UPD of H-like equivalent circuit illustrated in Figure 3c. Hence, for AcN-free H2SO4 the impedance plot is expressed by a straight (somewhat deviated from a 90° angle, see also reported values of φ parameter in caption to Table 1 and later Table 2) capacitive line. On the other hand, when acetonitrile is present in the electrolyte, a partial, somewhat distorted semicircle appears in the impedance spectra over a high frequency range along with a capacitive line recorded at intermediate/low frequency span. Hence, the recorded at the potential of 500 mV charge-transfer resistance, RF and pseudocapacitance, Cp parameter values came to 3.97 Ω·cm2 and 110 μF cm−2, respectively for [AcN] = 1.85 × 10⁻³ M (again, refer to Figure 1a and inset to Figure 2d).
Table 2.
Resistance and capacitance parameters for UPD of H, HER and AcN fairly reversible oxidation/reduction processes on Pt polyoriented single-crystal sphere electrode surface in contact with 0.1 M NaOH and in the presence of acetonitrile (at 293 K), obtained by fitting the equivalent circuits shown in Figure 3a through Figure 3c to the recorded impedance data (recorded values of dimensionless φ parameters for the CPE circuit components oscillated between 0.79–0.99 and 0.87–0.99 for UPD of H; impedance reproducibility usually below 10%; χ2 = 9 × 10⁻⁵ to 4 × 10⁻⁴).
2.3. Electrochemical Behaviour at Pt Polyoriented Single-Crystal Sphere Electrode in Pure 0.1 M NaOH and in the Presence of Acetonitrile
Electrochemical characteristics of Pt polyoriented single-crystal sphere electrode in pure 0.1 M NaOH and in the presence of acetonitrile are illustrated in Figure 4a through Figure 4d and in Table 2. Again, as in the case of acidic solution the impedance spectra for the process of UPD of H were characterized by a partial semicircle observable throughout the high and intermediate frequency range of the Nyquist plot and a straight line (though significantly departed from the theoretically assigned 90° angle) at appropriately low frequencies (Figure 4a). Hence, over the potential range 100–200 mV vs. RHE, the Cdl parameter values oscillated around 28–31 μF·cm−2 (typical literature value for flat and homogeneous electrodes). As the electrode potential rose from 100 to 200 mV, the H adsorption pseudocapacitance, CpH became reduced from 253 to 191 μF·cm−2. On the other hand, the corresponding charge-transfer resistance, RH parameter considerably increased from 49.20 (at 100 mV) to 81.31 Ω·cm2 at 200 mV. Its radical rise (as compared to the values recorded above in acidic electrolyte) was related to significantly slower kinetics of the UPD of H process in alkaline media.
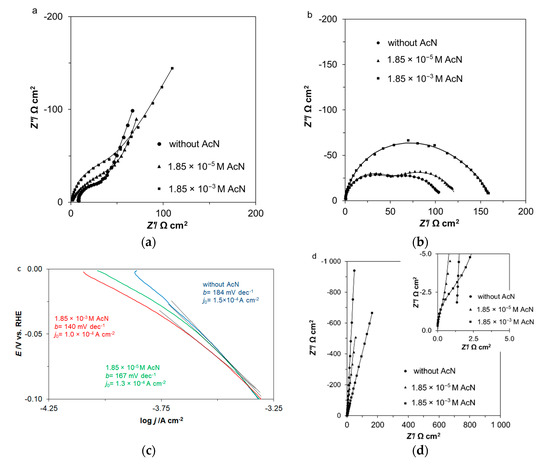
Figure 4.
(a) Complex-plane impedance plots for the process of UPD of H on Pt polyoriented single-crystal sphere electrode in contact with 0.1 M NaOH and in the presence of AcN for the concentrations indicated, recorded at 293 K for the potential of 100 mV vs. RHE. The solid lines correspond to representation of the data according to the equivalent circuit shown in Figure 3a; (b) as above, but for the process of HER, recorded at the potential of −50 mV vs. RHE. The solid lines correspond to representation of the data according to the equivalent circuit shown in Figure 3b; (c) quasi-potentiostatic cathodic polarization curves (recorded at a rate of 0.5 mV·s−1) under analogous conditions as above; (d) as in (a) above, but recorded over the double-layer charging potential range (500 mV vs. RHE), exhibiting AcN fairly reversible oxidation process. The solid lines correspond to representation of the data according to the equivalent circuit shown in Figure 3c.
Then, addition of acetonitrile into a base 0.1 M NaOH solution resulted in a radical increase of the recorded RH parameter, which for the potential span: 100–200 mV/RHE ranged: 95.40–129.3 Ω·cm2 ([AcN] = 1.85 × 10⁻⁵ M) and 101.0–672.1 Ω·cm2 for the AcN concentration of 1.85 × 10⁻³ M. Simultaneously, the CpH parameter considerably declined at the corresponding potentials, e.g., at 200 mV from an initial value of 191 μF·cm−2 in AcN-free sodium hydroxide to reach 125 μF·cm−2 for the AcN content of 1.85 × 10⁻³ M. Moreover, introduction of acetonitrile did not make any impact on the recorded double-layer capacitance parameter (see Table 2 for details).
As previously elaborated on for acidic solution, in NaOH the kinetics of the HER also became significantly impeded by the presence of AcN in the electrolyte (Table 2, Figure 4b). For example, at higher acetonitrile concentration (1.85 × 10⁻³ M), the Rct resistance parameter rose by ca. 1.3× and 5.3×, as compared to those values recorded in unmodified 0.1 M NaOH, at the potentials of −25 and −125 mV vs. RHE, respectively (Table 2). In contrast to the behavior in the acidic solution, the presence of acetonitrile in the alkaline electrolyte did not reveal clear dependence of the low frequency time constant (the OPD of H capacitance and resistance parameters). The latter was predominantly a combined effect of radically slower kinetics of the HER and the UPD of H processes at the Pt electrode surface carried-out under alkaline environment.
Analogously to Figure 2c, Figure 4c shows the potentiostatic Tafel polarization plots obtained at the polycrystalline Pt electrode surface, but in contact with 0.1 M NaOH and in the presence of acetonitrile, at two indicated AcN concentrations. Here, the calculated values of the j0 parameter for the HER came to: 1.5 × 10⁻⁴, 1.3 × 10⁻⁴ and 1.0 × 10⁻⁴ A cm−2 in pure NaOH, in the presence of 1.85 × 10⁻⁵ and 1.85 × 10⁻³ M AcN, respectively (the recorded Tafel slope values varied between −140 and −184 mV·dec−1). Again, addition of acetonitrile into sodium hydroxide resulted in significant deterioration of the HER kinetics.
As previously argued for the acidic solution, similar reactive chemisorption mechanism for AcN molecule at Pt could be drawn for the alkaline electrolyte. Hence, in the presence of acetonitrile the Nyquist impedance plots of Figure 4d (including high-frequency partial semicircles observed in inset to this figure) could again be referred to the process of AcN reversible oxidation/reduction that occurs at the reference potential of 500 mV/RHE. Here, the RF and Cp parameter values came to 3.39 Ω·cm2 and 75.5 μF·cm−2, respectively for [AcN] = 1.85 × 10⁻³ M (also refer to Figure 1b and Table 2 for details).
3. Experimental
3.1. Solutions
High-purity electrolytes were prepared from water obtained from an 18.2 MΩ Milli-Q UV water purification system manufactured by Millipore/Merck. Aqueous 0.5 M H2SO4 was made up from extra-high purity sulphuric acid (SEASTAR Chemicals), whereas 0.1 M NaOH supporting solution was prepared from Alfa Aesar, 99.996% NaOH pellets. Then, appropriate amounts of acetonitrile (electronic grade, 99.999% trace metals basis, Sigma-Aldrich) were introduced (by eppendorf micro-pipettes) to prepare solutions in the above two supporting electrolytes, at two concentrations, namely: 1.85 × 10⁻⁵ and 1.85 × 10⁻³ M AcN. Prior to conducting electrochemical experiments, all solutions were de-aerated with high-purity argon (6.0 research grade Ar supplied by Linde), the flow of which was then sustained above the solutions during the impedance measurements.
3.2. Equipment, Electrochemical Cell, and Electrodes Employed
Both impedance, as well as cyclic voltammetry measurements were carried-out by means of a Solartron 1255 HF frequency response analyzer (FRA) in conjunction with a SI 1287 Solartron electrochemical interface (EI) unit. The instruments were controlled by ZPlot and CorrWare software packages for Windows, version 2.9 (Scribner Associates, Inc., Southern Pines, NC, USA). The generator provided an output signal of 5 mV in amplitude and the frequency range was typically swept between 1.0 × 10⁵ and 1.0 or 0.5 Hz. The voltammetric polarizations were conducted over controlled ranges of the working-electrode potential, in the H UPD region or at more positive potentials on the Pt electrode surface, at a sweep-rate s of 50 mV·s−1. Data analysis was performed with ZView (CorrView) software for Windows, version 2.9 (Scribner Associates, Inc.), where the impedance spectra were fitted by means of a complex, non-linear, least-squares immittance fitting program, LEVM 6 ([33]). Complementary, quasi-potentiostatic cathodic polarization (Tafel) experiments for the HER were recorded at a scan-rate of 0.5 mV·s−1.
An electrochemical, Pyrex glass cell was used during the course of this work. The cell comprised three electrodes: a polyoriented single-crystal Pt sphere (99.9998% Pt purity, Johnson Matthey, Inc., London, UK, SA = 0.64 cm2) or a poly Pt wire (1.0 mm diameter, 99.9998% purity, Johnson Matthey, Inc., London, UK, SA = 1.16 cm2) used as a working electrode (WE), positioned in the cell’s central part, a reversible Pd hydrogen electrode: RHE (coiled 0.5 mm diameter Pd wire of 99.99% purity, Alfa Aesar, Ward Hill, MA, USA) as reference and a Pt (1.0 mm diameter wire, 99.9998% purity, Johnson Matthey, Inc., London, UK) counter electrode (CE), both placed in individual compartments. The palladium RHE before its use was cleaned in hot, concentrated sulphuric acid, followed by cathodic charging with hydrogen in 0.5 M H2SO4 solution until hydrogen bubbles became visible in the electrolyte. Its stability was intermittently checked by recording its potential shift in time. In addition, the counter electrode was flame-annealed prior to its use, whereas the working Pt electrodes were subjected to flame-annealing, followed by cooling in air and protecting the surface by a droplet of ultra-pure water before every single measurement. Finally, before each series of experiments, the electrochemical cell was disassembled and soaked in hot sulphuric acid for at least 3 h. After having been cooled to about 30–35 °C, the cell was carefully rinsed with Millipore ultra-pure water.
4. Conclusions
Application of AC impedance spectroscopy (and supporting quasi-potentiostatic Tafel polarizations) to study the influence of acetonitrile (an important industrial solvent and possible fuel-cell and electrolyzer system contaminant) on the kinetics of UPD of H and HER processes examined on polycrystalline (and polyoriented single-crystal sphere) Pt electrodes under acidic and alkaline conditions provided confirmation of significant and detrimental role of platinum-electrosorbed acetonitrile molecules on the rates of underpotential deposition of hydrogen and hydrogen evolution reactions.
Although there is no voltammetric or impedance-based evidence for involvement of UPD H atoms or hydrogen produced by the Faradaic hydrogen evolution reaction in the process of acetonitrile further reduction (possibly to a final product of ethylamine: CH3-CH2-NH2), the resulted significant inhibition of the HER in both studied solutions suggest that acetonitrile (or its reduction product/s) are still extensively adsorbed on the Pt surface under employment of moderate cathodic polarizations.
Author Contributions
Conceptualization, B.P. and T.M.; methodology, B.P.; investigation, M.L. and T.M.; data curation, T.M. and M.L.; writing—original draft preparation, B.P.; editing, B.P. and T.M.; supervision, L.S. All authors have read and agreed to the published version of the manuscript.
Funding
Project financially supported by Minister of Science and Higher Education in the range of the program entitled “Regional Initiative of Excellence” for the years 2019–2022, Project No. 010/RID/2018/19, amount of funding 12,000,000 PLN.
Acknowledgments
Mateusz Luba would also like to acknowledge a scholarship from the program Interdisciplinary Doctoral Studies in Bioeconomy (POWR.03.02.00-00-1034/16-00), funded by the European Social Fund.
Conflicts of Interest
The authors declare no conflict of interest.
References
- Conway, B.E.; Bai, L. Determination of adsorption of OPD H species in the cathodic hydrogen evolution reaction at Pt in relation to electrocatalysis. J. Electroanal. Chem. Interfac. Electrochem. 1986, 198, 149–175. [Google Scholar] [CrossRef]
- Herrero, E.; Buller, L.J.; Abruña, H.D. Underpotential Deposition at Single Crystal Surfaces of Au, Pt, Ag and Other Materials. Chem. Rev. 2001, 101, 1897–1930. [Google Scholar] [CrossRef]
- Schlaup, C.; Horch, S. Study of underpotential deposited Cu layers on Pt(111) and their stability against CO and CO2 in perchloric acid. Phys. Chem. Chem. Phys. 2013, 15, 19659. [Google Scholar] [CrossRef]
- Eftekhari, A. Electrocatalysts for hydrogen evolution reaction. Int. J. Hydrog. Energy 2017, 42, 11053–11077. [Google Scholar] [CrossRef]
- Santos, D.M.F.; Sequeira, C.A.C.; Figueiredo, J.L. Hydrogen production by alkaline water electrolysis. Quím. Nova 2013, 36, 1176–1193. [Google Scholar] [CrossRef]
- Dubouis, N.; Grimaud, A. The hydrogen evolution reaction: From material to interfacial descriptors. Chem. Sci. 2019, 10, 9165–9181. [Google Scholar] [CrossRef]
- Reshetenko, T.V.; St-Pierre, J. Study of the acetonitrile poisoning of platinum cathodes on proton exchange membrane fuel cell spatial performance using a segmented cell system. J. Power Sources 2015, 293, 929–940. [Google Scholar] [CrossRef]
- Briega-Martos, V.; Costa-Figueiredo, M.; Orts, J.M.; Rodes, A.; Koper, M.T.M.; Herrero, E.; Feliu, J.M. Acetonitrile adsorption on Pt single-crystal electrodes and its effect on oxygen reduction reaction in acidic and alkaline aqueous solutions. J. Phys. Chem. C 2019, 123, 2300–2313. [Google Scholar] [CrossRef]
- Ahlberg, E.; Friel, M. The cathodic polarization of iron in acidic acetonitrile-water solutions. Electrochim. Acta 1989, 34, 771–780. [Google Scholar] [CrossRef]
- Ledezma-Yanez, I.; Diaz-Morales, O.; Figueiredo, M.C.; Koper, M.T.M. Hydrogen oxidation and hydrogen evolution on a platinum electrode in acetonitrile. ChemElectroChem 2015, 2, 1612–1622. [Google Scholar] [CrossRef]
- Smiljanić, M.L.J.; Srejić, I.L.J.; Marinović, V.M.; Rakočević, Z.L.; Štrbac, S.B. Inhibiting effect of acetonitrile on oxygen reduction on polycrystalline Pt electrode in sodium chloride solution. Hem. Ind. 2012, 66, 327–333. [Google Scholar] [CrossRef][Green Version]
- Srejić, I.; Smiljanić, M.; Rakočević, Z.; Štrbac, S. Oxygen reduction on polycrystalline Pt and Au electrodes in perchloric acid solution in the presence of acetonitrile. Int. J. Electrochem. Sci. 2011, 6, 3344–3354. [Google Scholar]
- Angerstein-Kozlowska, H.; Macdougall, B.; Conway, B.E. Electrochemisorption and reactivity of nitriles at platinum electrodes and the anodic H desorption effect. J. Electroanal. Chem. 1972, 39, 287–313. [Google Scholar] [CrossRef]
- Morin, S.; Conway, B.E. Surface structure dependence on single-crystal Pt surfaces. J. Electroanal. Chem. 1994, 376, 135–150. [Google Scholar] [CrossRef]
- Morin, S.; Conway, B.E.; Edens, G.J.; Weaver, M.J. The reactive chemisorption of acetonitrile on Pt(111) and Pt(100) electrodes as examined by in situ infrared spectroscopy. J. Electroanal. Chem. 1997, 421, 213–220. [Google Scholar] [CrossRef]
- Waldrup, S.B.; Williams, C.T. Acetonitrile adsorption on polycrystalline platinum: An in situ investigation using sum frequency spectroscopy. J. Phys. Chem. C 2008, 112, 219–226. [Google Scholar] [CrossRef]
- Baldelli, S.; Mailhot, G.; Ross, P.; Shen, Y.-R.; Somorjai, G.A. Potential dependent orientation of acetonitrile on platinum (111) electrode surface studied by sum frequency generation. J. Phys. Chem. B 2001, 105, 654–662. [Google Scholar] [CrossRef]
- Rudnev, A.V.; Molodkina, E.B.; Danilov, A.I.; Polukarov, Y.M.; Berna, A.; Feliu, J.M. Adsorption behavior of acetonitrile on platinum and gold electrodes of various structures in solution of 0.5 M H2SO4. Electrochim. Acta 2009, 54, 3692–3699. [Google Scholar] [CrossRef]
- Pašti, I.A.; Marković, A.; Gavrilov, N.; Mentus, S.V. Adsorption of acetonitrile on platinum and its effects on oxygen reduction reaction in acidic aqueous solutions—combined theoretical and experimental study. Electrocatalysis 2016, 7, 235–248. [Google Scholar] [CrossRef]
- Nichols, R.J. Adsorption of Molecules at Metal Electrodes; Lipkowski, J., Ross, P.N., Eds.; VCH Publishers: New York, NY, USA, 1992; Chapter 7. [Google Scholar]
- Clavilier, J.; El Achi, K.; Petit, M.; Rodes, A.; Zamakhchari, M.A. Electrochemical monitoring of the thermal reordering of platinum single-crystal surfaces after metallographic polishing from the early stage to the equilibrium surfaces. J. Electroanal. Chem. 1990, 295, 333–356. [Google Scholar] [CrossRef]
- Clavilier, J.; Rodes, A.; El Achi, K.; Zamakhchari, M.A. Electrochemistry at platinum single crystal surfaces in acidic media: Hydrogen and oxygen adsorption. J. Chim. Phys. 1991, 88, 1291–1337. [Google Scholar] [CrossRef]
- Conway, B.E.; Tilak, B.V. Behavior and characterization of kinetically involved chemisorbed intermediates in electrocatalysis of gas evolution reactions. Adv. Catal. 1992, 38, 1–147. [Google Scholar]
- Pierozynski, B. Hydrogen evolution reaction at Pd-modified carbon fibre and nickel-coated carbon fibre materials. Int. J. Hydrog. Energy 2013, 38, 7733–7740. [Google Scholar] [CrossRef]
- Pierozynski, B.; Mikolajczyk, T. Hydrogen evolution reaction at Ru-modified carbon fibre in 0.5 M H2SO4. Int. J. Electrochem. Sci. 2012, 7, 9697–9706. [Google Scholar]
- Pierozynski, B.; Smoczynski, L. Kinetics of hydrogen evolution reaction at nickel-coated carbon fiber materials in 0.5 M H2SO4 and 0.1 M NaOH solutions. J. Electrochem. Soc. 2009, 156, B1045–B1050. [Google Scholar] [CrossRef]
- Morin, S.; Dumont, H.; Conway, B.E. Evaluation of the effect of two-dimensional geometry of Pt single-crystal faces on the kinetics of upd of H using impedance spectroscopy. J. Electroanal. Chem. 1996, 412, 39–52. [Google Scholar] [CrossRef]
- Conway, B.E.; Pierozynski, B.A.C. Impedance behaviour of processes involving adsorption and reactivity of guanidonium-type cations at Pt(100) surface. J. Electroanal. Chem. 2008, 622, 10–14. [Google Scholar] [CrossRef]
- Barber, J.H.; Conway, B.E. Structural specificity of the kinetics of the hydrogen evolution reaction on the low-index surfaces of Pt single-crystal electrodes in 0.5 M dm−3 NaOH. J. Electroanal. Chem. 1999, 461, 80–89. [Google Scholar] [CrossRef]
- Barber, J.; Morin, S.; Conway, B.E. Specificity of the kinetics of H2 evolution to the structure of single-crystal Pt surfaces, and the relation between opd and upd H. J. Electroanal. Chem. 1998, 446, 125–138. [Google Scholar] [CrossRef]
- Conway, B.E.; Barber, J.; Morin, S. Comparative evaluation of surface structure specificity of kinetics of UPD and OPD of H at single-crystal Pt electrodes. Electrochim. Acta 1998, 44, 1109–1125. [Google Scholar] [CrossRef]
- Nørskov, J.K.; Bligaard, T.; Logadottir, A.; Kitchin, J.R.; Chen, J.G.; Pandelov, S.; Stimming, U. Trends in the Exchange Current for Hydrogen Evolution. J. Electrochem. Soc. 2005, 152, J23. [Google Scholar] [CrossRef]
- Macdonald, J.R. Impedance Spectroscopy, Emphasizing Solid Materials and Systems; John Wiley & Sons: New York, NY, USA, 1987. [Google Scholar]
© 2020 by the authors. Licensee MDPI, Basel, Switzerland. This article is an open access article distributed under the terms and conditions of the Creative Commons Attribution (CC BY) license (http://creativecommons.org/licenses/by/4.0/).