Article

Understanding Surface Basic Sites of Catalysts: Kinetics and Mechanism of Dehydrochlorination of 1,2-Dichloroethane over N-Doped Carbon Catalysts

1
Shanghai Green Chemical Engineering Research Center, Shanghai Institute of Organic Chemistry, No. 345 Lingling Road, Shanghai 200032, China
2
Green Chemical Engineering Research Center, Shanghai Advanced Research Institute, Chinese Academy of Sciences, No. 99 Haike Road, Zhangjiang Hi-Tech Park, Pudong, Shanghai 201210, China
*
Author to whom correspondence should be addressed.
Catalysts 2020, 10(6), 707; https://doi.org/10.3390/catal10060707
Submission received: 5 May 2020 / Revised: 18 June 2020 / Accepted: 19 June 2020 / Published: 24 June 2020
(This article belongs to the Special Issue Progress in Catalytic Hydrodechlorination)

Abstract

:
The production of vinyl chloride (VCM) by pyrolysis of 1,2-dichloroethane (DCE) is an important process in the ethylene-based poly(vinyl chloride) industry. The pyrolysis is performed at temperatures above 500 °C, gives low conversions, and has high energy consumption. We have shown that N-doped carbon catalysts give excellent performances in DCE dehydrochlorination at 280 °C. The current understanding of the active sites, mechanism, and kinetics of DCE dehydrochlorination over N-doped carbon catalysts is limited. Here, we showed that pyridinic-N on a N-doped carbon catalyst is the active site for catalytic production of vinyl chloride monomer from DCE. The results of CO2 and DCE temperature-programmed desorption experiments showed that the pyridinic-N catalytic sites are basic, and the mechanism of dehydrochlorination on a N-doped carbon catalyst involves a carbanion. A kinetic study of dehydrochlorination showed that the surface reaction rate on the N-doped carbon catalyst was the limiting step in the catalytic dehydrochlorination of DCE. This result enabled clarification of the dehydrochlorination mechanism and optimization of the reaction process. These findings will stimulate further studies to increase our understanding of the relationship between the base strength and catalytic performance. The results of this study provide a method for catalyst optimization, namely modification of the amount of pyridinic-N and the base strength of the catalyst, to increase the surface reaction rate of DCE dehydrochlorination on N-doped carbon catalysts.

Graphical Abstract

1. Introduction

The vinyl chloride monomer (VCM) is a major chemical and is used mainly for manufacturing poly(vinyl chloride) (PVC). PVC, which is one of the most widely used thermoplastic resins, has a wide range of applications [1]. The PVC global production capacity in 2016 was ~41million tons, with an expected annual growth of 5%. There are two industrial processes for VCM production, namely pyrolysis of 1,2-dichloroethane (DCE) and acetylene hydrochlorination. The conventional pyrolysis of DCE gives a VCM with low conversion rate 50–60% and selectivity 95–99% at 500–550 °C [2]. A high reaction temperature results in high energy consumption and coke formation. This leads to mass and heat transfer limitations and causes unprofitable increases in the reactor pressure [3,4]. Therefore, many efforts are ongoing to search for a catalytic dehydrochlorination of DCE.
Various catalysts for DCE conversion to VCM have been studied, e.g., metal oxides and chlorides, and molecular sieves, to enable DCE pyrolysis at 300–400 °C, but the catalysts were rapidly deactivated and unsuitable for industry [5,6,7,8,9,10,11,12]. Yozo and co-workers first reported that a polyacrylonitrile-based active carbon fiber could catalyze dehydrochlorination of DCE into VCM over 300 °C, but catalytic activity fast decreased [13]. In recent years, with the joint efforts of the researchers, investigation of N-doped carbon catalyst made great progress in dehydrochlorination of DCE, [14,15,16,17]. The achievement of N-doped carbon catalyst in dehydrochlorination of DCE motivated efforts to further optimize the catalyst instead of the pyrolysis of DCE in industry. Recently, we reported that a N-doped coal activated carbon (N@AC) catalyst prepared by a simple method efficiently catalyze DCE dehydrochlorination to VCM [18]. The catalyst was stable and gave DCE conversions of 80–90% and high VCM selectivity greater than 99% at 250–300 °C, exhibiting a great feasibility in the industry. The preparation and reactivity of the catalyst were investigated emphatically, but active site of catalyst was simply discussed. The mechanism and kinetics of dehydrochlorination over N-doped catalysts had not been studied, which were very critical for the further optimization of catalyst. Although DCE dehydrochlorination is a classical ß-elimination reaction following the biomolecular elimination (E2), the reaction rate is closely related to the different kinds and concentrations of the base catalysts. In this paper, we detailed the mechanism and kinetics of DCE dehydrochlorination over N-doped carbon catalysts for further understanding surface basic sites of catalysts. We selected several representative nitrogen compounds as precursors for the preparation of N@AC catalysts with same nitrogen contents. The catalysts gave similar catalytic performances in dehydrochlorination. Further investigation showed that the dehydrochlorination performance was related to the nitrogen precursor content and the calcination temperature rather than the nitrogen precursor species. The nitrogen precursor content and calcination temperature determined the type and amount of pyridinic-N active sites. Temperature-programmed desorption (TPD) of CO2 and DCE showed that the catalytic pyridinic-N sites were basic and the mechanism of dehydrochlorination on the N-doped carbon catalysts involved a carbanion. A kinetic study of DCE dehydrochlorination showed that the surface reaction rate on the N@AC catalyst was the limiting step in the catalytic dehydrochlorination of DCE. These results deepen our understanding of the mechanism of dehydrochlorination and will enable optimization of the reaction process and reactor.

2. Results

2.1. Characterization and Performances of N@AC Catalysts

This study of DCE dehydrochlorination is based on our previous work, and details of characterization of the N@AC catalysts are available in our previously published paper [19]. The textural properties of the catalysts were investigated by performing N2 adsorption–desorption isothermal analysis. The N@AC catalysts contained mainly micropores (<2 nm) and small mesopores (2–4 nm). The total specific surface areas (650–1000 m2 g−1), specific volumes (0.34–0.49 cm3 g−1), and micropore volumes (0.26–0.40 cm3 g−1) decreased significantly with increasing nitrogen content. X-ray diffraction (XRD) patterns showed a high degree of surface graphitization of the N@AC catalysts, and N-doping did not affect the diffraction peaks. Raman spectroscopy showed that the number of defects formed during graphitization increased with increasing number of nitrogen atoms on the N@AC catalyst surface. These defects can contribute to the catalytic activity. Transmission electron microscopy (TEM) and high-resolution transmission electron microscopy (HRTEM) showed graphitization of the N@AC surface, in agreement with the XRD results. The catalyst chemical states were investigated by X-ray photoelectron spectroscopy (XPS). The high-resolution C1s XP spectra of the N@AC catalysts were divided into four individual peaks after fitting, i.e., C–C (~284.5 eV), C–N (~285.2 eV), C–O (~286.3 eV), and C=O (~288.3 eV). The high-resolution N1s spectrum showed that the nitrogen in the N@AC catalysts was present in three states, i.e., pyridinic-N (~398.5 eV), pyrrolic-N (~400.2 eV), and graphitic-N (~401.1 eV).
It has previously been reported that N-doped carbon can catalyze the dehydrochlorination of DCE to VCM. However, there have been no reports of the effects of the nitrogen precursor species on the catalytic performances of N-doped carbon catalysts. We selected seven nitrogen compounds as precursors, namely pyrrole, pyridine, acrylamide, melamine, urea, ammonium hydroxide (NH3°H2O), and imidazole. These compounds have different molecular sizes, molecular structures, solubilities, and boiling points. Table 1 showed that the actual nitrogen content doped on activated carbon was 0.6–0.7 wt.% when nitrogen atom content was controlled by 2.0 wt.% in the impregnation. As shown in Figure 1a, the seven N-doped catalysts gave similar catalytic performances, with DCE conversions of 50–55% at 260 °C; the DCE conversion over AC was only ~22%. The results showed that different N-resources had no obvious effect on the catalytic activity of the N@AC catalysts for DCE dehydrochlorination if there were same N contents doped on carbon. The results further implied that there should be a common catalytic active site generated in the seven N@AC catalysts in the calcination. As shown in Figure 2, there were the same nitrogen chemical states formed in the N@AC catalysts in the calcination, i.e., pyridinic-N, pyrrolic-N, and graphitic-N. It is certain that the catalytic activity of the N@AC catalysts is closely related to the existence of these nitrogen chemical states.
Figure 1b shows that the performances of the N@AC catalysts were much better than that of AC (dosage of pyrrole = 0). The DCE conversion over AC without an added nitrogen precursor was only ~22%. The DCE conversion increased from 22.0% to 61.8% with increasing pyrrole content from 0 to 40.0 g/100 g AC. The 30Pyrrole/AC (30 g pyrrole/100 g AC) catalyst gave the best catalytic performance in DCE dehydrochlorination, and the result was better than that achieved by pyrolysis of DCE [2]. When the pyrrole content was further increased, no increases in the N@AC catalytic activity were observed. This may be related to a decrease in the specific surface area [19]. Figure 1c shows that the catalytic activity of N@AC was sensitive to the calcination temperature. The DCE conversion increased as the calcination temperature increased from 250 to 850 °C, with only ~20% conversion at 250 °C. Initially, as the calcination temperature increased to 450 °C, the conversion increased gradually to ~35%. When the temperature was increased to 650 °C, the DCE conversion increased abruptly to ~65%. There was no obvious change in the conversion at temperatures between 650 and 850 °C. The results (Figure 1c) indicate that catalytic sites were formed on the N@AC surface at 250 to 650 °C, but catalytic site formation almost stopped at temperatures above 650 °C. Figure 1d shows that the DCE conversion decreased with increasing liquid hourly space velocity (LHSV). The DCE conversion increased from 39.9% to 83.6% with decreasing LHSV from 1.0 to 0.25 h−1. Figure 1e shows that the catalytic performance of N@AC improved, and the DCE conversion increased from 25.1% to 61.5%, with increasing reaction temperature from 240 to 260 °C. The DCE conversion reached 87.0% at 280 °C, which is better than that achieved by DCE pyrolysis at 500–550 °C. As shown in 
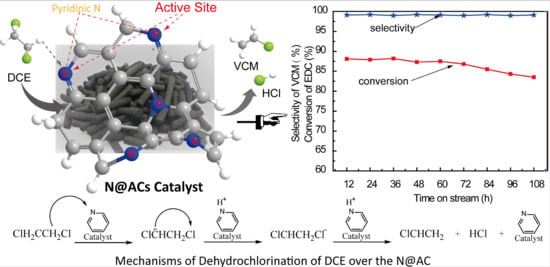
Figure 1f, the N@AC catalysts delivered stable performances, with DCE conversions greater than 80% and VCM selectivity greater than 99%, at 280 °C in 110 h.

2.2. Active Sites of N@AC Catalysts for DCE Conversion to VCM

The N@AC catalysts clearly gave excellent catalytic performances in DCE dehydrochlorination. It is important to identify the active sites involved in N@AC-catalyzed dehydrochlorination. The active sites were investigated by using an incipient wetness impregnation method to prepare N@AC catalysts with AC as the carrier and pyrrole as the nitrogen precursor. The AC was impregnated in 30% (w/w) pyrrole for 12 h and then the crude products were carbonized at 250, 450, 650, and 850 °C, respectively. The obtained N@AC catalysts are denoted by catalyst-1, catalyst-2, catalyst-3, and catalyst-4, respectively. The high-resolution N1s XP spectra of the N@AC catalysts are shown in Figure 3a,c. The spectrum of catalyst-1 (Figure 3a) contained only a pyrrolic-N peak (~400.2 eV); this indicates that pyrrole hardly decomposed at 250 °C. Figure 3c shows that the pyrrolic-N atom content was ~3.25%. However, the DCE conversion was only ~20% (Figure 3b), which indicates that pyrrolic-N did not provide the active sites for DCE dehydrochlorination.
Pyridinic-N formation on the N@AC catalyst surface gradually increased with increasing calcination temperature (Figure 3a). At 450 °C, i.e., catalyst-2, ~0.25% pyridinic-N was generated and the amount of pyrrolic-N decreased (Figure 3c). The DCE conversion increased to 35.3% from ~20%, which shows that pyridinic-N might provide active sites for DCE dehydrochlorination. When the calcination temperature was increased to 650 °C, ~0.60% pyridinic-N and 0.50% graphitic-N (~401.1 eV) were generated, but the amount of pyrrolic-N (~400.2 eV) decreased to 1.60% from 3.25% (Figure 3c). The DCE conversion over catalyst-3 suddenly increased to 61.2%, which implies that pyridinic-N and graphitic-N might be the active sites of N@AC for dehydrochlorination. When the calcination temperature was increased to 850 °C, a large amount of graphitic-N (~1.26%) was generated, and the amount of pyridinic-N only increased to about ~0.70% (Figure 3c). Although a large amount of graphitic-N was generated, catalyst-4 did not give an excellent performance. The DCE conversion was only 63.9% (Figure 3b), which is similar to that achieved with catalyst-3. This indicates that graphitic-N almost did not provide active sites for catalytic dehydrochlorination. Compared with pyrrolic-N and graphitic-N, pyridinic-N was obviously the main active for catalytic dehydrochlorination.
We further investigated whether pyridinic-N was critical in providing active sites for dehydrochlorination by preparing pyrrole-AC, pyridine-AC, and 10Pyrrole/AC and assessed their abilities to catalyze DCE dehydrochlorination. The pyrrole-AC and pyridine-AC were prepared by an incipient wetness impregnation and dry, not by calcination. In contrast, 10Pyrrole/AC was prepared under calcination. Because calcination did not occur, pyrrole-AC gave a poor catalytic performance, with ~20% DCE conversion. However, pyridine-AC gave an excellent catalytic performance, which strongly suggests that pyridinic-N is the critical active site for dehydrochlorination. The catalytic performance of 10Pyrrole/AC was similar to that of pyridine-AC, and pyridinic-N was generated under calcination. The XP spectra and catalytic performances of N@AC further show that pyridinic-N generated under calcination provides the N@AC active sites for dehydrochlorination.

2.3. Reaction Mechanism of N@AC-Catalyzed DCE Conversion to VCM

Further experiments were performed to determine why pyridinic-N provides the active sites for dehydrochlorination. There is one p-electron in pyridinic-N, provided to the aromatic π-system. Because of the role of pyridinic-N, the carbon matrix has a lone electron pair, which contributes to an increase of the electron-donating ability of the catalyst [20]. The introduction of pyridinic-type nitrogen species into the carbon network increases the basicity [21], and the derived carbon can be used as a solid basic catalyst [22]. The mechanism of the catalytic dehydrochlorination of DCE can be controlled by the basicity of the catalyst.
The surface basic properties of the N@AC catalysts were researched by CO2-TPD (Figure 4a). For comparison, the basic properties of AC were also investigated. According to literature reports, the desorption peaks at about 120–150 °C can be attributed to interactions between CO2 and weakly basic sites on the catalyst. The desorption peak temperature clearly shifted with increasing N-doping, which indicates that the N@AC surface basicity increased with increasing N-doped content. In addition, weak desorption peaks were observed at ~300 °C for the N@AC catalysts but not for AC. This indicates generation of much stronger basic sites on N@AC. The high-resolution N1s XP spectrum showed that pyridinic-N contributes to the basicity of the N@AC catalyst, and this improves the catalytic performance in DCE dehydrochlorination. The mechanism of dehydrochlorination was investigated by performing DCE-TPD (Figure 4b). TPD as an effective technology is often to directly compare the adsorption and activation of reactants on the surface of the different catalysts, and is used to explain the reaction mechanism. The temperature of desorption in the TPD diagram reflects the binding force of the adsorbed molecules and the catalyst surface. The peak area is related to the adsorption quantity. The desorption temperatures of DCE on AC was about 160 °C, but the corresponding temperature on the 30Pyrrole/AC catalyst was about 190 °C. The result of comparison shows that DCE is more likely to adsorb on N@AC than on AC (Figure 4b). The desorption peak areas of both samples confirmed the improved ability of N@AC to activate DCE molecules compared with that of AC; this is consistent with the activity data. As shown in Figure 4b, the pyridinic-N basic sited in N@AC can effectively adsorb and activate DCE to produce VCM.
On the basis of the above discussion, we propose the following reaction scheme for DCE dehydrochlorination to VCM on the pyridinic-N active sites of the N@AC catalyst (Figure 4c). First, a DCE molecule approaches the N@AC surface through internal diffusion. The C–H bond of the neighboring pyridinic-N is polarized and hydrogen interacts with the pyridinic-N basic site. Next, the C–H bond is cleaved to generate ClCHCH2Cl. Because of the high electronegativity of the Cl atom, the electron cloud of C is transferred to Cl to generate the intermediate state ClCHCH2Cl. The active intermediate states ClCHCH2Cl and pyridinic-NH+ react to form ClCHCH2 (VCM) and HCl, and N@AC is reduced. This completes DCE dehydrochlorination on the N@AC catalyst.

2.4. Kinetics of DCE Dehydrochlorination over N@AC Catalyst

To enable a deeper understanding of the dehydrochlorination mechanism, optimization of the reaction process parameters, and improvement of the reactor design, we investigated the kinetics of DCE dehydrochlorination over N@AC catalysts. The reaction formula was shown in Scheme 1.
DCE, VCM, and HCl are denoted by A, B, and C, respectively. In addition, the N@AC active site is denoted by σ.
In the intrinsic kinetic study, we investigated the following three reaction processes.
Absorption of DCE on N@AC:
A + σ A σ ,
Reaction on N@AC:
A σ B σ + C ,
Desorption of VCM from N@AC:
B σ B + σ ,
The following kinetic equations were derived by using the Langmuir adsorption model.
Adsorption rate equation:
( r ) = r A = k aA P A θ V k dA θ A ,  
where, r A is the net adsorption rate of A. k aA and k dA are the adsorption and desorption rate constants of A, respectively. P A is the partial pressure of A. θ V denotes the content of exposed active sites and θ A is the content of adsorption A.
Surface reaction rate equation:
( r ) = r S = k 1 θ A k 2 θ B P C ,
where, r S is net reaction rate. k 1 and k 2 are the forward and reverse reaction rate constants, respectively. P C is the partial pressure of C.
Desorption rate equation:
( r ) = r B = k dB θ B k aB P B θ V ,
where, r B is the net desorption rate. k dB and k aB are the desorption and adsorption rate constants of B, respectively.   P B is the partial pressure of B.
In the following equation:
K A = k aA / k dA ,   K = k 1 / k 2 ,   and   K B = k aB / k dB ,
If adsorption control is the rate-limiting step, the kinetic equation is derived as follows.
( r ) = r A = k aA P A θ V K dA θ A ,
The remaining steps are balanced, i.e.,
r S = k 1 θ A k 2 θ B P C = 0 , K = θ B P C / θ A ,
r B = k dB θ B k aB P B θ V = 0 , K B = θ B / P B θ V ,
θ A + θ B + θ V = 1 ,
Equations (7)–(10) were used to derive (11).
( r ) = r A = k aA P A k dA K B P B P C / K 1 + K B P B + K B P B P C / K ,
If the surface reaction is the rate-limiting step, the kinetic equation, which was derived by the same method as (11), is
( r ) = r S = k 1 K A P A k 2 K B P B P C 1 + K A P A + K B P B ,
If desorption is the rate-limiting step, the kinetic equation, which was derived by the same method as (11), is
( r ) = r B = k dB K K A P A / P C k aB P B 1 + K A P A + K K A P A / P C ,
If the initial amount of DCE is 1 mol and the DCE conversion is XA, XA mol of VCM and HCl, respectively, are generated, the DCE surplus is (1 − XA) mol, the total amount of materials after the reaction is (1 + XA) mol, and PA and PB can be converted to XA.
P A = 1 X A 1 + X A ,
P B = X A 1 + X A ,
Finally, by substituting (14) and (15) in (11)–(13), respectively, three reaction rate equations, i.e., (16)–(18) are obtained.
( r ) = r A = k aA K ( 1 X A 2 ) k dA K B X A 2 K ( 1 + X A ) 2 + K B X A ( 1 + X A ) + K B X A 2 ,
( r ) = r S = k 1 K A ( 1 X A 2 ) k 2 K B X A 2 ( 1 + X A ) 2 + K A ( 1 X A 2 ) + K B X A ( 1 + X A ) ,
( r ) = r B = k dB K K A ( 1 X A 2 ) k aB X A 2 X A ( 1 + X A ) + K A ( 1 X A ) X A + K K A ( 1 X A 2 ) ,
To solve the kinetic equations, it is necessary to determine a series of XA values (DCE conversions) at different W / F A values (the ratio of the catalyst quantity to the DCE flow) by performing DCE dehydrochlorination experiments. We used the data to solve the kinetic equations, with the help of computer software. To obtain an intrinsic kinetic equation that was as accurate as possible, we had to minimize negative effects from sources such as the reactor, catalyst loading, and external and internal diffusion of DCE. Figure 5a shows that the value of XA tended to be constant, which indicates that external diffusion had been eliminated, when the value of FA was greater than 0.04 mol h−1. Figure 5b shows that DCE conversion gradually increased with decreasing amount of catalyst. When the mesh was greater than 120, the DCE conversion tended to be constant, which indicates that internal diffusion was eliminated. To eliminate diffusion, kinetic experiments were performed at 250–290 °C. The experimental dynamic data are shown in Table 2. The results show that the catalytic performance in DCE dehydrochlorination clearly increased with increasing W/FA.
In these experiments, the DCE conversions were all greater i.e., >15%. On the basis of theoretical and experimental results, this reactor was defined as an integral reactor, and can be represented by
W F A , 0 = 0 x A d x A ( r A ) ,
Substitution of Equations (16), (17), and (18) into (19) gives the following kinetic equations:
W F A , 0 = 0 x A [ K ( 1 + X A ) 2 + K B X A ( 1 + X A ) + K B X A 2 k aA K ( 1 X A 2 ) k dA K B X A 2 ] d x A ,
W F A , 0 = 0 x A [ ( 1 + X A ) 2 + K A ( 1 X A 2 ) + K B X A ( 1 + X A ) k 1 K A ( 1 X A 2 ) k 2 K B X A 2 ] d x A ,
W F A , 0 = 0 x A [ X A ( 1 + X A ) + K A ( 1 X A ) X A + K K A ( 1 X A 2 ) k dB K K A ( 1 X A 2 ) k aB X A 2 ] d x A ,
The computer software 1stOpt was used to fit Equations (20)–(22) to obtain the parameters KA, KB, and k by using the data in Table 2. The fitting was carried out with the Universal Global Optimization Algorithm (UGO). The fitting results show that some of the parameters KA, KB, and k in Equations (20) and (22) had negative values. This indicates that the hypothetical kinetic models (20) and (22) are not reasonable. The surface reaction rate is therefore the limiting step in DCE dehydrochlorination over N@AC. The fitting results for Equation (21) are shown in Table 3. The R2 value is close to 1.0, which indicates that the intrinsic kinetic process followed this dynamic model. The data in Table 3 show that k was clearly lower than KA and KB, which shows that the surface reaction rate was far slower than the rates of adsorption on N@AC and desorption from N@AC. The intrinsic kinetic rate greatly increased with increasing surface reaction rate. Figure 5c shows that the calculated value of W / F A is close to the experimental value, which shows that the kinetic model is appropriate, and supports the hypothesis that the surface reaction is the controlling step in DCE dehydrochlorination over N@AC.
The linear equation ln k = ( E R ) 1 T + ln A was used to determine the activation energy of DCE dehydrochlorination over N@AC catalysts and the parameter A, with the help of 1stOpt software. The Arrhenius equation was then obtained. Figure 5d and the data in Table 4 show good linear correlations between 1/T and lnk, lnKA, and lnKB, with correlation coefficients of 0.9979, 0.9897, and 0.9986, respectively. The kinetic data in the temperature range 250–290 °C therefore fit the reaction mechanism model fairly well. The Arrhenius equation, k = A exp ( E R T ) , was used to determine the activation energy of DCE dehydrochlorination over N@AC, and gave a value of 254.09 kJ mol−1 in the temperature range 250–290 °C; k, KA and KB can be expressed as:
k = 7.89 × 10 23 exp ( 2.54 × 10 5 / R T ) , k A = 1.62 × 10 33 exp ( 3.34 × 10 5 / R T ) ,   k B = 4.99 × 10 35 exp ( 3.67 × 10 5 / R T ) ,
This kinetic study enables a deeper understanding of the mechanism of DCE dehydrochlorination over N@AC. The surface reaction is the rate-limiting step in DCE dehydrochlorination. DCE adsorption on and desorption from the N@AC surface are faster than the surface reaction.

3. Materials and Methods

3.1. Materials

In this work, activated carbon (AC) (coal-based activated carbon, neutral,) was provided by Ningxia Guanghua Activated Carbon Co., Ltd. DCE (AR), pyrrole (AR), pyridine (AR), acrylamide (AR), melamine (AR), urea (AR), imidazole (AR), ammonium hydroxide (25% aqueous solution), and ethanol (AR) were purchased from the Shanghai Taitan Technology Co., Ltd. Acetylene (99.99%) and nitrogen (99.99%) gas were purchased from the Shanghai Lvming Gas Co., Ltd. All of the commercial chemical regents were directly used in the experiments without extra purification.

3.2. Catalyst Preparation

In this work, N@AC catalysts were prepared with AC as the carrier and N-resources as the precursors by an incipient wetness impregnation technique [23]. The precursors, i.e., pyrrole, pyridine, acrylamide, melamine, urea, NH3.H2O and imidazole at a nitrogen atom content of 2.0 wt.% (precursor/AC) were used to prepare nitrogen compound solutions. The appropriate amount of AC was added to the nitrogen solution; the impregnation time was 12 h. The mixture was dried at 120 °C for 8 h. The dried mixture was heated to 650 °C at a heating rate of 2.5 °C min−1 and maintained for 6 h in a nitrogen atmosphere to obtain the N@AC catalysts. The samples were denoted by x/AC (x is pyrrole, pyridine, acrylamide, melamine, urea, NH3.H2O, and imidazole). The same method was used, with the amount of pyrrole being varied from 5.0 to 20.0 g, while keeping the AC content constant (50 g), to obtain N@AC samples, which were denoted by yPyrrole/AC (y is the content of pyrrole to AC). The dosage of pyrrole, i.e., 5, 10, 15, and 20, are corresponding to 10Pyrrole/AC, 20 Pyrrole/AC, 30 Pyrrole/AC, and 40 Pyrrole/AC, respectively. The same method was used, at various calcination temperatures, i.e., 250, 450, 650, and 850 °C, to obtain N@AC catalysts, which were denoted by catalyst-1, catalyst-2, catalyst-3, and catalyst-4.

3.3. Catalyst Characterization

XPS was performed with an Axis Ultra spectrometer with monochromatized Al Kα X-rays as the excitation source (225 W) (EscaLab 250Xi, Thermo Fisher Scientific Company, USA) and the data analysis was by the Avantage software from Thermo. TPD was performed with CO2 as the probe molecule. In the standard procedure, the fresh sample was calcined at 650 °C under He steam for 40 min and then cooled to 50 °C; 10% CO2–He was injected into the steam for 60 min at 50 °C, until saturation was reached. The system was purged with He for 60 min at 50 °C, the sample was heated at a rate of 10 °C min−1 in He (10 mL min−1), and the change in the desorbed CO2 concentration was monitored by an online thermal conductivity detector. DCE-TPD was performed by using the same method (ASAP 2720, Micromeritics Company, USA).

3.4. Catalyst Activity Evaluation

Catalytic performance was evaluated in a fixed-bed micro-reactor made of quartz tube (i.d. 8 mm). The reaction temperature was controlled by electric furnace (Y-Feng Co., Ltd., Shanghai, China). The DCE flow rate was controlled by a piston pump (2ZB-1L10, Weixin Co., Ltd., Beijing, China). First, nitrogen gas was used to purge the catalyst (1.0 g) in the reactor to remove water and air for 1 h before the reaction starts. Then DCE was fed into the heated reactor at a flow rate of 1.0 mL h−1 at a set reaction temperature. In the normal process of reaction, nitrogen flow rate was controlled at 5.0 mL min−1 to eliminate the external diffusion. The catalyst size is about 100–200 um to eliminate internal diffusion. The unreacted DCE liquid was collected after condensation and weighed to calculate the conversion of DCE. The gaseous product was regularly injected to a gas chromatography to analyze the gas phase composition (Shimadzu GC-2014, Japan).
The conversion of DCE (XDCE) and the selectivity to VCM (SVCM) were calculated as follows:
X DCE = ρ × V m ρ × V × 100 %
S VCM = × 100 %  
where, ρ is the density of DCE, V is the volume of DCE fed in the reactor, m is the quality of unreacted DCE, is the mole fraction of VCM in the gas mixture which is analyzed in gas chromatography.

4. Conclusions

The active sites, mechanism, and kinetics of N-doped carbon catalysts, i.e., N@AC, were studied in detail. Seven AC catalysts, which were doped with different nitrogen precursors at the same nitrogen atom content, were prepared. The seven catalysts gave similar catalytic performances, which implies that the type and content of active sites on the seven N-doped carbon catalysts were the same. The study of XPS analysis and catalytic activity showed that pyridinic-N was the active site. This explains why the seven catalysts gave similar catalytic performances. CO2-TPD and DCE-TPD showed that the pyridinic-N sites were basic. The mechanism of DCE dehydrochlorination over the N-doped carbon catalyst was investigated and a carbanionic reaction was proposed. To further understand the mechanism and enable optimization of the reaction process and reactor, the kinetics of DCE dehydrochlorination was investigated in more detail. The results showed that the surface reaction was the rate-limiting step. DCE adsorption was faster than VCM desorption over N@AC, and both were faster than the surface reaction. These works will facilitate further experimental and theoretical research to illustrate the relationship between the basic properties of N@AC and the catalytic performance. These results also provide a new method for optimizing the catalytic activity, i.e., by increasing the amount of pyridinic-N and the base strength, to improve the catalytic performance in dehydrochlorination. The excellent performances and environmental friendliness of N-doped carbon catalysts will encourage experimental studies to develop new applications in chemical reactions.

Author Contributions

As for authors, Z.S. designed, conceived the experiments and finished the manuscript; Y.H., Y.L. and Y.Q. were responsible for the experiments, i.e., catalysts preparation, catalysts characterization and catalysts activity evaluation; P.X. and H.Z. provided help with analysis of data and the revise of the manuscript; B.J. was corresponding author in charge of supervising the work and provided help with the revise of the manuscript. All authors have read and agreed to the published version of the manuscript.

Funding

This research was funded by the National Natural Science Foundation of China (grant no. 21372234) and by the Key Research Program of the Chinese Academy of Sciences (grant no. ZDRW-CN-2016-1).

Conflicts of Interest

There are no conflicts declare.

References

  1. Zhang, J.; Liu, N.; Li, W.; Dai, B. Progress on cleaner production of vinyl chloride monomers over non-mercury catalysts. Front. Chem. Sci. Eng. 2011, 5, 514–520. [Google Scholar] [CrossRef]
  2. Liu, R.; Wu, D.; Feng, X.; Muellen, K. Nitrogen-Doped Ordered Mesoporous Graphitic Arrays with High Electrocatalytic Activity for Oxygen Reduction. Angew. Chem. Int. Ed. 2010, 49, 2565–2569. [Google Scholar] [CrossRef]
  3. Mochida, I.; Tsunawaki, T.; Sotowa, C.; Korai, Y.; Higuchi, K. Coke Produced in the Commercial Pyrolysis of Ethylene Dichloride into Vinyl Chloride. Ind. Eng. Chem. Res. 1996, 35, 3803–3807. [Google Scholar] [CrossRef]
  4. Berlin, A.; Vercelli, B.; Zotti, G. Polythiophene-and Polypyrrole-based Mono- and Multilayers. Polym. Rev. 2008, 48, 493–530. [Google Scholar] [CrossRef]
  5. Scharfe, M.; Lira-Parada, P.A.; Paunovic, V.; Moser, M.; Amrute, A.P.; Perez-Ramirez, J. Oxychlorination–Dehydrochlorination Chemistry on Bifunctional Ceria Catalysts for Intensified Vinyl Chloride Production. Angew. Chem. Int. Ed. 2016, 55, 3068–3072. [Google Scholar] [CrossRef] [PubMed]
  6. Bai, S.; Dai, Q.; Chu, X.; Wang, X. Dehydrochlorination of 1,2-dichloroethane over Ba-modified Al2O3 catalysts. RSC Adv. 2016, 6, 52564–52574. [Google Scholar] [CrossRef]
  7. Testova, N.V.; Shalygin, A.S.; Glazneva, T.S.; Paukshtis, E.A.; Parmon, V.N. Unusual 1,2-dichloroethane dehydrochlorination over ruthenium-oxychloride catalyst. Catal. Commun. 2015, 67, 95–97. [Google Scholar] [CrossRef]
  8. Van der Heijden, A.W.A.M.; Mens, A.J.M.; Bogerd, R.; Weckhuysen, B.M. Dehydrochlorination of Intermediates in the Production of Vinyl Chloride over Lanthanum Oxide-Based Catalysts. Catal. Lett. 2008, 122, 238–246. [Google Scholar] [CrossRef] [Green Version]
  9. Kaminska, I.I.; Lisovytskiy, D.; Valentin, L.; Calers, C.; Millot, Y.; Kowalewski, E.; Srebowata, A.; Dzwigaj, S. Influence of pretreatment and reaction conditions on the catalytic activity of HAlBEA and CoHAlBEA zeolites in vinyl chloride formation from 1,2-dichloroethane. Micropor. Mesopor. Mater. 2018, 266, 32–42. [Google Scholar] [CrossRef]
  10. Srebowata, A.; Baran, R.; Kaminska, I.I.; Onfroy, T.; Krafft, J.M.; Dzwigaj, S. Catalytic hydrogen-assisted dehydrochlorination of 1,2-dichloroethane over cobalt-containing beta zeolite. Catal. Today 2015, 251, 73–80. [Google Scholar] [CrossRef]
  11. Srebowata, A.; Baran, R.; Casale, S.; Kaminska, I.I.; Lomot, D.; Lisovytskiy, D.; Dzwigaj, S. Catalytic conversion of 1,2-dichloroethane over bimetallic Cu–Ni loaded BEA zeolites. Appl. Catal. B Environ. 2014, 152, 317–327. [Google Scholar] [CrossRef]
  12. Baran, R.; Srebowata, A.; Kaminska, I.I.; Lomot, D.; Dzwigaj, S. Catalytic activity of HAlBEA and NixHAlBEA zeolites in hydrogen-assisted dehydrochlorination of 1,2-dichloroethane into vinyl chloride monomer. Micropor. Mesopor. Mater. 2013, 180, 209–218. [Google Scholar] [CrossRef]
  13. Sotowa, C.; Watanabe, Y.; Yatsunami, S.; Korai, Y.; Mochida, I. Catalytic dehydrochlorination of 1,2-dichloroethane into vinyl chloride over polyacrylonitrile-based active carbon fiber. Appl. Catal. A Gen. 1999, 180, 317–323. [Google Scholar] [CrossRef]
  14. Xu, J.; Zhao, X.; Wang, A.; Zhang, T. Synthesis of nitrogen-doped ordered mesoporous carbons for catalytic dehydrochlorination of 1,2-dichloroethane. Carbon 2014, 80, 610–616. [Google Scholar] [CrossRef]
  15. Zhao, W.; Sun, M.; Zhang, H.; Dong, Y.; Li, X.; Li, W.; Zhang, J. Catalytic dehydrochlorination of 1,2-dichloroethane to produce vinyl chloride over N-doped coconut activated carbon. RSC Adv. 2015, 5, 104071–104078. [Google Scholar] [CrossRef]
  16. Dong, Y.; Zhao, W.; Han, Y.; Zhang, J.; Nian, Y.; Zhang, H.; Li, W. Dehydrochlorination of 1,2-dichloroethane over a tetraphenylphosphonium chloride-supported carbon catalyst. New J. Chem. 2018, 18729–18738. [Google Scholar] [CrossRef]
  17. Sun, Z.; Qin, Y.; Li, Q.; Liu, X.; Liu, Z.; Song, L.; Sun, Z. Supported structure-controlled graphitic carbon nitride catalyst for dehydrochlorination of 1,2-dichloroethane. Catal. Sci. Technol. 2018, 8, 5334–5343. [Google Scholar] [CrossRef]
  18. Zhao, H.; Chen, S.; Guo, M.; Zhou, D.; Shen, Z.; Wang, W.; Feng, B.; Jiang, B. Catalytic Dehydrochlorination of 1,2-Dichloroethane into Vinyl Chloride over Nitrogen-Doped Activated Carbon. ACS Omega 2019, 4, 2081–2089. [Google Scholar] [CrossRef]
  19. Shen, Z.; Zhao, H.; Liu, Y.; Kan, Z.; Xing, P.; Zhong, J.; Jiang, B. Mercury-free nitrogen-doped activated carbon catalyst: An efficient catalyst for the catalytic coupling reaction of acetylene and ethylene dichloride to synthesize the vinyl chloride monomer. React. Chem. Eng. 2018, 3, 34–40. [Google Scholar] [CrossRef]
  20. Feng, L.; Chen, Y.; Chen, L. Easy-to-Operate and Low-Temperature Synthesis of Gram-Scale Nitrogen-Doped Graphene and Its Application as Cathode Catalyst in Microbial Fuel Cells. ACS Nano 2011, 5, 9611–9618. [Google Scholar] [CrossRef]
  21. Bitter, J.H.; van Dommele, S.; de Jong, K.P. On the virtue of acid–base titrations for the determination of basic sites in nitrogen doped carbon nanotubes. Catal. Today 2010, 150, 61–66. [Google Scholar] [CrossRef]
  22. Van Dommele, S.; de Jong, K.P.; Bitter, J.H. Nitrogen-containing carbon nanotubes as solid base catalysts. Chem. Commun. 2006, 14, 4859–4861. [Google Scholar] [CrossRef] [PubMed] [Green Version]
  23. Li, X.; Wang, Y.; Kang, L.; Zhu, M.; Dai, B. A novel, non-metallic graphitic carbon nitride catalyst for acetylene hydrochlorination. J. Catal. 2014, 311, 288–294. [Google Scholar] [CrossRef]
Figure 1. Effects of (a) nitrogen precursor species and (b) nitrogen content on N@AC catalytic performance. Conditions: 260 °C, liquid hour space velocity (LHSV) 0.5 h−1, 1 atm. (c) Effect of calcination temperature on N@AC catalytic performance. Conditions: 30Pyrrole/AC, 260 °C, LHSV 0.5 h−1, 1 atm. (d) Effect of LSHV on N@AC catalytic performance. Conditions: 30Pyrrole/AC, 260 °C, 1 atm. (e) Effect of reaction temperature on N@AC catalytic performance. Conditions: 30Pyrrole/AC, LHSV 0.5 h−1, 1 atm. (f) N@AC catalyst stability tests. Conditions: 30Pyrrole/AC, 260 °C, LHSV 0.5 h−1, 1 atm.
Catalysts 10 00707 g001
Figure 2. The high-resolution N1s XP spectra of the different N-doped catalysts (a) Pyrrole/AC, (b) Pyridine/AC, (c) Acrylamide/AC, (d) Melamine/AC, (e)Urea/AC, (f) NH3.H2O/AC, (g) Imidazole/AC, and (h) AC.
Catalysts 10 00707 g002
Figure 3. (a) High-resolution N1s spectra of 30Pyrrole/AC catalysts calcinated at 250, 450, 650, and 850 °C. (b) 1,2-dichloroethane (DCE) conversion over N@AC catalysts calcinated at 250, 450, 650, and 850 °C. (c) Chemical states of nitrogen atoms in catalysts calcinated at 250, 450, 650, and 850 °C. (d) Effects of chemical state of nitrogen on catalytic dehydrochlorination performances. Reaction conditions: 260 °C, LHSV 0.5 h−1, 1 atm.
Catalysts 10 00707 g003
Figure 4. (a) CO2-TPD profiles of AC, 10Pyrrole/AC, and 30 Pyrrole/AC. (b) DCE -TPD profiles of AC and 30Pyrrole/AC. (c) Proposed reaction mechanism for DCE dehydrochlorination over N@AC catalysts. Reaction conditions: 260 °C, LHSV 0.5 h−1, 1 atm.
Catalysts 10 00707 g004
Scheme 1. Dehydrochlorination of 1,2-dichloroethane over N@AC catalyst.
Catalysts 10 00707 sch001
Figure 5. (a) Elimination of external diffusion. (b) Elimination of internal diffusion. (c) Comparison of calculated W/FA and experimental W/FA values. (d) Correlations between lnk, lnKA, lnKB and 1/T. Reaction conditions: 260 °C, LHSV 0.5 h−1, 1 atm.
Catalysts 10 00707 g005
Table 1. The nitrogen composition in the catalysts by X-ray photoelectron spectroscopy (XPS).
CatalystsTotal N (%) Pyridinic-N (%) Pyrrolic-N (%) Graphitic-N (%)
Pyrrole/AC0.680.280.300.10
Pyridine/AC0.630.290.240.10
Acrylamide/AC0.670.300.190.18
Melamine/AC0.620.290.170.16
Urea/AC0.640.280.190.17
NH3.H2O/AC0.660.290.220.15
Imidazole/AC0.660.300.240.12
AC0.24///
Table 2. Experimental dynamic data.
W/FA, 0290 °C XA (%)270 °C XA (%)250 °C XA (%)
80.3686.8162.6255.90
60.2776.9653.1040.43
48.2166.1045.2022.13
40.1859.3136.9019.20
34.4453.1033.0016.50
Table 3. UGO kinetic parameter fitting results.
T/°CkKAKBR2F
2500.03690.61100.11400.9988214.02
2700.269615.99003.00000.997926.75
2901.9756111.310035.08000.9985231.79
Table 4. Arrhenius equation fitting results.
E / J   m o l 1 AR-Square
K2.54 × 1057.89 × 10230.9979
KA3.34 × 1051.62 × 10330.9897
KB3.67 × 1054.99 × 10350.9986

