1. Introduction
The calculation of extinction coefficients via measured IR spectra is discussed in the literature in many ways, and there are a number of different approaches to determine quantitative data from the measured spectra. What all of these approaches have in common is that the measurements were performed using transmission IR-spectroscopy. The method, which is recognized as reference source for the determination of extinction coefficients from infrared spectra, was developed by Emeis in 1993 [
1]. He investigated the adsorption of pyridine on Si/Al-based catalysts and defined an integrated molar extinction coefficient (IMEC) characteristic for one special absorption band with the assumption that the IMEC does not depend on the catalyst or the strength of the acid site. The integrated absorbance of one band was plotted against the pyridine concentration. The IMEC can then be calculated from the slope of the linear regression. The calculated IMEC values were 1.67 cm/µmol for the Brønsted acid site at 1545 cm
−1 and 2.22 cm/µmol for the Lewis acid site at 1455 cm
−1.
As in the work of Emeis, most of the studies to determine extinction coefficients from IR spectra are carried out via transmission infrared spectroscopy. Morterra et al. [
2] studied the adsorption of methanol on silica and discussed the use of molar absorption coefficients in heterogeneous systems. Their results show that absorption coefficients cannot easily be transferred from one system to another due to different specific surface areas, sample thicknesses, and scattering properties. However, absorption coefficients could be compared for systems/samples with similar properties and measuring conditions. Jentoft et al. [
3] described that extinction coefficients may not be readily transferable from one adsorbent to another. They investigated the adsorption of
n-butane and neopentane on sulfated zirconia using transmission infrared spectroscopy and determined the integrated molar absorption coefficients for the adsorbate vibrations. The work revealed difficulties and limitations to measure accurately IR absorption coefficients because of scattering effects of the method and strong dependencies of the coefficients on particle size and morphology. In conclusion, there are limitations with respect to the quantitative analysis of transmission IR spectra for fine powders. Molar absorption coefficients can be determined assuming that the system conforms to Lambert-Beer behavior [
4]. For those determinations, the measurement of integrated band areas and number of adsorbed moles (simultaneously using volumetric gas dosing or something else) is required. To relate the signal intensity to the number of adsorption sites, it is necessary to determine the absorption coefficients. For those calculations it is assumed, that the coverage has no influence on the absorption coefficients and that there are no intermolecular interactions. In summary, the calculation of molar absorption or extinction coefficients from transmission infrared spectra works under certain assumptions, but cannot be easily transferred to other measurement methods.
Diffuse reflection infrared Fourier transform (DRIFT) spectroscopy is a non-invasive method that offers the advantages of in-situ investigations of powdered catalyst samples (in contrast to transmission measurements), and is therefore often used for the qualitative investigation of the interaction of catalyst surfaces and adsorbents [
5]. The main drawback of this method is the difficulty of quantitative measurements, the reproducibility of measurements (the diffusion coefficients varies with each measurement), and the temperature gradient between the upper edge and the bottom of the crucible [
6]. Thus, further quantitative evaluation of such spectra is affected by the measuring principle of diffuse reflection itself. Nevertheless, spectra obtained by DRIFTS measurements can be evaluated quantitatively in addition to their qualitative information content.
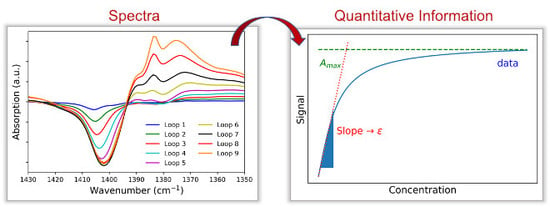
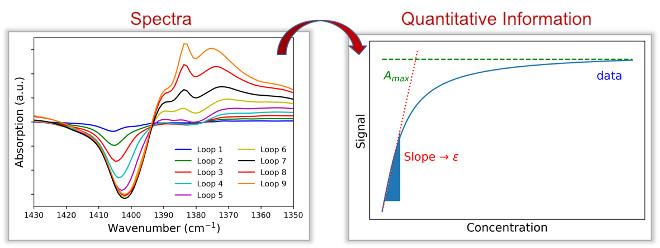
The main goal of this work was to evaluate opportunities for an easy way to quantitatively evaluate DRIFT spectra. These quantitative data should then serve as a starting point for further adsorption experiments of various probe gases and lead to a deeper understanding of the interaction of catalysts and adsorption gases with respect to a microkinetic model of alkane conversion and the influence of acid or base sites of zirconia.
The quantitative evaluation of DRIFT spectra is not very common in the literature. Meunier et al., investigated in 2007 the water-gas shift reaction on Au-based catalysts using quantitative DRIFT spectroscopy [
7,
8]. They concluded that with careful experimentation and a calibration of the measured data for each catalyst, it is possible to perform fully quantitative operando DRIFTS. A comparison between diffuse reflectance and diffuse transmittance spectroscopy was done by Boroumand [
9]. They found that inhomogeneities in the surface of the sample powder are equally important and nonnegligible.
Therefore, it can be concluded that special attention must be paid to the preparation of the samples to ensure reproducibility and that the extinction coefficients obtained are specific to one special measurement system.
The most common theoretical model for converting a diffuse reflection spectrum into a spectrum comparable to a transmission or extinction spectrum was introduced by Kubelka and Munk already in 1931 and was developed in an effort to determine the thickness required for a covering paint coat. They developed the following equation (with
R denoting the reflectance of an infinitely thick layer):
While the scattering module S for homogeneous samples with the same packing density is regarded as constant for many applications, the absorption factor K is directly proportional to the concentration c or the molar decadic extinction coefficient ε. Using DRIFTS experiments and a known weakly absorbing reference spectrum (for example potassium bromide), the term (1−R∞)2/(2 · R∞) can be measured. Thus, a quantitative evaluation of the spectrum obtained from the diffuse reflection with regard to the existing proportionality to the concentration and the molar decadic extinction coefficient is possible. In order for the Kubelka-Munk transformation to lead to usable results in quantitative evaluation, the sample must be homogeneous and similar in its packing density, have an isotropic scattering (particle size < wavelength of light used), and have a sufficiently large layer thickness (several millimeters).
As a model system and an example for the quantitative evaluation of DRIFT spectra and the calculation of molar exctinction coefficients, the adsorption of
n-butane on sulfated zirconia was chosen. This system has already been widely studied due to the good catalytic properties of sulfated zirconia for the skeletal isomerization of small alkanes at low temperatures. Examples of this are the investigations of Wrabetz [
10], Li [
11], Breitkopf [
12], and Gonzáles [
13], which were carried out with microcalorimetry. In these investigations, the surface of the activated sulfated zirconia was characterized and the number of active sites and sorption heats were determined. Therefore, this results in a good data situation to compare and validate the values determined in this study with quantitative DRIFT spectroscopy.
In the literature, absorption coefficients of zirconia have mostly been determined to quantify the number of adsorption sites on the solid acid surfaces (Lewis and Brønsted sites) through the adsorption of basic probe molecules such as pyridine. By means of transmission IR measurements, absorption coefficients of 1.00–2.08 cm/µmol (Lewis sites) and 0.64–1.66 cm/µmol (Brønsted sites) were obtained. In addition, various studies showed that changes in the preparation method have effects on the specific absorption coefficients [
4].
Values for absorption coefficients for sulfated zirconia determined using DRIFT spectroscopy are not found in the present literature due to the difficulties described before. This paper presents an approach to determine extinction coefficients for the adsorption of gases on sulfated zirconia aware of the difficulties and with the awareness that the values determined are only specific to a special measuring system. Nevertheless, the described method and the calculated specific extinction coefficients are a good prerequisite for the investigation of unknown systems and useful as a starting point for further quantitative investigations.
3. Materials and Methods
3.1. Catalyst Preparation
The zirconia was produced by precipitation with ammonia solution from the respective nitrates. First, a defined amount of the nitrate is dissolved in distilled water and stirred until the salt is completely dissolved. The pH value of the solution is then adjusted to 8.4 by adding drops of a 25% ammonia solution while stirring continuously. Aqueous zirconium hydroxide precipitates as a white gel-like precipitate. The reaction mixture is stirred, filtered, and the filter cake is washed three times with distilled water. The filter residue is then dried at 393 K for 24 h.
For sulfation, the dried precursor material is first ground, suspended, and mixed with aqueous (NH4)2SO4. This suspension is concentrated to dryness while stirring and then dried in air at 373 K for 24 h. The nominal sulfate content was 5 wt%. Elemental analysis was used to determine a mean sulfate content of 3.4 wt% for all samples.
For removal of water and other impurities contained, the samples were calcined in synthetic air flow (0.2 L/min) at 873 K for 3 h one day before the experiments.
3.2. Diffuse Reflection Infrared Fourier Transform Spectroscopy (DRIFTS)
DRIFTS measurements were done using a Praying Mantis Accessory (Harrick Scientific Products, Pleasantville, New York, NY, USA) with the High Temperature Reaction Chamber (HCV, Harrick Scientific Products, Pleasantville, New York, NY, USA) and a home-made injection loop in a Bruker Vertex 80 v FTIR spectrometer (Bruker Optik GmbH, Leipzig, Germany). Spectra of ground KBr powder were used as background for the experimental measurements. The samples (mass 200 mg, not diluted with KBr) were ground for homogeneity and then activated in the reaction chamber at 673 K for 1 h with 0.1 L/min nitrogen purging. The adsorption of n-butane was done at 308 K using a home-made injection loop until saturation of the sample was visible in the measured spectra (8–10 times). The injection loop was filled 5 min with n-butane. The adsorption time was 10 min per injection loop with one recorded spectrum per minute. After complete adsorption, the sample was purged for 25 min with 0.1 L/min to eliminate physiosorbed and non-adsorbed n-butane. The experiments were repeated ten times to check the reproducibility.
The spectral resolution used was 2 cm−1 and the number of averaged scans was 32. The wavenumber range was from 8000 to 500 cm−1. The analysis of the spectra was done with OPUS software.


