Article

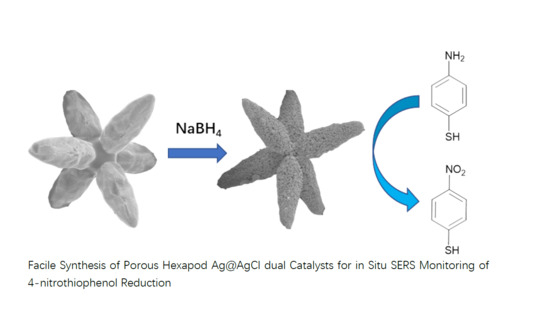
Facile Synthesis of Porous Hexapod Ag@AgCl Dual Catalysts for In Situ SERS Monitoring of 4-Nitrothiophenol Reduction

1
Research Center for Analytical Instrumentation, Institute of Cyber-Systems and Control, State Key Laboratory of Industrial Control Technology, Zhejiang University, Hangzhou 310027, China
2
Department of Chemistry, Zhejiang University, 38 Zheda Road, Hangzhou 310027, China
3
College of Electronic Science & Engineering, Jilin University, 2699 Qianjin Road, Changchun 130012, China
*
Author to whom correspondence should be addressed.
Catalysts 2020, 10(7), 746; https://doi.org/10.3390/catal10070746
Submission received: 29 May 2020 / Revised: 2 July 2020 / Accepted: 3 July 2020 / Published: 5 July 2020

Abstract

:
Controllable morphological metal catalytic materials have always been a focus in research. In the previous work, hexapod AgCl was successfully synthesized. In this paper, hexapod Ag@AgCl microstructures with diverse Ag contents are prepared through NaBH4 reduction. They are characterized by scanning electron microscopy (SEM) and the element distribution is proved by an energy dispersive X-ray spectrometer (EDS). They are porous dendritic microstructures with a large specific surface area and a rough surface, which display high catalytic performance and surface-enhanced Raman spectroscopy (SERS) activity. Furthermore, the hexapod Ag@AgCl microstructure is devoted as a dual catalyst to monitor the reduction of 4-nitrothiophenol (4-NTP) to 4-aminothiophenol (4-ATP) in situ using SERS. Ultraviolet–visible (UV–Vis) spectroscopy was employed to evaluate the catalytic performance of the hexapod Ag@AgCl microstructures. The consequences show that the velocity of reaction became faster with a corresponding increase in silver content and the reaction mechanism was cleared. In addition to preparing a good catalyst, this work also promotes the combination of micro-nano materials and spectroscopy technology.

Graphical Abstract

1. Introduction

In recent years, micro-nano metal materials with controllable morphologies have been a hot topic discussed by researchers. Due to their special physical and chemical properties, they have potential applications in catalysis [1,2], sensors [3,4], photothermal therapy [5,6,7] and surface-enhanced Raman spectroscopy (SERS) [8,9]. Theoretical research has shown that the physical and chemical properties of metallic materials depend to a great extent on their shape and size [10]. Thus, a large number of well-defined metal structures have been prepared, such as concaves [11,12], cubes [13,14,15], stars [16,17] and rods [18]. Among various types of the structures, Ag-based materials attracted wide attention, since they are outstanding in the reduction of 4-NTP to 4-ATP. 4-NTP is a common water pollutant, which is usually difficult to degrade under natural conditions. On the contrary, 4-ATP, which is the corresponding reduction product, has shown great value in various fields, including as a desiccant and in photographic development [19,20]. Meanwhile, in the chemical industry, 4-ATP is a raw material for the production of drugs [21]. Therefore, this reaction has attracted a lot of research as a standard reaction. Sebastian et al. synthesized Au/Pt/Au core/shell nano-raspberries to monitor Pt-catalyzed reactions under realistic conditions in situ [22]. Wang et al. used SERS to study the effect of laser power and wavelength on the reduction of 4-NTP to 4-ATP [23]. They demonstrated that strengthening the laser energy can significantly improve the speed of the reaction. K. Rademann et al. studied p-nitrophenol to p-aminophenol reaction kinetics by UV–Vis spectroscopy and determined the size of the nanoparticle with the fastest conversion rate [24].
Compared to ordinary Ag spheres or cubic nanoparticles, three-dimensional (3D) Ag-based architectures tends to have better catalytic activity. On the one hand, small reactant molecules are easily adsorbed on the corners or edges of the anisotropic 3D Ag-based catalyst, which improves the catalytic efficiency [25]. On the other hand, Ag nanoparticles (NPs) tend to aggregate and affect the catalytic performance, and meaning that a stable 3D Ag-based structure can effectively solve this problem [26]. Many studies have been done on the synthesis of 3D Ag-based catalysts with controllable morphologies. Due to the layered branch and leaf structure, dendritic silver has a large specific surface area, which improved the catalytic performance. For instance, Zhong et al. prepared dendritic silver (Ag) nanostructures by a electrochemical deposition strategy. The Ag nanostructures were used as a catalyst to reduce 4-Nitrophenol [27]. Rashid et al. synthesized nano-silver nanoparticles with different dendritic (DD) nanostructures using a template method. The results show that the catalytic reduction activity of synthesized Ag DDs on 4-NP is higher than that of spherical Ag-NPs [28]. Otherwise, porous Ag structures are also a valuable catalyst for reducing nitrophenols. Zou et al. designed porous Ag platelet structures with tunable porosity, which have shown good catalytic performance for p-nitrophenol or dyes [29]. Although great progress has been achieved, the 3D Ag-based dendritic microstructure is usually synthesized by electrochemical methods [30] or a complex template/seed-mediated method [31]. Therefore, the preparation is relatively inconvenient and complicated. In addition, few studies consider the influence of Ag content in the catalyst on the reaction rate. In order to solve these problems, we herein propose a simple preparation of 3D dendritic Ag structures.
According to our previous research, a hexapod AgCl microstructure was synthesized by a simple supersaturation precipitation method. Through the introduction of Cl and the control of experimental conditions, AgCl at different growth stages can be accurately obtained in the one-pot method [32]. In this paper, by a partial reduction, silver particles can be reformed on the prepared AgCl surface and hexapod Ag@AgCl microcrystals with different Ag contents are simply synthesized. It is a porous dendritic microstructure with a large surface-to-volume ratio and a rough surface, which has good catalytic performance. We use it to catalyze a 4-NTP reduction and use UV–visible spectroscopy for in situ monitoring. The rate of reaction is calculated. Importantly, the hexapod Ag@AgCl microstructure has a SERS effect simultaneously. Therefore, the hexapod Ag@AgCl microstructure is used as a bifunctional catalyst to keep track of the reduction of 4-NTP to 4-ATP in situ.

2. Results and Discussion

2.1. Preparation of Hexapod Ag@AgCl Microstructures and Their Characterization

Through the previously reported method, we acquired hexapod AgCl crystals, as shown in Figure 1A. It is clearly observed that the size of the 3D Ag@AgCl microstructure is about 30 to 40 μm. Based on previous research, under the synergy of ethylene glycol (EG) and diallyldimethylammonium chloride (DDA), the octahedral AgCl crystals were firstly formed. As the DDA solution increased, the six corners of the octahedral crystal were “pulled out” and gradually became larger. Finally, the octahedron completely transformed into hexapod AgCl. As shown in Figure 1B, throughout the process, growth occurred preferentially on <100> and the {110} growth was suppressed [32].
In order to expand and strengthen its function, it was reduced to an Ag@AgCl microstructure by NaBH4 solution. By controlling the amount of NaBH4 added, different reduction levels of Ag@AgCl microstructures were obtained, which have different Ag contents. The Ag@AgCl microstructures maintained their original shape and had a rough surface, which could be a good SERS substrate. Moreover, it was easy to find the Ag@AgCl microstructures under the Raman microscope. Thus, the process of finding SERS hotspots was simplified. For the convenience of the subsequent description, we will label the obtained Ag@AgCl samples according to the different molar ratios (R) of Ag and AgCl (learned from energy dispersive X-ray spectrometer (EDS), will be discussed later), as sample 1 (pure AgCl, R = 0:1), sample 2 (R = 1:2), sample 3 (R = 4:1) and sample 4 (pure Ag, R = 1:0). After reduction, the morphology of the samples remained unchanged and the SEM images of the four samples are shown in Figure S1 (see details in Supplementary Material (SM)). Figure 2A–D shows SEM images of the surface details of the above four samples. In the process, irregular Ag particles began to form on the surface and the entire structure gradually become porous. Due to the porous structure, the reactants were more likely to penetrate into the catalyst, resulting in more effective contact. In addition, the porous structure had a large specific surface area, which provided good active sites and SERS hotspots.
The EDS spectra of sample 4 is shown in Figure 3 and the others are shown in Figures S3–S5. Figure 3B,D confirms the distribution of Ag and Cl in sample 4. The EDS elemental mapping of Ag@AgCl, indicating the Ag and Cl elemental distribution, is shown in Figure S2. In Figure 3B, the spectrum of Cl shows peaks at 0.3 and 2.6 keV, while the peak at 3.2 keV was attributed to Ag. The content of Ag reached 98.74% (wt%), and only a small amount of Cl (1.26%) remained, suggesting that almost all AgCl was reduced. According to this, the molar ratio of Ag and AgCl in Ag@AgCl was calculated and the results of other samples can also be obtained by a similar method. It is worth noting that in the EDS mapping of pure AgCl in Figure S3, the Ag content reached 51.6% (atom.%), which is slightly higher than the theoretical value of 50%. This is probably because the electron beam reduced a small part of AgCl when the SEM image was taken.

2.2. In Situ Monitoring of Catalytic Reactions by UV–Vis and Catalytic Performance

The catalytic activity of Ag@AgCl microstructures was investigated through the reduction of 4-NTP at room temperature, monitored by UV-Vis spectra. The UV-Vis spectra of the mixed solution of 4-NTP and NaBH4 at different times are shown in Figure 4. It is found that the absorption peak was shown at about 410 nm and the spectra hardly changed as 1 h passed in the absence of catalyst. Therefore, we speculate that the reduction reaction did not occur. After adding four Ag@AgCl samples as catalysts, we attained their UV-Vis spectra, as shown in Figure 5A,C,E,G. From samples 1 to 4, the position of absorption peak did not change and the rate of the reduction reaction gradually became faster. In the presence of sample 1, 4-NTP was only reduced by about one third in 20 min and there was no obvious peak at 270 nm simultaneously. This means that only a small amount of 4-ATP was produced. When using samples 2 and 3 as catalysts, it can be found from Figure 5C,E that the peak at 410 nm decreased faster and the peak at 270 nm increased significantly, which illustrates the rapid conversion of 4-NTP to 4-ATP and the improvement of the catalytic effect. As sample 4 was used, 4-NTP was almost completely reduced in 10 min. Sample 4 showed the best catalytic effect.
To better illustrate the catalytic effect of the Ag@AgCl microstructure, we used a 75 nm Ag nanocube as a comparison. The Ag cube was synthesized by the reported method [33] and its relevant characterization is shown in Figure S6, which implies the uniformity and stability of the Ag cube. We firstly measured the UV–Vis absorption spectra of the Ag cubes, as shown in Figure S7A. The solution had an obvious absorption peak at 520 nm. When the Ag cube was mixed with 4-NTP, the absorption peak position changed between 395 nm to 445 nm. Then NaBH4 was added to start the reaction and the absorption peak dropped by about a quarter in 20 min. This control experiment showed that the catalytic performance of Ag silver nanoparticles was weaker than that of sample 1, which had the worst catalytic performance in the samples.
In order to clearly describe the change in the reaction rate, the reaction kinetics were applied. Pseudo first-order kinetics fit the catalytic reduction rate. As shown in Figure 5B,D,F,H, a linear correlation of ln (A0/A) with time was ascertained and the corresponding line equation was fitted, in which A is the absorbance at a certain moment and A0 is the initial absorbance of 4-NTP. Some unreasonable data points were deleted during the fitting process. The relevant parameters of the fitted straight line are shown in Figure S8 and the deviation values used by the error bars when fitting straight lines are shown in Table S1. We speculate that the experimental error may be mainly due to the system error of the instrument, the time difference during multiple measurements and the error of the baseline. The Pearson’s coefficients of the four fitted straight lines are 0.98902, 0.99731, 0.98586, 0.99861, which show good linear relationships and correlations between the data points. This shows that the fitting process and results are trustworthy and can be used in the next calculation of reaction rate constants. According to the theory of first order reaction, the slope of the ln (A0/A) vs. time is the reaction rate constant. The values of the reaction rate constant are calculated to be 0.02035 ± 0, 0.03103 ± 0.001, 0.08781 ± 0.006 and 0.18251 ± 0.004 min−1. This shows that the reaction rate is accelerated and the catalytic performance of samples 1 to 4 is gradually enhanced. The sample 4 (pure Ag) catalyst demonstrated the fastest reduction rate among all the catalysts. However, this does not mean that the other three catalysts are of no value, but that we can choose the appropriate catalyst according to our needs to achieve the reaction rate we desire.
The mechanism of this reaction can be understood with Ag@AgCl as an intermediate for transferring the hydrogen between NaBH4 and 4-NTP. The hydrogen comes from the reaction of NaBH4 and water. Thus, the reaction of the 4-NTP reduction is explained as the Ag porous structure easily absorbing the hydrogen generated in the solution and releasing the hydrogen in the reduction reaction [34]. Therefore, as the reduction degree of AgCl increases, the porosity increases and a larger amount of hydrogen can be adsorbed, so the reaction rate increases. As for the catalytic function of pure AgCl, we speculate that under the ultraviolet or visible light, Ag@AgCl will be regarded as an effective medium for transferring electrons, transporting the electrons provided by BH 4 to the nitro group. Therefore, the kinetic barrier will be reduced, thereby promoting the occurrence of reduction reactions [35].

2.3. In Situ Monitoring of Catalytic Reactions with SERS

Since the Ag@AgCl microstructure has SERS activity, we also used Raman spectroscopy to monitor the reduction process of 4-NTP in situ. For the purpose of avoiding possible side reactions and for a better display of the entire process, we used a 0.25 mW 633 nm low-power laser. In order to confirm that the low-power laser had no effect on the reaction, we first conducted a control experiment. Fifty microliters of 4-NTP solution and 3 mg sample 4 were mixed for testing. After continuous irradiation with a 633 nm laser with a power of 0.25 mW for 20 min, the spectra of 4-NTP did not change, as shown in Figure S9A, which proved that the low-power laser had no effect on the reaction pathway of 4-NTP reduction. Figure 6 shows the SERS spectra of 4-NTP at different time points after putting in the reducing agent NaBH4 and Ag@AgCl. The spectra show that the reduction process of 4-NTP adsorption on Ag@AgCl is mainly divided into two steps. Under the action of NaBH4, 4-NTP is first reduced to trans-p, p’-dimercaptoazobenzene (DMAB), and then trans-DMAB is converted to 4-ATP. According to previous research, the individual peaks of 4-NTP at 1572, 1336 and 1108 cm−1 matched well with the C–C stretching modes (νCC), NO2 symmetric stretching (νNO2), and C–N (νCN) bending, respectively [36]. When t = 0 min, characteristic vibrations at 1572, 1336 and 1108 cm−1 could be clearly identified. At t = 2 min, three novel peaks arose at 1429, 1388 and 1142 cm−1, which were attributed to νNN + βCH, νNN + νCN and βCH + νCN of trans-DMAB, respectively [37]. This meant the progress of the reaction and the generation of trans-DMAB. When proceeding to t = 4 min, peaks of 4-NTP at 1336 and 1108 cm−1 vanished, which demonstrated the decrease in 4-NTP. As the reaction continued, the three peaks of trans-DMAB continuously increased in intensity and a new peak at 1595 cm−1 appeared, which marked the start of the conversion of DMAB to 4-ATP. At t = 14 min, the peaks of trans-DMAB and 4-NTP all died away, which illustrated the completion of the entire reduction reaction.
It is worth noting that, compared with Raman in situ monitoring, there was no characteristic absorption peak of trans-DMAB during the UV–Vis monitoring. We speculate that the reaction occurred on the surface of the catalyst and the intermediate was strongly adsorbed on the surface. This matches with Matthias Ballauff’s research [38]. We also took out the catalyst when the reaction proceeded to 5 min for testing. The strong trans-DMAB spectrum was found on its surface, as shown in Figure S9B. The laser is usually irradiated on the surface of the catalyst, so 4-DMAB can be detected by Raman spectroscopy. Meanwhile, UV–Vis spectroscopy tests the species in solution, so the intermediate is difficult to detect. Therefore, the reaction process is summarized in Figure 7. All in all, by employing the Ag@AgCl dual functional material, the monitoring of the reduction of 4-NTP to 4-ATP was achieved.

3. Experimental

3.1. Materials and Chemicals

All reagents and solvents were purchased from commercial sources and used as received without further purification. Dangerous chemicals, such as silver nitrate (AgNO3, A.R. 99.8%,), nitric acid (HNO3, AR), absolute ethanol (C2H5OH, AR) and hydrochloric acid (HCl, AR), were purchased from Sinopharm Group Chemical Reagent Co., Ltd. (Shanghai, China) through the School Reagent Center. Other reagents and solvents, such as diallyldimethylammonium chloride (DDA), ethylene glycol (EG, ≥99%), 4-Nitrothiophenol (4-NTP, 80%) and sodium borohydride (NaBH4, AR, 98%,), were purchased from Aladdin. The solutions were prepared with deionized water (18 MΩ cm) purified through a Milli-Q Lab system (Nihon Millipore Ltd., Shanghai, China).
All glassware were washed in a bath of freshly prepared aqua regia (HCl:HNO3 = 3:1) and rinsed thoroughly twice in deionized water and ethanol, respectively.

3.2. Characterization and Instruments

The scanning electron microscopy (SEM) images were obtained on a Hitachi SU-70 electron microscope (3.0 kV, Hitachi, Tokyo, Japan) to characterize the morphology and size of the hexapod Ag@AgCl microstructures. SEM-EDS mapping illustrated the element distribution in the samples and provided their corresponding absorption spectra.
A Cary 60 Scan UV–Vis spectrophotometer (Agilent Technologies Inc., State of California, United States) was applied to collect absorption spectra. It has excellent capabilities of fast data acquisition. The scan rate was 24,000 nm/min, which can scan the entire wavelength range (190–1100 nm) in less than 3 s. The spectral resolution was less than 1.5 nm and wavelength reproducibility was ±0.1 nm. It used a stable xenon flash lamp and the working power was about 13 W.
A confocal Raman spectrometer (Horiba HR Evolution 800, Tokyo, Japan) was used to record Raman spectra. The spectral resolution was less than 0.35 cm−1 and spectral repeatability was less than 0.03 cm−1. So, it had high accuracy. Meanwhile, it was equipped with three wavelength lasers of 532, 633 and 785 nm and the incident laser power was adjustable (maximum 10 mW). This provided great convenience and flexibility for the measurement of samples. The spectral analysis software package LabSpec 6 was used to analyze the obtained spectrum, providing powerful data processing functions.
The above instruments and equipment ensured that we quickly obtained reliable results.

3.3. Preparation of Hexapod Ag@AgCl Microstructures

We adopted reported methods to synthesize hexapod Ag@AgCl microstructures [29]. For a typical synthesis of AgCl crystals, 300 μL of AgNO3 solution (0.1 M) and 0.8 mL of DDA were added to 20 mL of EG and mixed well at room temperature. The solution was placed in a 190 °C oil bath for 30 min with agitation. The flask was stewed until it cooled down to room temperature. The resulting product was first centrifuged at 10,000 r/min for 15 min to remove the supernatant. The precipitate (AgCl) was washed twice with water and ethanol, respectively.
One hundred milligrams of dried hexapod AgCl crystals were dispersed in 8 mL of deionized water. Then 0.02 M NaBH4 solution was added to the dispersion and it was reacted at 300 r/min for 30 min to reduce AgCl to prepare Ag@AgCl microstructures. Changing the volume of NaBH4 adjusted the reduction degree of AgCl to obtain Ag@AgCl with different ratios of Ag to AgCl.

3.4. In Situ Detection of Catalytic Reactions

The conversion of 4-NTP to 4-ATP was used to evaluate the catalytic performance of the prepared Ag@AgCl microstructures. All experiments were conducted at room temperature and normal pressure.
In situ monitoring of the reaction by UV–Vis. The UV–Vis spectrometer used a dual light path mode when collecting spectra. The scanning range was 200 to 800 nm and the scanning speed was 24,000 nm/min. Firstly, the UV–Vis absorption spectrum of 4-NTP mixed with the NaBH4 solution was obtained. Then, 10 mg Ag@AgCl powder were dispersed in 10 mL water uniformly. One hundred microliters of the above solution, 1.9 mL of 1 mM 4-NTP and 1 mL of 0.1 M NaBH4 were added into the measuring cell. The absorption spectrum was recorded every minute and the measurement was repeated three times. Throughout the experiment, the measuring cell was always placed in the dark sample chamber of the spectrometer. The above experiment was conducted with Ag@AgCl with different Ag contents (samples 1–4).
In situ monitoring of the reaction by SERS. The Raman spectrometer was calibrated by a silicon wafer at 520 cm−1 and the laser beam was focused through a 50 × objective. Ten microliters of the Ag@AgCl suspension, 30 μL 0.1 mM 4-NTP and 10 μL of 0.1 M NaBH4 were dropped on a glass slide with a small liquid pool. Raman spectra were collected every minute for the above reaction solution. A 633-nm excitation laser was used to irradiate the mixture and the laser power was kept at about 0.25 mW. A total accumulation time of 10 s was employed and the grating of 600 gr/mm was used. The above reaction solution was subjected to a surface-enhanced Raman test at different times.

4. Conclusions

In summary, Ag@AgCl microstructures were successfully prepared by NaBH4 reduction. By adjusting the volume of the NaBH4 solution, Ag@AgCl microstructures with different molar ratios of Ag and AgCl were obtained. The material had the advantages of a 3D structure and a large specific surface area, and was a bifunction catalyst with SERS activity. We applied it to monitoring the conversion of 4-NTP to 4-ATP in situ by SERS. UV–Vis spectroscopy was used to evaluate its catalytic performance. This work not only developed a method for synthesizing 3D Ag structures, but also offers new ideas for the application of micro-nano materials in spectroscopy.

Supplementary Materials

The following are available online at https://www.mdpi.com/2073-4344/10/7/746/s1, Figure S1: (A–D) SEM image of Ag@AgCl microstructure of samples 1–4. Scale bar: 10 μm (A–D), Figure S2: (A,B) EDS elemental mapping of Ag@AgCl indicating the Ag and Cl elemental distribution 1–4. Scale bar: 8 μm (A–D), Figure S3: (A) SEM image of Ag@AgCl microstructure (sample 1). (B,C) EDS elemental mapping of Ag@AgCl, indicating the Ag and Cl elemental distribution. (D) The corresponding EDS elemental spectrum of Ag@AgCl microstructure. Scale bar: 10 μm (A–C), Figure S4: (A) SEM image of Ag@AgCl microstructure (sample 2). (B,C) EDS elemental mapping of Ag@AgCl, indicating the Ag and Cl elemental distribution. (D) The corresponding EDS elemental spectrum of Ag@AgCl microstructure. Scale bar: 10 μm (A–C), Figure S5: (A) SEM image of Ag@AgCl microstructure (sample 3). (B,C) EDS elemental mapping of Ag@AgCl, indicating the Ag and Cl elemental distribution. (D) The corresponding EDS elemental spectrum of Ag@AgCl microstructure. Scale bar: 10 μm (A–C), Figure S6: (A) SEM image of Ag cubes. (B) TEM image of Ag cubes., Figure S7: (A) Absorption spectrum of Ag cube. (B) Absorption spectra of 4-NTP reduction by Ag cube catalyzed, Figure S8: (A–D) The corresponding parameters of the fitted straight line, corresponding to Figure 5B,D,F,H, respectively, Figure S9: (A) The spectrum of 4-NTP changes with time under a 0.25 mW 633 nm laser. (B) The spectra of 4-NTP absorbed on the surface of the catalyst, Table S1: The deviation values used by the error bars when fitting straight lines for lines in Figure 5B,D,F,H, respectively.

Author Contributions

Conceptualization, Y.L., Y.Q. and J.Z.; methodology, Y.L., J.M., Z.W., Y.Q. and J.Z.; software, Y.L., J.M. and Z.W.; validation, Y.L., J.M. and J.Z.; formal analysis, Y.L. and J.M.; investigation, Y.L.; resources, J.Z.; data curation, Y.L., J.M., Z.W.; writing—original draft preparation, Y.L.; writing—review and editing, Y.L. and J.Z.; visualization, Y.L.; project administration, J.Z.; funding acquisition, J.Z. All authors have read and agreed to the published version of the manuscript.

Funding

This work was supported by the Key R&D Program Projects of Zhejiang Province (2018C03G2011156) and the Research Project of the State Key Laboratory of Industrial Control Technology, Zhejiang University, China (grant numbers ICT1806).

Conflicts of Interest

The authors declare no conflict of interest.

References

  1. Duan, H.H.; Yan, N.; Li, Y.D. Ultrathin rhodium nanosheets. Nat. Commun. 2014, 5, 3093–3100. [Google Scholar] [CrossRef] [PubMed] [Green Version]
  2. Kuo, T.S.; Lee, Y.C.; Wang, D.Y. Plasmon-Enhanced Hydrogen Evolution on Specific Facet of Silver. Chem. Mater. 2019, 31, 3722–3728. [Google Scholar] [CrossRef]
  3. Liu, D.L.; Fang, L.L.; Li, Y. Ultrasensitive and Stable Au Dimer-Based Colorimetric Sensors Using the Dynamically Tunable Gap-Dependent Plasmonic Coupling Optical Properties. Adv. Funct. Mater. 2018, 28, 1707392–1707402. [Google Scholar] [CrossRef]
  4. Ma, Y.; Promthaveepong, K.; Li, N. Chemical Sensing on a Single SERS Particle. ACS Sens. 2017, 2, 135–139. [Google Scholar] [CrossRef]
  5. Yin, Z.; Zhang, W.; Ma, D. Construction of Stable Chainlike Au Nanostructures via Silica Coating and Exploration for Potential Photothermal Therapy. Small 2014, 10, 3619–3624. [Google Scholar] [CrossRef]
  6. Paterson, S.; Thompson, S.A.; de la Rica, R. Self-assembly of gold supraparticles with crystallographically aligned and strongly coupled nanoparticle building blocks for SERS and photothermal therapy. Chem. Sci. 2016, 7, 6232–6237. [Google Scholar] [CrossRef] [Green Version]
  7. Huang, X.Q.; Tang, S.H.; Zheng, N.F. Etching Growth under Surface Confinement: An Effective Strategy to Prepare Mesocrystalline Pd Nanocorolla. J. Am. Chem. Soc. 2011, 133, 15946–15949. [Google Scholar] [CrossRef]
  8. Scarabelli, L.; Coronado-Puchau, M.; Luis, M. Monodisperse Gold Nanotriangles: Size Control, Large-Scale Self-Assembly, and Performance in Surface-Enhanced Raman Scattering. ACS Nano 2014, 8, 5833–5842. [Google Scholar] [CrossRef]
  9. Yu, B.R.; Li, P.; Zhou, B.B.; Tang, X.H.; Li, S.F.; Yang, L.B. Sodium Chloride Crystal-Induced SERS Platform for Controlled Highly Sensitive Detection of Illicit Drugs. Chem. Eur. J. 2018, 24, 4800–4804. [Google Scholar] [CrossRef]
  10. Daniel, M.C.; Astruc, D. Gold Nanoparticles: Assembly, Supramolecular Chemistry, Quantum-Size-Related Properties, and Applications toward Biology, Catalysis, and Nanotechnology. Chem. Rev. 2004, 104, 293–346. [Google Scholar] [CrossRef]
  11. Xia, X.H.; Zeng, J.; McDearmon, B.; Zheng, Y.Q.; Li, Q.G.; Xia, Y.N. Silver Nanocrystals with Concave Surfaces and Their Optical and Surface-Enhanced Raman Scattering Properties. Angew. Chem. Int. Ed. 2011, 50, 12542–12546. [Google Scholar] [CrossRef] [PubMed] [Green Version]
  12. Chong, Y.; Dai, X.; Fang, G.; Wu, R.F.; Zhao, L.; Ma, X.C.; Tian, X.; Lee, S.Y.; Zhang, C.; Chen, C.Y.; et al. Palladium concave nanocrystals with high-index facets accelerate ascorbate oxidation in cancer treatment. Nat. Commun. 2018, 9, 4861–4871. [Google Scholar] [CrossRef] [PubMed]
  13. Sun, Y.G.; Xia, Y.N. Shape-Controlled Synthesis of Gold and Silver Nanoparticles. Science 2002, 298, 2176–2179. [Google Scholar] [CrossRef] [PubMed] [Green Version]
  14. Xia, X.H.; Zeng, J.; Oetjen, L.K.; Li, Q.G.; Xia, Y.N. Quantitative analysis of the role played by poly(vinylpyrrolidone) in seed-mediated growth of Ag nanocrystals. J. Am. Chem. Soc. 2012, 134, 1793–1801. [Google Scholar] [CrossRef] [Green Version]
  15. Kim, F.; Connor, S.; Song, H.; Kuykendall, T.; Yang, P.D. Platonic Gold Nanocrystals. Angew. Chem. 2004, 116, 3759–3763. [Google Scholar] [CrossRef]
  16. Huo, D.; Cao, Z.M.; Li, J.; Xie, M.H.; Tao, J.; Xia, Y.N. Seed-Mediated Growth of Au Nanospheres into Hexagonal Stars and the Emergence of a Hexagonal Close-Packed Phase. Nano Lett. 2019, 19, 3115–3121. [Google Scholar] [CrossRef]
  17. Garcia-Leis, A.; Garcia-Ramos, J.V.; Sanchez-Cortes, S. Silver Nanostars with High SERS Performance. J. Phys. Chem. C 2013, 117, 7791–7795. [Google Scholar] [CrossRef]
  18. Walsh Michael, J.; Tong, W.M.; Funston Alison, M. A Mechanism for Symmetry Breaking and Shape Control in Single-Crystal Gold Nanorods. Acc. Chem. Res. 2017, 50, 2925–2935. [Google Scholar] [CrossRef]
  19. Cheng, T.Y.; Zhang, D.C.; Li, H.X.; Liu, G.H. Magnetically recoverable nanoparticles as efficient catalysts for organic transformations in aqueous medium. Green Chem. 2014, 16, 3401–3427. [Google Scholar] [CrossRef]
  20. Saran, S.; Manjari, G.; Devipriya, S.P. Synergistic eminently active catalytic and recyclable Ag, Cu and Ag-Cu alloy nanoparticles supported on TiO2 for sustainable and cleaner environmental applications: A phytogenic mediated synthesis. J. Clean. Prod. 2018, 177, 134–143. [Google Scholar] [CrossRef]
  21. Arora, N.; Mehta, A.; Mishra, A.; Basu, S. 4-Nitrophenol reduction catalysed by Au-Ag bimetallic nanoparticles supported on LDH: Homogeneous vs. heterogeneous catalysis. Appl. Clay Sci. 2018, 151, 1–9. [Google Scholar] [CrossRef]
  22. Xie, W.; Herrmann, C.; Kömpe, K.; Haase, M.; Schlücke, S. Synthesis of Bifunctional Au/Pt/Au Core/Shell Nanoraspberries for in Situ SERS Monitoring of Platinum-Catalyzed Reactions. J. Am. Chem. Soc. 2011, 133, 19302–19305. [Google Scholar] [CrossRef] [PubMed]
  23. Kang, L.L.; Xu, P.; Zhang, B.; Tsai, H.H.; Han, C.J.; Wang, H.L. Laser wavelength- and power-dependent plasmon-driven chemical reactions monitored using single particle surface enhanced Raman spectroscopy. Chem. Commun. 2013, 49, 3389–3391. [Google Scholar] [CrossRef] [PubMed]
  24. Fenger, R.; Fertitta, E.; Kirmse, H.; Thünemann, A.F.; Rademann, K. Size dependent catalysis with CTAB-stabilized gold nanoparticles. Phys. Chem. Chem. Phys. 2012, 14, 9343–9349. [Google Scholar] [CrossRef]
  25. Mudassir, M.A.; Hussain, S.Z.; Rehman, A.; Zaheer, W.; Asma, S.T.; Jilani, A.; Aslam, M.; Zhang, H.F.; Ansari, T.M.; Hussain, I. Development of silver-nanoparticle-decorated emulsion-templated hierarchically porous poly(1-vinylimidazole) beads for water treatment. ACS Appl. Mater. Interfaces 2017, 9, 24190–24197. [Google Scholar] [CrossRef]
  26. Li, N.; Zhao, P.X.; Astruc, D. Anisotropic gold nanoparticles: Synthesis, properties, applications, and toxicity. Angew. Chem. Int. Ed. 2014, 53, 1756–1789. [Google Scholar] [CrossRef]
  27. Cheng, Z.Q.; Li, Z.W.; Xu, J.H.; Yao, R.; Li, Z.L.; Liang, S.; Cheng, G.L.; Zhou, Y.H.; Luo, X.; Zhong, J. Morphology-Controlled Fabrication of Large-Scale Dendritic Silver Nanostructures for Catalysis and SERS Applications. Nanoscale Res. Lett. 2019, 14, 89–95. [Google Scholar] [CrossRef]
  28. Rashid, M.H.; Mandal, T.K. Synthesis and catalytic application of nanostructured silver dendrites. J. Phys. Chem. C 2007, 111, 16750–16760. [Google Scholar] [CrossRef]
  29. Xu, M.; Sui, Y.M.; Wang, C.; Zhou, B.; Wei, Y.J.; Zou, B. Design of porous Ag platelet structures with tunable porosity and high catalytic activity. J. Mater. Chem. A 2015, 3, 22339–22346. [Google Scholar] [CrossRef]
  30. Hong, X.; Wang, G.-Z.; Wang, Y. Controllable electrochemical synthesis of silver dendritic nanostructures and their SERS properties. Chin. J. Chem. Phys. 2010, 23, 596–602. [Google Scholar] [CrossRef]
  31. Gatemala, H.; Thammacharoen, C.; Ekgasit, S. 3D AgCl microstructures selectively fabricated via Cl-induced precipitation from [Ag(NH3)2]+. CrystEngComm. 2014, 16, 6688–6696. [Google Scholar] [CrossRef]
  32. Lu, Y.X.; Qin, Y.Z.; Zhou, J.G. Stepwise Evolution of AgCl Microcrystals from Octahedron into Hexapod with Mace Pods and their Visible Light Photocatalytic Activity. Crystals 2019, 9, 401. [Google Scholar] [CrossRef] [Green Version]
  33. Lin, Y.; Zhang, Y.J.; Yang, W.M.; Dong, J.C.; Fan, F.R.; Zhao, Y.; Zhang, H.; Bodappa, Y.; Tian, X.D.; Yang, Z.L.; et al. Size and dimension dependent surface-enhanced Raman scattering properties of well-defined Ag nanocubes. Appl. Mater. Today 2019, 14, 224–232. [Google Scholar] [CrossRef]
  34. Liao, G.F.; Gong, Y.; Zhong, L.; Fang, J.S.; Zhang, L.; Xu, Z.S.; Gao, H.Y.; Fang, B.Z. Unlocking the door to highly efficient Ag-based nanoparticles catalysts for NaBH4-assisted nitrophenol reduction. Nano Res. 2019, 12, 2407–2436. [Google Scholar] [CrossRef]
  35. Chen, X.; Cai, Z.; Chen, X.; Oyama, M. AuPd bimetallic nanoparticles decorated on graphene nanosheets: Their green synthesis, growth mechanism and high catalytic ability in 4-nitrophenol reduction. J. Mater. Chem. A 2014, 2, 5668–5674. [Google Scholar] [CrossRef]
  36. Zhang, J.W.; Winget, S.A.; Wu, Y.R.; Su, D.; Su, X.J.; Xie, Z.X.; Qin, D. Ag@Au Concave Cuboctahedra: A Unique Probe for Monitoring Au-Catalyzed Reduction and Oxidation Reactions by Surface-Enhanced Raman Spectroscopy. ACS Nano 2016, 10, 2607–2616. [Google Scholar] [CrossRef] [PubMed]
  37. Huang, Y.F.; Wu, D.Y.; Zhu, H.P.; Zhao, L.B.; Liu, G.K.; Ren, B.; Tian, Z.Q. Surface-enhanced Raman spectroscopic study of p-aminothiophenol. Phys. Chem. Chem. Phys. 2012, 14, 8485–8497. [Google Scholar] [CrossRef] [PubMed]
  38. Gu, S.; Wunder, S.; Lu, Y.; Ballauff, M. Kinetic Analysis of the Catalytic Reduction of 4-Nitrophenol by Metallic Nanoparticles. J. Phys. Chem. C 2014, 118, 18618–18625. [Google Scholar] [CrossRef]
Figure 1. (A) SEM images of AgCl microstructure; (B) Schematic drawing showing facets and growth directions of 3D AgCl microstructures from octahedral seeds. Scale bar: 10 μm.
Catalysts 10 00746 g001
Figure 2. (AD) SEM images of the surface of Ag@AgCl microstructures for samples 1–4, respectively. Scale bar: 5 μm (AD).
Catalysts 10 00746 g002
Figure 3. (A) SEM image of an Ag@AgCl microstructure (sample 4); (B) The corresponding energy dispersive X-ray spectrometer (EDS) elemental spectrum of the Ag@AgCl microstructure; (C) The corresponding SEM image of surface details for (A) and the 4-NTP was reduced on the surface; (D) The Ag and Cl elemental atomic distribution in Ag@AgCl (sample 4). Scale bar: (A) 8 μm and (C) 1 μm.
Catalysts 10 00746 g003
Figure 4. Absorption spectra of 4-NTP with NaBH4 at 0 min and 1 h.
Catalysts 10 00746 g004
Figure 5. (A,C,E,G) Absorption spectra of 4-NTP reduced by NaBH4 with catalysts of samples 1, 2, 3 and 4, respectively. (B,D,F,H) Corresponding ln (A0/A) versus time plot for rate constants for (A,C,E,G), respectively.
Catalysts 10 00746 g005
Figure 6. Surface-enhanced Raman spectroscopy (SERS) spectra of the reductive conversion process of 4-NTP to 4-ATP at different reaction times.
Catalysts 10 00746 g006
Figure 7. Scheme diagram of the conversion of 4-NTP to 4-ATP.
Catalysts 10 00746 g007

