2.3.2. Phases Present in the Iron Oxide/CaO/γ-Al2O3 Catalyst
Establishing the intrinsic properties of the phases of the prepared Fe
xO
y/CaO-γ-Al
2O
3 catalyst, namely crystallinity and crystallite size using XRD, is of significant value given that they can be correlated to the catalytic properties. However, while using XRD, and in practice, caution must be exercised given that added chemical species, which act as dopants to the support, can display crystalline phases which are not detectable with a standard XRD [
58,
59].
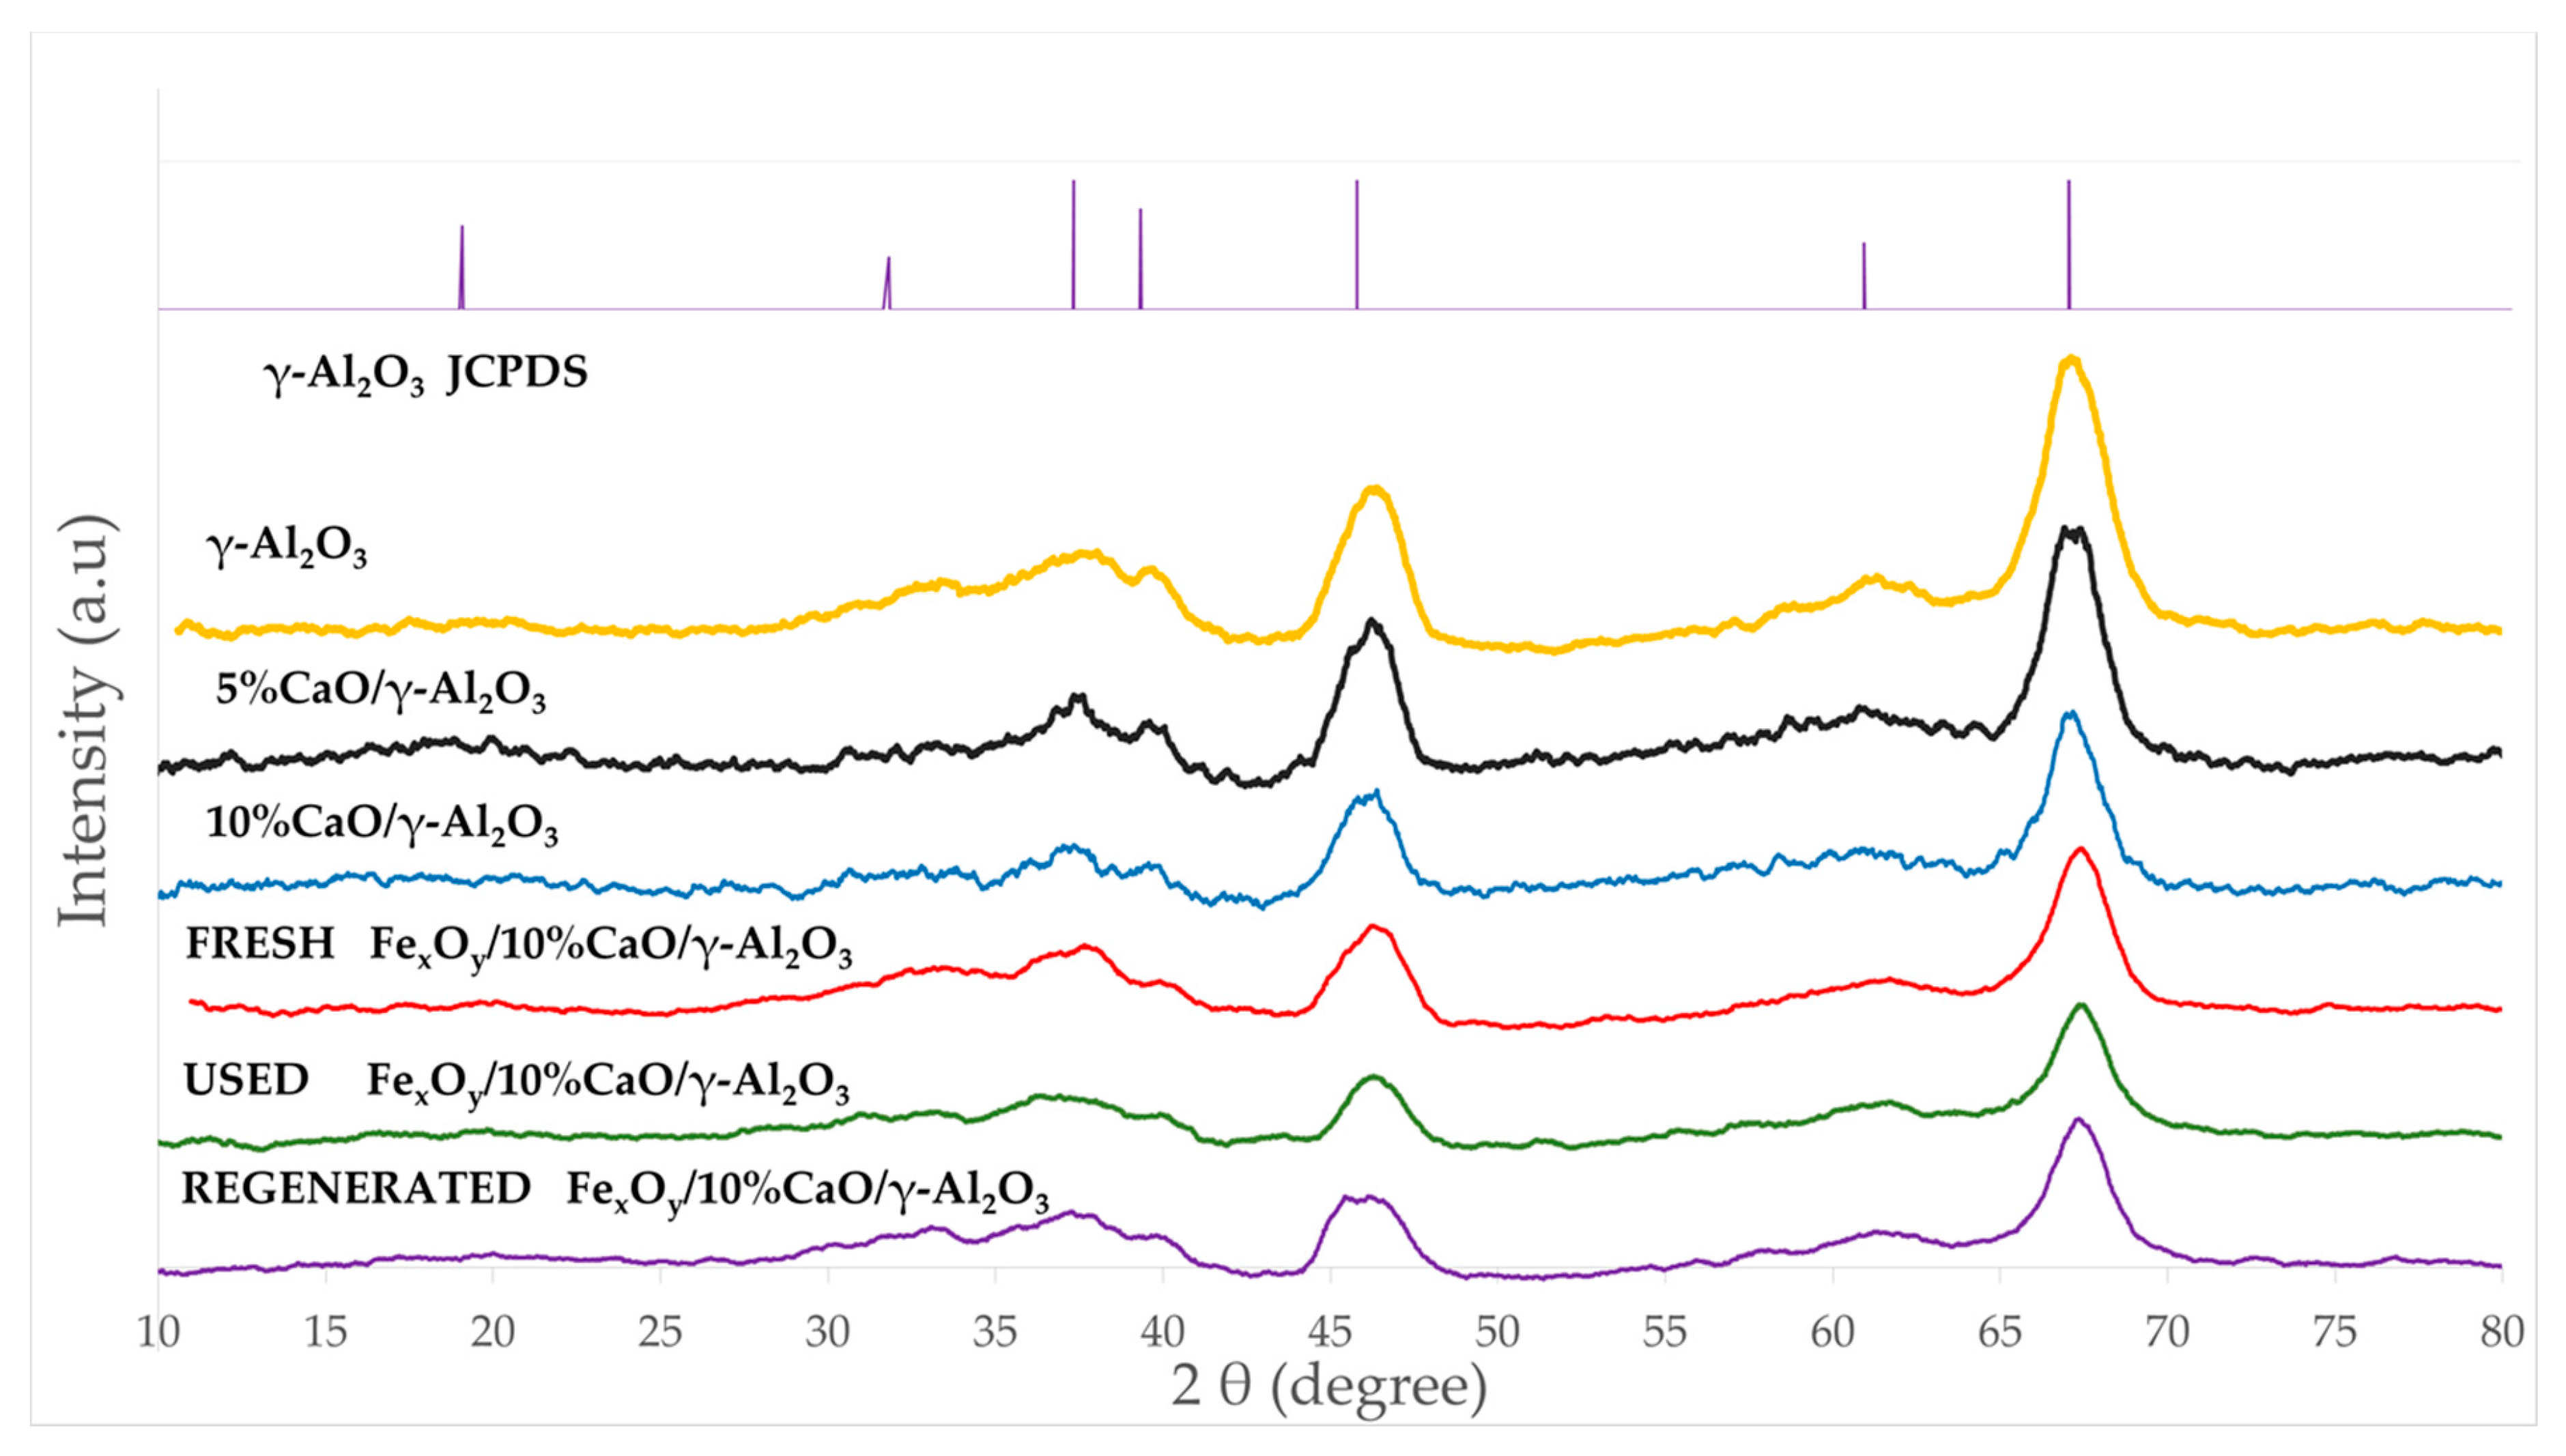
Figure 2 reports the XRD of the crystal phases present in the Fe
xO
y/CaO-γ-Al
2O
3 catalyst. XRD allowed us to analyze the catalyst and catalyst precursors at various stages of catalyst preparation and utilization, as follows: (a) the γ-Al
2O
3 support as received, (b) the γ-Al
2O
3 with added CaO, (c) the fresh Fe
xO
y/CaO-γ-Al
2O
3 catalyst, (d) the catalyst after usage, and (e) the catalyst following regeneration.
In
Figure 2, one can observe the characteristic γ-Al
2O
3 XRD broad bands at 37.6°, 45.8°, and 67.1° of the 2θ scale (JCPDS 10-0425). As for CaO, while the 38° and 68° peaks may suggest a crystalline phase, all other CaO anticipated peaks at 32.5° (111), 54° (202), and 64° (311) are not present. As a result, an amorphous CaO phase, or, eventually, a microcrystalline phase below XRD’s detection limits, is considered to be possibly present. Furthermore, the predominant peaks at 43.20° for Fe, at 33.2°, 35.6°, 40.9°, and 49.5° for Fe
2O
3, and at 30.1°, 35.5°, and 57.1° for Fe
3O
4 (JCPDS file, No. 33-0664, JCPDS file, No. 19-0629, respectively) were not detected either. This further suggests the presence of amorphous iron containing phases or crystalline phases below detection limits. This was considered possible given the low nominal Fe concentration added to the γ-Al
2O
3 support.
Additionally, there were no strong Fe/Al
2O
3 XRD lines observed, with this showing the low probability of iron aluminate formation. This was consistent with previous studies with CaO- Fe
2O
3-Fe
3O
4 catalysts [
60], which indicated the importance of limiting temperature increases during catalyst preparation, as practiced in the present study.
Therefore, the XRD’s positive identification of various added dopants as crystalline phases was not conclusive, and other additional techniques are required in order to clarify this matter, as will be described in the upcoming sections of this study.
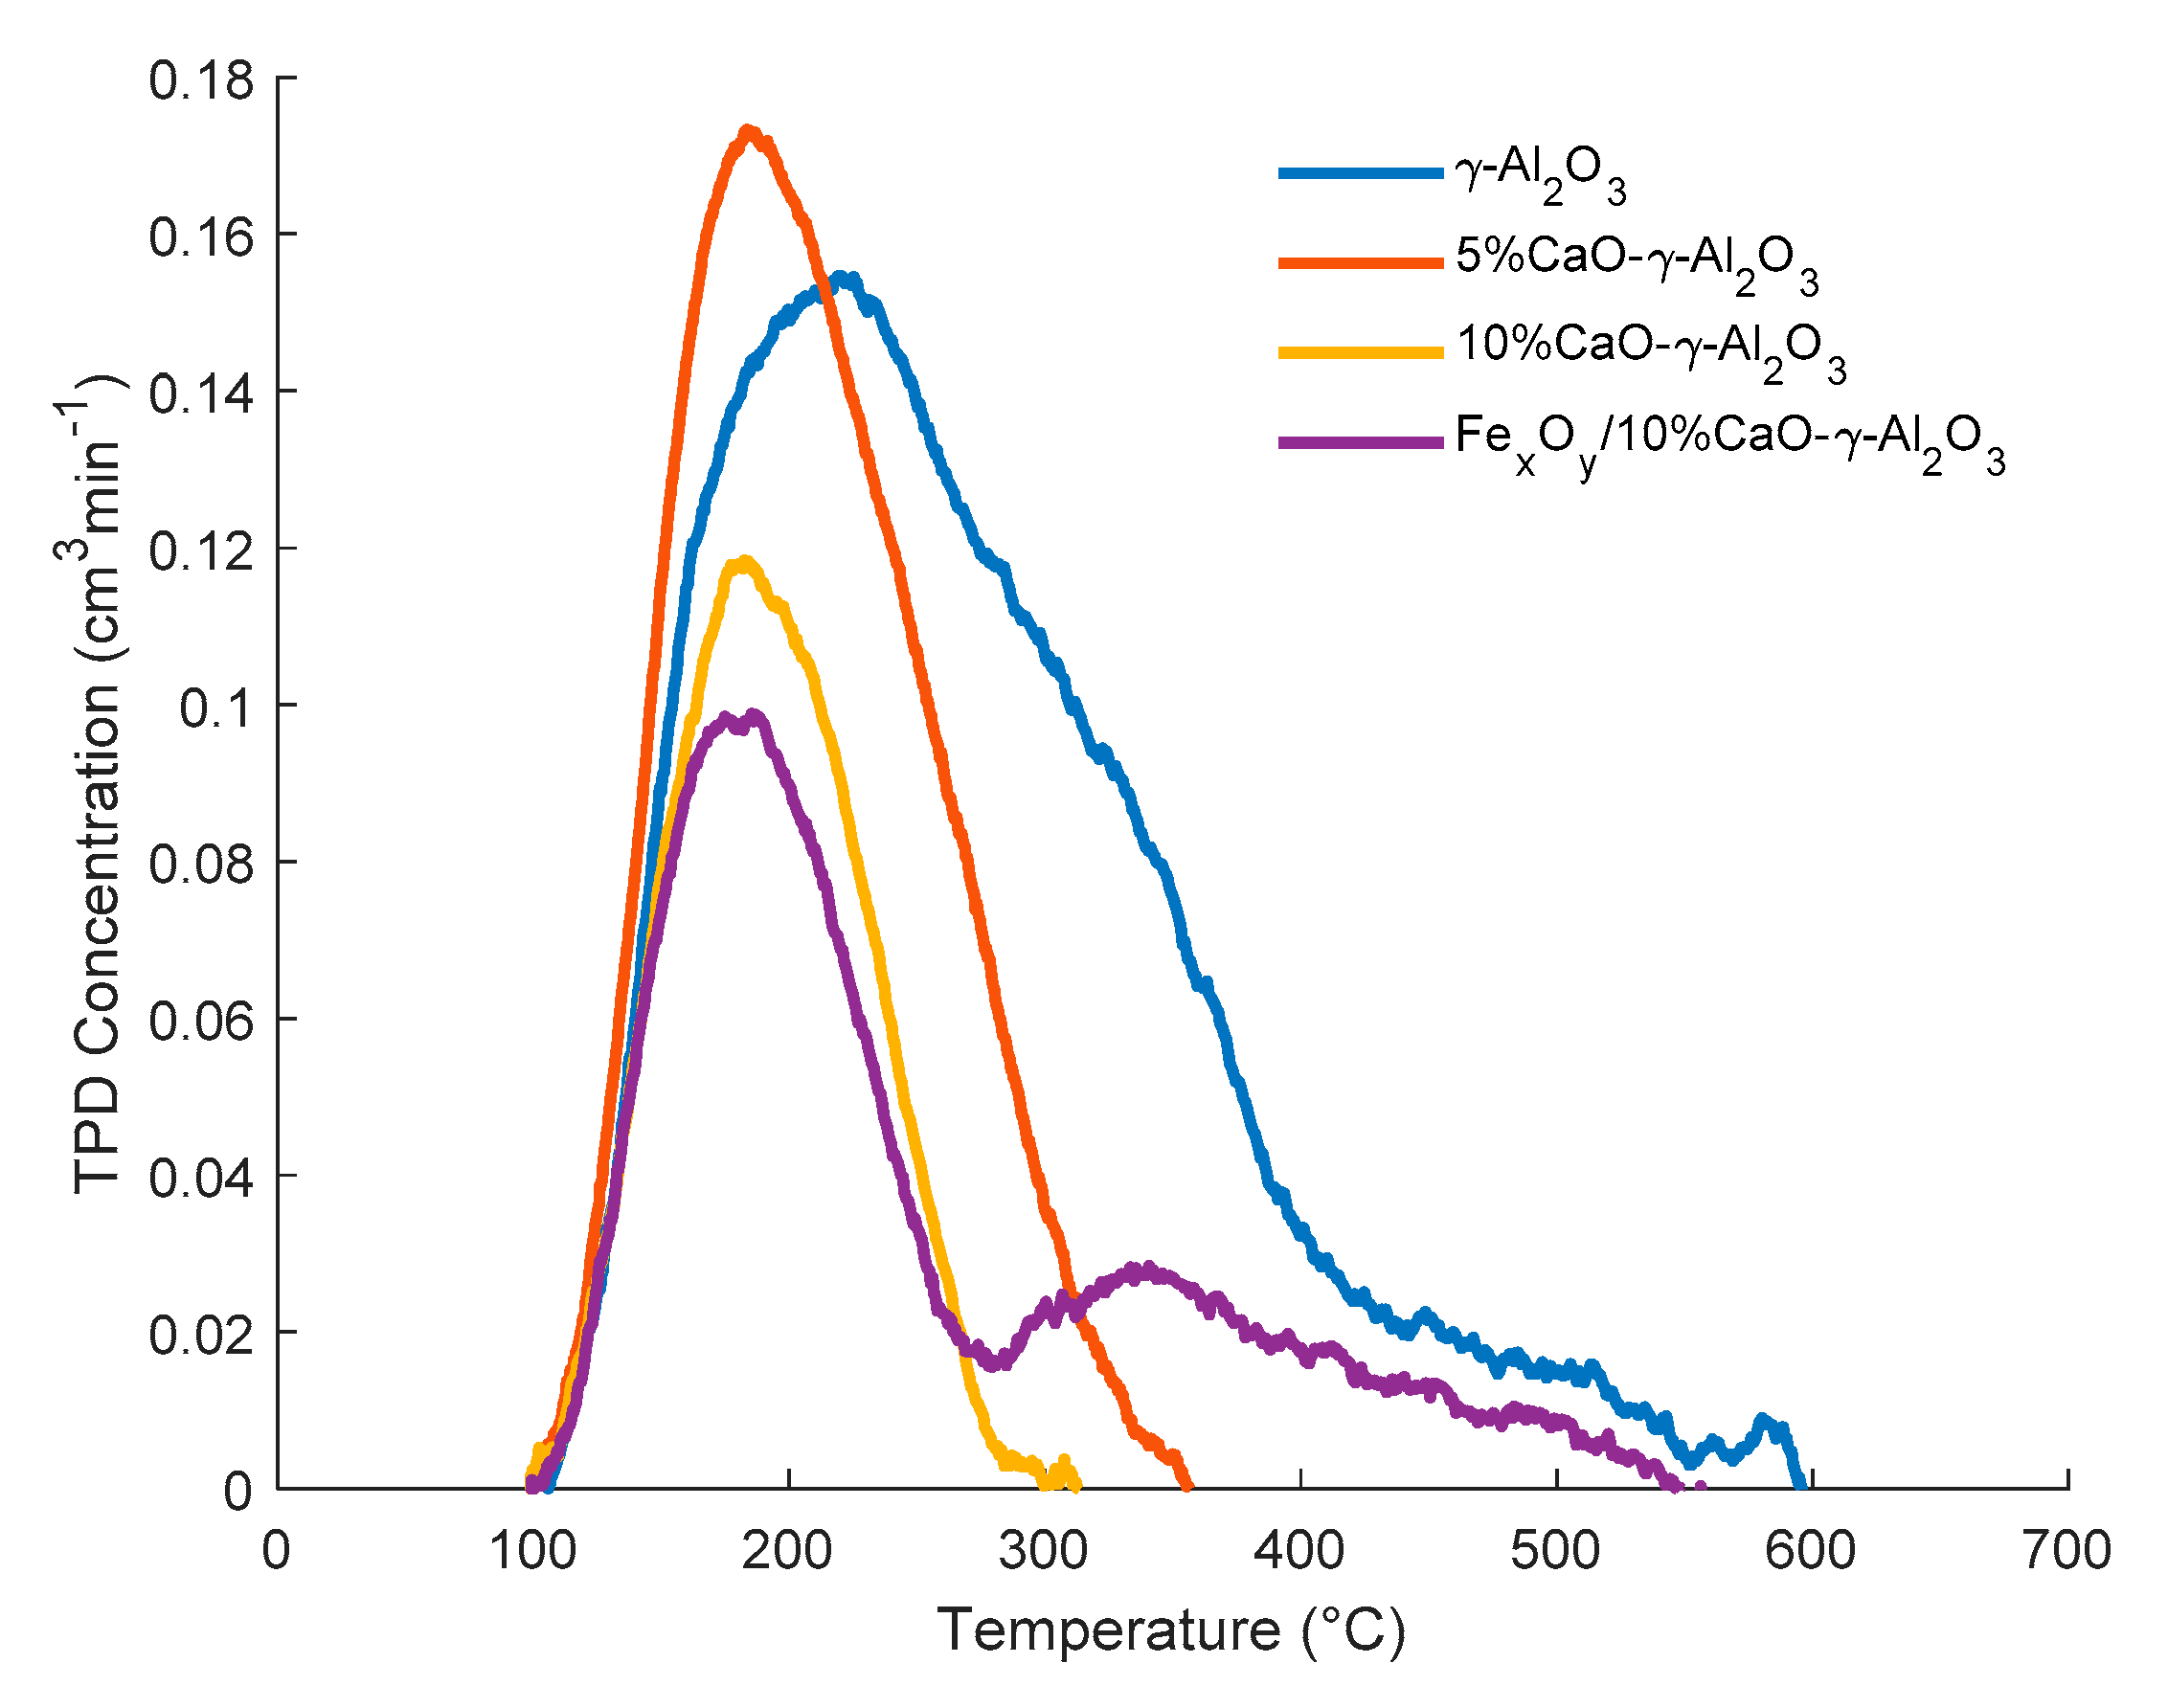
2.3.3. Influence of CaO and Iron Dopants on Acidity
Acidity reduction in a tar reforming catalyst is critical to achieve a decrease in coke formation. The evaluation of the effectiveness of CaO addition on acidity reduction was conducted using NH
3-Temperature-Programmed-Desorption (NH
3 pKa = 9.2 at 25 °C, in an aqueous solution [
61]).
Table 2 and
Figure 3 report the significant role played by CaO addition to achieve a γ-alumina acidity decrease of more than 62%.
One can note, as well, that in
Figure 3, the addition of iron oxides reintroduces a modest increase in both total acidity and medium strength acidity.
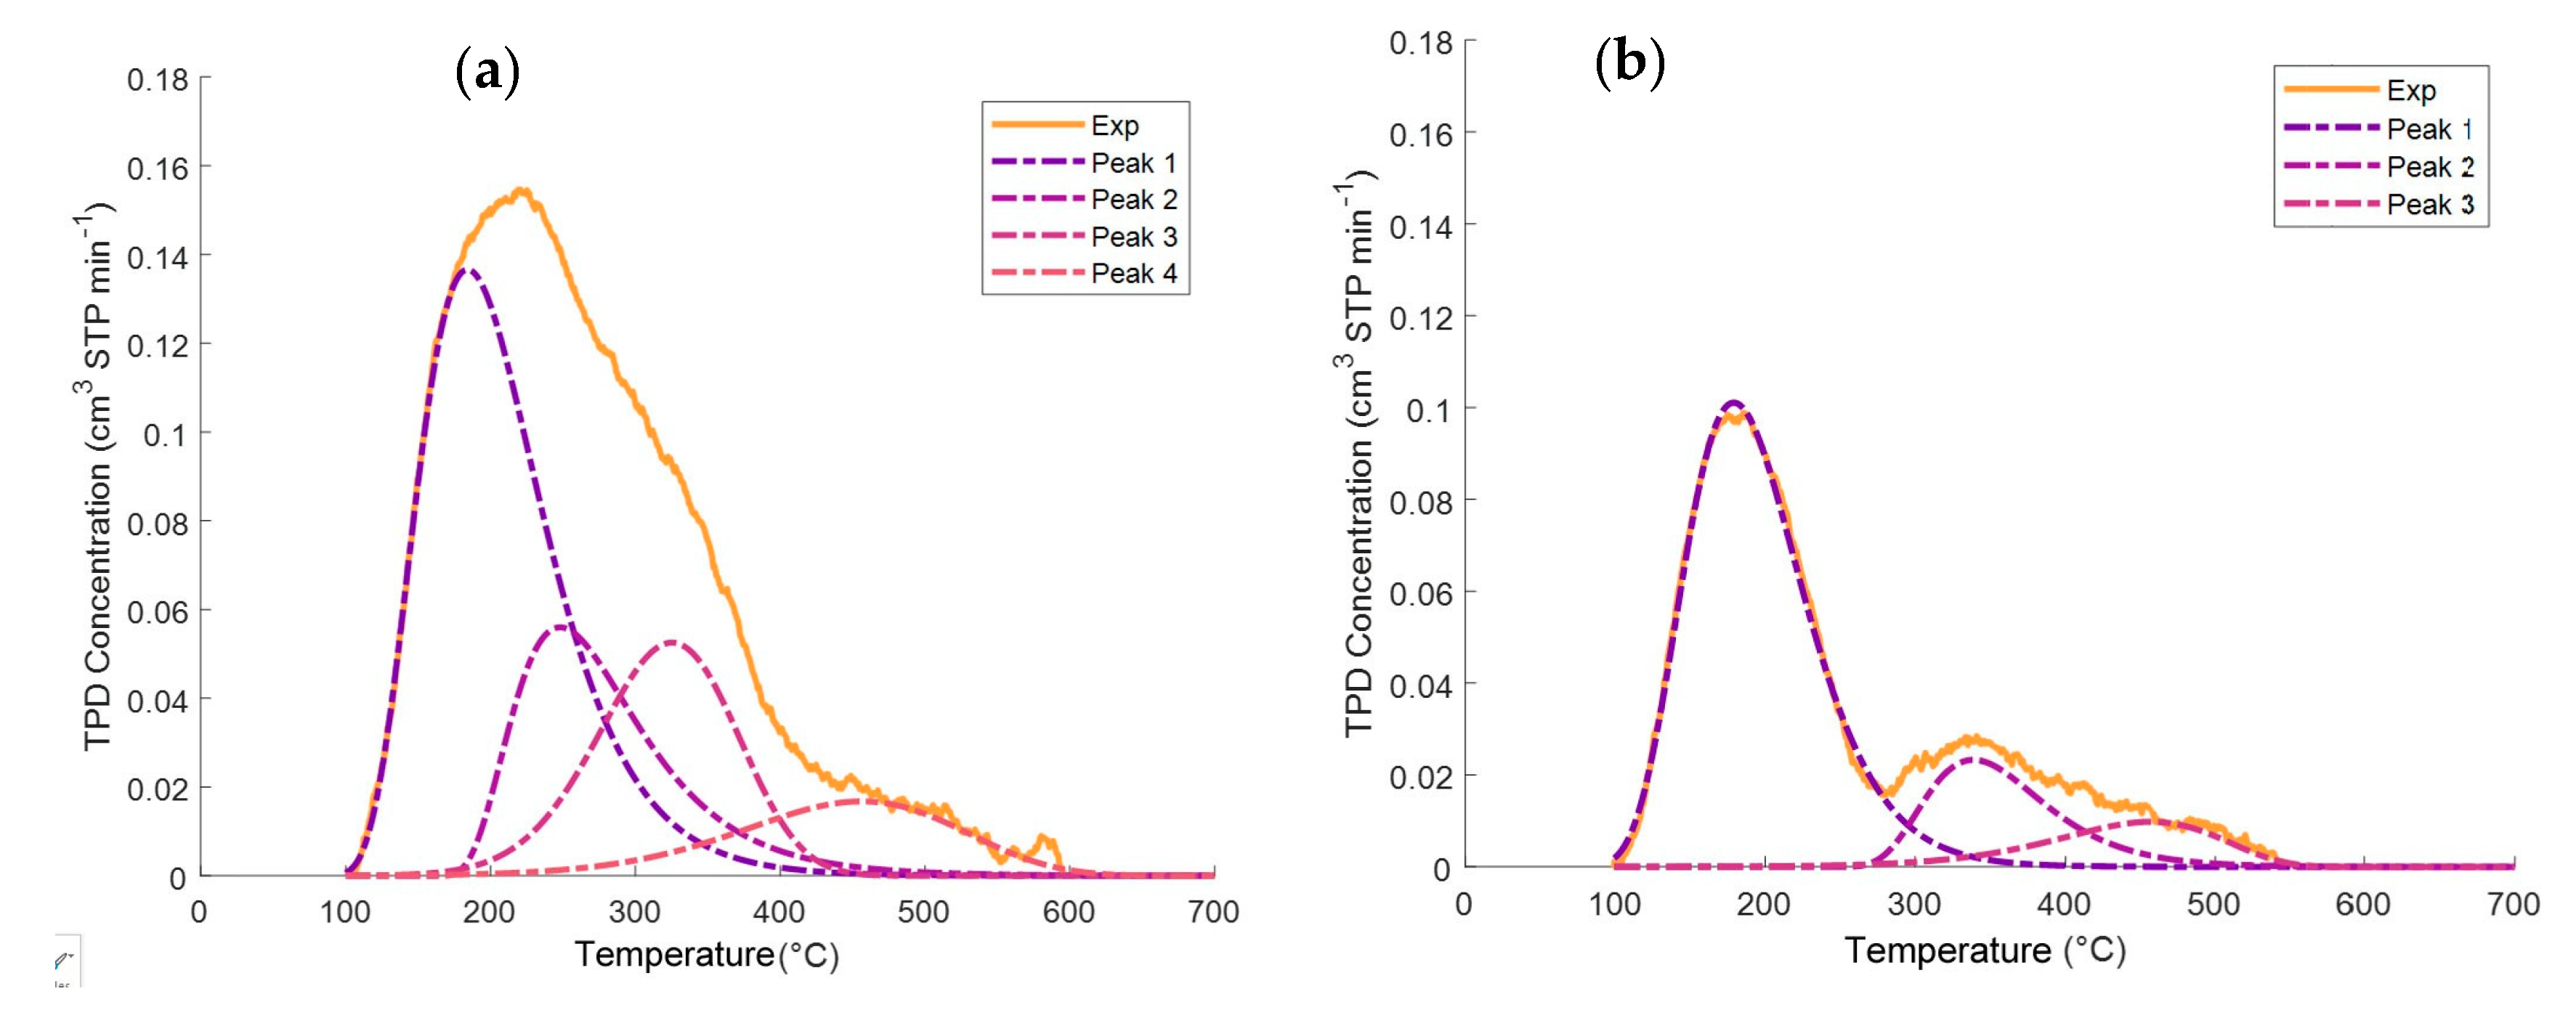
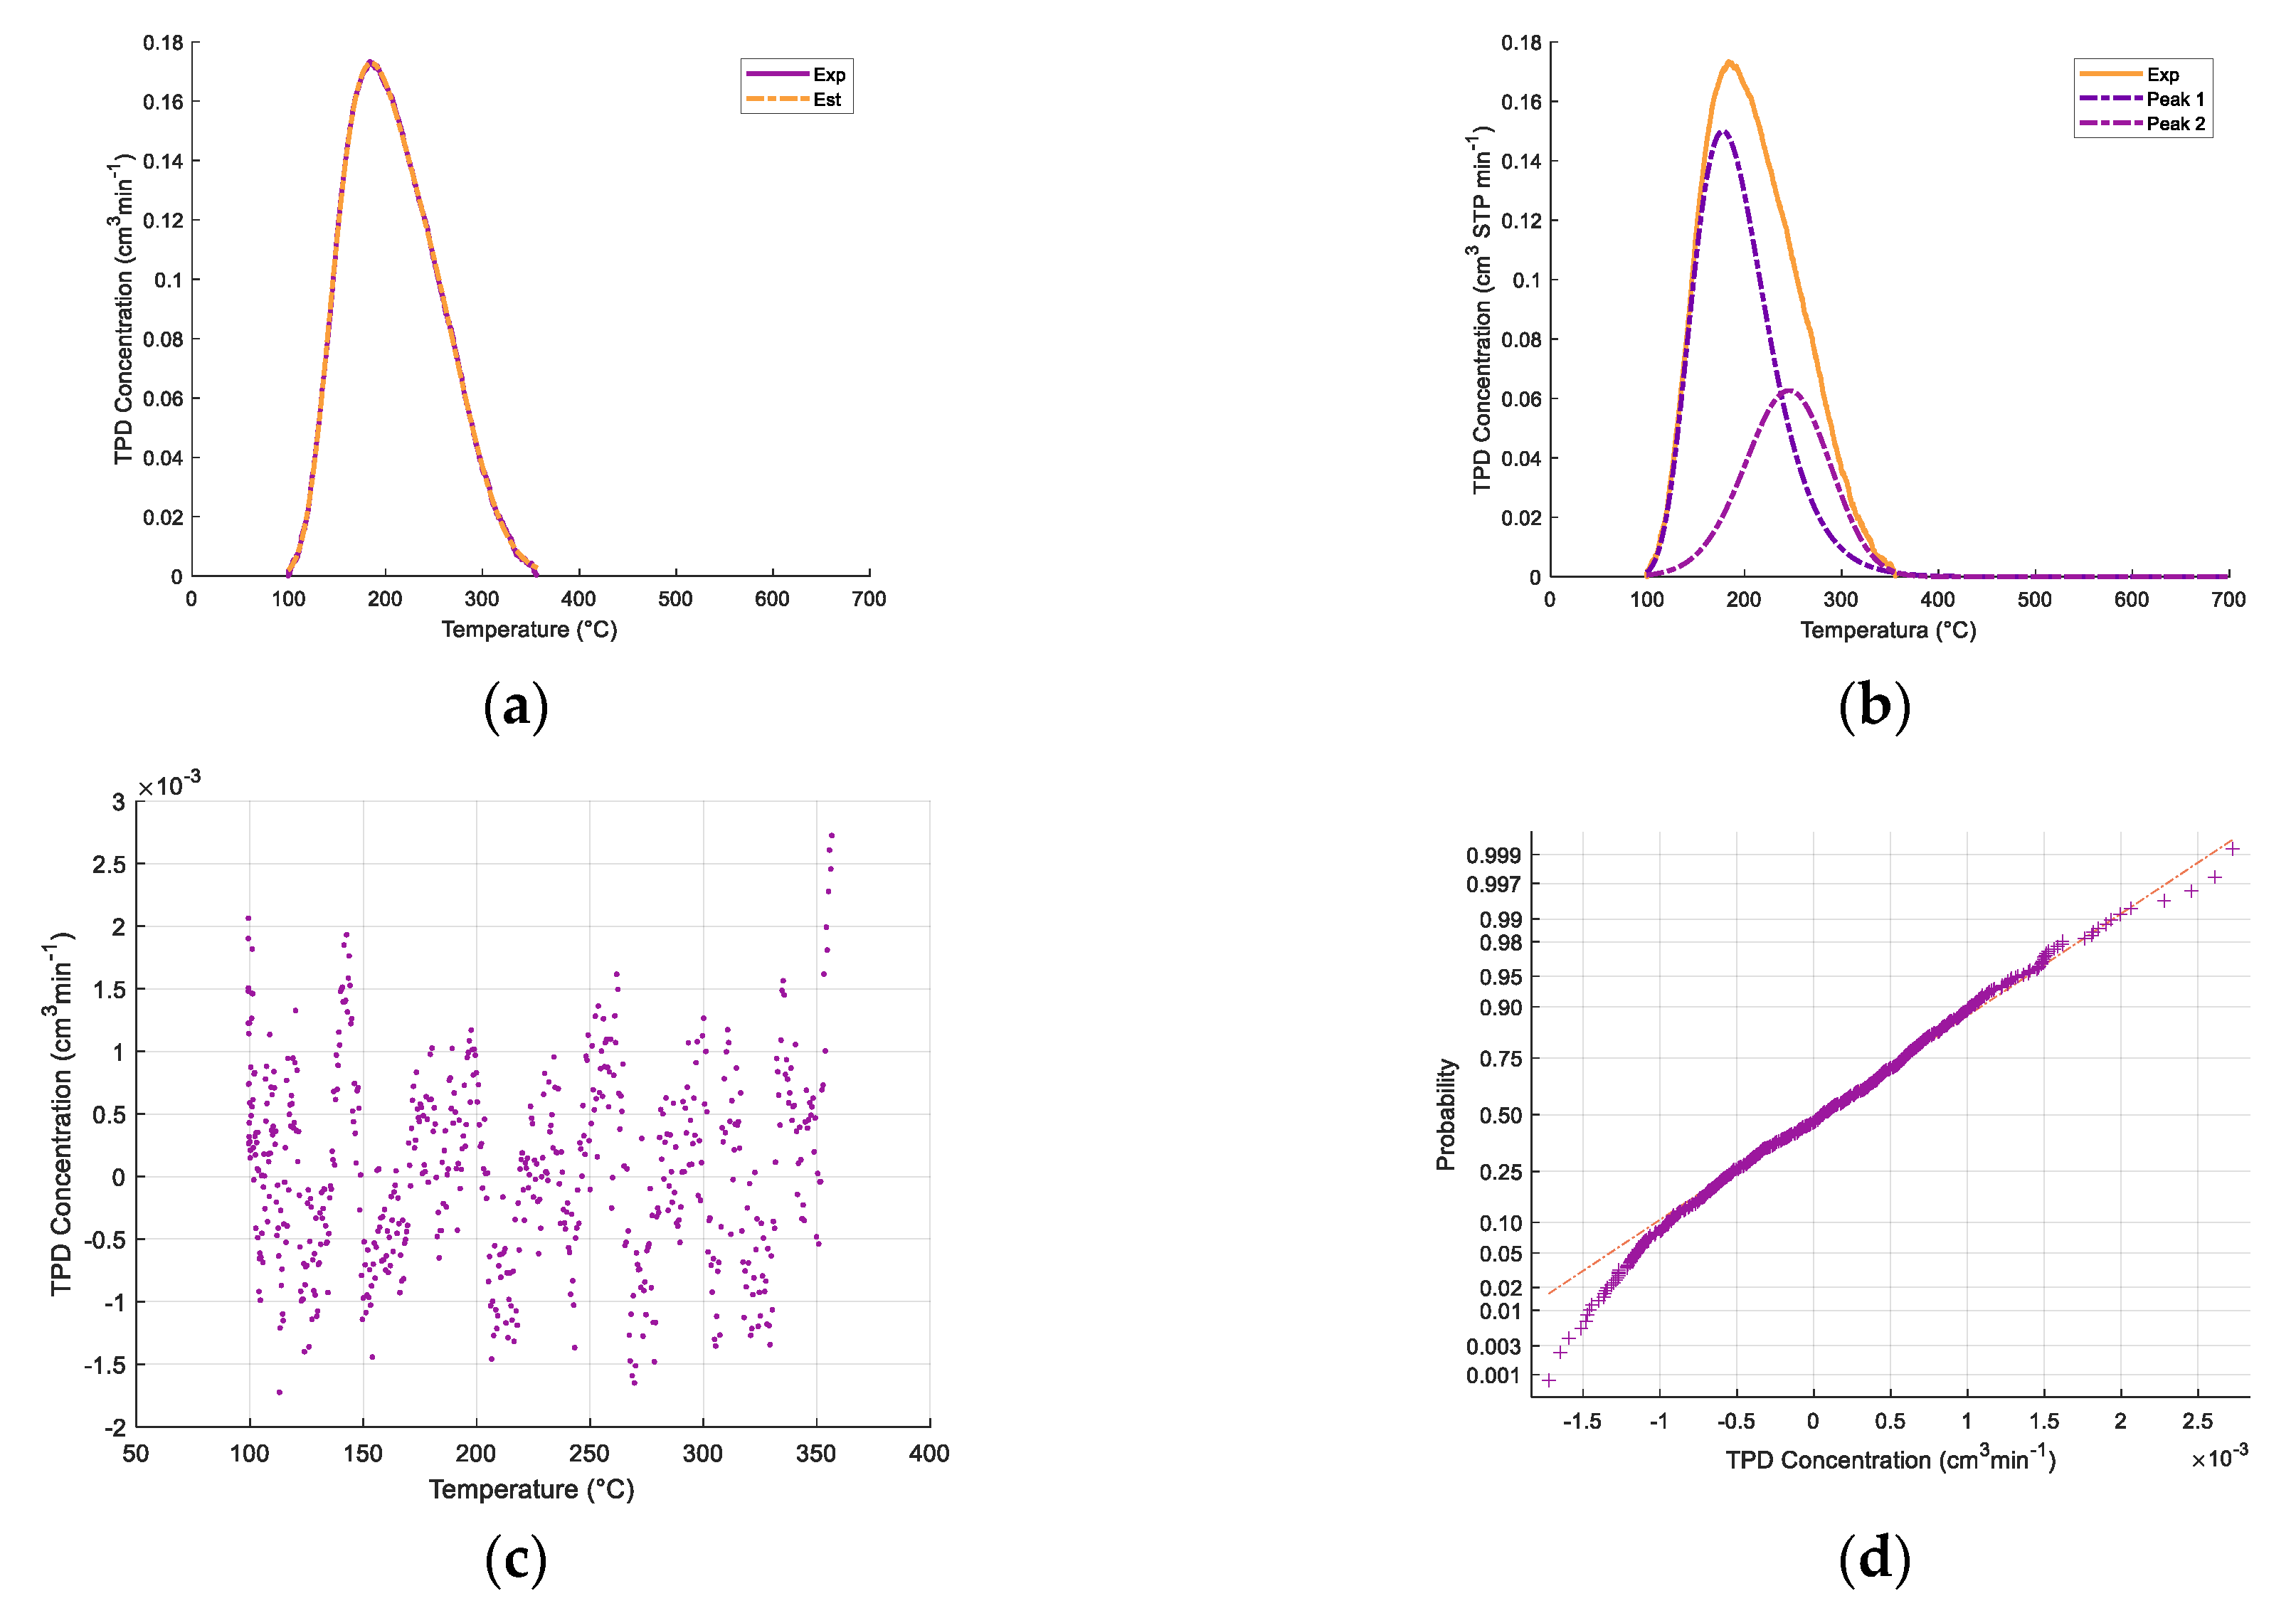
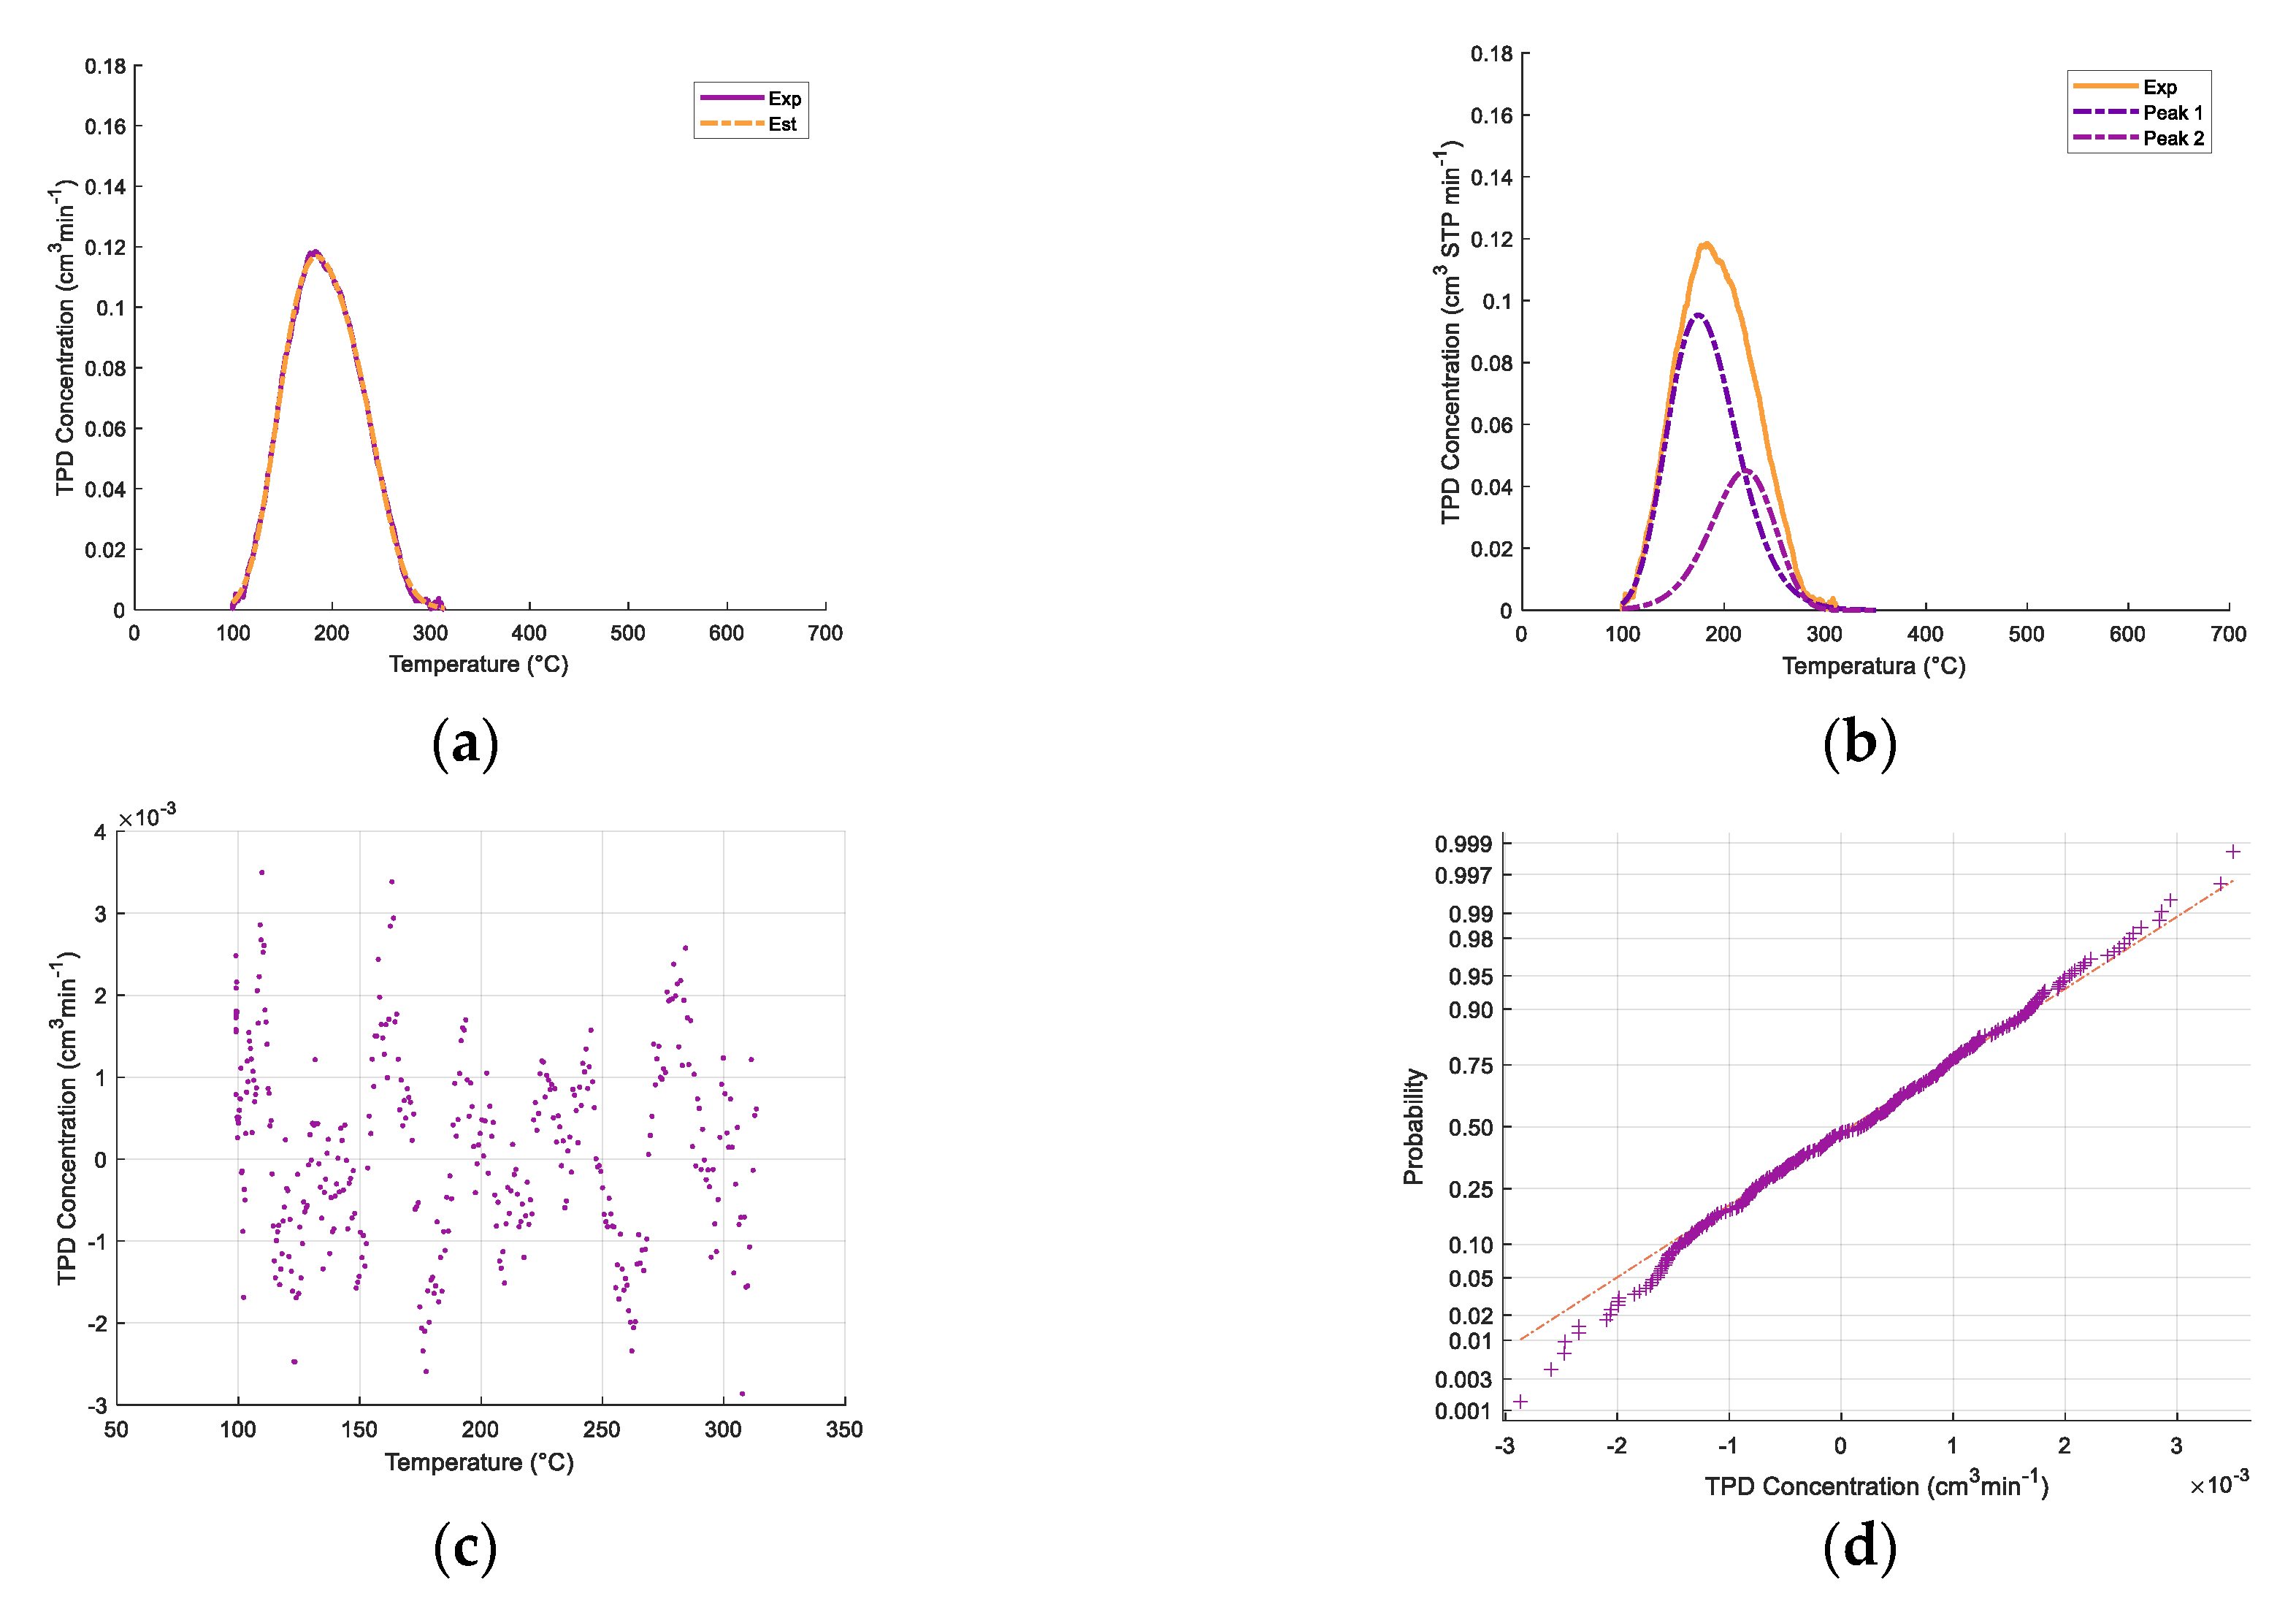
Figure 3 also shows that the relative contribution of various acid type sites is affected by both CaO and iron oxide addition. To quantify this effect, the broad ammonia desorption peaks were deconvoluted, considering four types of acidity sites. It was observed that the NH
3-TPD curve deconvolutions provided in all cases a good NH
3-TPD curve fitting, with random residuals, using three or four normal distribution functions. Regression coefficients were in all cases higher than 99%.
As described in
Figure 4a,b, the NH
3-TPD curve deconvolution suggests four types of acid sites for the γ-Al
2O
3 support and three types of Fe
xO
y/10% CaO-γ-Al
2O
3. Additional information regarding ammonia TPD deconvolution statistical parameters for 5% CaO/γ-Al
2O
3 and 10% CaO/γ-Al
2O
3 is provided in
Appendix A.
Table 3 reports that in both the catalyst and various catalyst precursors of the present study, there are weak, medium, strong, and very strong acid site types.
Regarding the findings in
Table 3, one should note that the TPD ammonia desorbed from the γ-Al
2O
3 support is in line with the studies of Peri et al. [
62,
63,
64], who postulated for γ-Al
2O
3 several acid sites on alumina [
65]. More recent works detected three coordinating sites and one protonic site on a γ-alumina support. These sites were considered too weak to be detected by pyridine adsorption. However, they were able to react with 2, 6 di-tertiary-butyl-pyridine (2,6T). It appears that two of the three coordinating sites interact with oxygen rather than aluminum and can be differentiated with 2,6T. The third weaker coordinating site reacts with pyridine only, given that it is closely associated with one or more hydroxyl groups [
65,
66].
In this respect, while using NMR, Majors and Ellis [
67] deduced that the resonances observed in the γ-alumina support could be assigned to complexes containing coordinately unsaturated surface aluminum cations. These cations occupy tetrahedral and octahedral sites in the defect spinel lattice [
68]. On the other hand, Coster el al. reported that different structural environments for a given Al site on the γ-alumina support yield a distribution of electric field gradient tensor parameters at the site, confirming the assumption that there are four types of aluminum site [
69]. Furthermore, Digne et al. [
66] postulated that both acid concentrations and strengths on the surface sites establish a γ-Al
2O
3 structure on the basis of experimental data and Discrete Fourier Transfer (DFT) simulations. In agreement with this, Wischert at al. [
66] determined three different aluminum Lewis acid centers: (a) one Al
III, (b) two Al
IVa and Al
IVb, and (c) two- and threefold-coordinated O atoms with intrinsic Lewis basicity [
70,
71]. A fourth acid center was also identified and assigned to different acid center interactions. This is due to –HO positions that are apparently affected by alumina reactivity [
70,
72]. Furthermore, other authors claim that the relative distributions of tetrahedral and octahedral Lewis acid sites are functions of the surface preparation conditions [
73].
Table 3 also reports the significant influence of CaO addition to the γ-Al
2O
3 support, which essentially eliminates from the γ-Al
2O
3 support the strong and very strong acid sites, with a significant reduction in weak and medium acid sites. It was also interesting to observe that when comparing the Fe
xO
y/CaO- γ-Al
2O
3 with the γ-Al
2O
3 support with added CaO, one could see that iron species addition reintroduced some strong acidity, as shown in the 1450 cm
−1 and the 1600 cm
−1 bands. The medium strength acid sites, however, disappeared, which is consistent with the Lewis iron species acidity in catalysis [
74,
75,
76].
Thus, one can conclude that even though iron species addition restored some acidity, CaO was effective in reducing 59% of the strong and very strong acidity and 55% of the total support acidity.
2.3.4. Pyridine Desorption Infrared Spectroscopy
Pyridine proton affinity (PA) makes possible the use of pyridine protons as surface probe molecules (pKa = 5.3 at 25 °C in aqueous solution [
61]) able to determine acidity type sites which are present in the solid catalyst [
61]. Infrared spectroscopy of chemisorbed pyridine on γ-Al
2O
3 provides information regarding the nature of its surface acidity [
61,
77,
78,
79]. Therefore, in order to investigate the nature of the acid sites on the γ-Al
2O
3 support following CaO addition, pyridine FTIR analyses were performed. This was done by observing absorbance in the 1400–1700 cm
−1 band range, typically assigned to Lewis site coke formation promoters [
56].
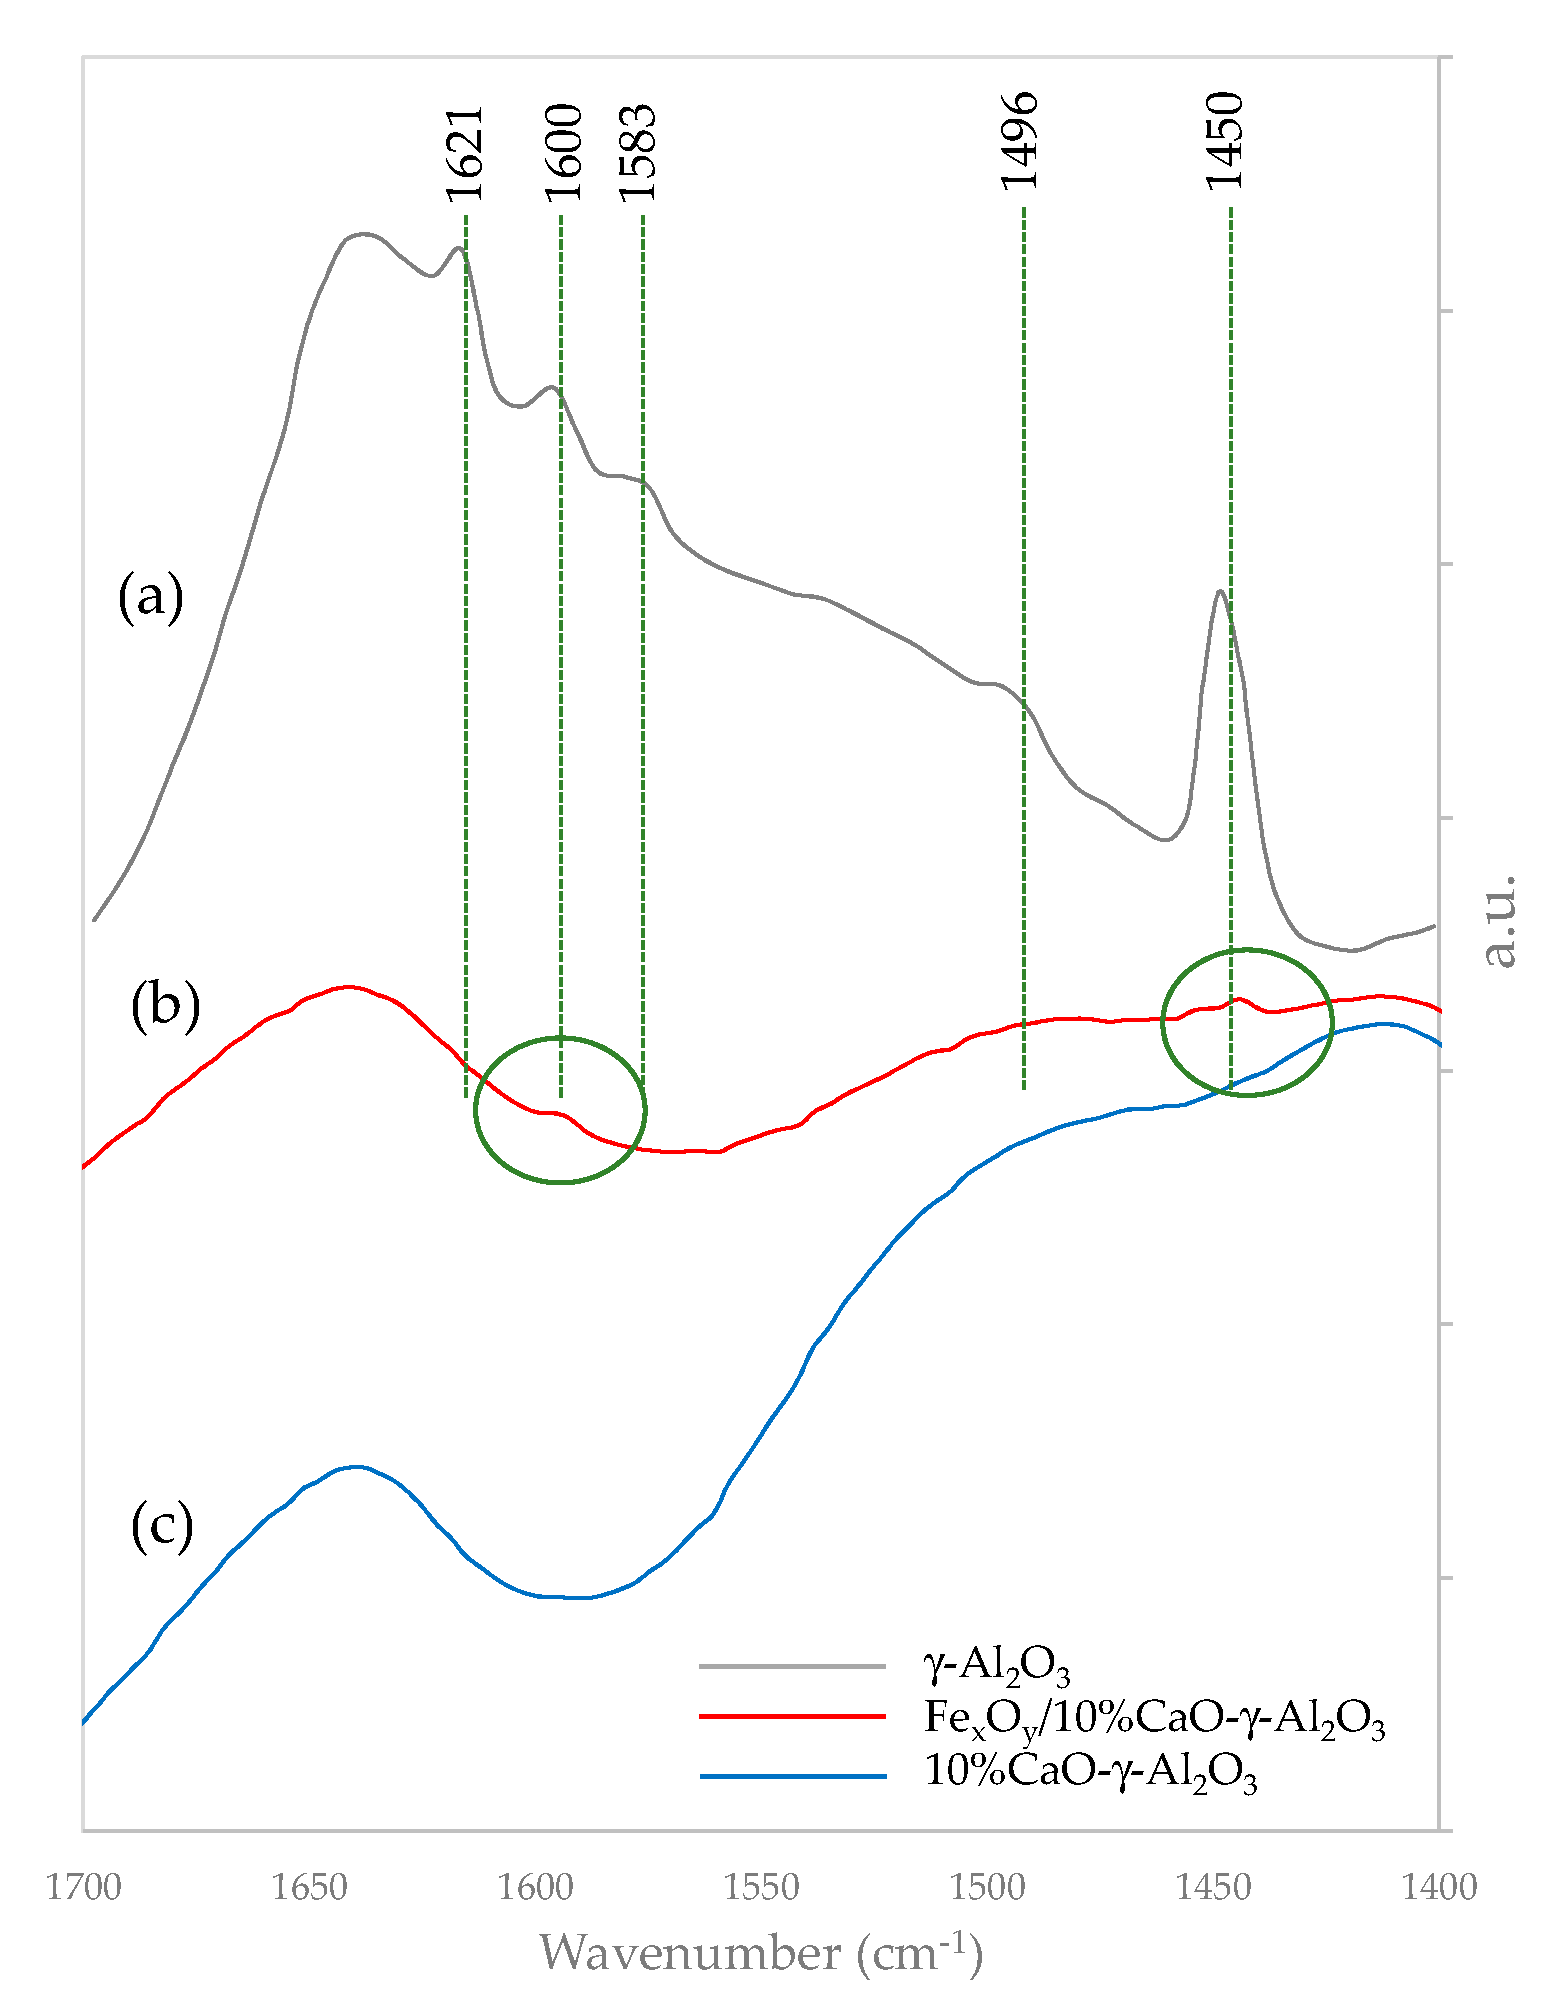
Figure 5 displays the typical IR bands for γ-Al
2O
3 at 1621 cm
−1, 1600 cm
−1, 1583 cm
−1, 1496 cm
−1, and 1450 cm
−1 wave numbers assigned to coordinated bonded pyridine (CBP) and hydrogen bonded pyridine (HBP) as follows: a) the 1621 cm
−1 and 1600 cm
−1 bands for CBP, b) the 1583 cm
−1 and the 1496 cm
−1 bands for CBP and HBP, and c) the 1450 cm
−1 band for HBP. For the sample with CaO added, no band at 1450 cm
−1 was observed. This indicates that there are no Lewis acid sites remaining on the calcium oxide modified γ-Al
2O
3 support with the required strength to form pyridinium ions [
71,
77,
80]. Furthermore, and according to Mazumder and de Lasa, the acid character in band 1621 cm
−1 can be associated with very strong acid sites, while peaks at 1600 cm
−1 and 1583 cm
−1 on the γ-Al
2O
3 support can be considered to be moderate and weak acid Lewis site types [
81].
Figure 5 also shows that the introduction of CaO in the γ-Al
2O
3 bulk substantially reduces its acidic alumina character, with no IR bands being detected. However, it appears that with iron addition, some moderate acid is reintroduced, as shown in the 1450 cm
−1 and 1600 cm
−1 bands. It is believed, nevertheless, that given the value of the eco-friendly catalyst in this study, further investigations are warranted in order to determine the precise catalyst structure changes, elucidating the potential sterical constraints.
2.3.5. Chemical State of Catalyst Species
Based on the present study’s eco-friendly catalyst for tar reforming, it was considered adequate to evaluate the catalyst using the fluidized CREC riser simulator in the 500–650 °C range. The catalyst was frequently contacted with oxygen from air, in order to combust the formed coke. Furthermore, both catalyst reactivity and stability were also evaluated, using hydrogen TPR/TPO (Temperature Programmed Reduction/Temperature Programed Oxidation) analysis, with a 20 °C/min temperature ramp and a maximum temperature close the one during runs in the CREC riser simulator.
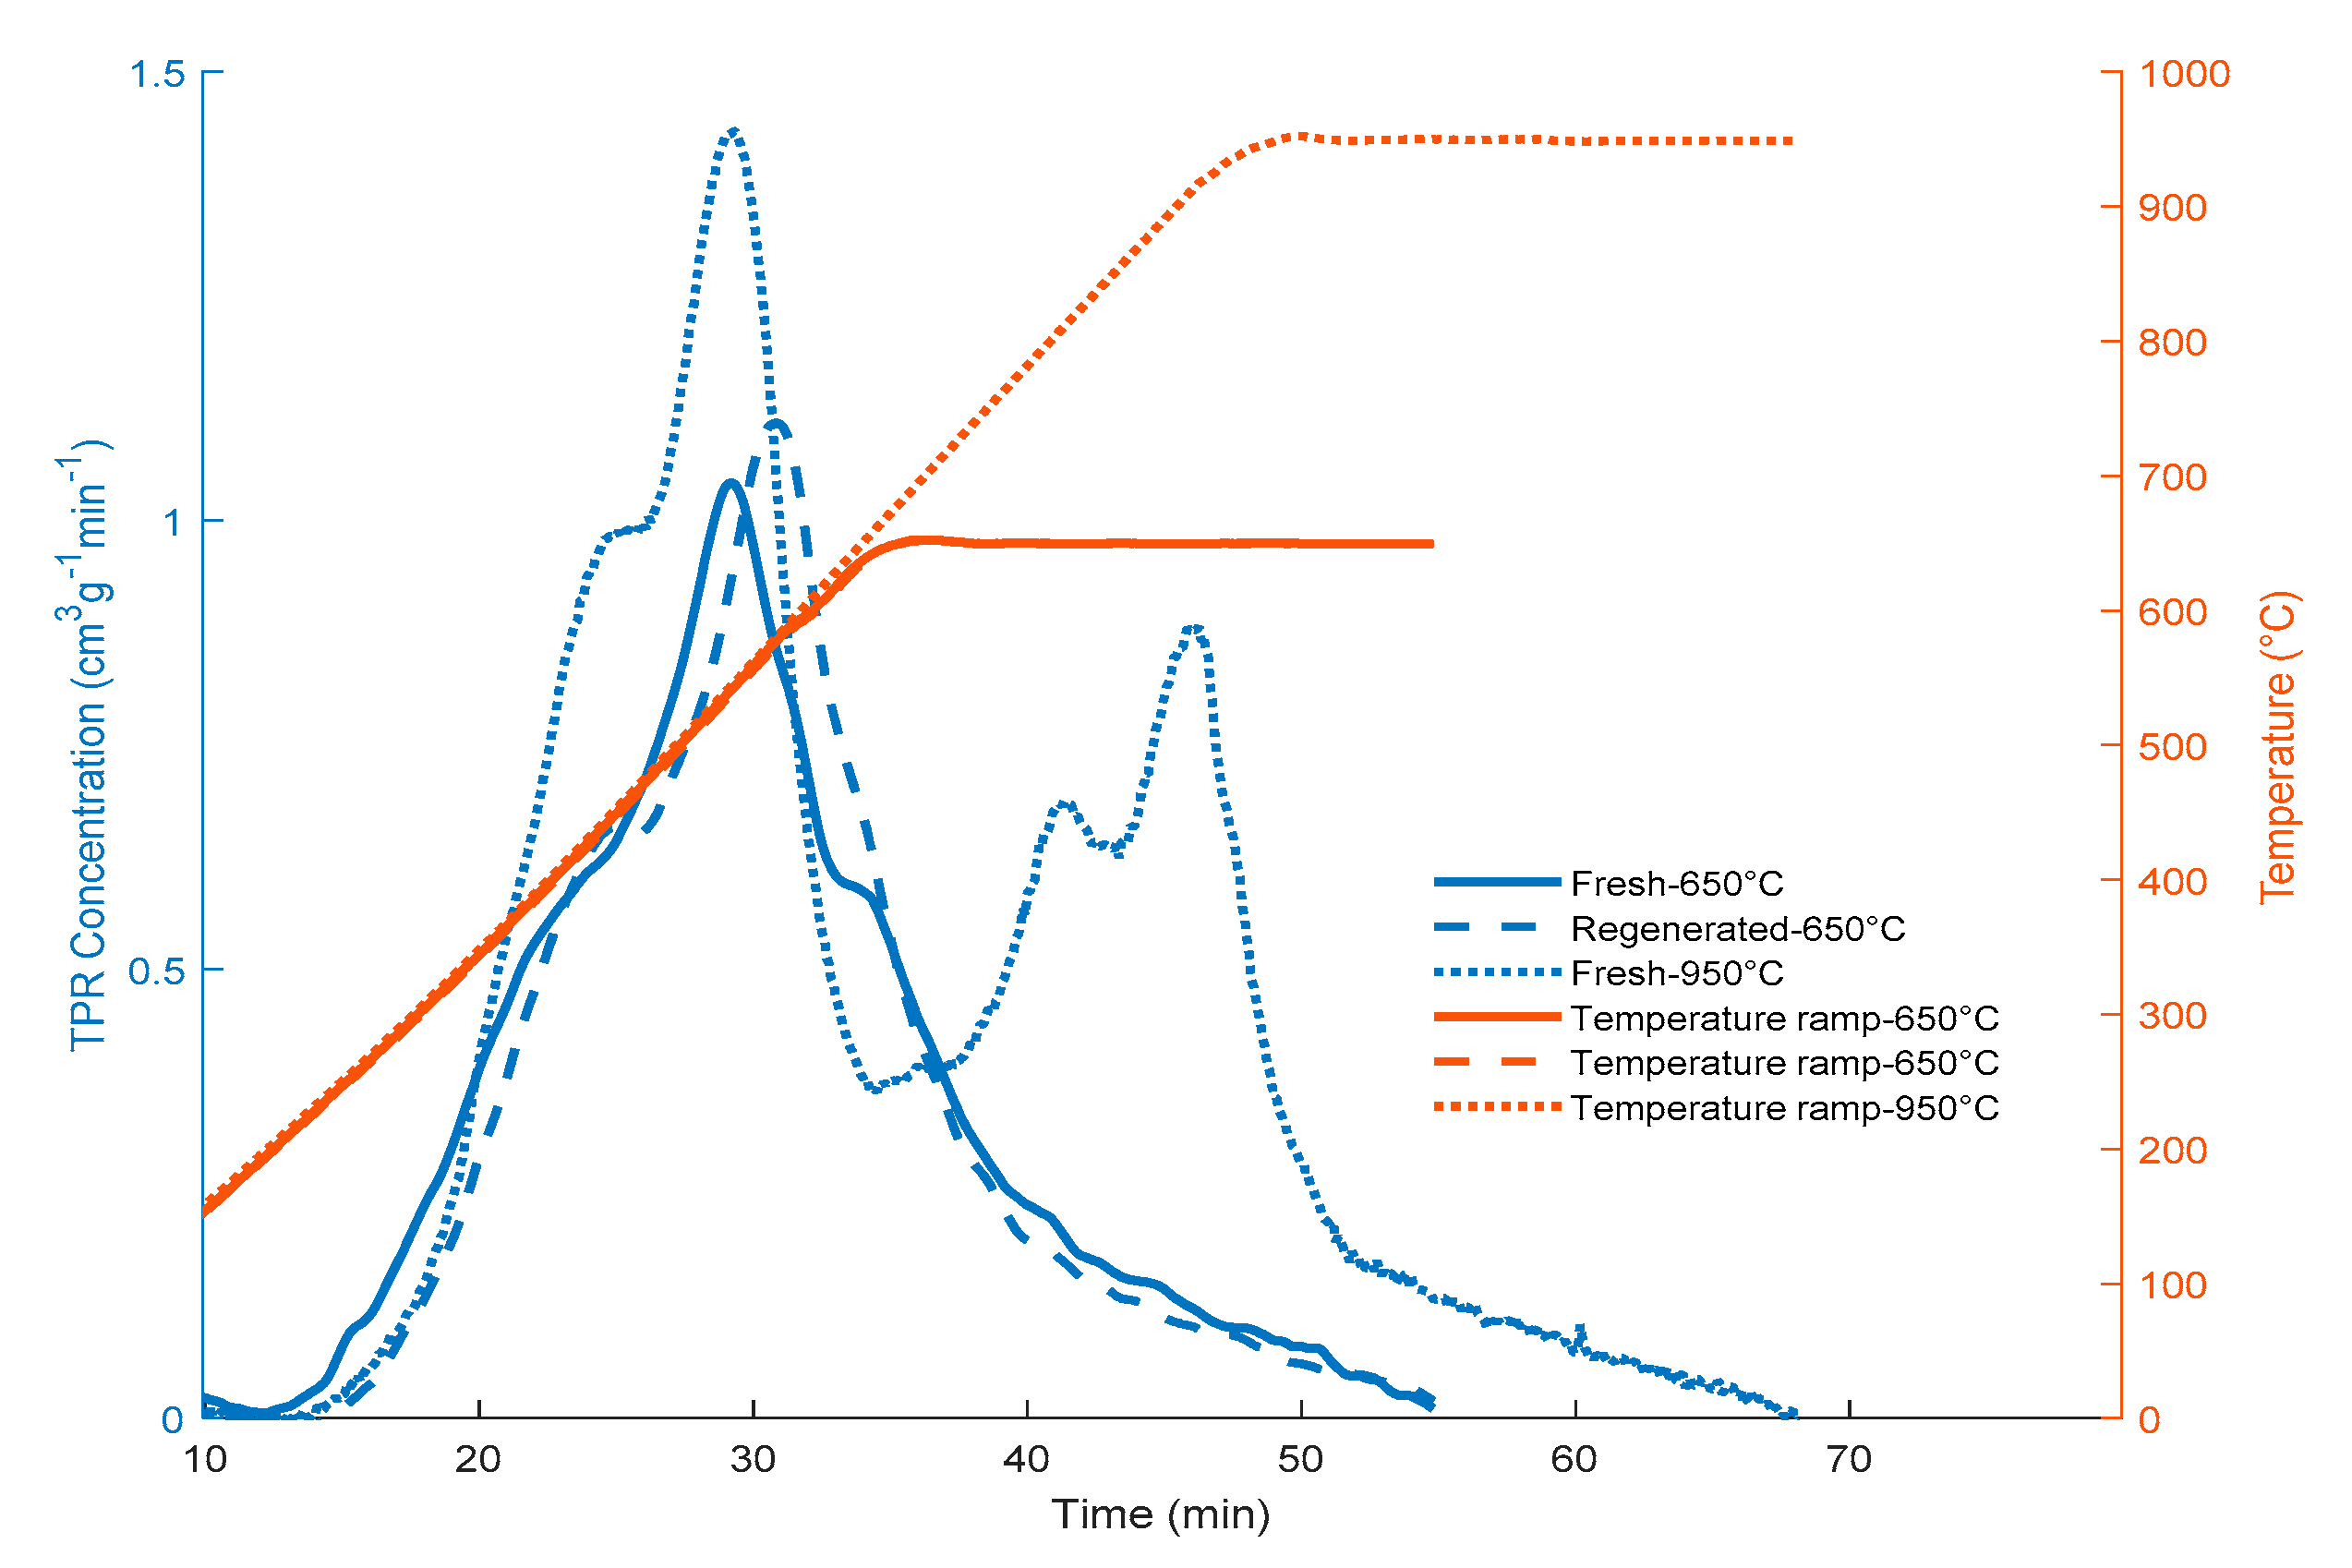
Figure 6 reports the sequential Fe
xO
y/10% CaO-γ-Al
2O
3 catalyst reduction–oxidation using TPR and TPO, with a 650 °C upper temperature. One can observe that the amounts of hydrogen consumed with the fresh and used catalysts after re-oxidation, as reported in
Table 4, were very close: 15.15 cm
3 STP H
2 for the fresh catalyst and 14.6 cm
3 STP H
2 for the re-oxidized catalyst. One can also observe that the TPR peaks for both the fresh and the regenerated catalyst were essentially identical. This supports the view that the amounts of iron species available for the reaction with the 2M4MP remain unchanged following coke combustion and catalyst pre-reduction.
Furthermore, and considering the need to establish how the loaded iron value compared with the nominal iron value expected to be impregnated, TPR experiments were carried out at 950 °C, using the same 20° C/min temperature ramp. It was anticipated that under these conditions, all iron species present would be fully reduced to metallic iron:
Table 4 reports the hydrogen consumed via TPR when using a fresh catalyst and when the upper TPR temperature was 950 °C. On this basis, one could calculate a 4.14 wt% metallic iron content, which is very close to the anticipated 4 wt% iron nominal loading value. This provides confirmation that the proposed catalyst’s incipient wetness impregnation technique with an iron precursor, as used in the present study, was adequate in order to reach the expected iron levels.
Another interesting result from
Table 4 is the fact that iron species that were reduced to 650 °C only involved a hydrogen consumption which was about half the 4.14 wt% when the upper thermal level was 950 °C. This means that the state of the pre-reduced catalyst for 2M4MP conversion involves a significant amount of partially reduced iron species. In this respect, it is well known that iron reduction has multiple and simultaneous steps, with their extent of occurrence being a function of the upper reduction temperature and the reduction time [
82,
83,
84,
85]. Similar findings were obtained by Pineau et al. [
83].
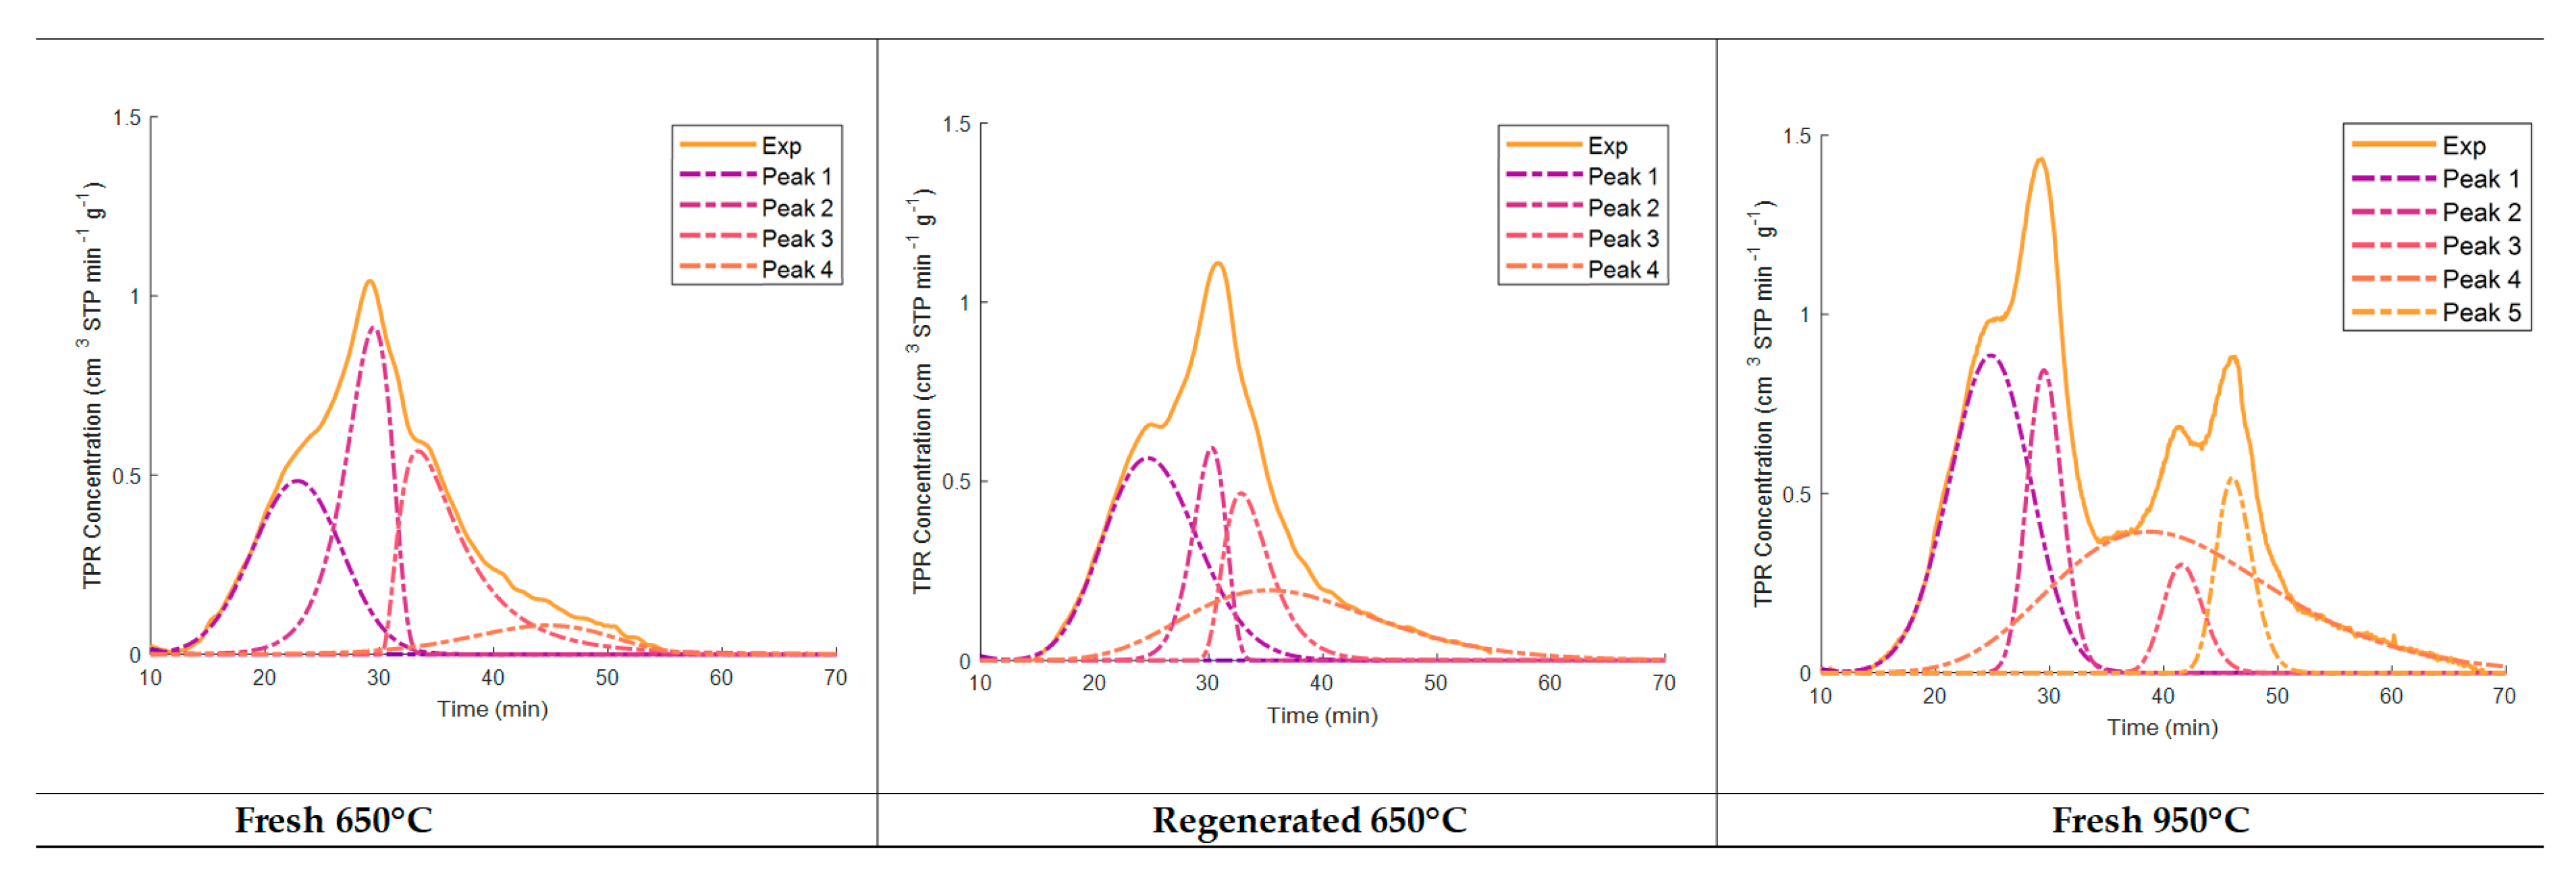
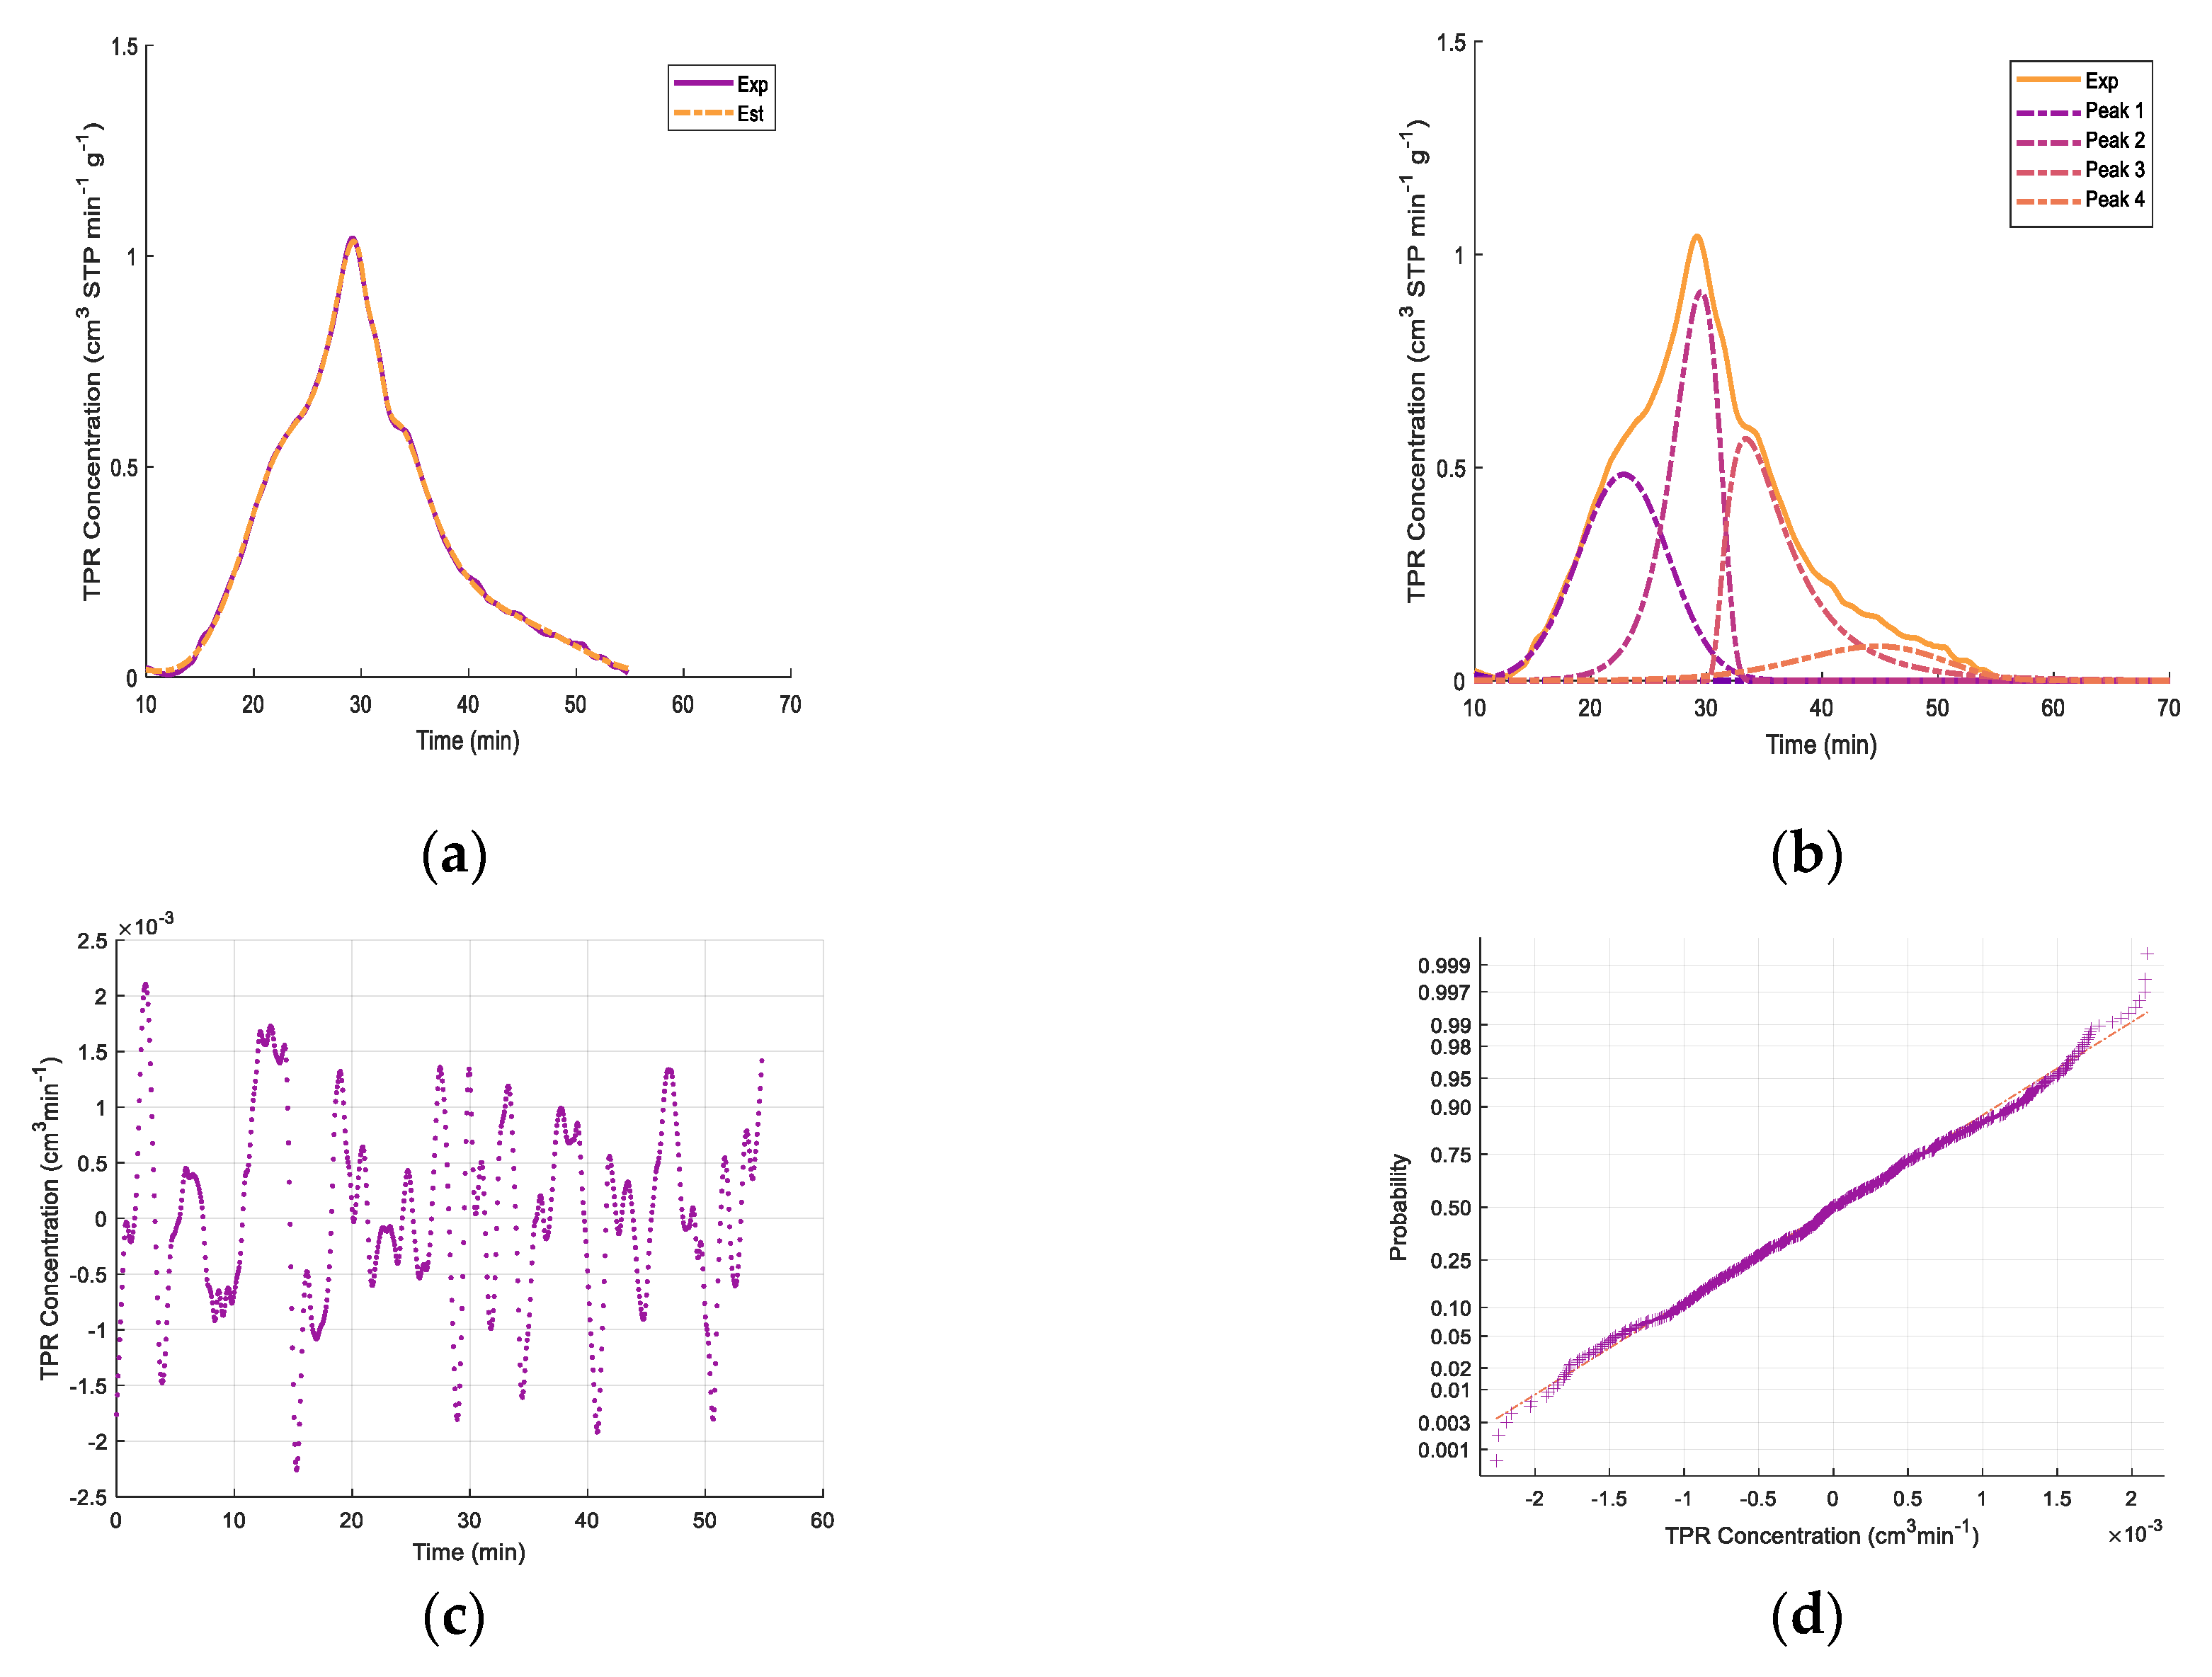
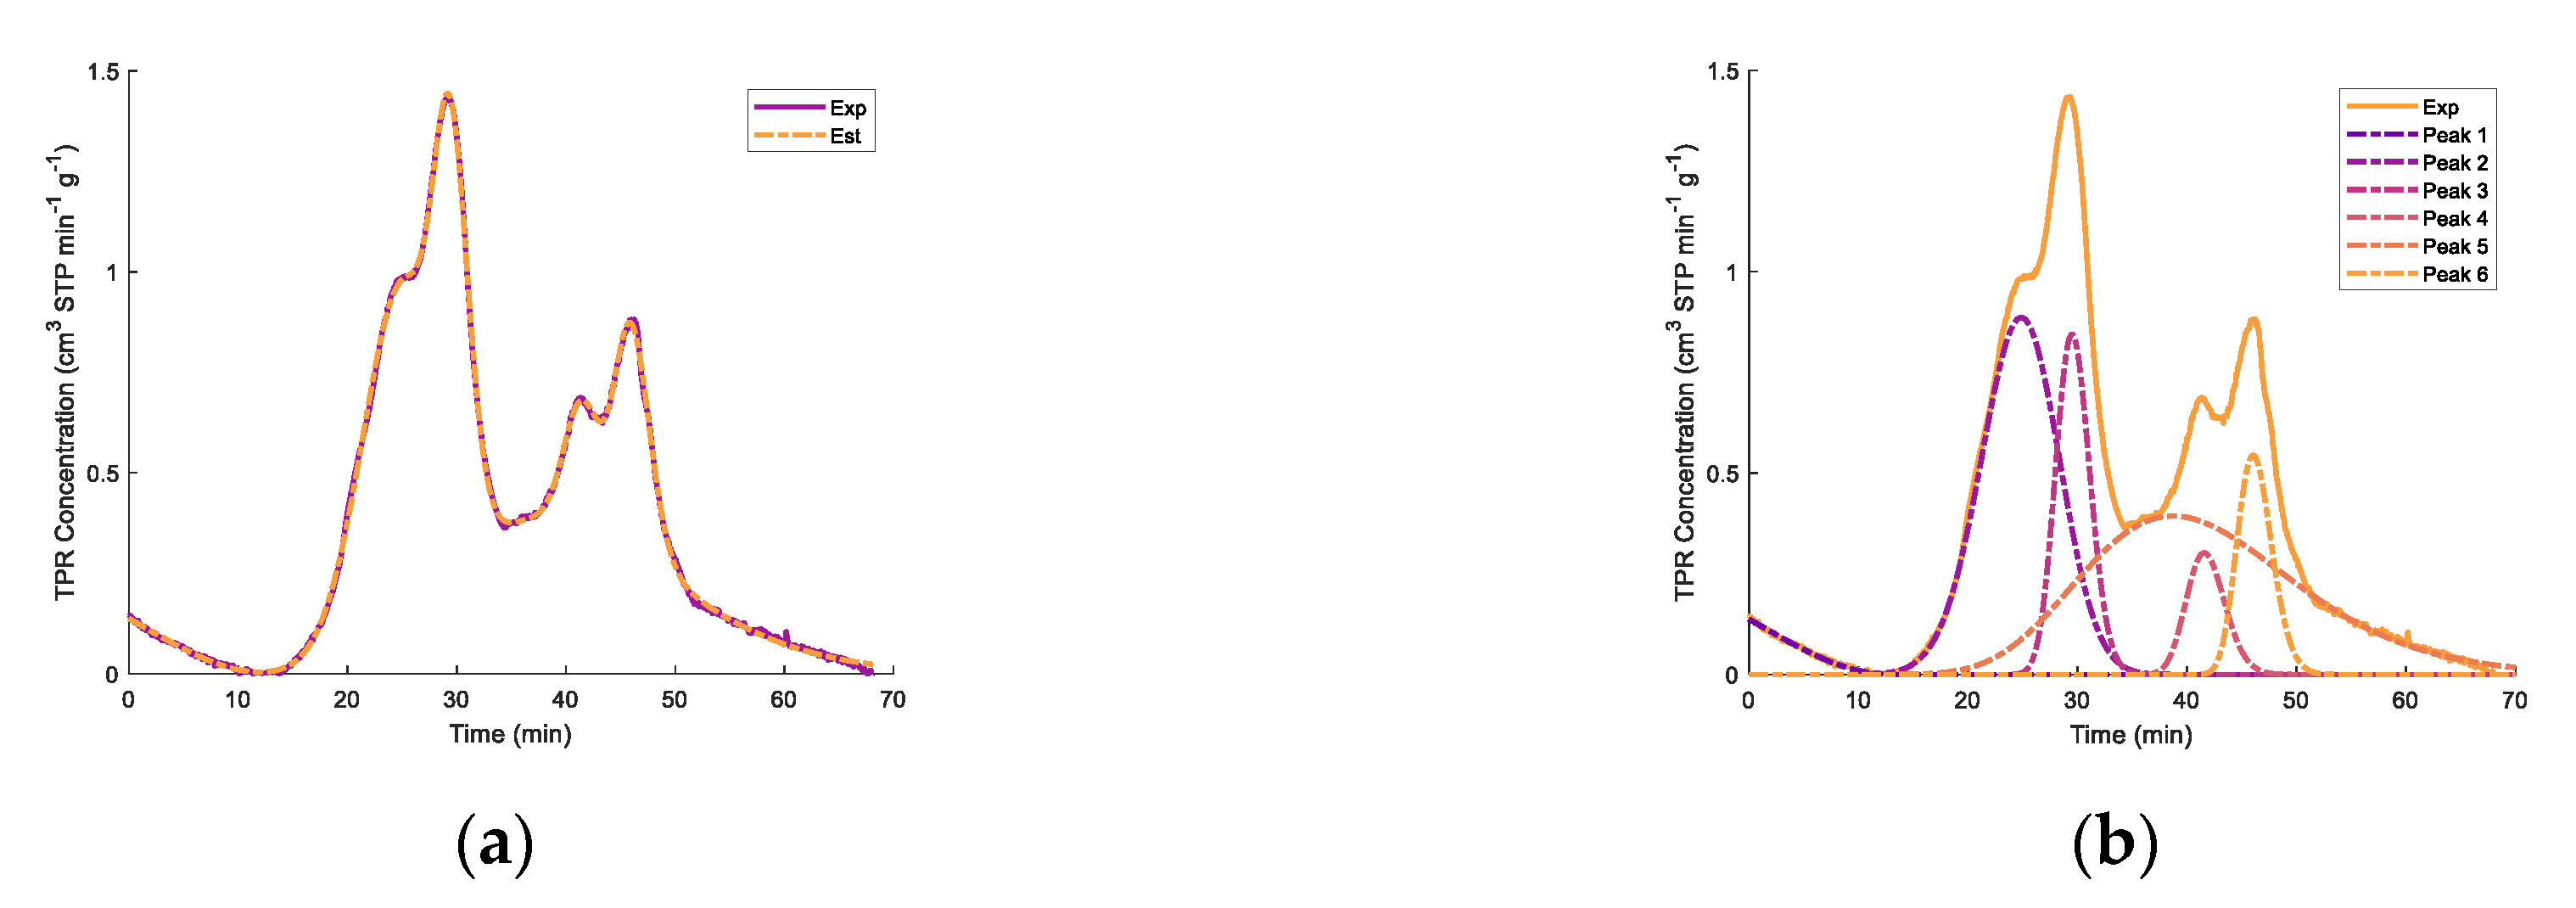
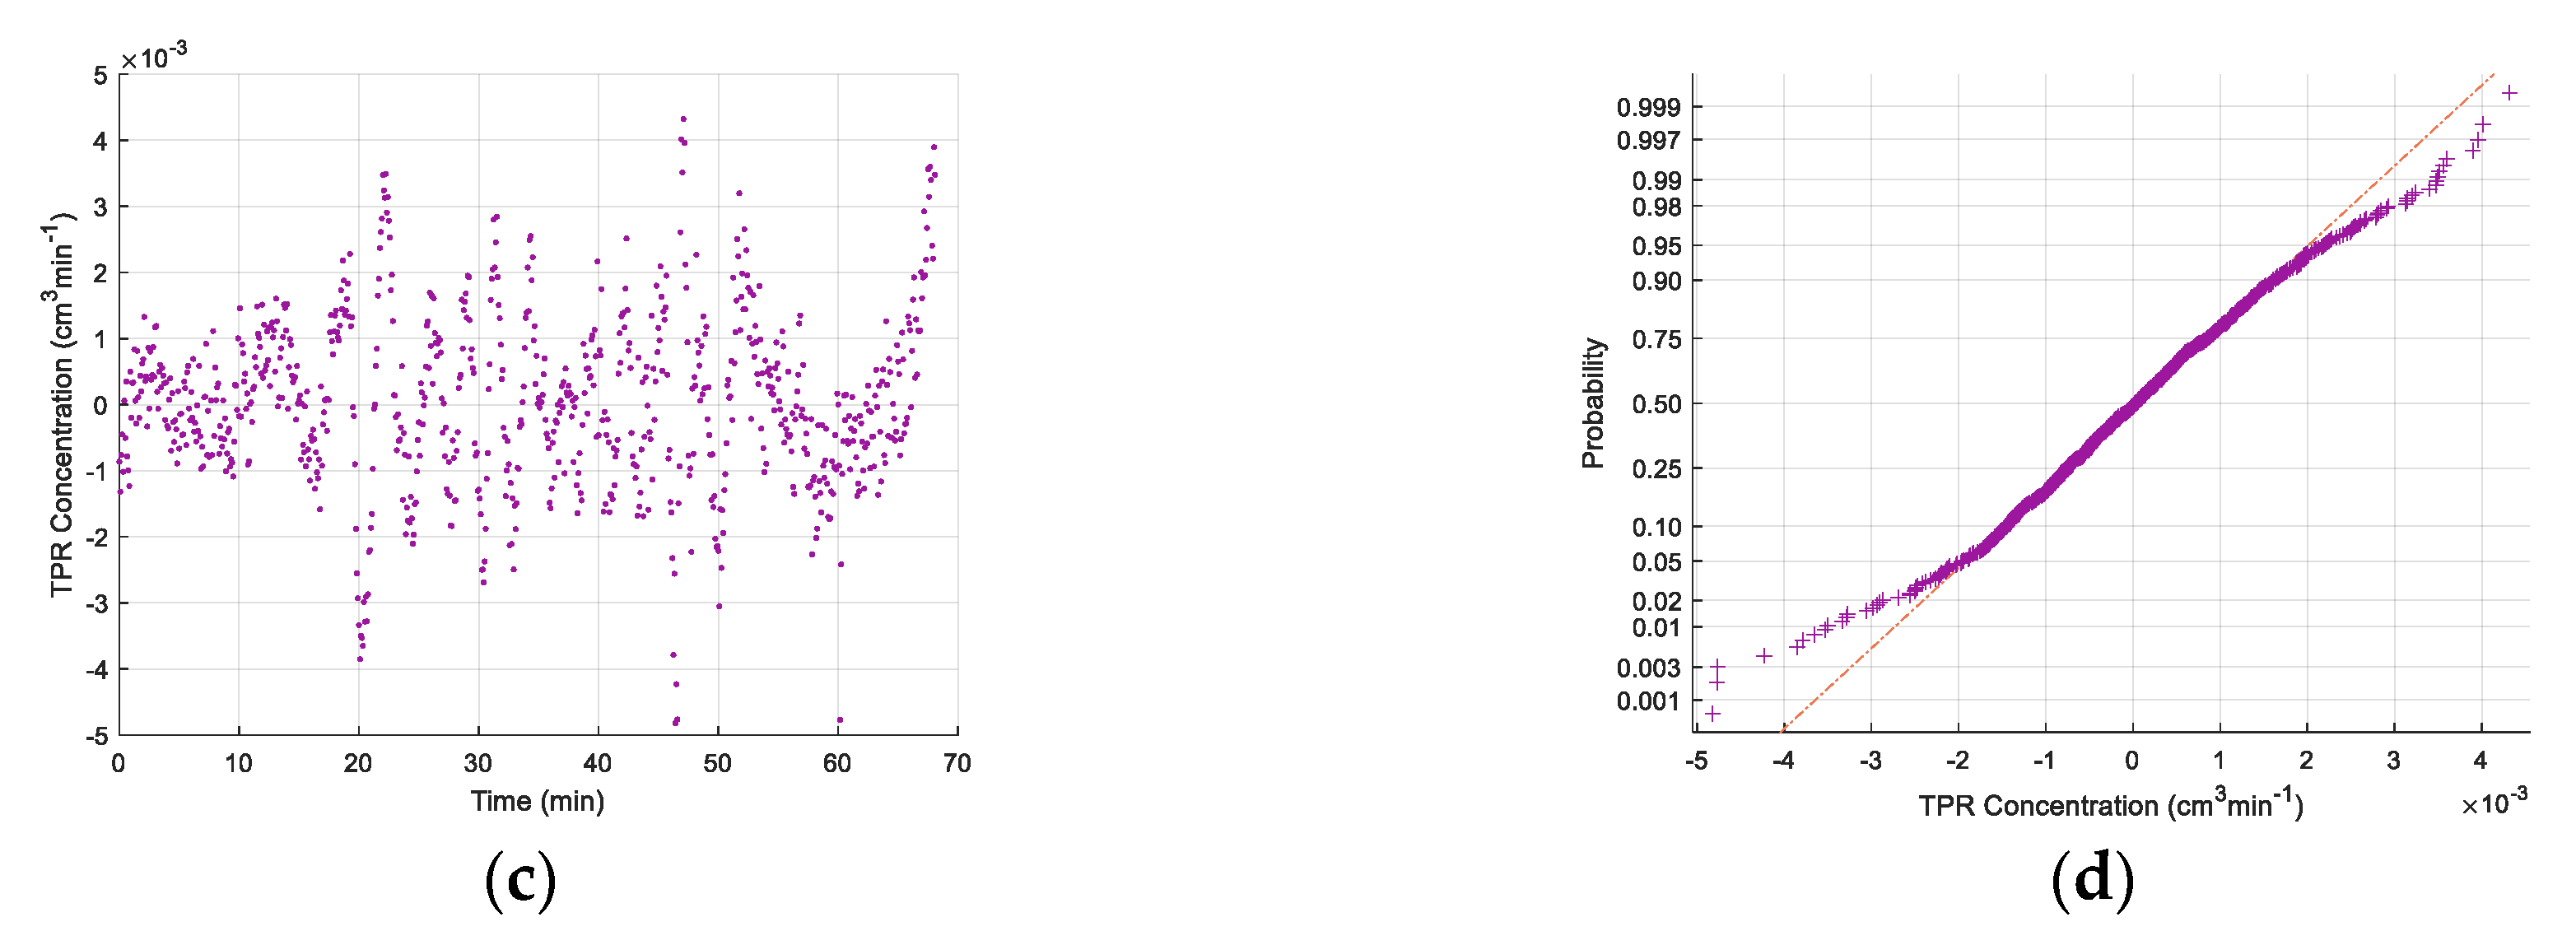
Regarding the TPR peaks, deconvolution was attempted in order to elucidate the reduction stages, as suggested by Jeong et al. [
85] and Pineau at al. [
82,
83].
Figure 7 shows the deconvolution of the TPR peaks using normal probability distributions as well as random residuals. It was observed that the 650 °C upper temperature for both the fresh and regenerated catalysts involved TPR peak deconvolution, showing four significant reduction stages. As well as for catalyst TPRs with a 650 °C maximum temperature, differences were observed between the second peak and the third and fourth peaks, with the total TPR hydrogen consumption remaining close. This suggests the important extent of the reduction of the Fe
2O
3 species, with the fresh samples having a higher consumption of hydrogen in step 2 and the regenerated catalysts having a higher consumption of hydrogen in steps 3 and 4.
It appears that the polymorphous transformation of Fe
2O
3 to Fe
3O
4 starts with the removal of surface oxygen ions by hydrogen, followed by Fe (II) diffusion. Wei et al. [
86] indicated that for iron oxide nanorods, the crystal structure of the Fe
2O
3 determines the rearrangements of iron cations and oxygen anions. In this case, a similar cubic structure evolves in a topotactic process without crystallographic change, making the migration of Fe (II) more energetically favorable. These iron oxides can provide reactivity [
87,
88,
89,
90,
91], contributing to the catalyst activity.
The iron oxide reduction mechanisms may include an oxide hydroxide transformation into magnetite as one of the first reaction steps [
92], as described in Equation (2):
Furthermore, and according to Equations (3) to (6), iron oxides (hematite) can be further reduced to magnetite, then to the stable
wüstite, and finally to iron metal [
93], according to the percentage oxygen content. In this respect, the 570 °C thermal level appears to be of critical importance to determine the extent of these reactions [
82,
83,
84,
85,
94,
95]:
Thus, given the 650 °C upper reaction temperature of the present study, we can expect, as observed via TPR, the influence of several successive steps, as described via Equations (3)–(6).
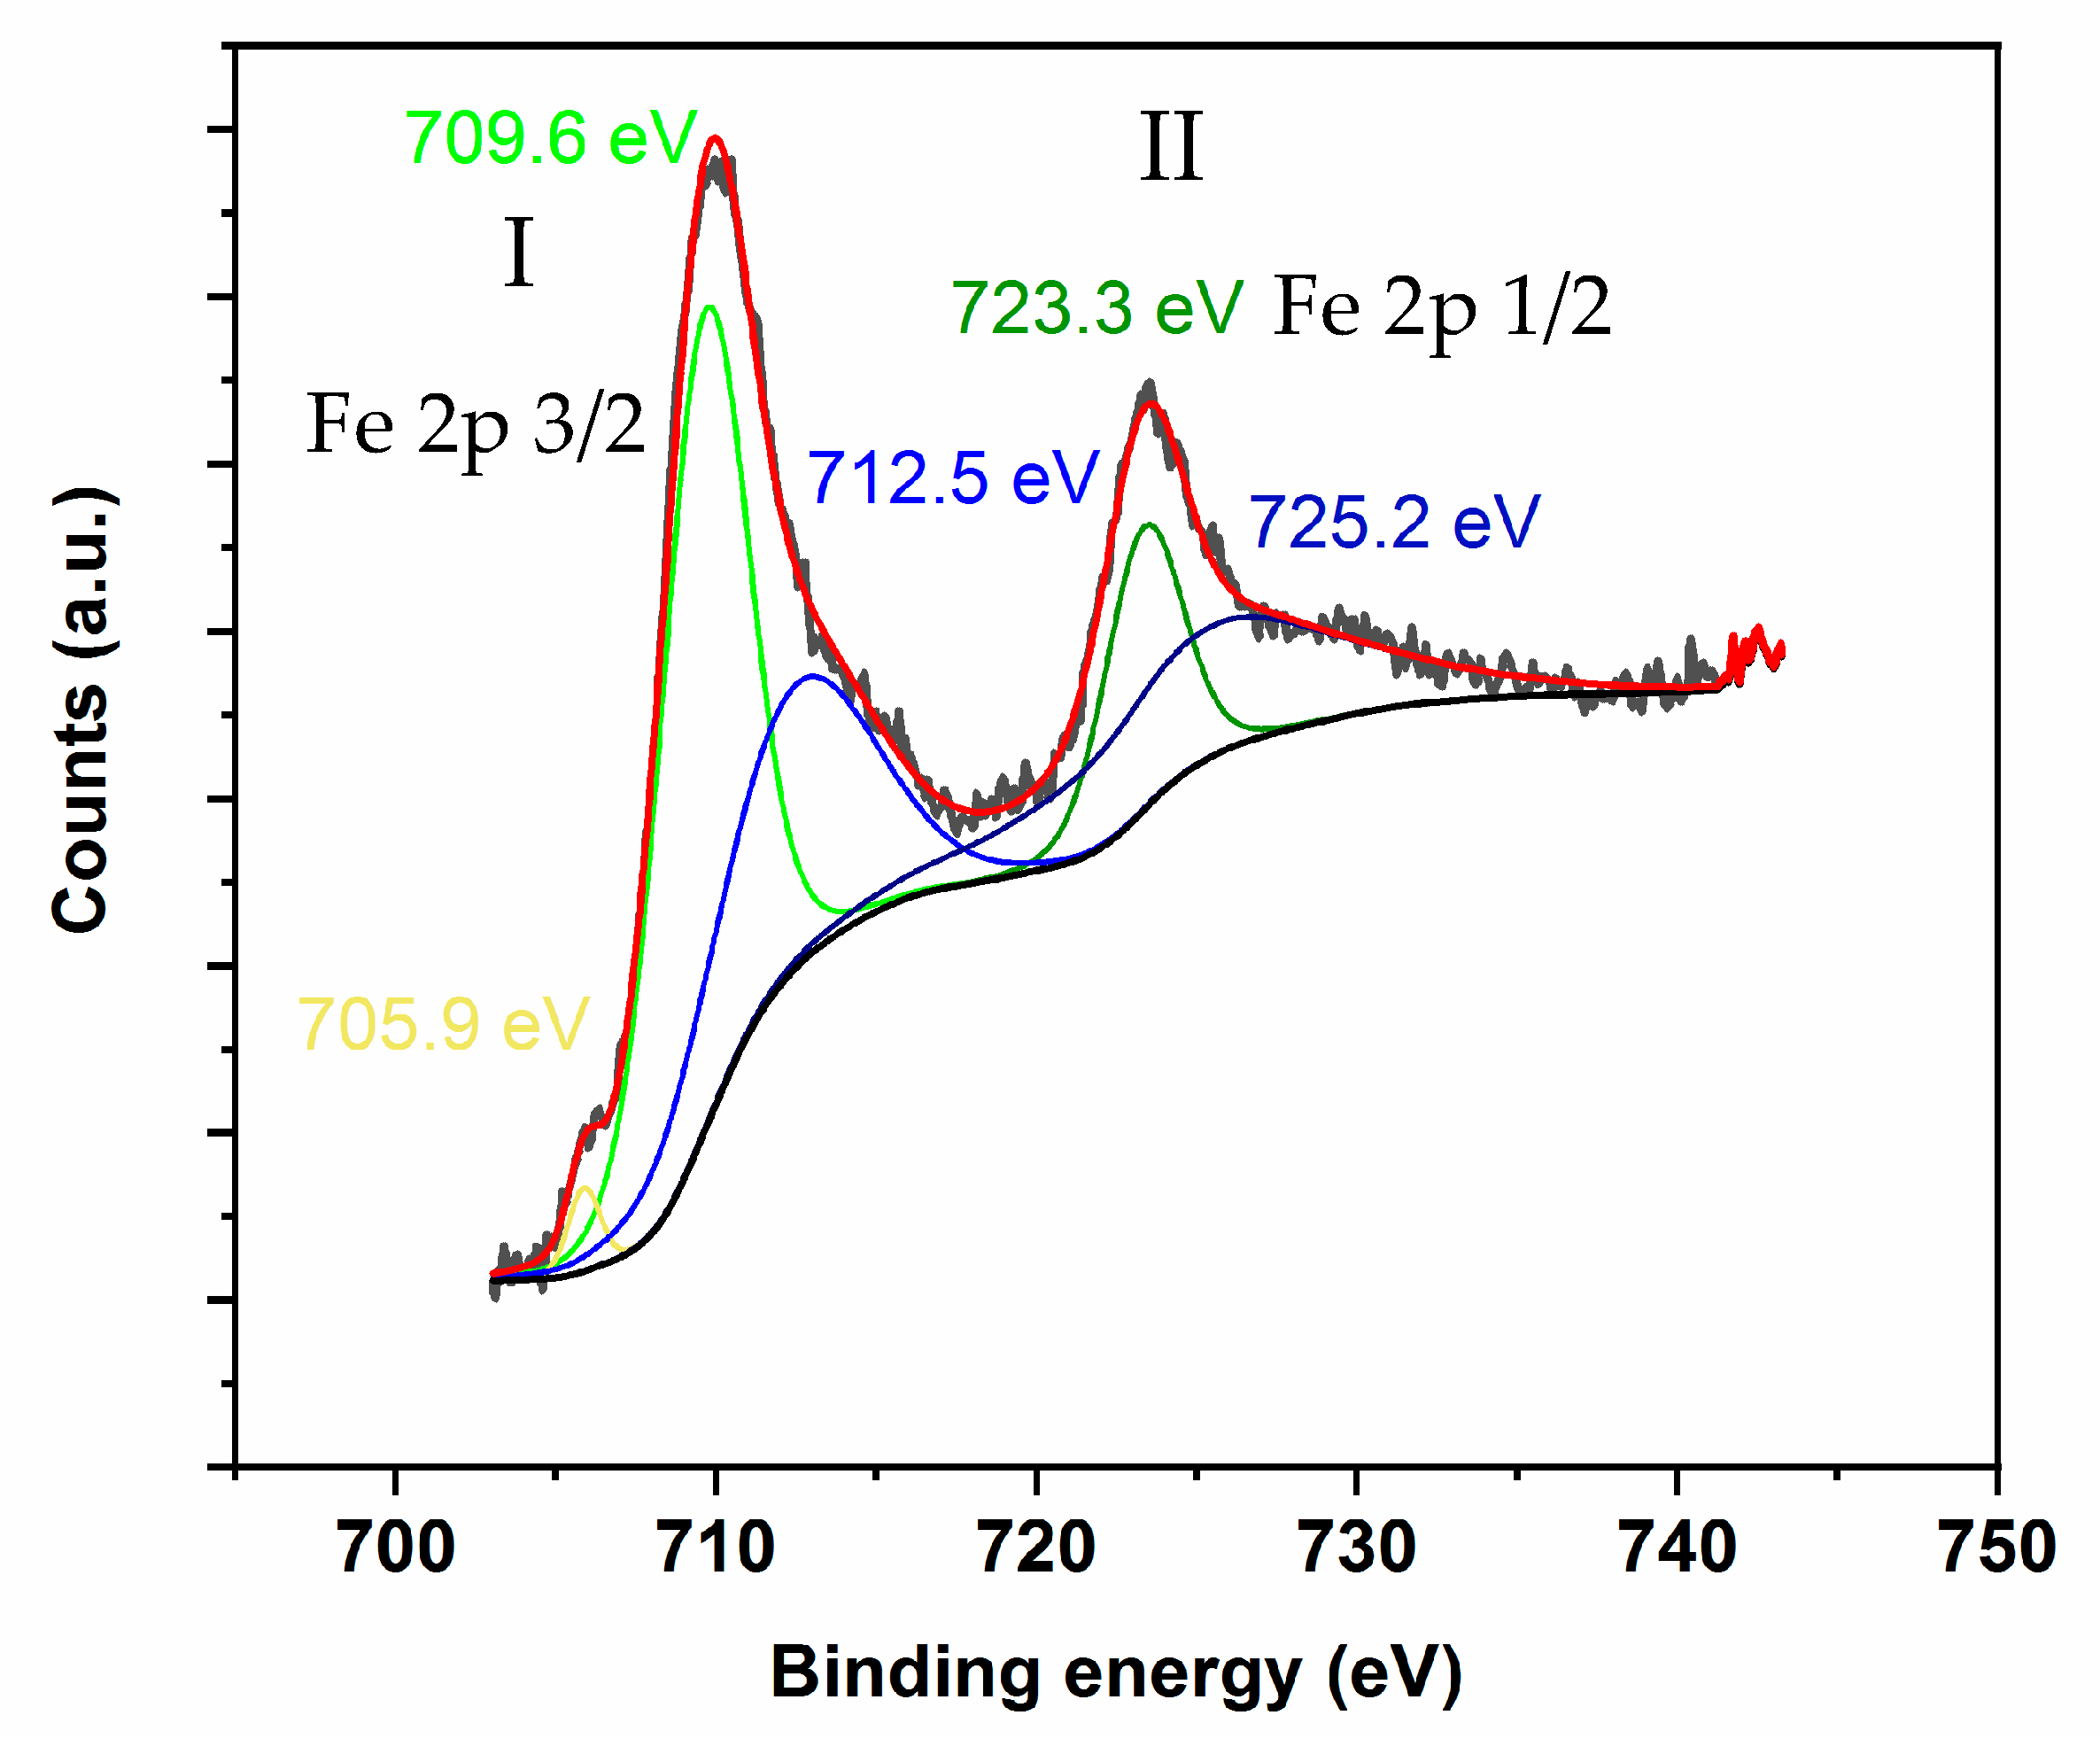
However, to ascertain more precisely the exact chemical state of the iron species following catalyst re-oxidation and partial reduction, an XPS analysis was developed, as shown in
Figure 8. Results obtained by others allowed us to show that XPS can be used to analyze iron oxide species [
96,
97].
Figure 8 shows two major XPS peaks in the 703–733 eV energy binding bands: (1) the first one in the 704–717 eV binding energy range corresponding to Fe 2p 3/2 and (2) the second one in the 718–733 eV binding energy range assigned to Fe 2p 1/2. As for the high-resolution XPS spectra of Fe 2p, the peaks at the binding energies of 709.5 and 723.4 eV are characteristic of Fe(II) 2p3/2 and Fe(II) 2p1/2, whereas the peaks at 711.5 and 727.4 eV are assigned to Fe(III) 2p3/2 and Fe(III) 2p1/2, respectively [
98,
99].
Additionally, the peak at 706.1 eV can be assigned to metallic iron, while the peak at 717.4 eV can be attributed to a Fe 2p3/2 satellite peak [
100]. This is consistent with the presence of the iron species on the catalyst’s surface, as observed by XPS, displaying mixed valences as (Fe
3+)
tetra and (Fe
2+Fe
3+)
OctaO
4, with Fe
3+ and Fe
2+ XPS [
101]. Thus, the XPS results obtained for the pre-reduced catalyst at 650 °C can be assigned to an iron species blend, likely Fe
3O
4, FeO, and Fe, together with the unconverted Fe
2O
3. These XPS findings are in line with the research of Fujii et al. [
101], where it was shown that the 709 eV main XPS peak is proportional to the Fe
2+ ions formed. The XPS peaks observed in our study are also consistent with Grosvenor et al. [
102], who described an XPS Fe(II) 2p1/2 satellite peak.
Therefore, on the basis of the XPS data and as shown in
Figure 8 using peak deconvolution, one can establish that for the 650 °C pre-reduced catalyst, one achieves a Fe
+2/Fe
3+ = 1.592 blend composed of Fe
2+ and Fe
3+ iron species, with the FWHM (full width at half maximum) being in the adequate range for those species.
Furthermore, on the basis of the hydrogen consumed at both 650 °C and 950 °C, as described in
Table 5, and as per the calculations reported in
Appendix D [
103], it can be predicted that the prepared catalyst at the selected conditions involves the following distribution of iron species: Fe
0 = 50.41%, Fe
2+-= 30.43%, and Fe
3 + = 19.14%.
2.3.6. Evaluation of Catalytic Tar Reforming and Cracking
Lignin is a complex aromatic biopolymer that interferes with the operational conditions of biomass thermochemical processes [
104,
105,
106] and promotes tar generation. The major compounds in tar are typically lignin-derived phenolic species, constituted of subproducts of incomplete depolymerization. The components p-hydroxyphenyl (H), guaiacyl (G), and syringyl (S) have been reported as the principal components of lignin [
107,
108,
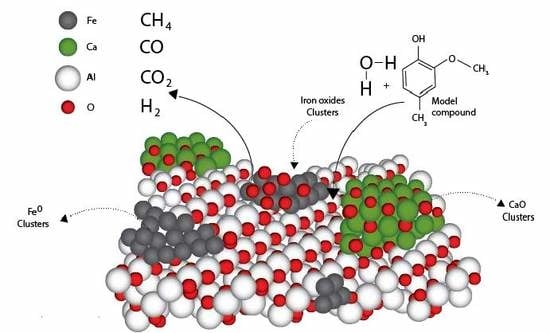
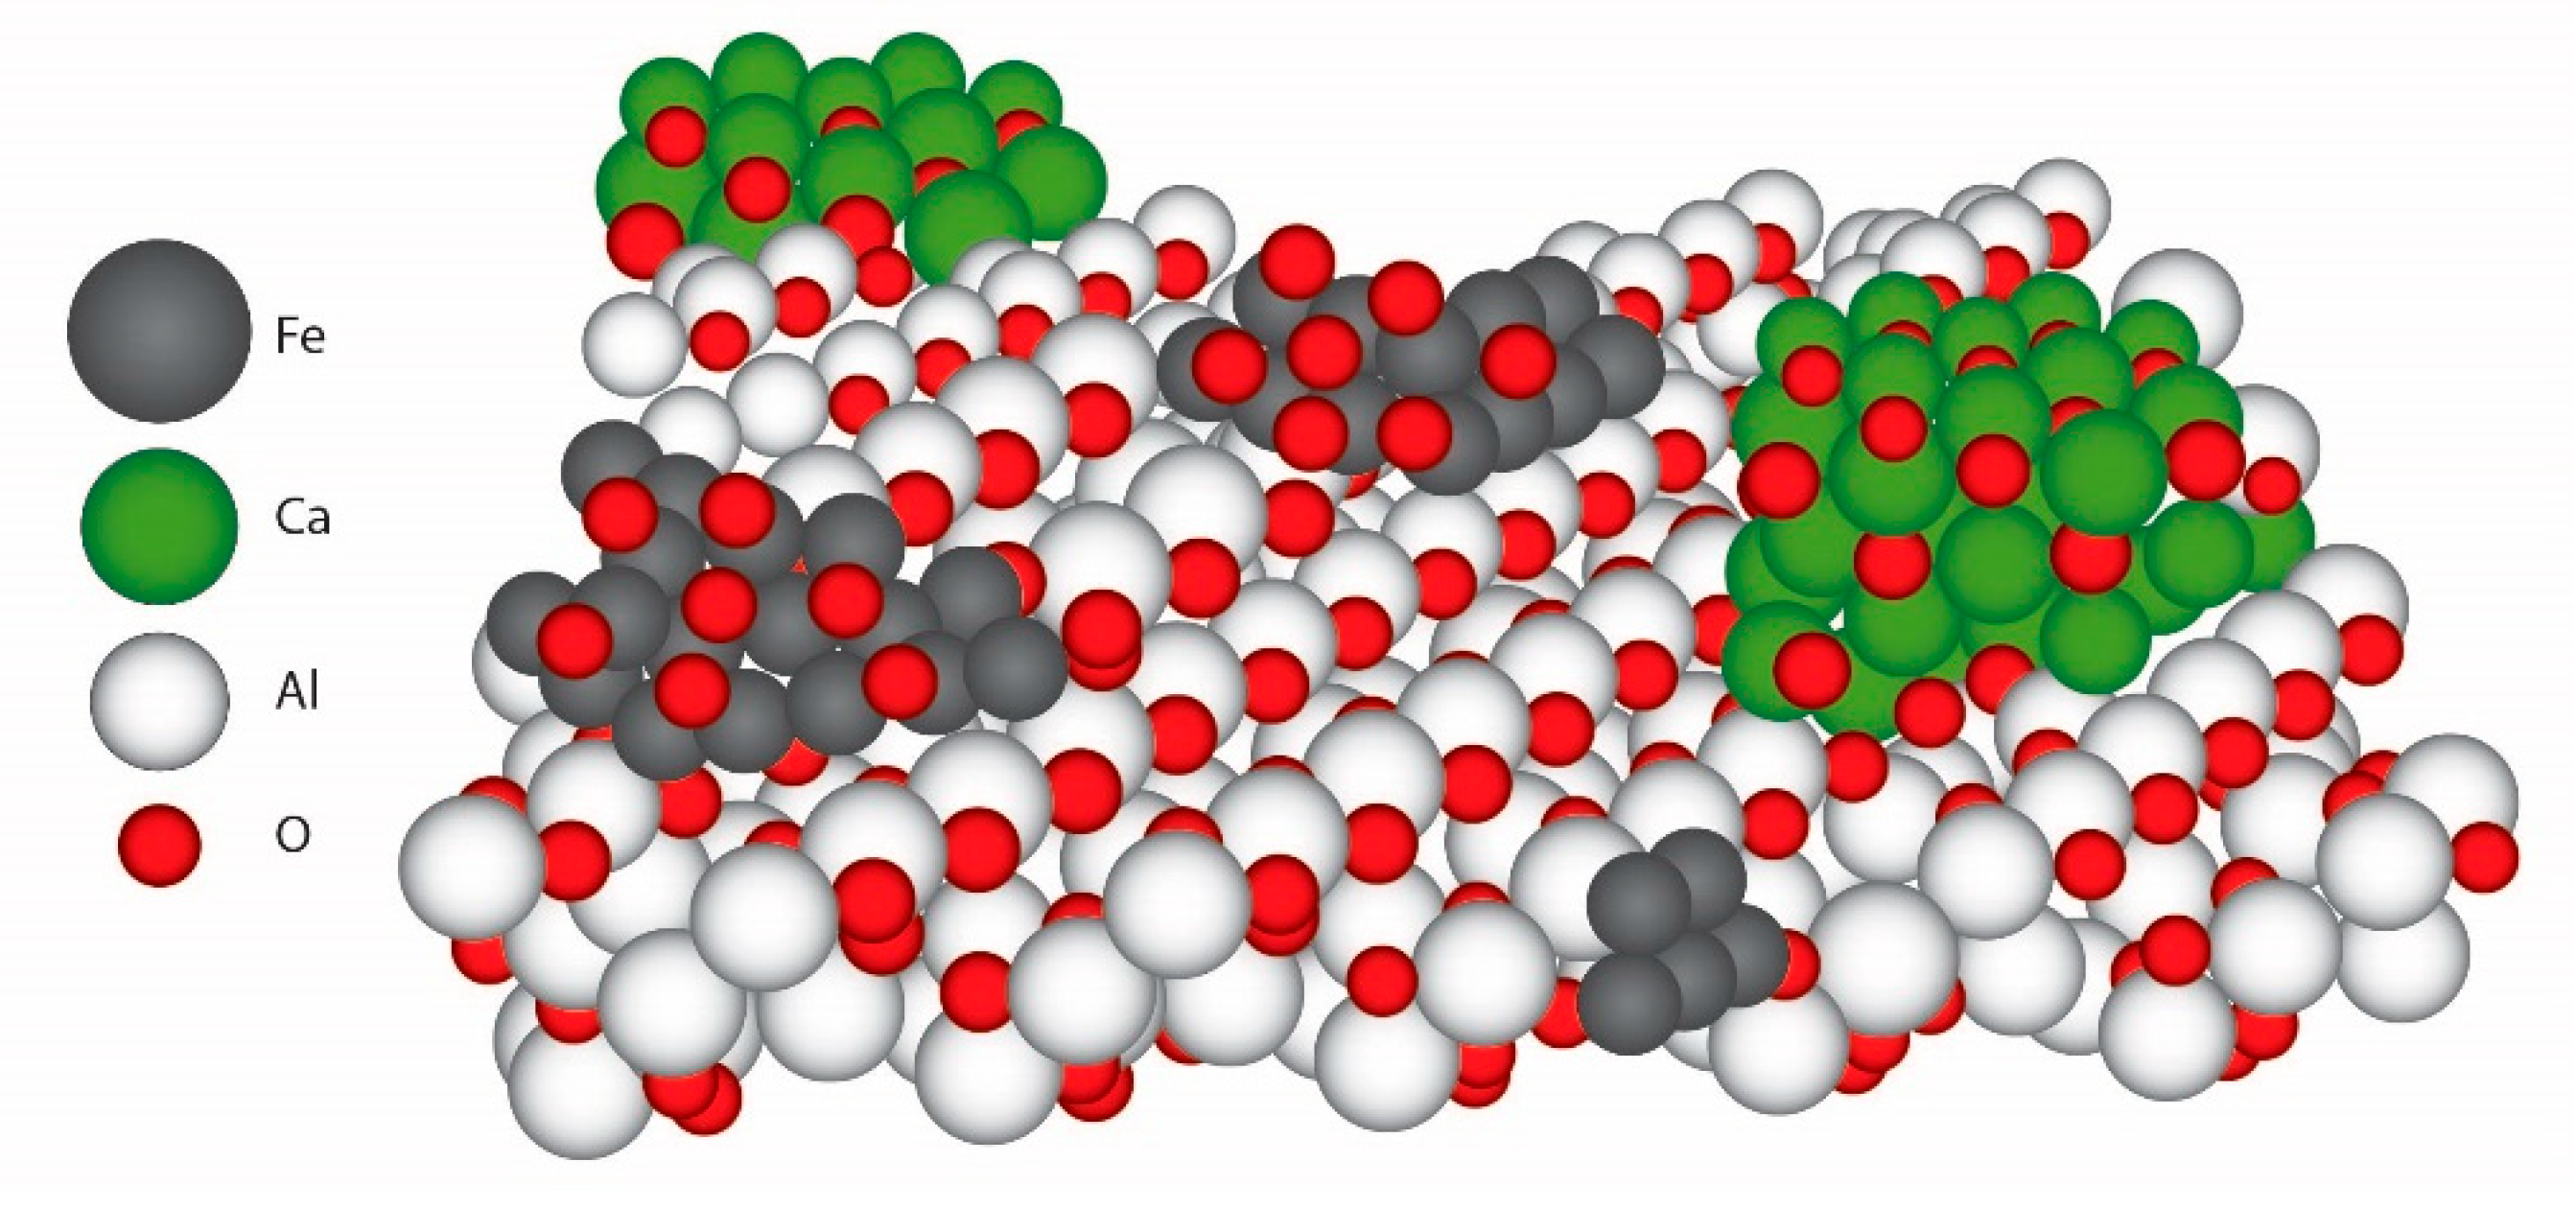
109]. The H, G, and S lignin units differ in the number of methoxyl substitutions. Therefore, 2-methoxy-4-methylphenol was used as a valid probe molecule or aromatic model compound to evaluate the catalyst performance for tar cracking, given that it contains typical chemical functionalities which are characteristic of tars: (a) aromatic rings, (b) -OH hydroxyl groups, (c) O-CH
3 methoxy groups, (d) -CH
3 methyl groups.
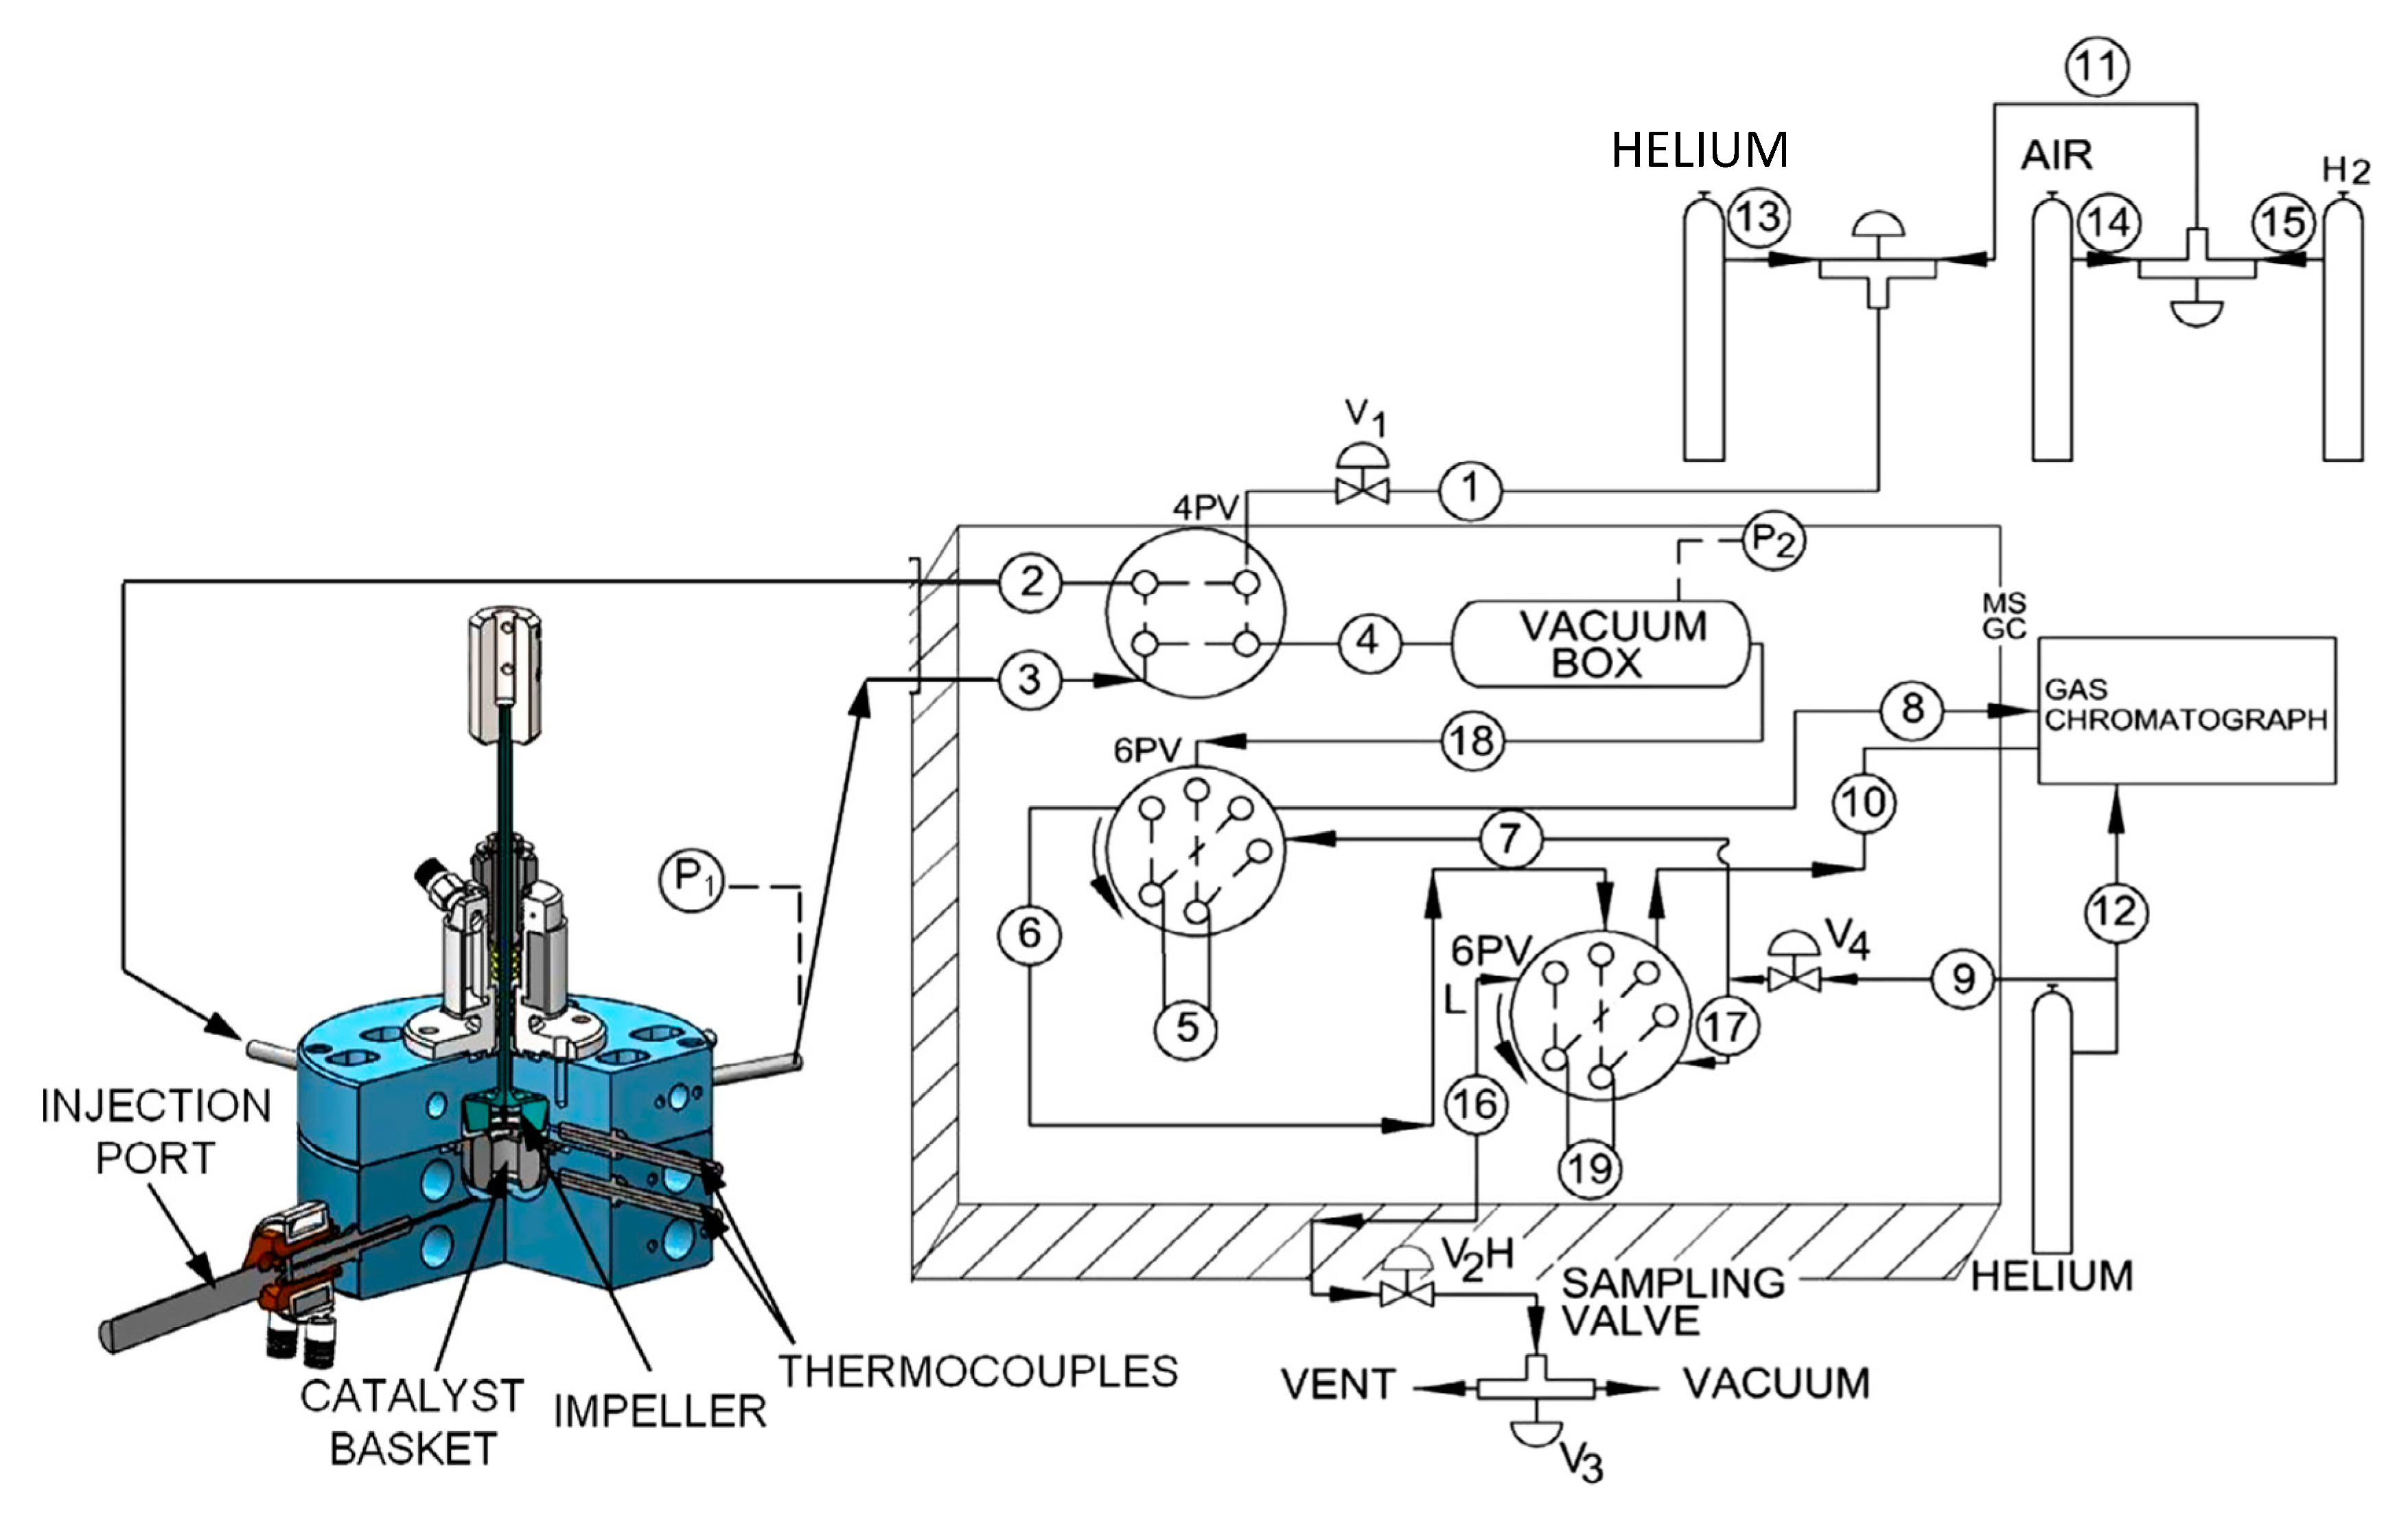
The performance of the developed catalyst was evaluated via several experimental runs developed in the CREC riser simulator. The conditions selected for the runs were the following: reaction time (3 s, 5 s, 7.5 s, and 10 s) and steam/biomass ratio (1.0 and 1.5). At least three repeats for every experiment were effected. After every run, the following were examined: product chemical gas composition, carbon conversion, and selectivity. It is expected that primary and some secondary tars can be formed at lower gasification temperatures. On this basis, 500 °C was selected and a 0.3 g catalyst load was chosen. In every experiment, the fluidization of the catalyst in the catalyst basket was ensured by setting the impeller speed as 5500 rpm.
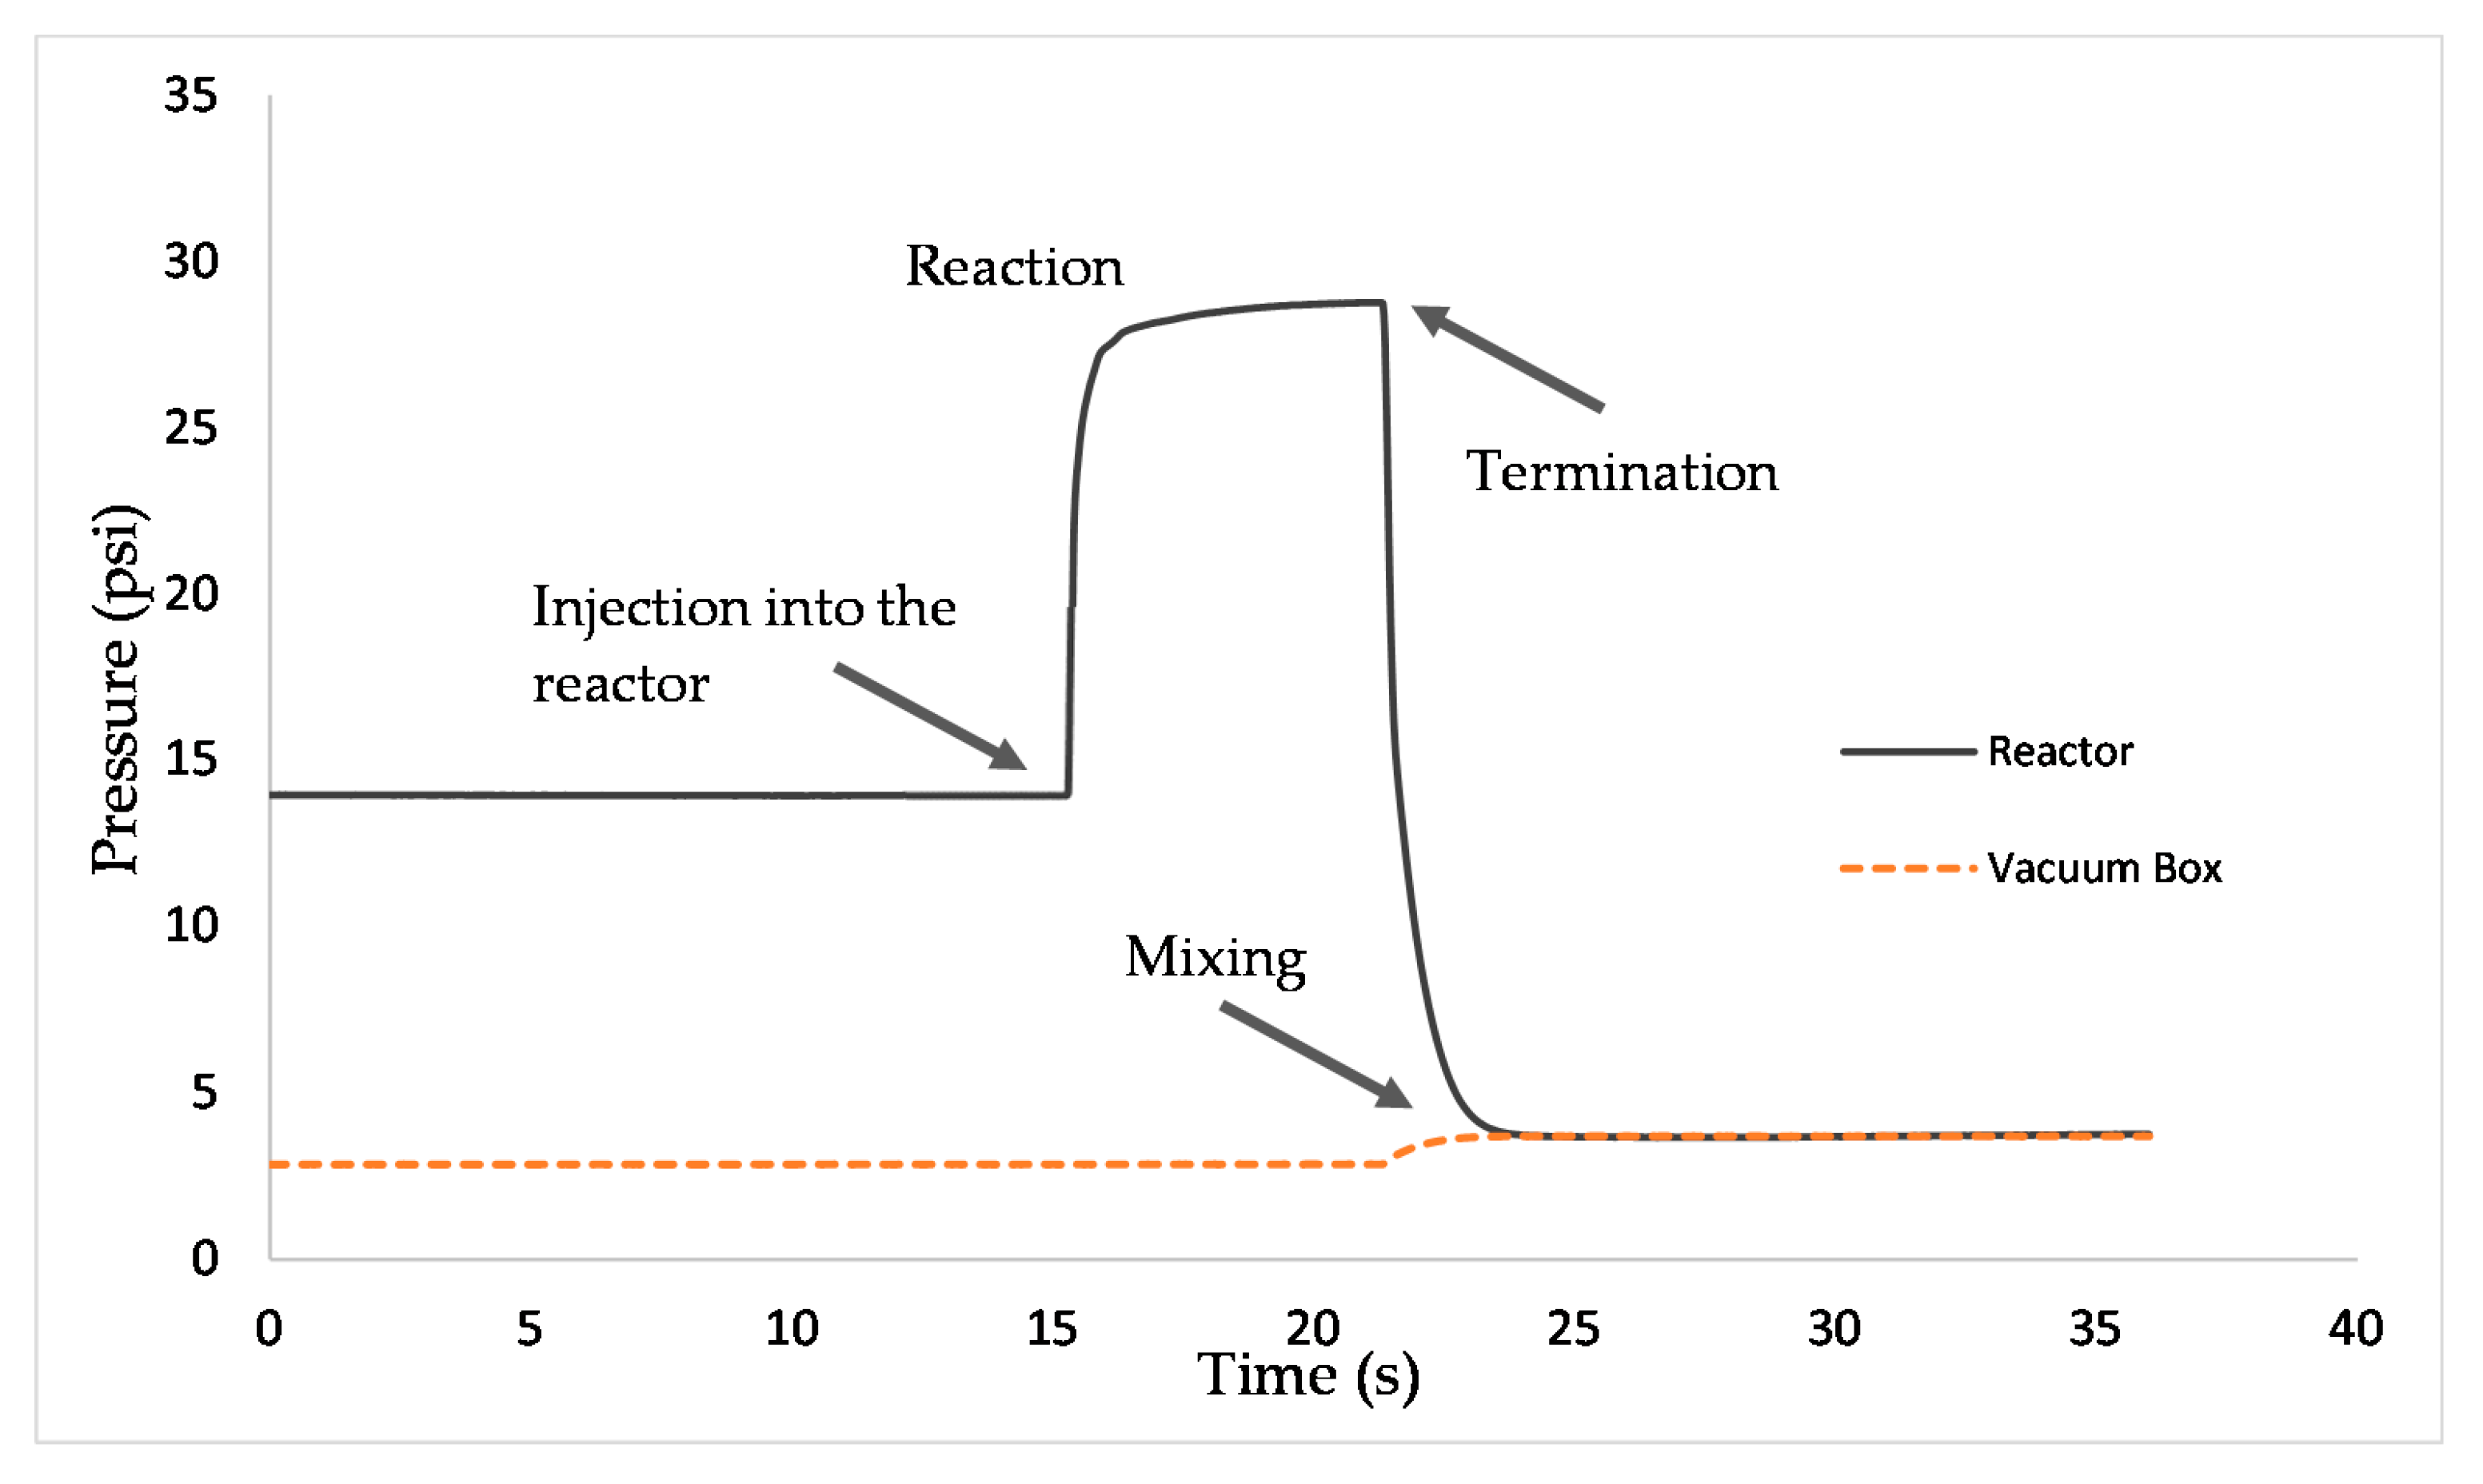
Figure 9 reports how total pressure changes with reaction time in a typical run in the CREC riser simulator. Total pressure readings and the determination of the composition of product species allowed us to perform mass balances and carbon balances closing in the 90%–107% range.
Conversion and Carbon Conversion Distribution
Tar gasification can be described as per Equation (7).
with C
8H
10O
2 representing the surrogate tar 2M4MP model compound; H
2, CO, CO
2 and methane standing for the syngas components;
accounting for the C2–C7 hydrocarbons resulting from both cracking and reforming;
representing coke precursors species resulting from aromatic radical recombination.
Thus, catalyst performance can be examined using the 2M4MP conversion and the light molecular weight species selectivity. This was done using a rigorous approach based on carbon-containing gaseous product species, as described in the Methods section. Standard deviations for experimental repeats were in the 3%–12% range, with an average of 93% 2M4MP conversion for the catalytic runs. An important observation from these runs was the mass balance closures, which included H2, CO, CO2, H2O, CH4, C2–C7 species, and unconverted 2M4MP. Carbon deposited was in the (0.83 ± 0.3)% range.
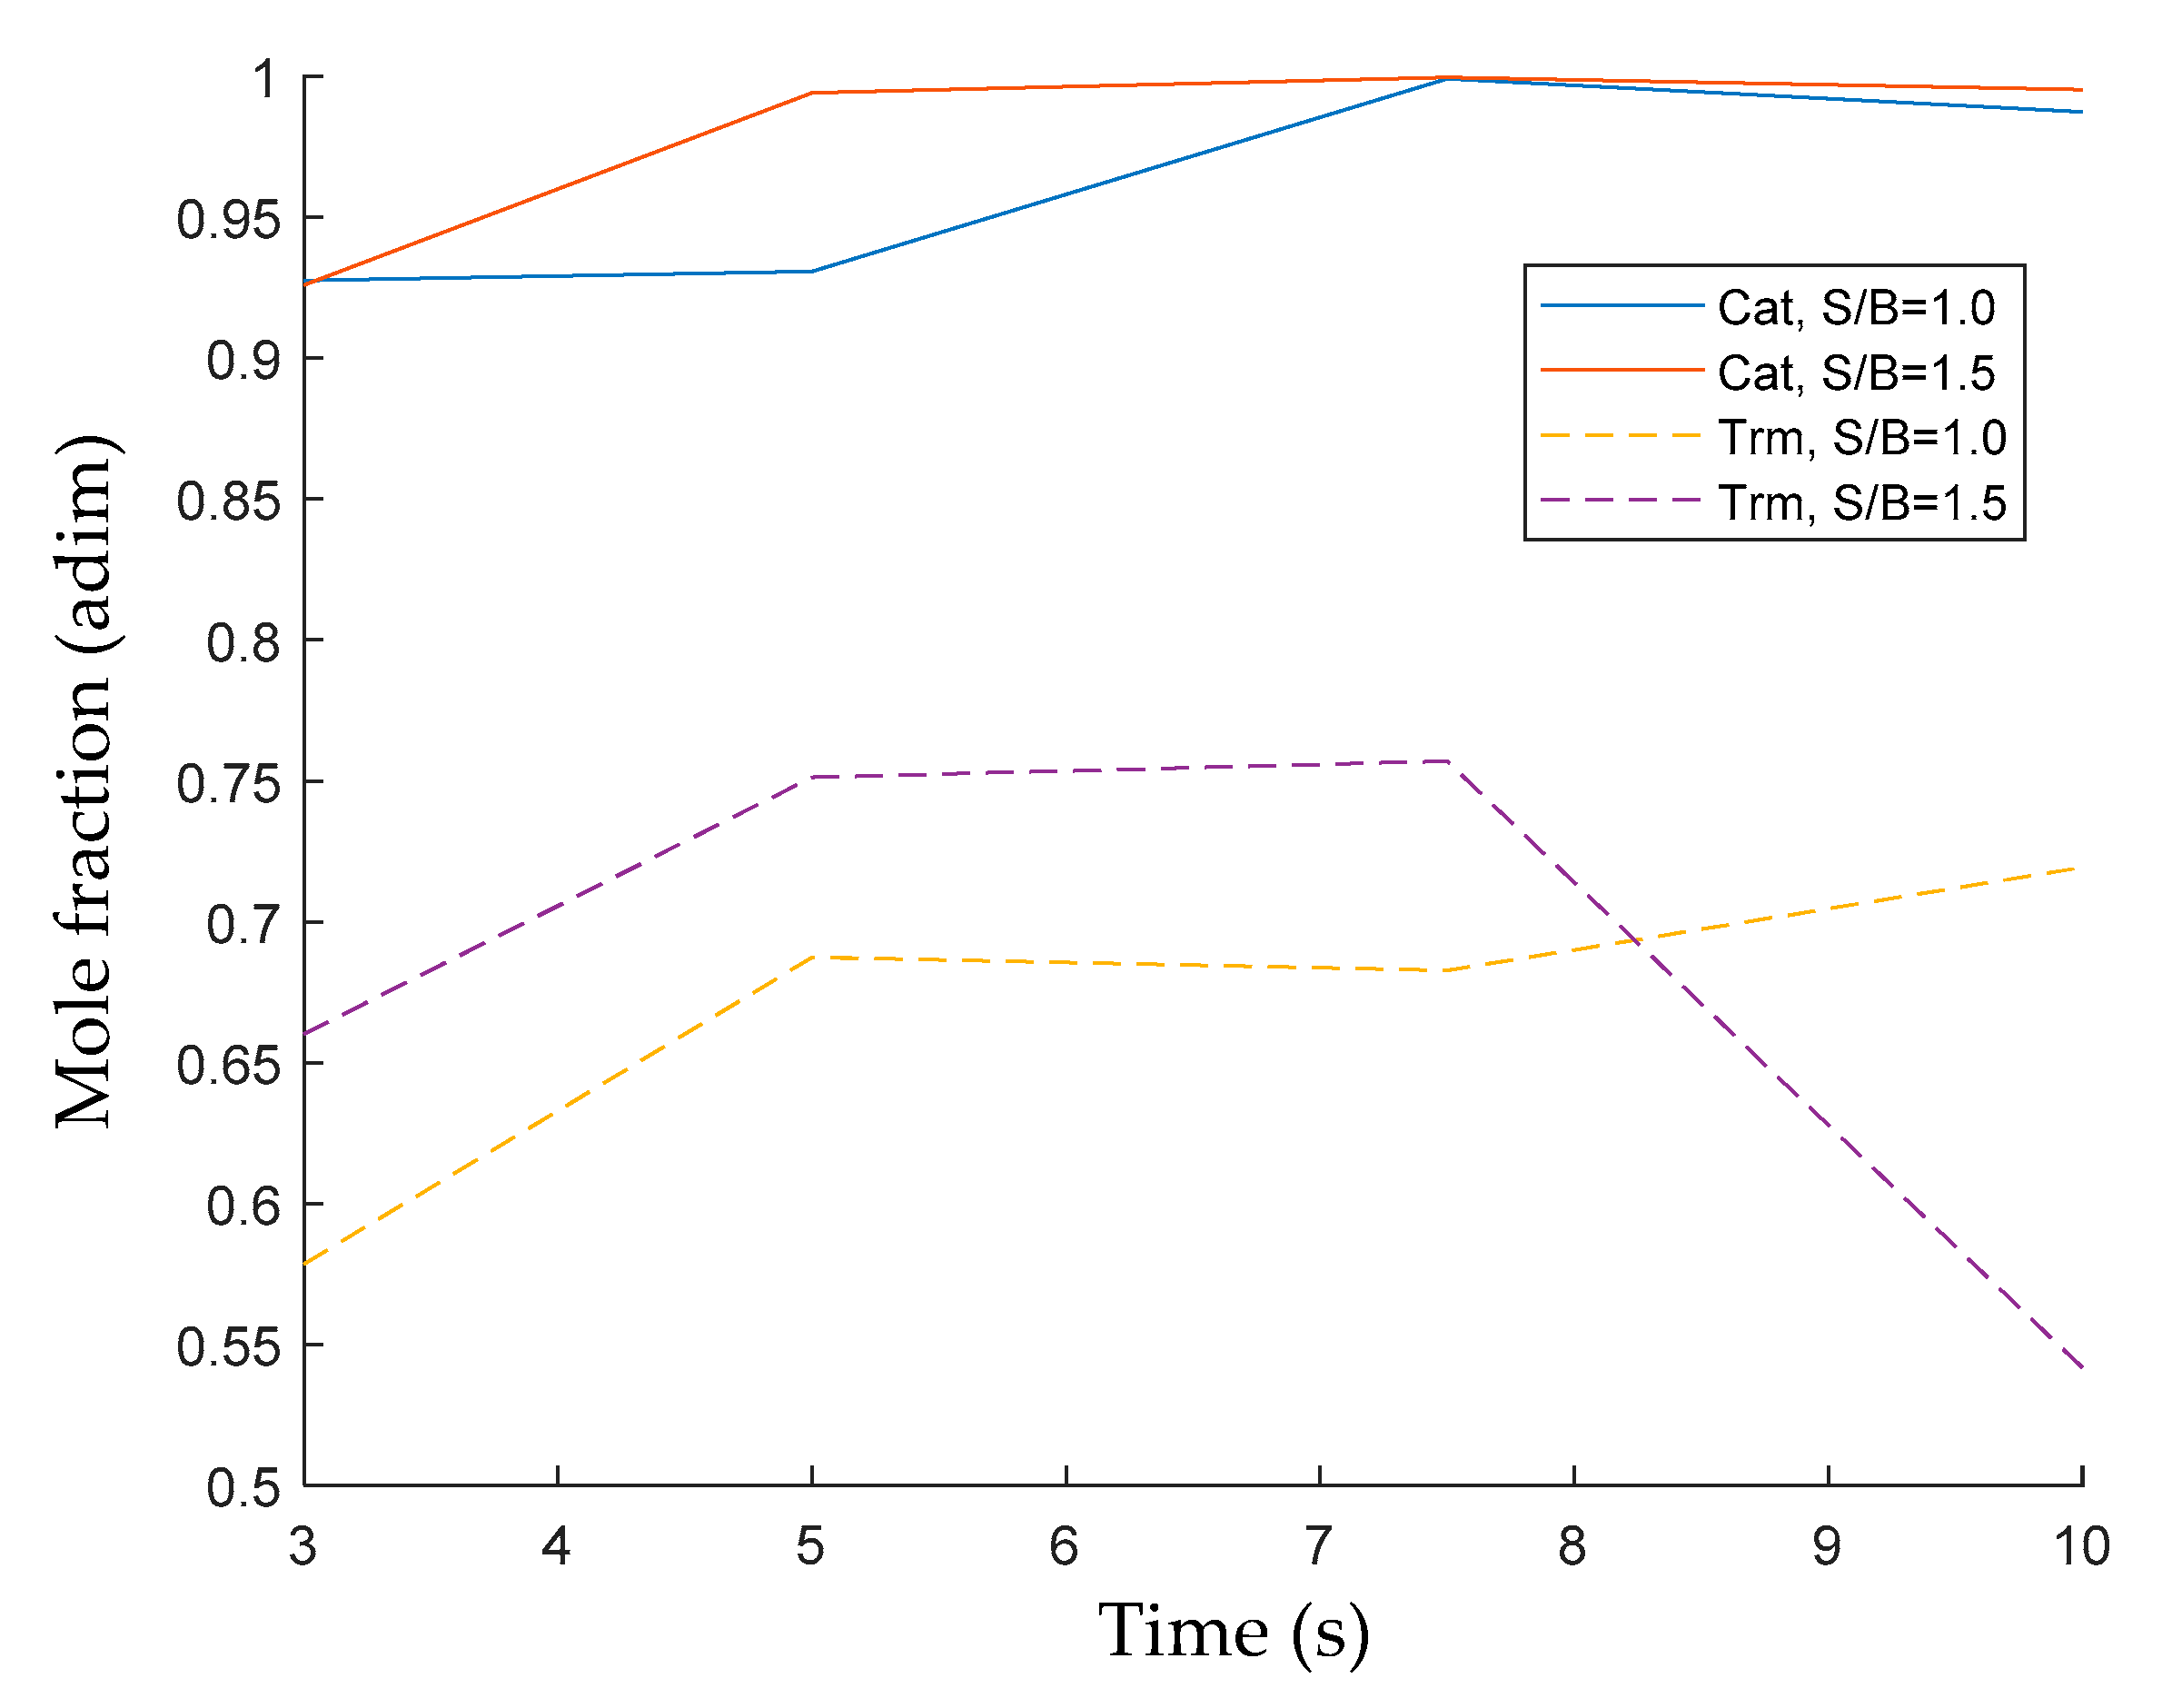
Figure 10 compares the 2M4MP conversions during thermal and catalytic experiments under fluidization conditions. It can be clearly seen that the 2M4MP conversions using the developed catalyst were significantly higher than those in thermal cracking experiments, with a difference of more than 30% in 2M4MP conversions, depending on the S/B ratio. It seems that the controlled acid sites in the Fe
xO
y/CaO-γ-Al
2O
3 catalyst contribute to better aromatic ring cracking. This is due to nucleophile interactions that take place with these chemical species, which can favor and stabilize the ring-opening mechanism in a steam environment [
110,
111].
Figure 10 reports the progressive 2M4MP thermal conversion increase with reaction time until it reaches 7.5 s. Following this, there is a moderately reduced conversion at 10 s. This 2M4MP thermal conversion decrease was assigned to the re-alkylation of the formed aromatic products. On the other hand, once the catalyst is loaded into the reactor, the thermal conversion increases consistently with reaction time, reaching 80% to almost 100% conversions, with a consistent trend of thermal conversion growing with the reaction time.
On the other hand,
Figure 11 reports the carbon-containing products obtained at 500 °C. In this figure, the significant influence of the catalytic cracking and reforming reactions producing C1–C2 light gaseous species is noticeable. This is quite apparent at a 7.5 s reaction time, when comparing the catalytic and thermal runs: one should also notice that methane from the catalytic runs at S/B = 1.0 and S/B = 1.5 increases by almost two and three times those observed in the thermal runs.
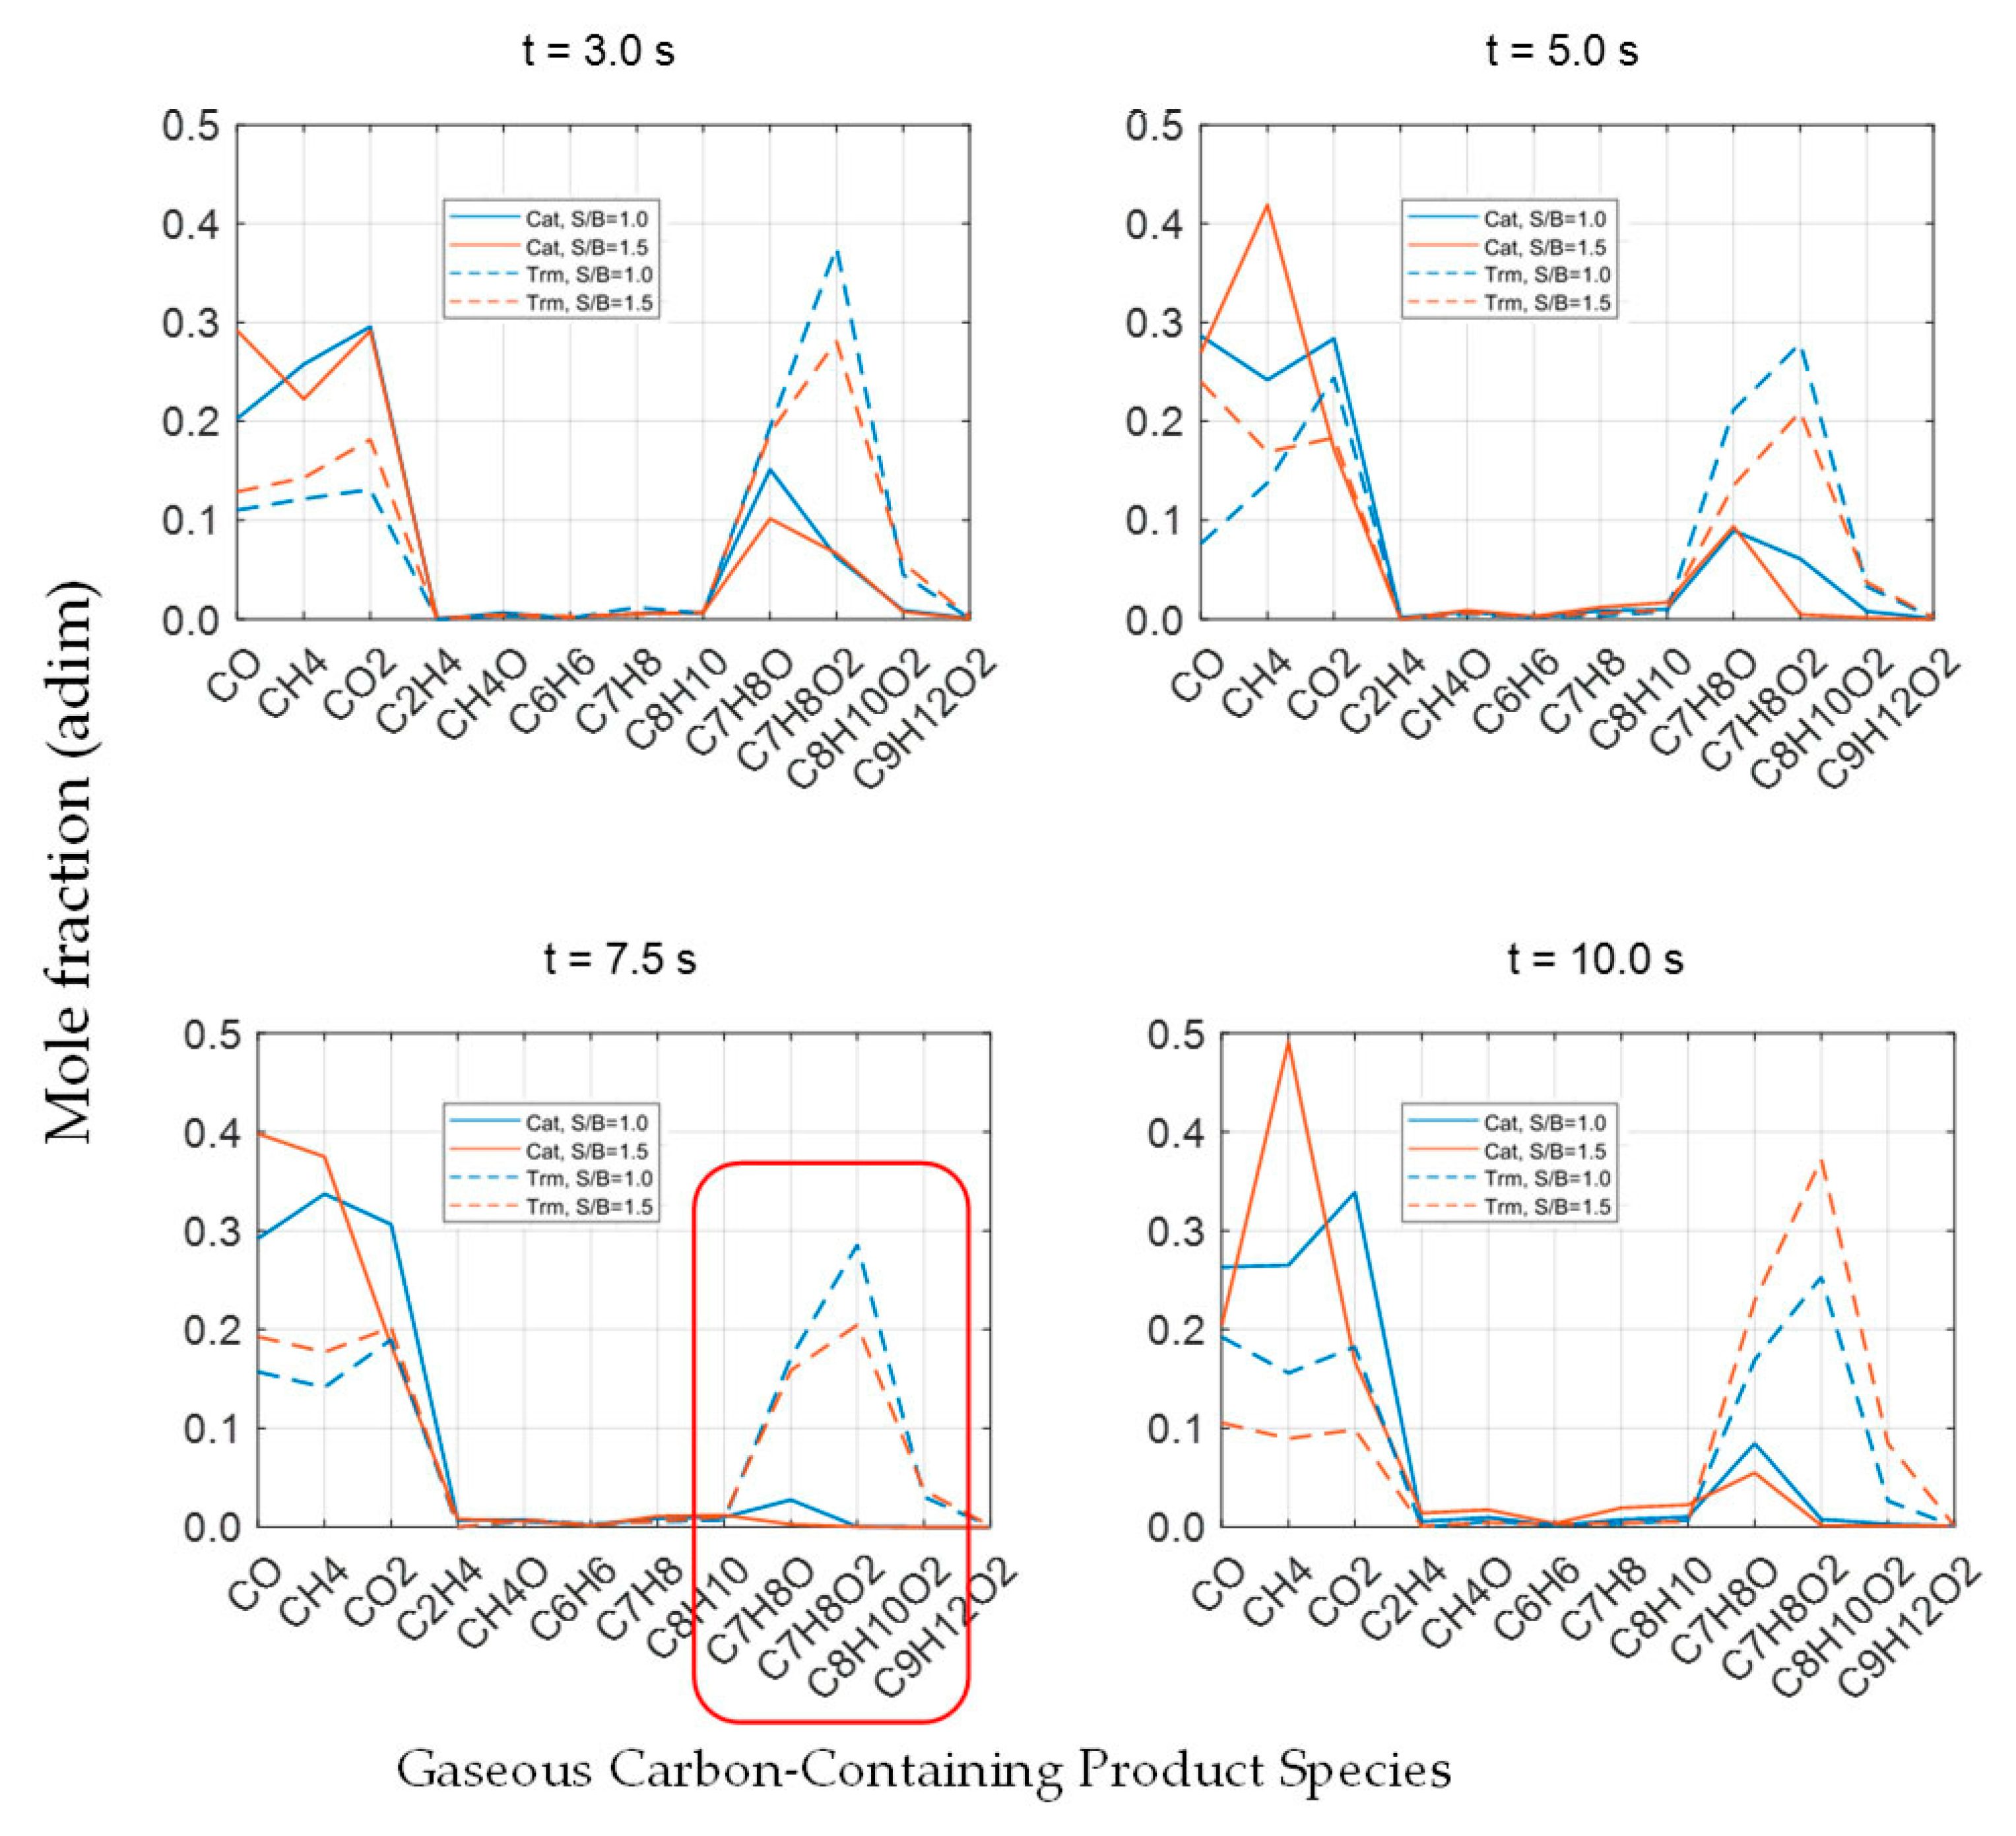
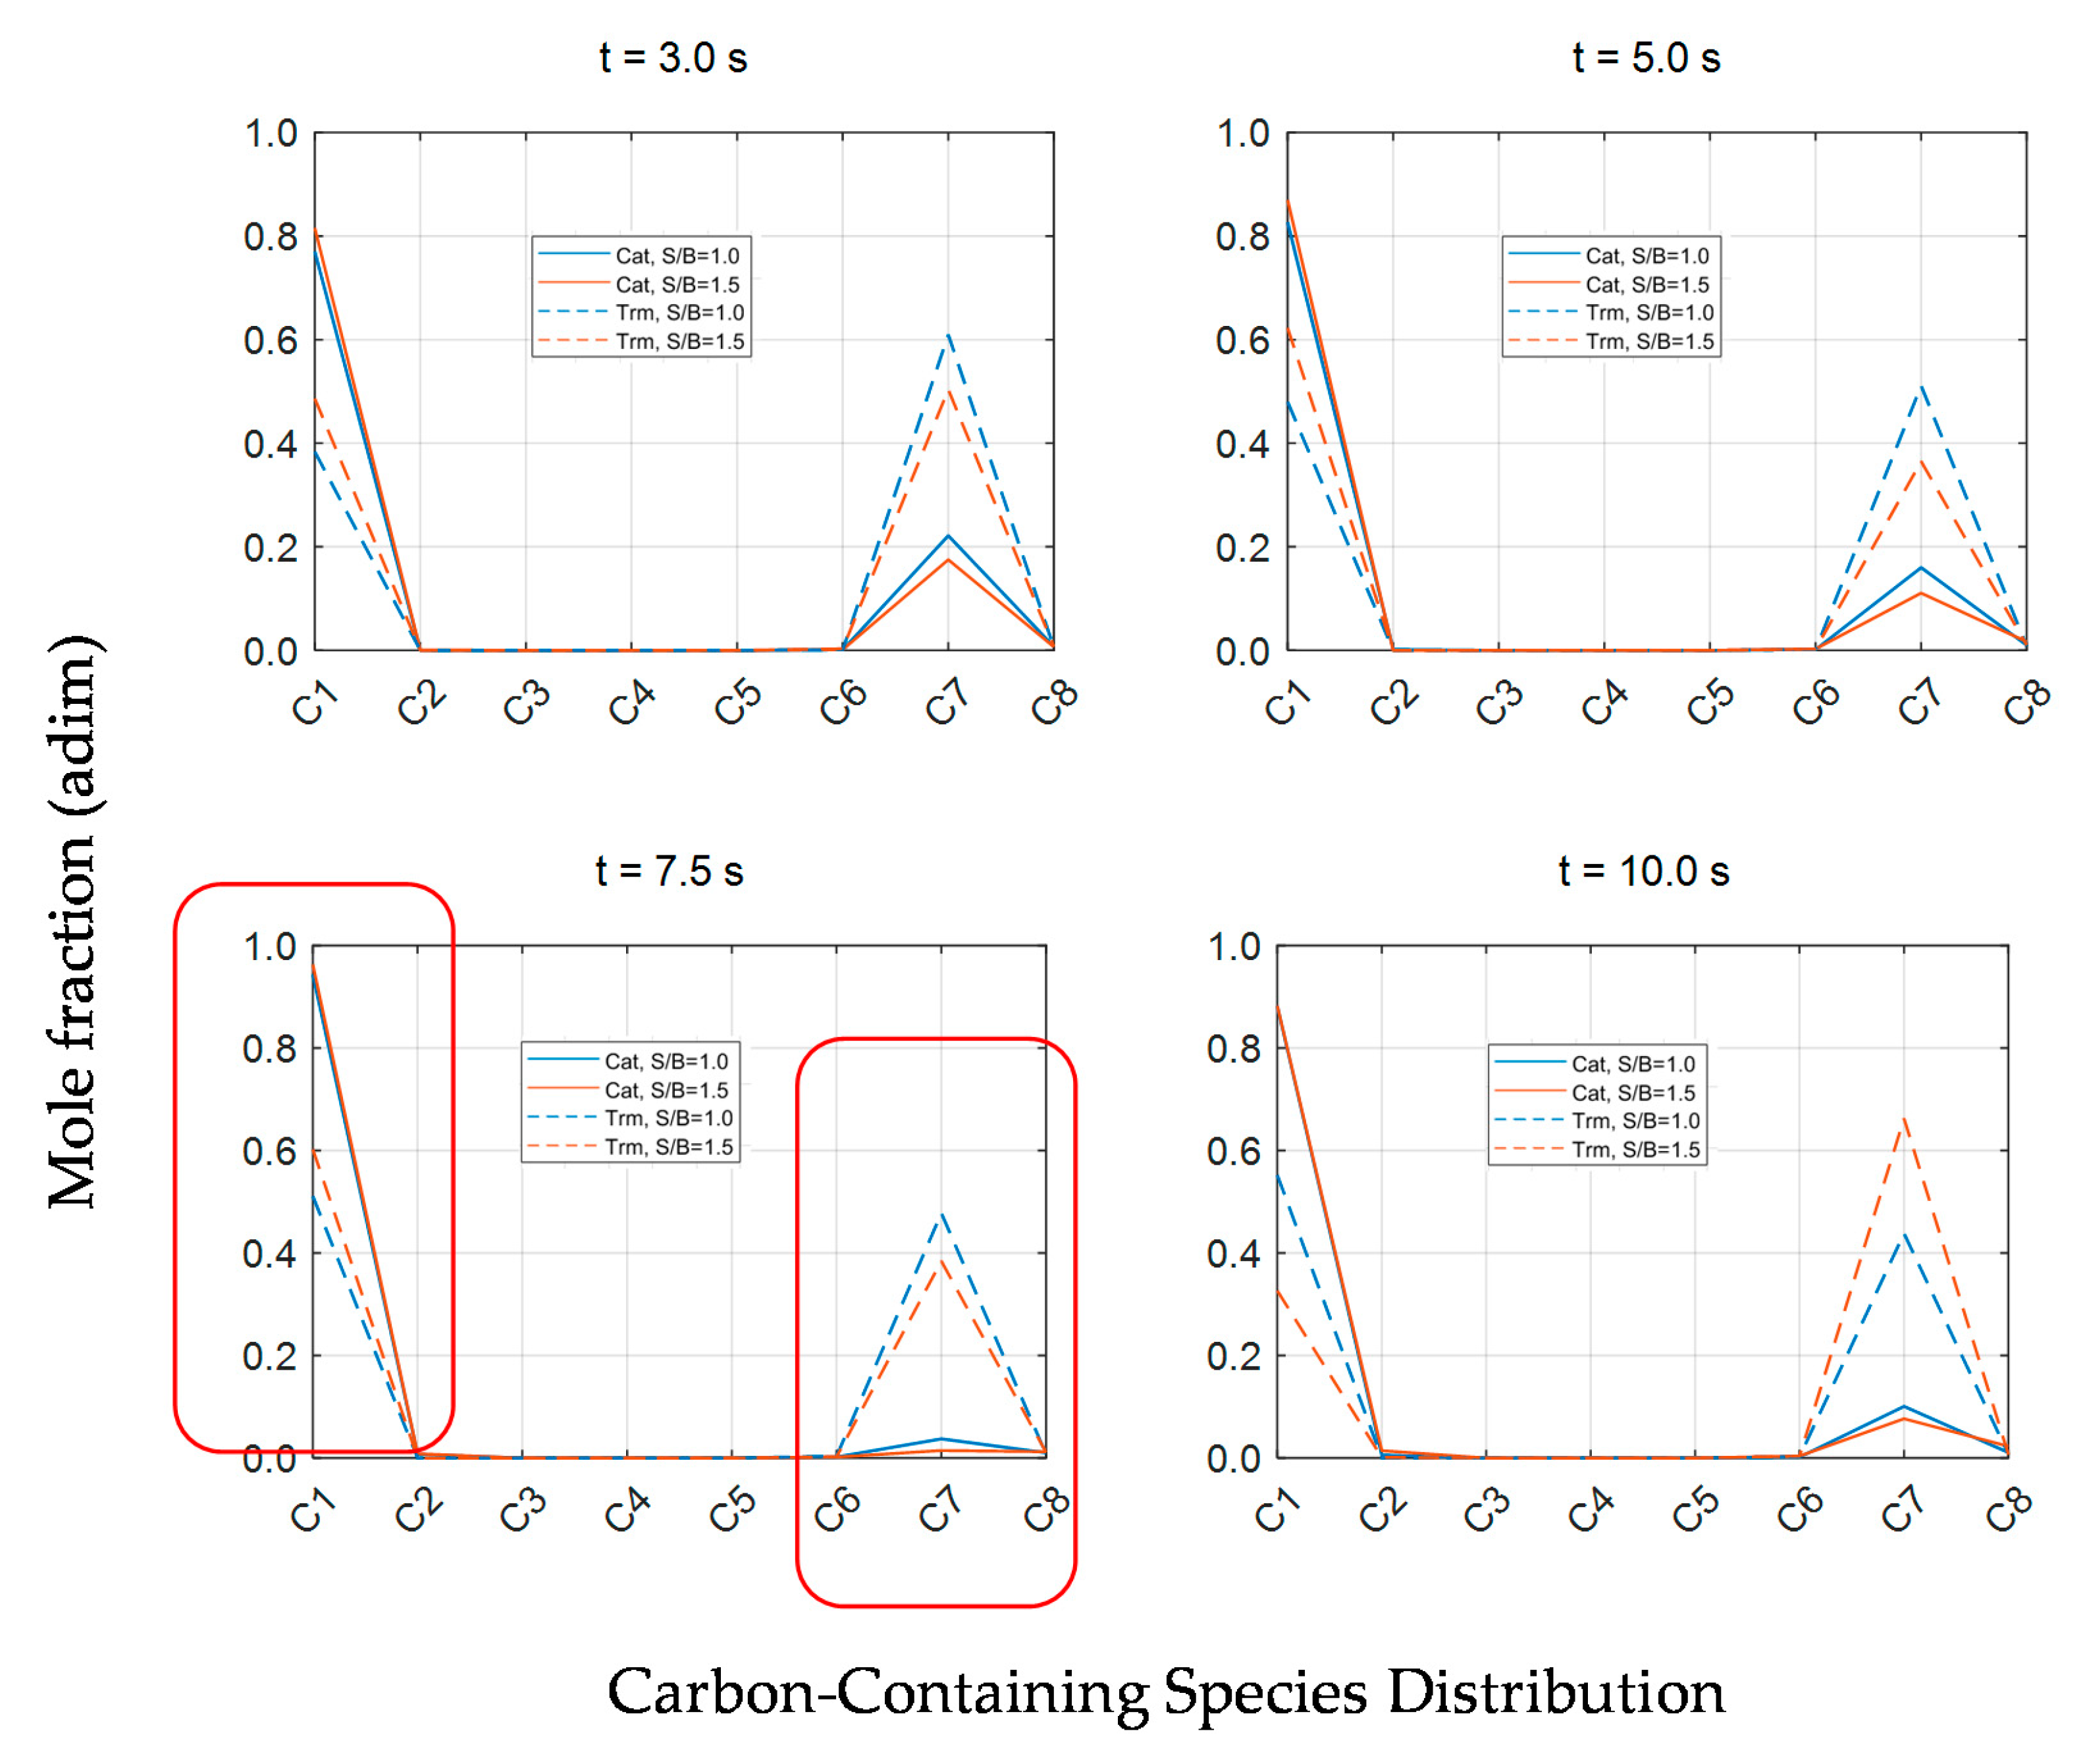
Furthermore, given the need for a better understanding of the various catalytic conversion processes for 2M4MP, the species molar fractions expressed as given carbon number fractions are shown in
Figure 12. One can notice that, contrary to the thermal process, the presence of a catalyst not only contributes to obtaining very high 2M4MP conversions but also yields formed products dominated by the C1–C2 carbon number fraction.
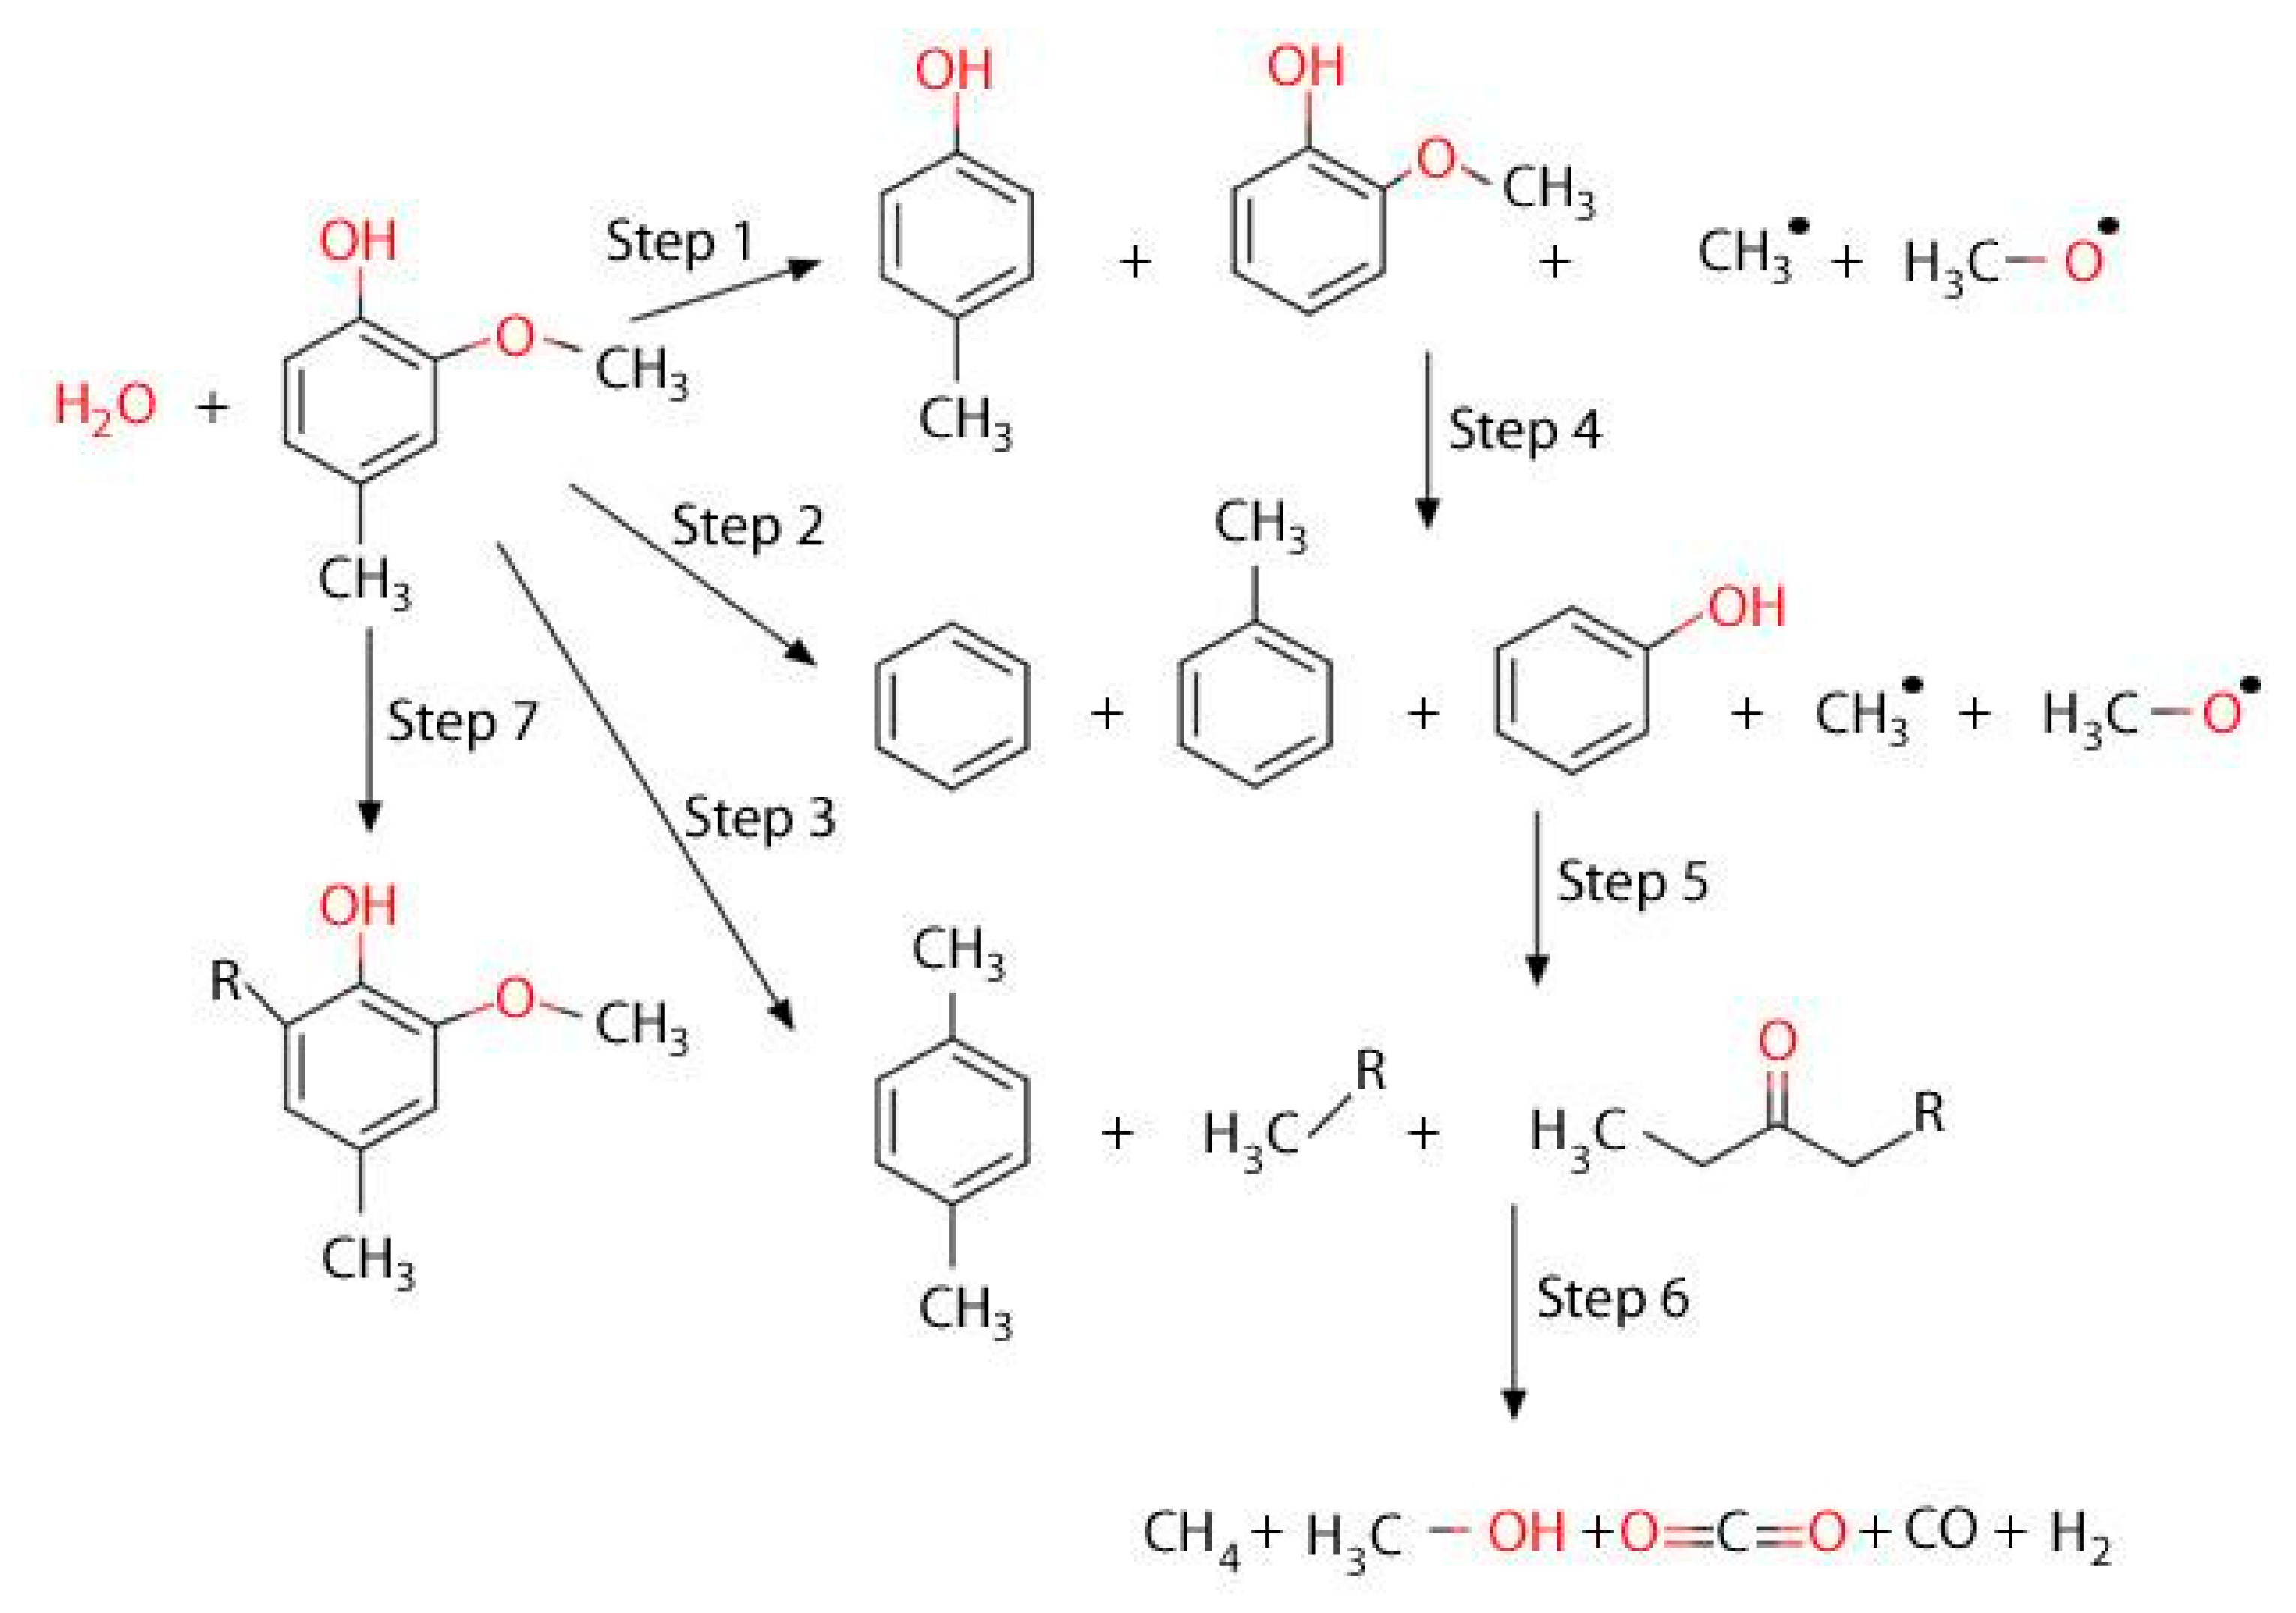
Based on the above reported results, and given the detected chemical species, one can identify simultaneous cracking/reforming reactions via a reaction network, as described in
Figure 13. Hence, taking as a reference the product distribution found in 3 s duration runs, the first 2M4MP conversion steps are identified as being dealkylation reactions acting in parallel: these are steps 1, 2 and 3 in
Figure 13. This leads to the formation of methyl and methoxy radicals. Following these first steps, benzene, toluene, cresol, and xylenes species are formed. These product species can additionally react with steam, further undergoing dealkylation steps, i.e., steps 4 and 5 in
Figure 13. This provides, as a result, additional methyl and methoxy radicals for secondary reactions. However, given the reforming capabilities of the Fe
xO
y/CaO/γ-Al
2O
3 catalyst of the present study, aromatic rings are open, with most of the product species being in the C1–C2 range: this is described in steps 6 and 7. One should note that the reaction mechanism postulated in
Figure 13 also accounts for the possible radical ring recombination leading to coke precursor formation.
Thus, one can notice that the FexOy/CaO-γ-Al2O3 catalyst of the present study, at the 5–7 s short contact time, envisioned in a downer or riser reactor, leads predominantly at 500 °C to the complete conversion of biomass-derived tar, with most of the formed products being in the C1–C2 range.


