Article

Enhanced Naproxen Elimination in Water by Catalytic Ozonation Based on NiO Films

by
Claudia M. Aguilar-Melo
1,2,
Julia L. Rodríguez
3,*,
Isaac Chairez
2,*,
Iván Salgado
4,
J. A. Andraca Adame
5,
J. A. Galaviz-Pérez
6,
Jorge Vazquez-Arenas
7 and
Tatyana Poznyak
3
1
Departamento de Ingeniería de Procesos e Hidráulica, Universidad Autónoma Metropolitana-Itzapalapa, Ciudad de México 09340, Mexico
2
Departamento de Bioprocesos, UPIBI—Instituto Politécnico Nacional, Ciudad de México 07340, Mexico
3
Laboratorio de Ing. Química Ambiental, ESIQIE—Instituto Politécnico Nacional, Ciudad de México 07340, Mexico
4
CIDETEC—Instituto Politécnico Nacional, Ciudad de México 07340, Mexico
5
Departamento Ciencias Básicas, UPIIH—Instituto Politécnico Nacional, Hidalgo 42050, Mexico
6
División Académica Multidisciplinaria de Jalpa de Méndez, Universidad Juárez Autónoma de Tabasco, Villahermosa 86049, Mexico
7
Catedra Conacyt—Departamento de Química, Universidad Autónoma Metropolitana—Iztapalapa, Av. San Rafael Atlixco No. 186, Ciudad de México 09340, Mexico
*
Authors to whom correspondence should be addressed.
Catalysts 2020, 10(8), 884; https://doi.org/10.3390/catal10080884
Submission received: 27 May 2020 / Revised: 21 July 2020 / Accepted: 28 July 2020 / Published: 5 August 2020
(This article belongs to the Special Issue Photocatalytic Oxidation/Ozonation Processes)

Abstract

:
This study evaluates naproxen (NP) degradation efficiency by ozonation using nickel oxide films ( N i O ( F ) ) as a catalyst. The NiO films were synthesized by chemical vapor deposition and characterized by X-ray diffraction, scanning electron microscopy, atomic force microscopy and X-ray photoelectron spectroscopy. NP degradation was conducted for 5 min using 10 films of N i O ( F ) comparing against ozonation using 100 mg/L N i O powder in suspension ( N i O ( S ) ) and conventional ozonation ( O 3 -conv). Total organic carbon analysis demonstrated a mineralization degree of 12% with O 3 -conv, 35% with N i O as powder and 22% with N i O ( F ) after 60 min of reaction. The films of N i O ( F ) were sequentially used 4 times in ozonation demonstrating the stability of the synthesized material, as well as its properties as a catalyst for ozonation. A proposed modeling strategy using robust parametric identification techniques allows the comparison of NP decomposition pseudo-monomolecular reaction rates.

1. Introduction

The growing interest in catalytic ozonation is a consequence of their remarkable advantages with respect to conventional ozonation whose benefits are (a) enhancing the recalcitrant pollutants removal in water, (b) reducing reaction period, and (c) increasing the mineralization degree [1,2]. The presence of suspended metallic oxides particles in a catalyst breaks down the ozone molecule leading to radical generation ( · O H mainly). These radicals are more reactive than molecular ozone due to their higher oxidation potential [3]. Today, different catalysts have been used in the ozonation for decomposing a wide variety of pollutants in water, including suspended metal oxides [4], supported metal oxides [5,6], activated carbon [7], zeolites and clay minerals [8] are the most extended ones due to their fast and efficient radicals generations.
Nickel oxide has shown outstanding results degrading herbicides [9], pharmaceutical compounds [10] and polycyclic aromatic hydrocarbons [11] in combination with ozone.
Most research on heterogeneous catalytic ozonation used suspended particles of metallic oxides as catalysts. This strategy favored the contact frequency between contaminants either with the catalysts surfaces or the oxidants produced [12]. Nevertheless, recuperation, separation and eventual reuse of suspended solid catalysts are more complicated and require additional unitary operations [13].
Catalyst immobilization seems to be an appropriate alternative to avoid some of the known inconveniences of using suspended particles of solid catalysts. There are several options to carry out the catalyst immobilization, to produce different supporting structures (thin films, membranes, covered spheres, etc.). Some conventional methods for thin film synthesis on specific substrates are liquid phase deposition, chemical vapor deposition (CVD), hydrothermal treatment, electrophoretic deposition, among others [14,15]. Each of these methods produces films with diversified characteristics like morphology, surface roughness and reproducibility in the synthesized materials.
The CVD technique produces highly reproducible thin films with coating uniformity and control as well as precise thickness. This method induces chemical reactions (thermal decomposition, reduction, hydrolysis, oxidation, etc.) between precursor and substrate which yields the generation of a solid film over the preheated substrate [16].
Supported catalysts application in some advanced catalytic oxidation processes (photocatalysis, mainly) enhances the decomposition efficiency of complex, toxic and recalcitrant organics contaminants [17,18]. However, the use of catalysts fixed onto a surface (thin film coating) has been scarcely studied, according to our knowledge, in ozonation of toxic and recalcitrant pollutants including diverse pharmaceutical compounds [19].
The presence of pharmaceutical compounds in the environment has been associated with serious problems in lakes and rivers such as mutations, infertility and sexual disorders in the aquatic fauna [20,21]. The increasing concentrations of pharmaceutical compounds in aquatic ecosystems is a consequence of the inappropriate disposal of effluents coming from hospitals, farms, pharmaceutical industries, urine of human beings and animals [22]. Among the regular pharmaceutical pollutants, naproxen (NP) has been detected in different water bodies, since it is a common analgesic, which does not require a medical prescription (Figure 1). NP is highly effective in the treatment of rheumatoid arthritis because of its anti-inflammatory and antipyretic properties [23]. This compound is hardly biodegraded by either aerobic or anaerobic microorganisms [24]. Several treatment methods have been applied to eliminate NP in wastewater, including photocatalysis [25,26], biodegradation, UV photolysis [27,28], sonocatalytic [29,30] and Fenton reaction [31]. These processes have demonstrated low decomposition effectiveness and poor mineralization, as well as other operating drawbacks.
One additional problem associated with heterogeneous catalytic ozonation reactions is the lack of accurate models describing the complete process. The understanding of the process conditions and the expected products can contribute to the operation control and quality of the contaminant degradation results [32]. Classical modeling techniques of ozonation include the least square method to obtain an accurate curve that fits the experimental data better. However, high variability presented in such a complex chemical system (including serial and parallel reactions) can lead to inaccurate models, which may limit their applicability for real treatments. To overcome these problems, a robust differentiation technique was implemented.
Catalytic ozonation with NiO in suspension represents an effective alternative to eliminate NP from water [33], but the recovering and eventual reuse of suspended catalysts needs to be resolved. Therefore, it is feasible to propose catalytic ozonation based on NiO thin films aimed to decompose NP in aqueous solutions. Here, N i O films ( N i O ( F ) ) were supported on glass substrates by the CVD method. A comparison was established between conventional and catalytic ozonation using NiO in powder and films.

2. Results and Discussion

2.1. N i O ( F ) Characterization

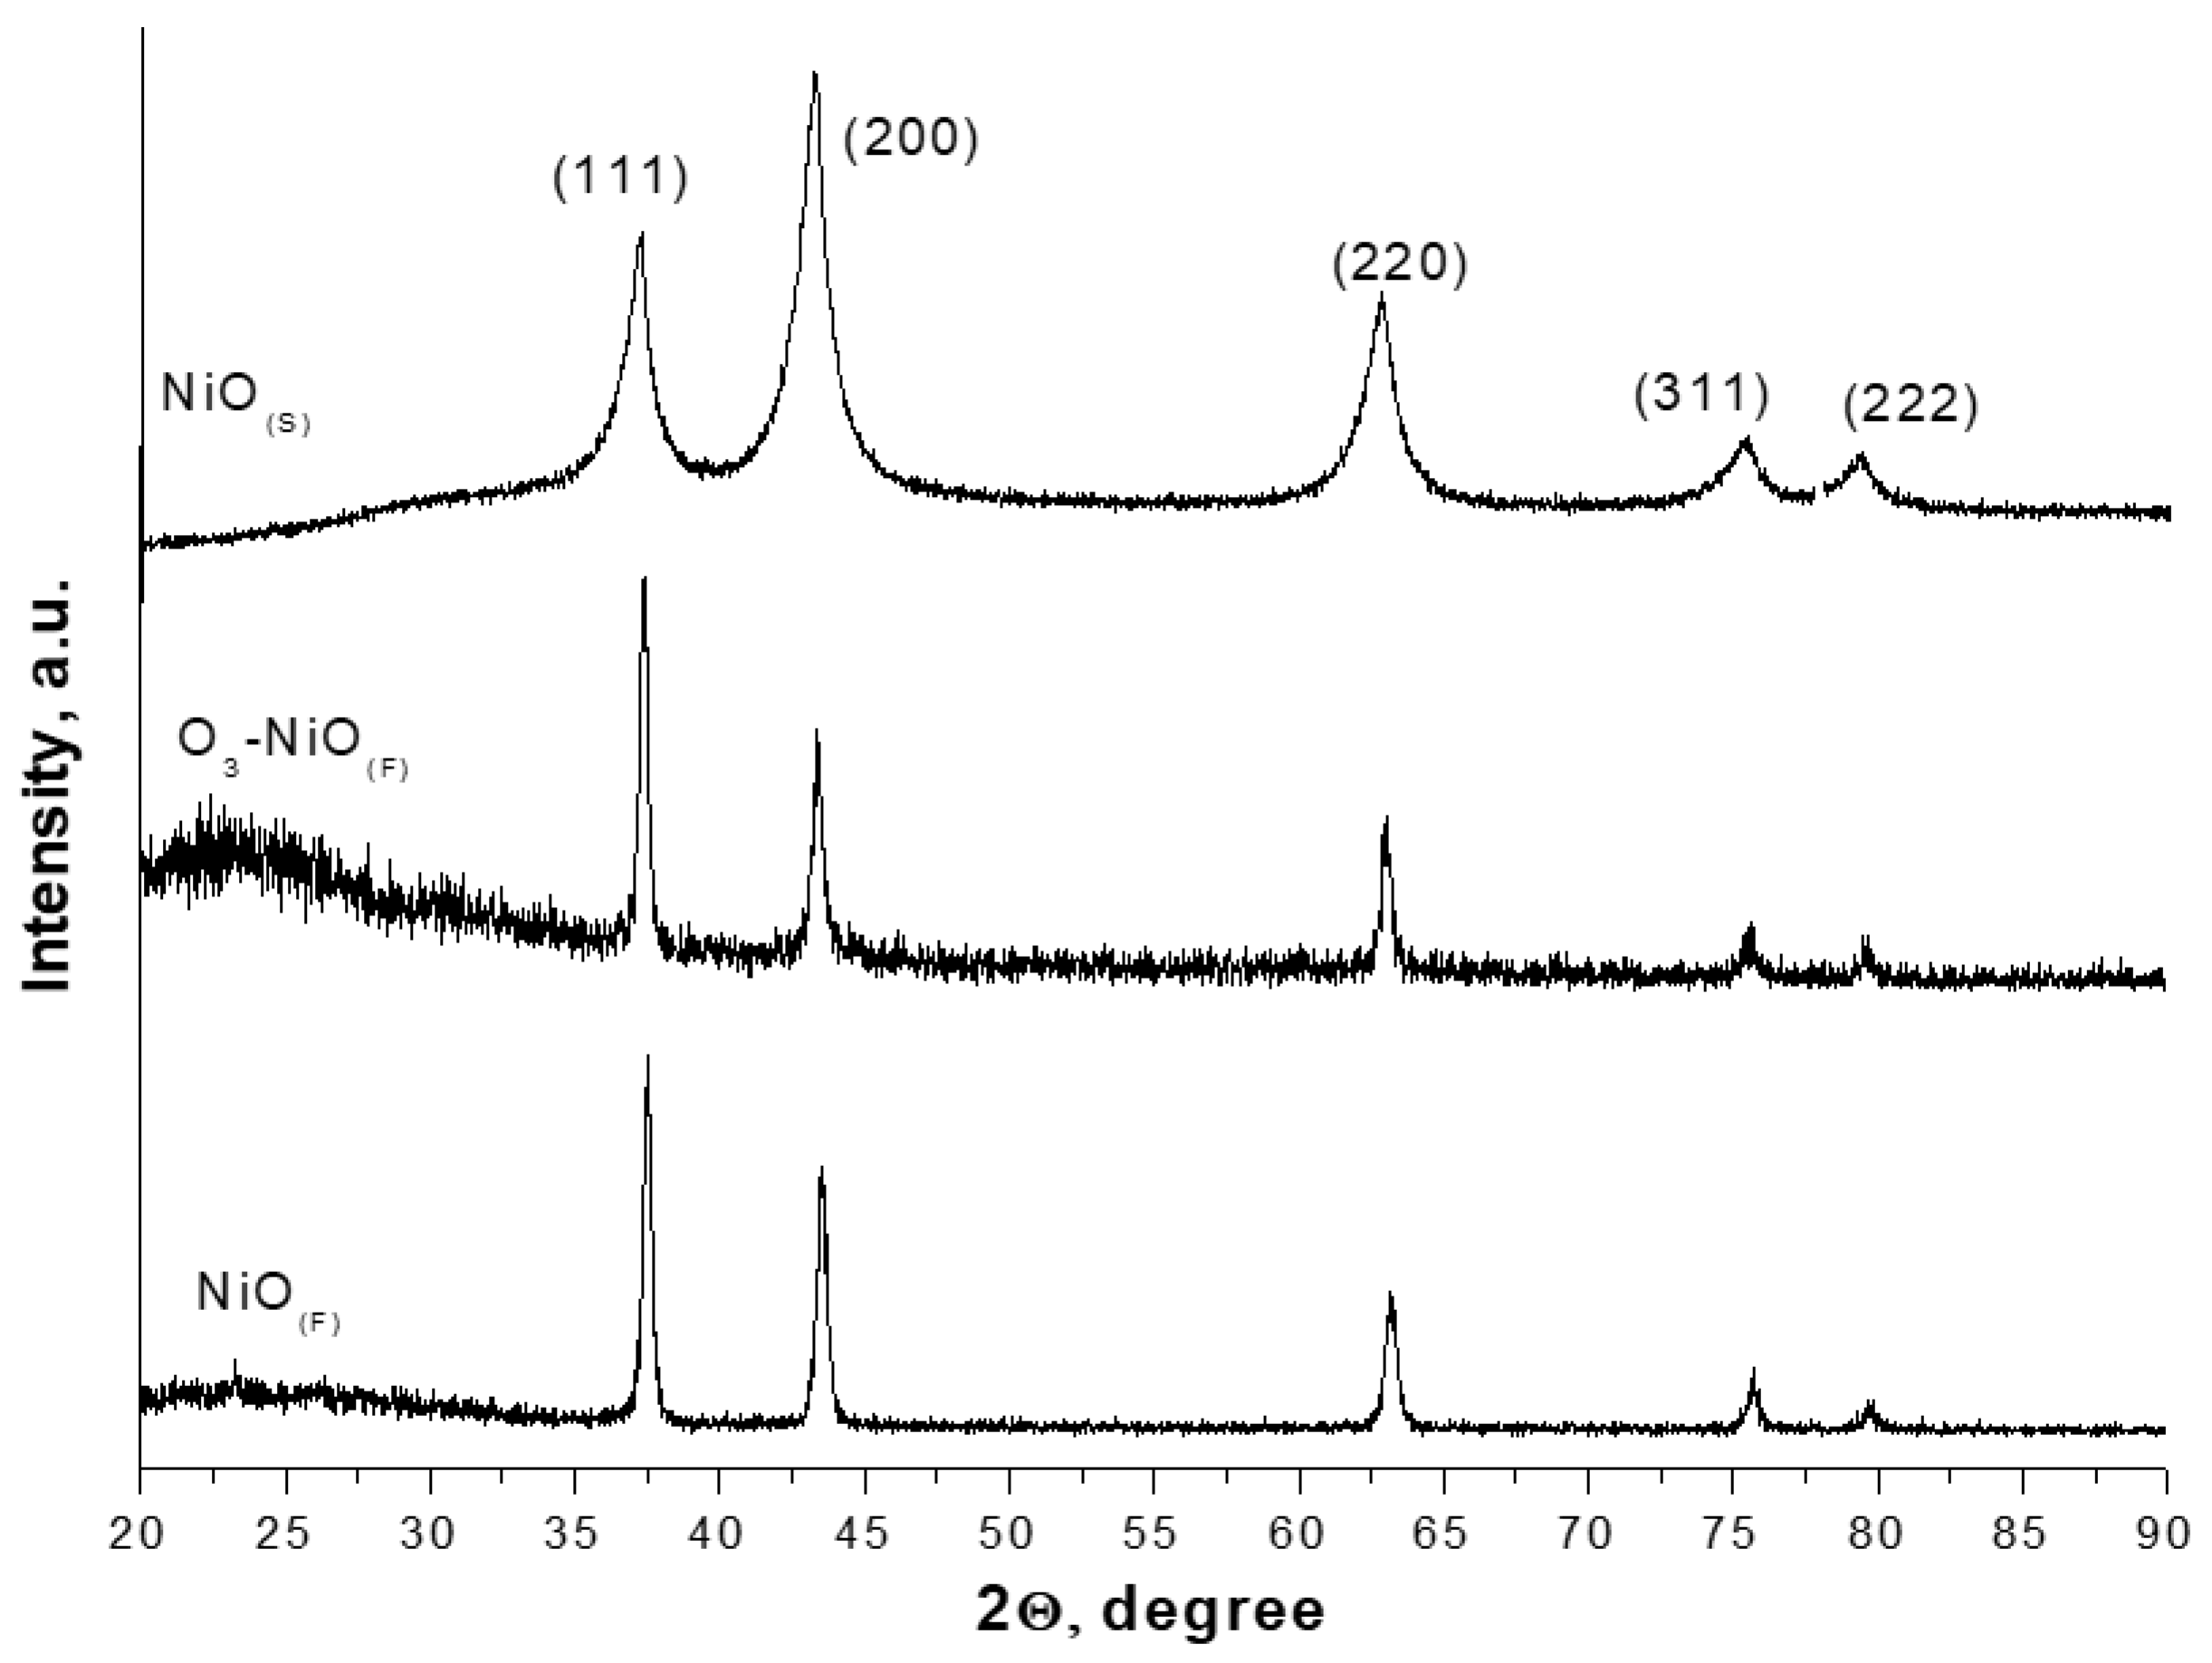
The CVD technique used to deposit NiO allows the obtaining of a film with a uniform gray color. The structural analysis was complemented with the X-ray diffraction (XRD) study. Figure 2 shows the XRD pattern of N i O ( F ) . The analyzed spectrum presents five characteristic peaks at 2 θ = 37.52 , 43.58, 63.14, 75.7 and 79.84°. These signals agree with the commercial N i O ( S ) , corresponding to the (111), (200), (220), (311) and (222) planes, respectively. These signals are indexed to the cubic phase of N i O (Joint Committee on Powder Diffraction Standards No. 78-0423, 73-1519) [34]. The presence of only well-defined five peaks indicates the high purity of the N i O ( F ) . According to the XRD pattern, the  N i O ( F ) obtained by CVD has preferential orientation in 111 direction and the orientation does not change after ozonation. Furthermore, the films present compressive stress due to the slight slippage of the peaks. If we consider (111) planes, N i O ( S ) presents the peak at position 37.20, while O 3 - N i O ( F ) at 37.36 and N i O ( F ) at 37.52. The results indicate that N i O ( F ) has 0.86% compressive stress and O 3 - N i O ( F ) after the ozonation, there is a 0.43% relaxation compared to N i O ( S ) powders. Additionally, the X-ray diffraction analysis in the software Match3 enables determination of a density of 6.79 g/cm3 for N i O ( F ) . The crystallinity stability was demonstrated in the N i O ( F ) XRD pattern after oxidation with ozone (O3- N i O ( F ) ). The well-defined five peaks detected in the sample without ozonation were observed after the treatment. This pattern confirmed the stability of the film after ozonation.
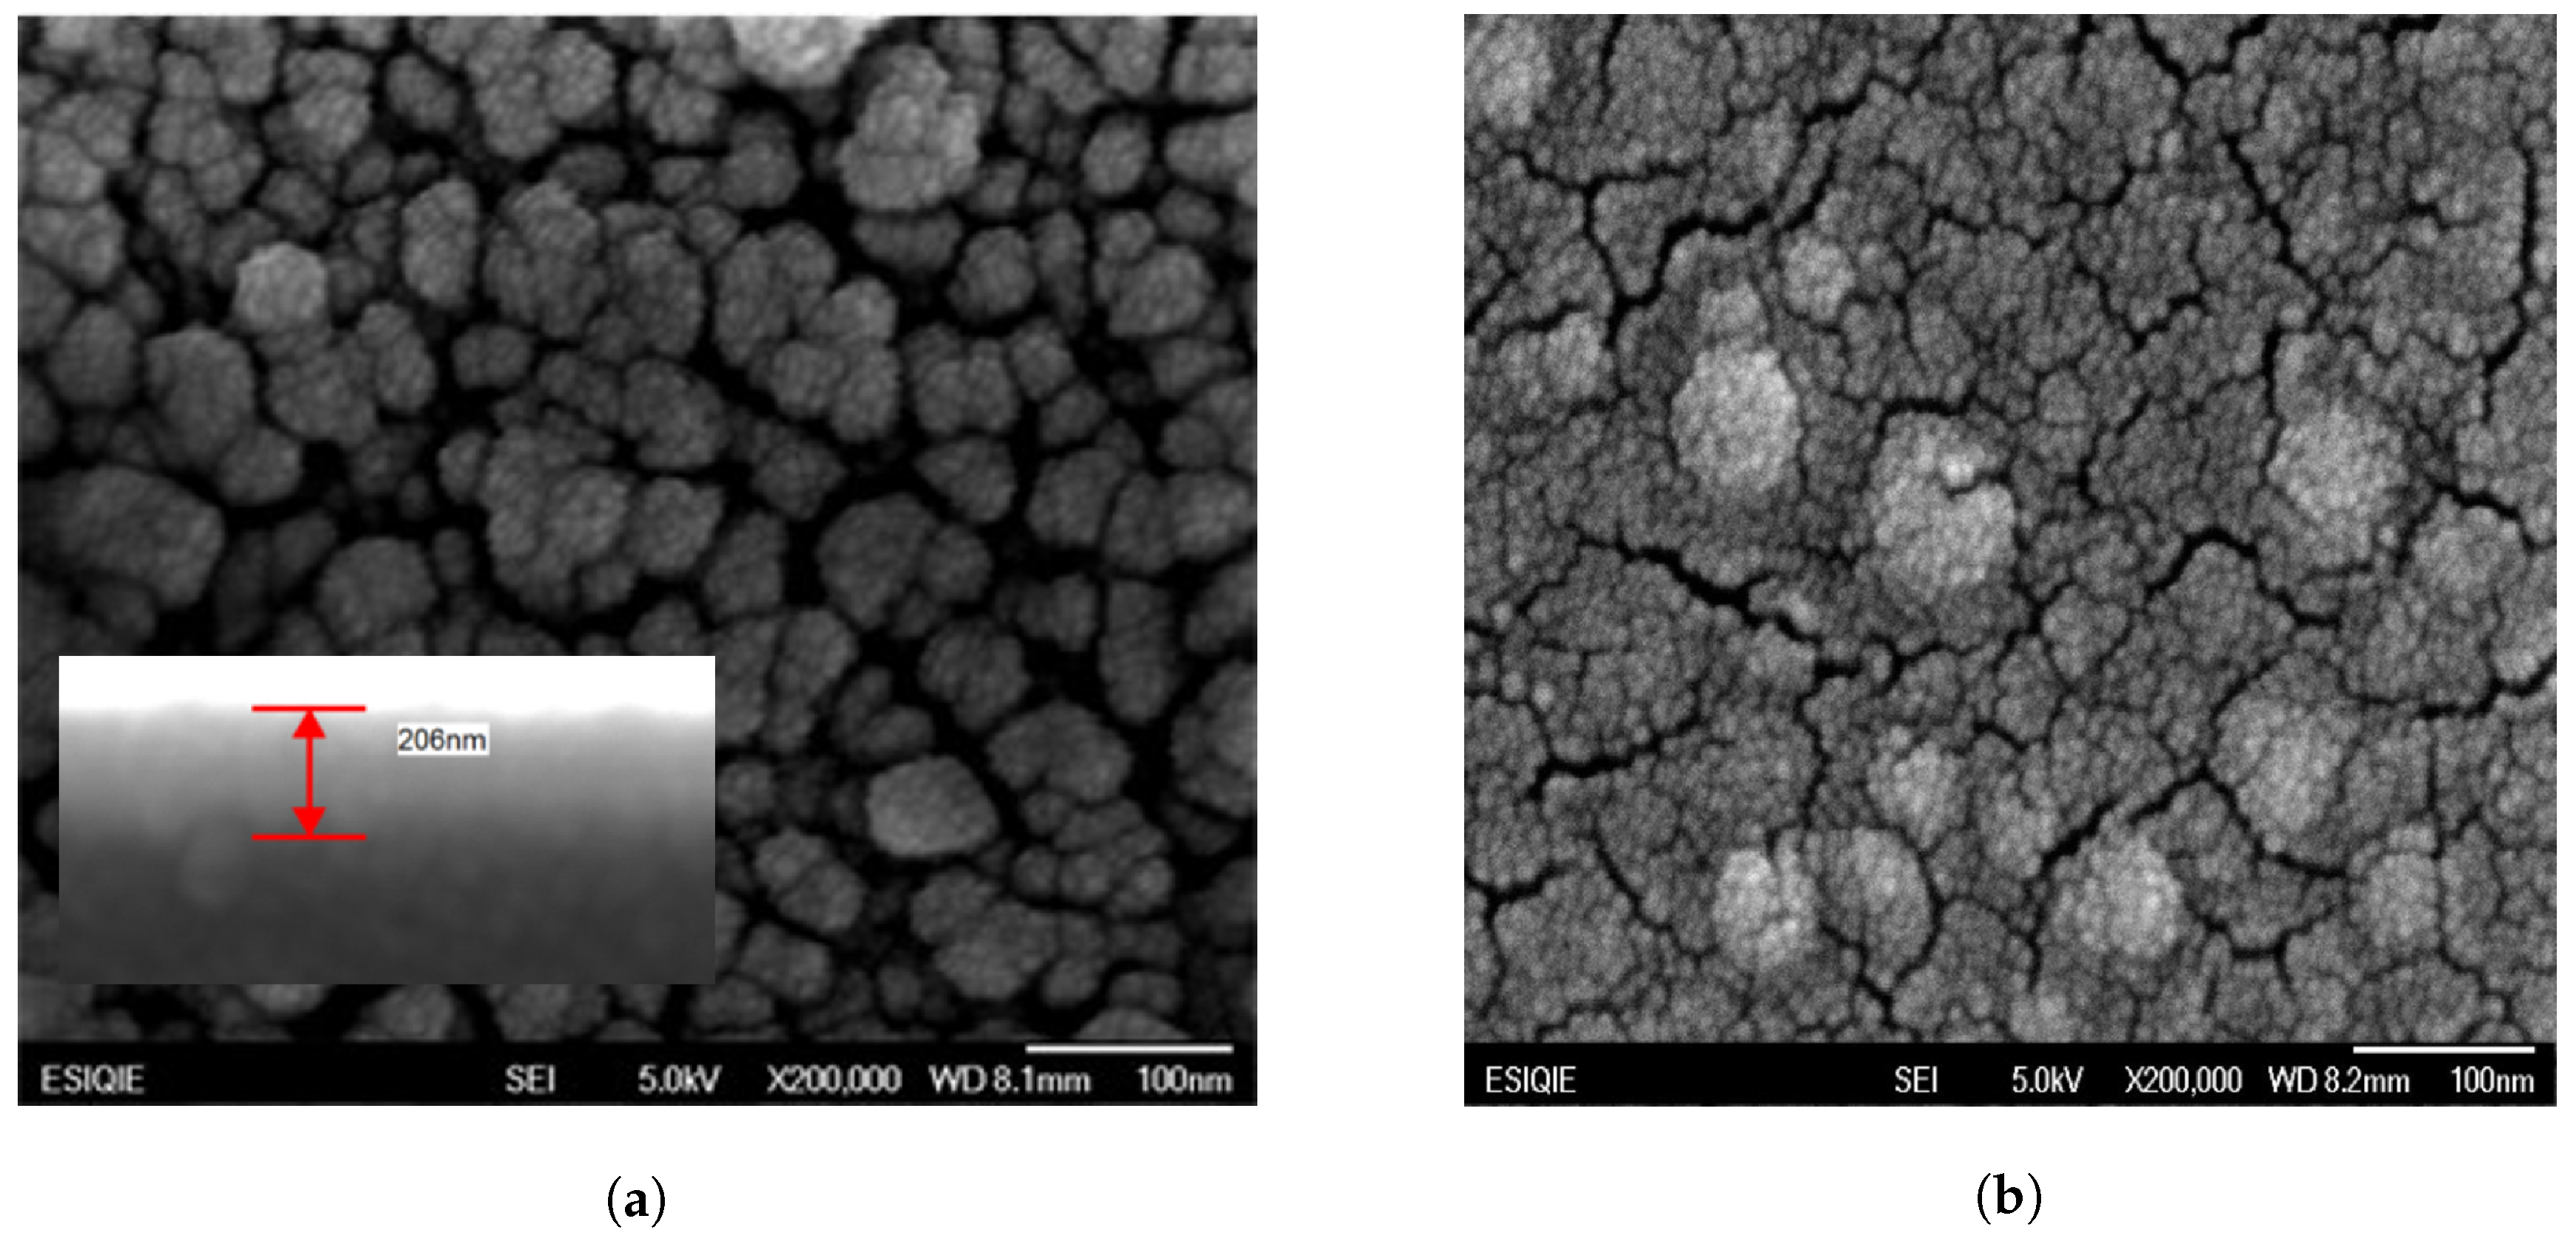
The surface morphology and thickness of N i O ( F ) were evaluated by Scanning Electron Microscopy (SEM), Figure 3a. The image showed the aggregates of NiO on the glass substrates, revealing a dense and continuous coating.
The optical image captured at 200,000× demonstrates the presence of NiO aggregates with an equivalent diameter smaller than 100 nm. These aggregates are conformed by little spherical particles (Figure 3a). A similar surface growth was reported in the synthesis of N i O films by electro-deposition on ITO coated [35]. The cross-sectional image of the film (insert Figure 3a) demonstrated the deposition of N i O on the glass slide was around 206 nm of thickness. This value was confirmed by spectroscopic ellipsometry. The average thickness was 240.97 ± 55.56 nm ( n = 3 , an average of five points by sample). After ozonation, N i O ( F ) (Figure 3b) showed apparent cracks. Lin et al. [35] in the synthesis of N i O ( F ) by galvanostatic electro-deposition method, observed cracks on the surface. This fact was attributed to the relaxation of the stress in the film. This behavior agrees with the XRD results, moreover, the film stability was demonstrated using the constant diminution of total organic carbon (TOC) when the reused films were used as the catalyst.
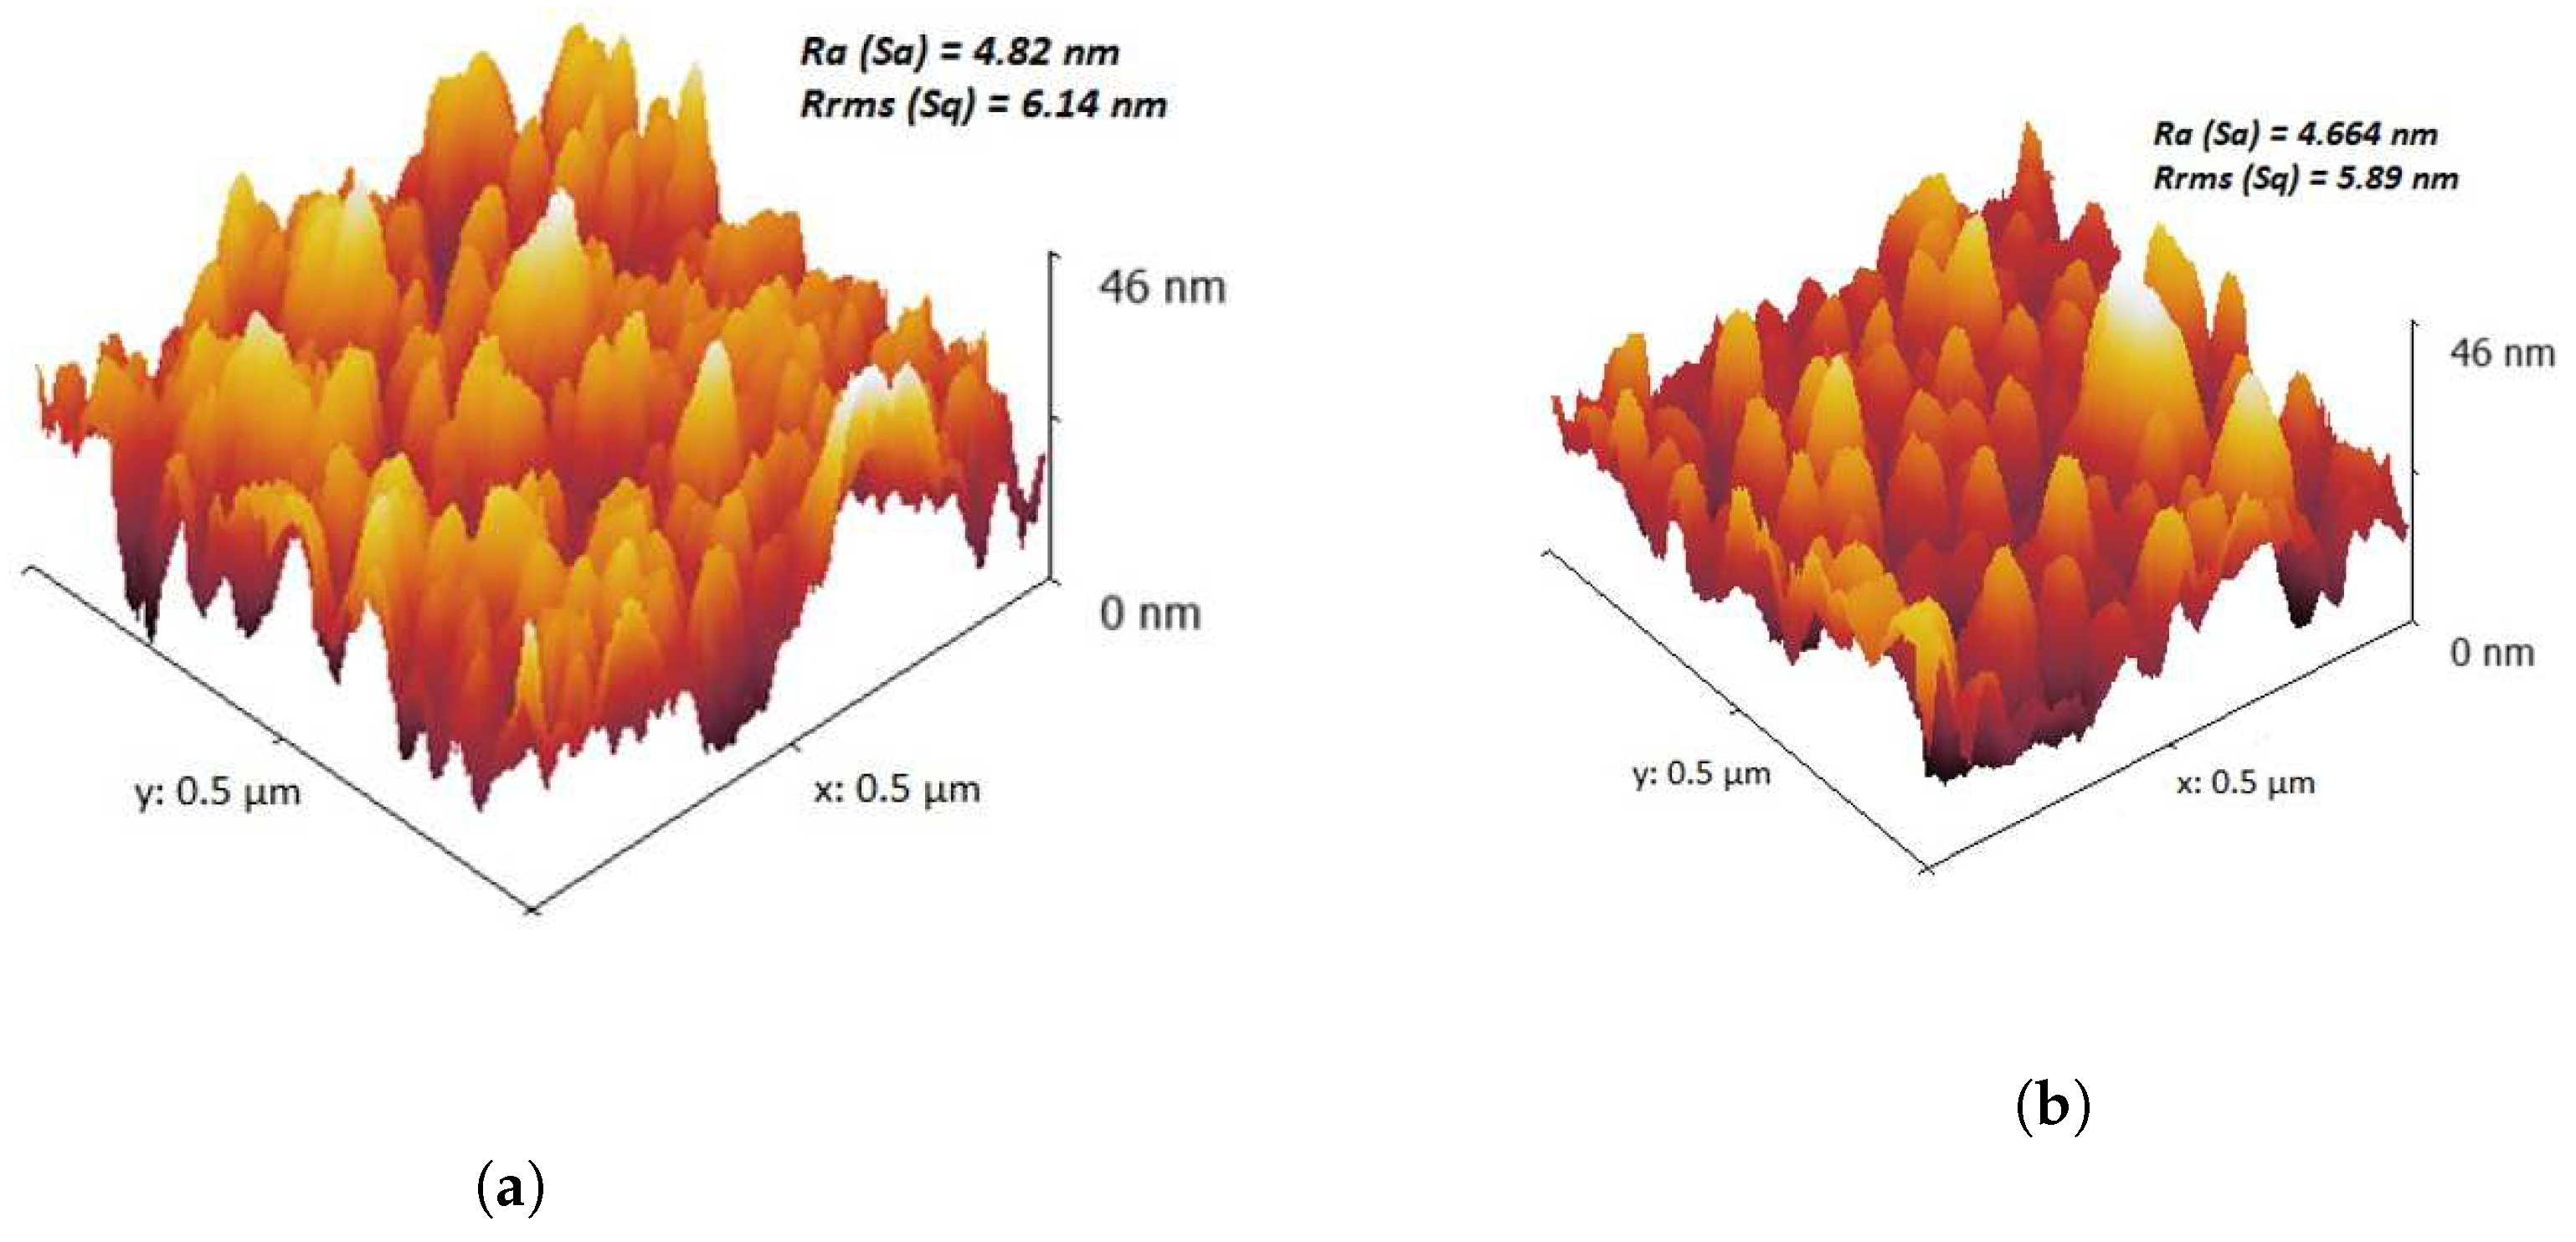
Figure 4 shows the Atomic force microscopy (AFM) images of surface morphology of N i O ( F ) (Figure 4a) and O 3 - N i O ( F ) (Figure 4b). In these figures, no cracks are observed after ozonation. The values of average roughness (Ra) and the root mean square roughness (Rrms) for N i O ( F ) were 4.66 nm and 5.89 nm, respectively and Ra was 4.82 nm and Rrms was 6.14 nm for O 3 - N i O ( F ) . These results unlike that observed in SEM analysis, suggest that the surface is not affected during the ozonation.
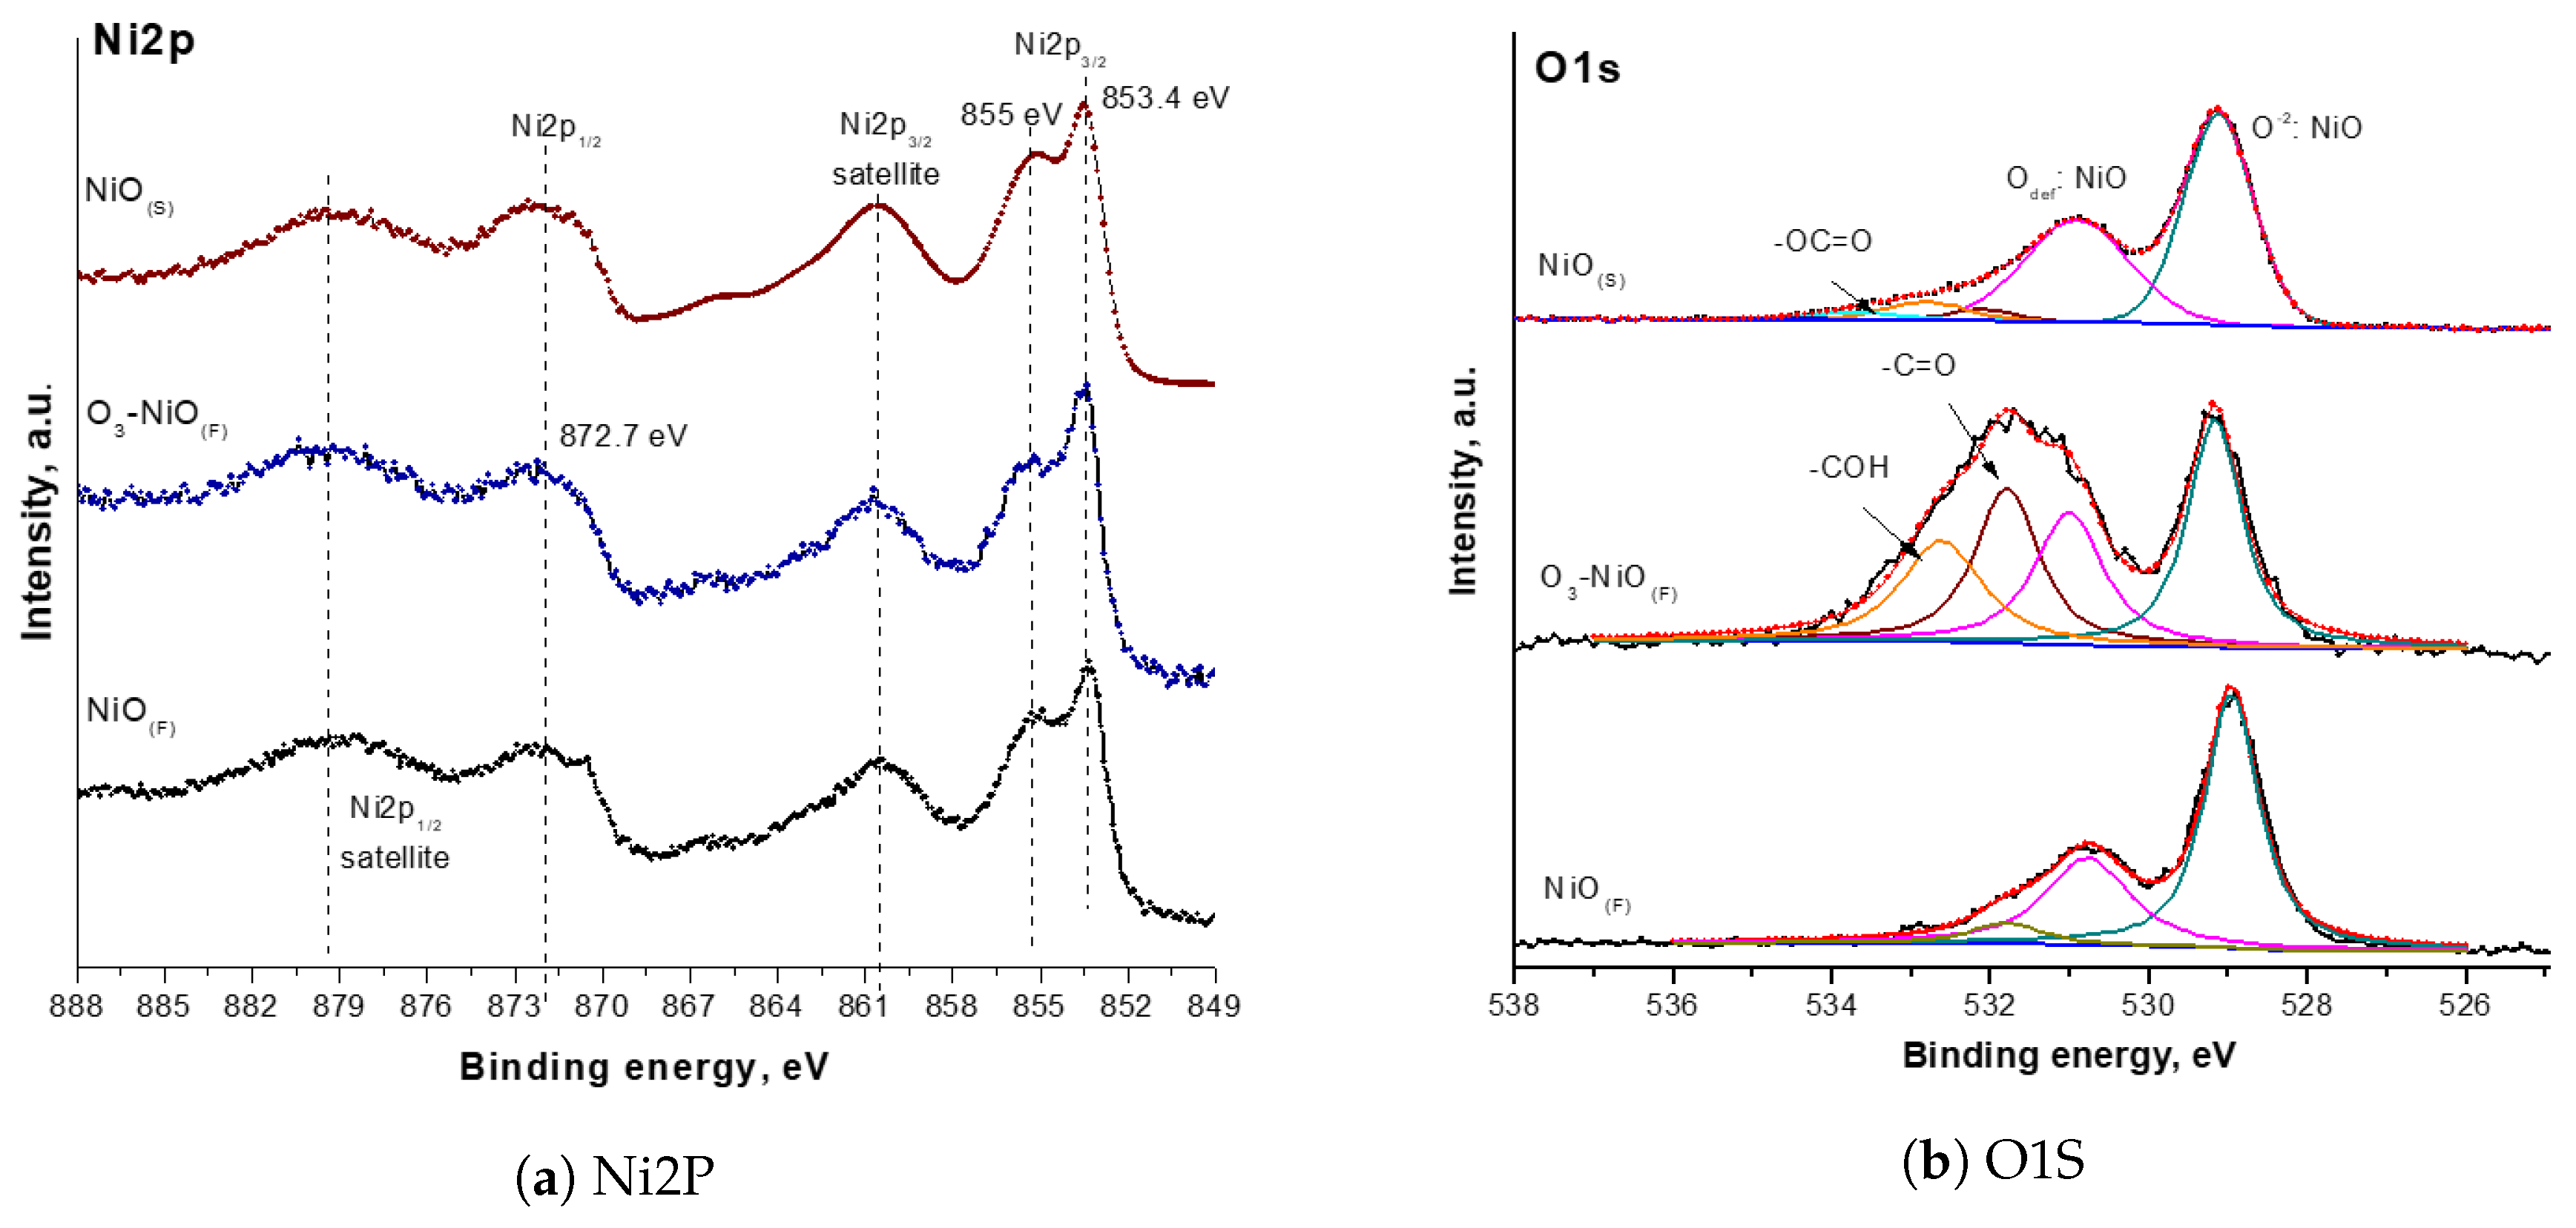
X-ray photoelectron spectroscopy (XPS) results for N i O ( F ) before and after ozonation are shown in Figure 5. The Ni2p region in the XPS spectrum displays characteristic signals attributed to N i O , Figure 5a. Ozone did not change the spectrum in the N i region which is similar to previous DRX results. Furthermore, the comparison N i O ( F ) and N i O ( S ) showed similar spectra. The O1s region (Figure 5b) is decomposed in two main signals for N i O ( F ) and N i O ( S ) : the first at 529.3 eV corresponding to oxygen atoms lattice of NiO and the second around 531 eV assigned to defective oxygen, for instance oxygen atoms due to nickel vacancies [9]. When the ozonation was carried out, N i O ( F ) displays two additional peaks (at 531.8 eV (-CO) and 532.3 eV (-COH)) which are attributed to oxygen coordinated to carbon atoms by adsorbed byproducts generating to NP decomposition.

2.2. Evaluation of N i O ( F ) in the NP Removal Using Ozone

Figure 6a shows the NP degradation profiles (obtained by high efficiency liquid chromatography) for conventional ( O 3 -conv) and catalytic ozonation with N i O ( F ) and N i O ( S ) . The NP signal was only detected along the first five minutes of the reaction. In the presence of N i O ( F ) and N i O ( S ) , the catalyst did not modify the NP degradation profile in comparison with O 3 -conv. The determined NP degradation time was faster than the other advanced oxidation process [31,36,37]. The apparent absence of changes in the degradation profile of the parent compound agrees with previous results [38,39]. This fact was attributed to: (1) ozone fast reaction with the initial contaminant (NP) and (2) generation of oxidant species (ozone decomposition with catalyst) and reaction with NP ozonation byproducts.
The pH changed during the ozonation from the initial NP solution which had a pH of 5.0 ± 0.5 to the final pH of 2.5 ± 0.5 after the treatment (60 min). Under these experimental conditions (acid pH), the direct ozonation mechanism was favored and ozone decomposition (formation of oxidant species) was not enforced. On the other hand, the oxalic acid accumulated in ozonation as the main final product which yields the decreasing of pH. This result coincides with the reported results by other researchers and our previous results [38,40].
Few articles have studied NP degradation by catalytic ozonation varying pH. The study proposed in [41] reported NP (50 mg/L) degradation with 0.48 mg/s of ozone at pH of 5, 6, 7, 8 and 9. The treatment at pH = 9 allowed near 100% of NP degradation after 4 min, while only 30% of NP was eliminated with pH = 5 during the same reaction time. This difference was explained considering that under basic pH, direct and indirect mechanisms occur simultaneously. In the case of catalytic ozonation of NP, [33] demonstrated that 1 g/L of T i O 2 yields a higher mineralization degree at pH of 5 and it decreased near 50% at pH 3. Moreover, the same authors proposed two periods of mineralization; the first period, named the fast, corresponding to the fast reaction of easy oxidable compounds; in this period pH plays a main role (while at greater pH = 7 increased the removal of TOC). The second mineralization stage includes the reaction of refractory byproducts and it was independent of pH. Notice that some of these results agree with the outcomes attained in this study.
The N i O effect can be observed in the oxalic acid profile over time (Figure 6b). This organic acid is a recalcitrant compound to O 3 -conv [42,43]. Oxalic acid is a main final product formed as a consequence of the aromatic ring outbreak or loss of acid naproxen substituent in the reaction, (mechanism reported by Jallouli et al. [44]). The O 3 - N i O ( F ) duplicates the oxalic acid concentration in comparison with O 3 -conv during the first min of reaction. The oxalic acid concentration is similar after 10 min in catalytic and conventional ozonation. The differences in the oxalic acid profile in both ozonation systems justify the proposed inclusion of several oxidant species in the catalytic ozonation. According to [38], the combination of ozone and N i O produced hydroxyl radicals ( · O H ) which favors the elimination of refractory organic compounds due to their oxidation potential (2.8 eV) [45].
Oxalic acid as a NP final product can be generated by two main routes: (1) the breakout of the propionic acid substituent of NP and the release of a 3-carbon fragment, the subsequent 1-carbon addition form the malic acid [44] by the oxidant species in the reaction. This byproduct is susceptible to oxidation with ozone and hydroxyl radicals to produce oxalic acid (a recalcitrant final product) (2). The electrospray ionization mass spectrometry (ESI-Ms) analysis of NP degradation effluents at 5 min showed the formation of aromatic byproducts. The molecules proposed for these ions m / z of 237.11, 217.09, 177.66 and 149.06 only present one aromatic ring.
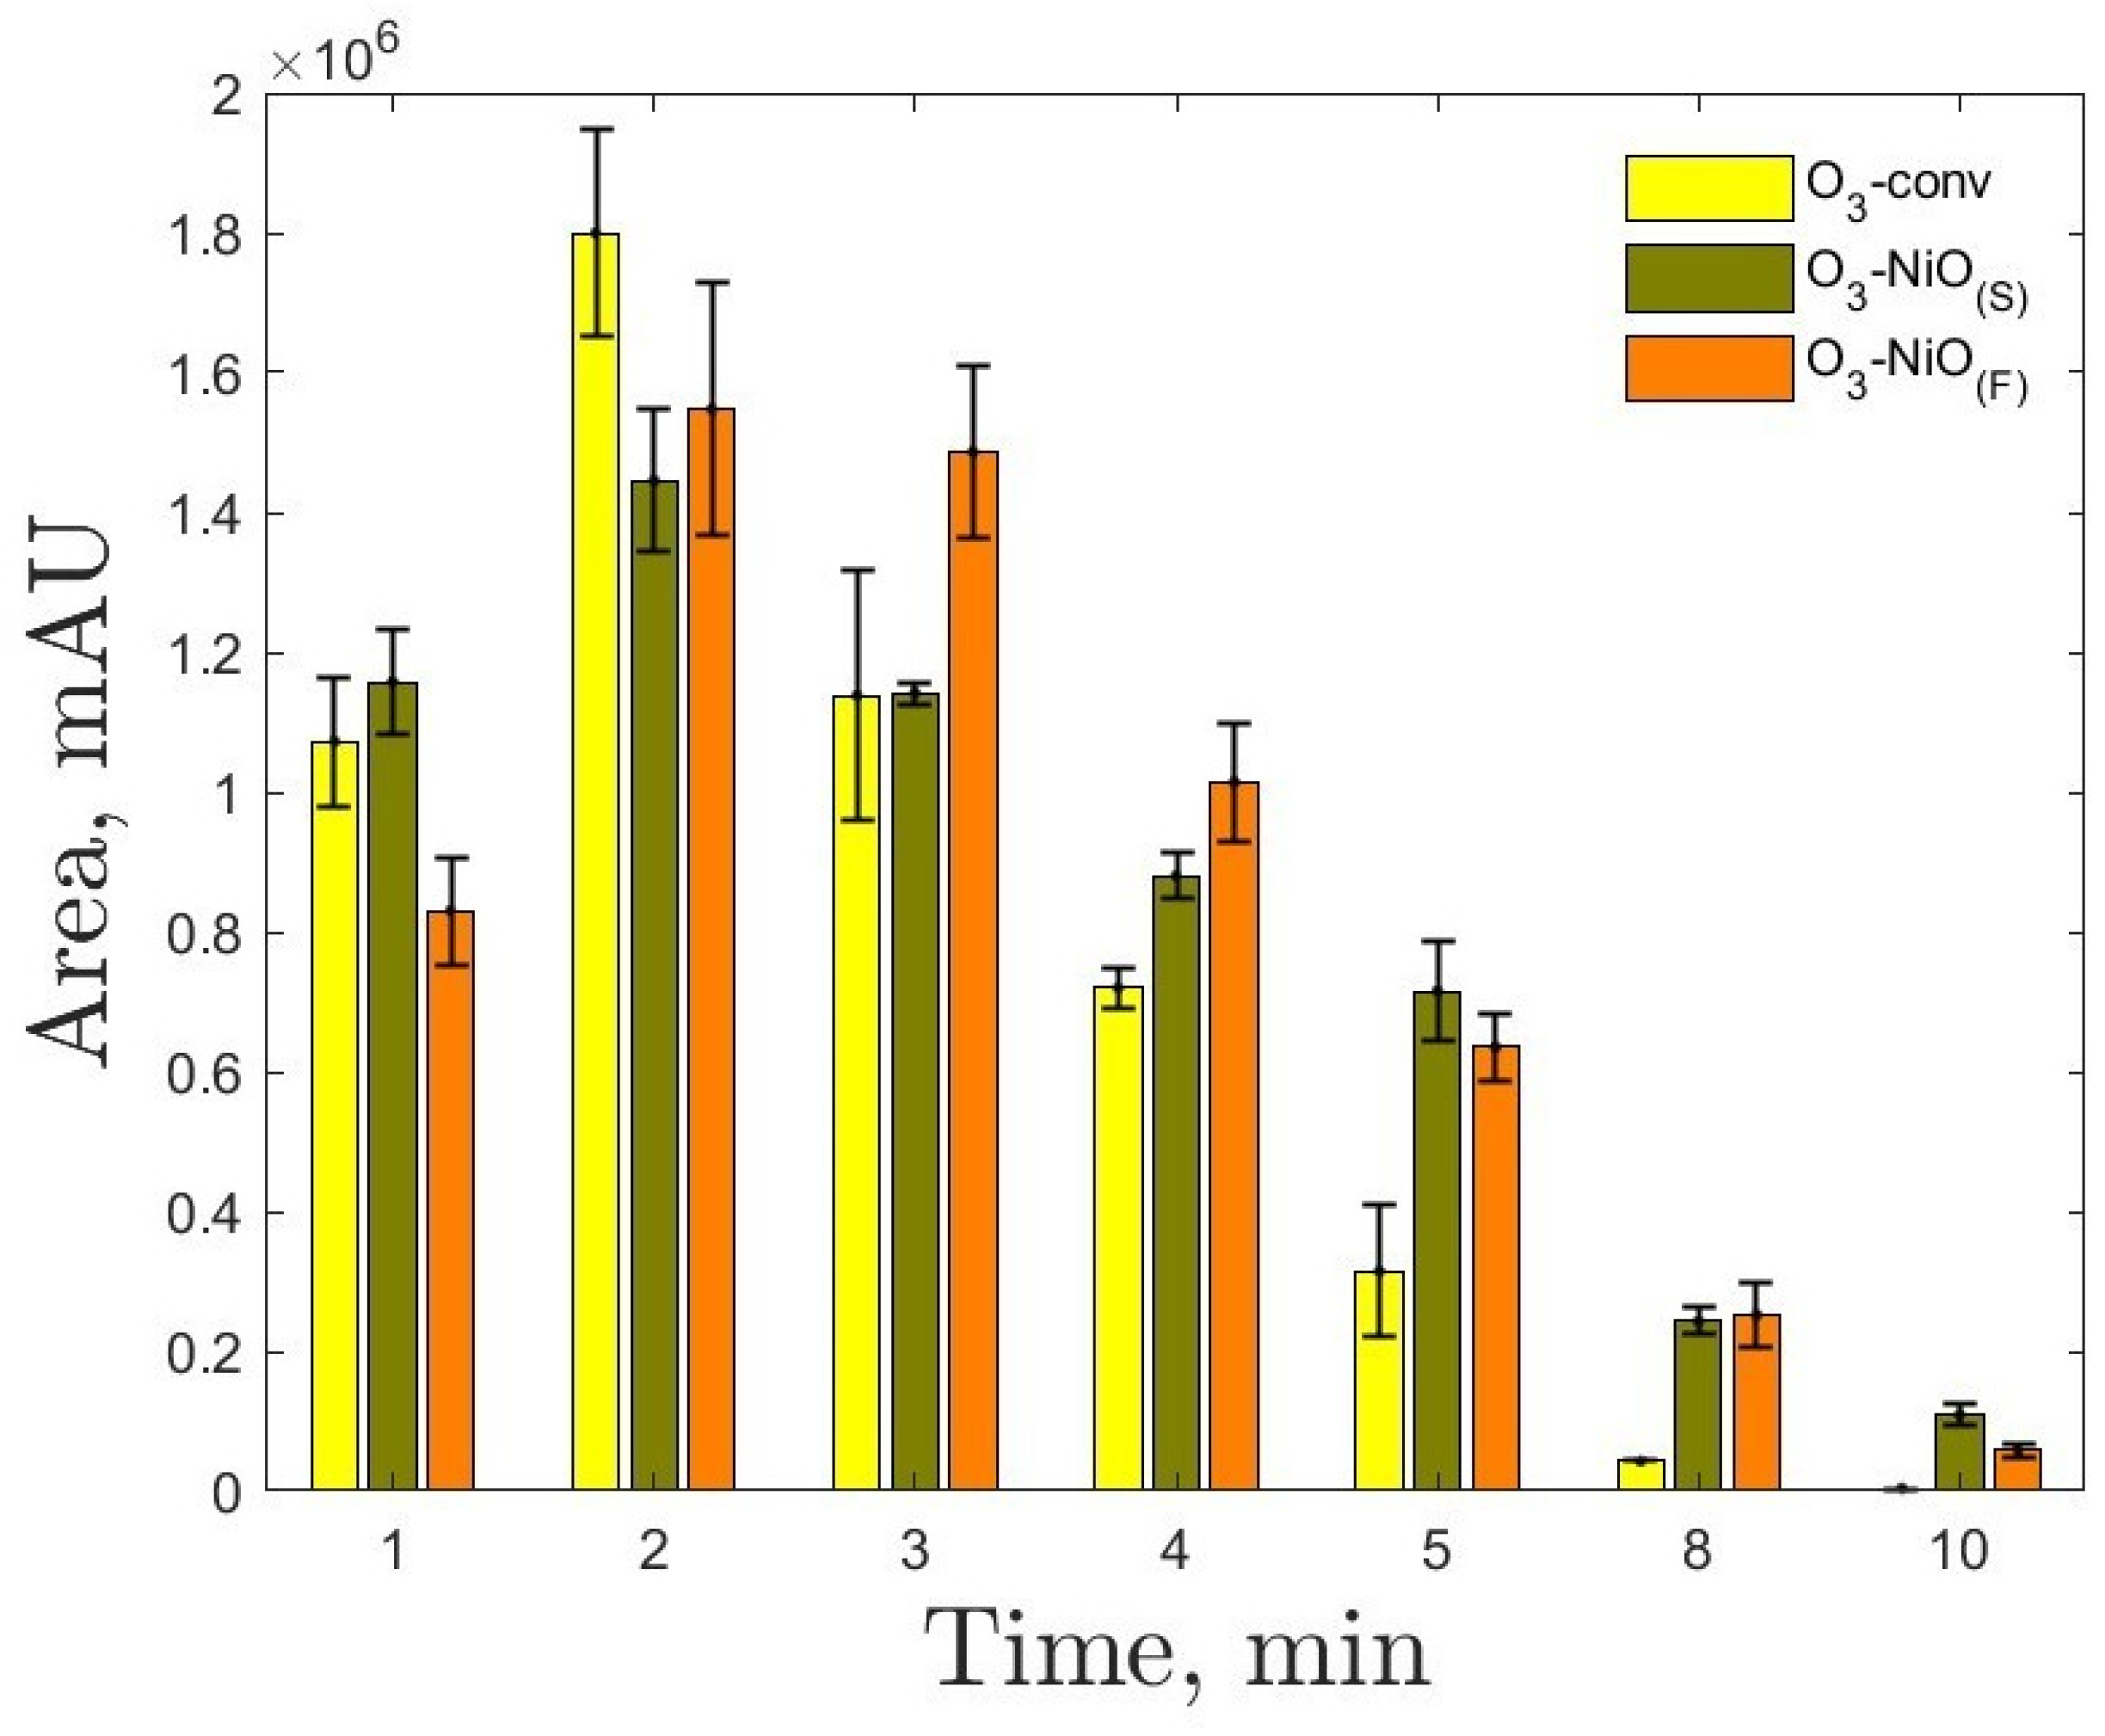
The fragments obtained in the breakout and degradation of the aromatic compounds can be degraded to oxalic acid. The increase of the oxalic acid concentration in the first two minutes of ozonation is possible due to the first route described above, where the break of aromatic rings is not needed. The subsequent decrease and slight increment of this compound concentration might be related to the aromatic byproduct’s degradation after 5 min which was confirmed by the HPLC and ESI-Ms studies. As an example (Figure 7), a signal of a non-identified intermediate byproduct detected by HPLC (12.9 min of retention time) disappeared after 10 min. Its maximal concentration was determined at 2 min.
In a previous article regarding NP degradation with different proportions of water and ethanol as solvents [38], the studies of ESI-Ms and ESI-mass-mass (ESI-Ms-Ms) spectrometry were done in negative mode. Different aromatic byproducts such as
(a)
1-(6-methoxynaphthalene-2-yl)ethylhydroperoxide,
(b)
2-(3-(hydroxymethyl)-4-(2-methoxyethyl)phenyl)propanoic acid
(c)
2-(4-(2-hydroxyvinyl)phenyl)acetic acid and
(d)
4-Methylphenylacetic acid
were detected in the first 5 min of the reaction. However, these byproducts were not detected at 60 min of treatment (conventional and catalytic ozonation). Similar results were obtained with the NiO films for the NP elimination. These results confirm that all these intermediate compounds are close to be eliminated within the time window of the ozonation reaction (This fact is confirmed with the ESI-Ms-Ms analysis in samples taken after 60 min of ozonation). What is more important is that the decomposition of these compounds yields to the formation of organic acids (such as oxalic acid), aldehydes and carbon dioxide. All these compounds are considered to be more biodegradable.
The global efficiency of water treatments can be determined by the TOC variation. The role of N i O ( F ) was estimated also by TOC analysis (Figure 8). In the O 3 -conv, TOC removal after 60 min of the reaction was 12.3%, while introducing 10 films of N i O increases this removal to 22%. The presence of 100 mg/L of N i O ( S ) approximately achieved 35% of TOC removal, indicating that the solid catalyst was a better system for the NP elimination.
The low and incomplete NP mineralization has been described as a regular condition in catalytic ozonation. Rosal et al. reported near 40% of TOC removal in O 3 -conv and around 55% using 1000 mg/L of T i O 2 Degussa P25 after 60 min of reaction. Therefore, the use of T i O 2 as a catalyst increased the TOC removal about 15% [33]. This percentage is similar to the observed in this work with 100 mg/L of N i O in suspension.
The use of N i O ( F ) showed less TOC removal compared to N i O ( S ) . In this study, to compare correctly the catalytic effectiveness of both catalytic cases, it is worth taking into account what decomposed mass of NP corresponds to the mass of the catalyst in the reaction, it means a class of NP decomposition yield. A rough calculation of the catalyst on the glass slide showed a mass of 1.2 mg per film and about 12 mg over the 10 used films. The calculated amount of catalyst in the treatment is 10 times less than that used in suspension (40 mg). Corresponding, the catalytic activity of N i O ( F ) is 1.66 mg of the decomposed NP and only 0.5 mg for N i O ( S ) at 1 mg of catalyst. Therefore, the catalytic activity of N i O ( F ) is 3.3 times higher than N i O ( S ) . This result shows the possibility of using lower concentrations of the catalyst when depositing it on thin films, in addition to facilitate its recovery after ozonation.
The stability of N i O ( F ) was studied by TOC removal after 4 consecutive cycles of ozonation, Figure 8. In all cases, N i O ( F ) removed similar TOC percent after each cycle ( 22.2 % ± 2.9 % of TOC removal). Such a result indicates that ozone-NP and ozone-byproducts reactions did not inhibit the activity of N i O ( F ) after 4 cycles. The use of films as catalysts in the ozonation is scarcely described yet. Guzman et al. (2020) [19], in the 4-chlorophenol and 4-phenolsulfonic acid degradation by ozone (120 min) with six ceria oxide films (26.4 × 76.2 mm) demonstrated a similar TOC removal in five cycles of treatment (about 44% for both compounds). The results confirm the stability of the film in the catalytic ozonation.

2.3. Mathematical Modeling of the Reaction Dynamics

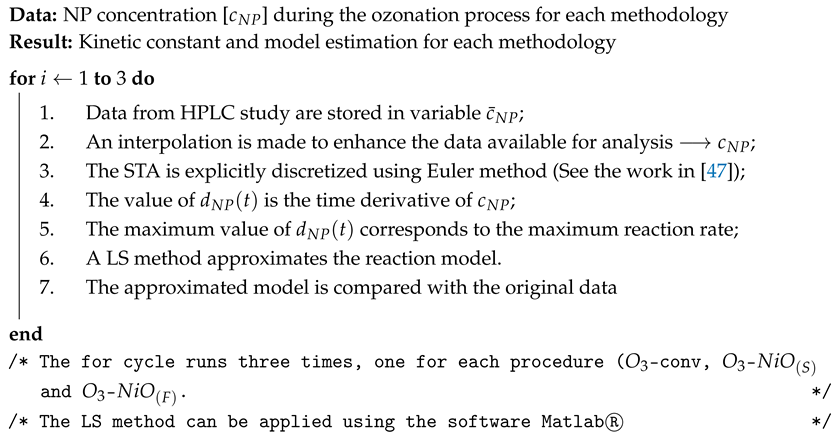
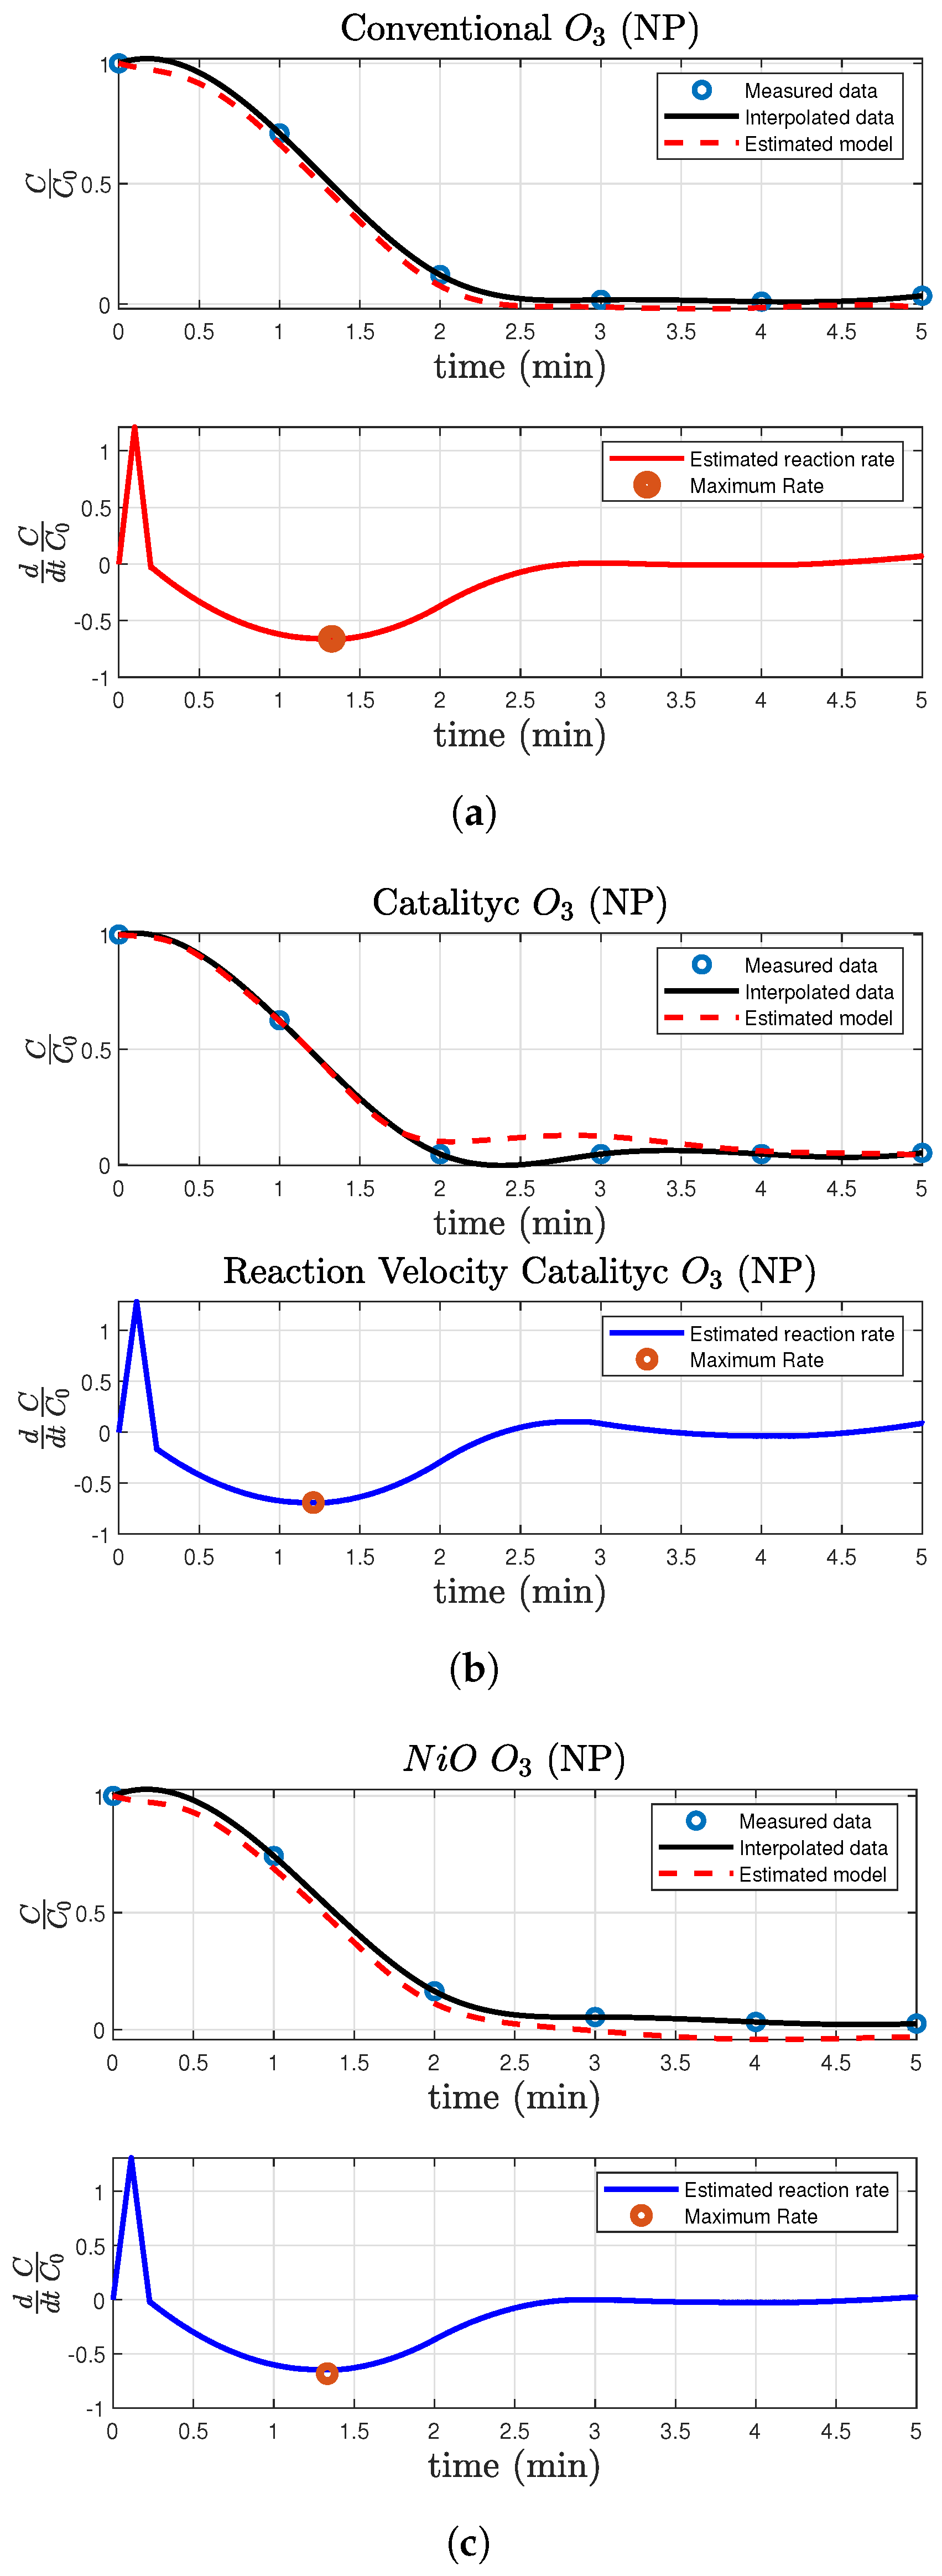
Table 1 summarizes all parameters used in the Super-Twisting algorithm (STA) to estimate the kinetics of the NP degradation by ozonation. The robustness of STA produces similar values for the needed parameters for tuning the differentiator. Figure 9 shows the time variation of signals produce by the modeling process that yields the kinetics and the approximate model of NP degradation by conventional and catalytic ozonations. In the first step, data are collected from the HPLC. These data are marked with a blue circle in all subfigures. Then, the black continuous line is obtained by an interpolation process (spline functions as an approximation basis). This step is done to have enough data to feed STA applied as a differentiator. The accuracy of the STA is related to the quality of the collected data. The derivative is presented in the second graph. During the first 40 s of simulation, STA presents an overshoot during the adaptation phase, which means it is the time when the value x 1 ( t ) C N P ( t ) is reaching the zero value. After this time, the derivative is exact, and one may calculate the maximum rate of NP degradation. This rate is marked with a red circle in each graph and it is reported in Table 1. This process was repeated three times to compare the behavior of the ozonation cases studied in this manuscript.
Figure 9a shows the estimated model for the degradation of NP with conventional O 3 , while Figure 9b shows the estimated model for the O 3 - N i O ( S ) and Figure 9c shows the process for O 3 - N i O ( F ) . The STA was numerically evaluated with k 1 = k 2 = 17.7 for the O 3 -conv and k 1 = k 2 = 15.1 for the catalytic ozonations.
Notice that all reaction rates constants are not varying significantly. However, their tendencies confirm what one may detect as a critical outcome of this and similar studies on supported catalysts over solid films: films of catalyst may be more efficient than conventional (no catalytic), but less than using the powder catalyst. This condition can be clearly justified by the mass transfer effect which is not limited in the O 3 - N i O ( S ) case, but it could be an issue for the O 3 - N i O ( F ) process. Nevertheless, the process efficiency in terms of the contaminants and byproducts removals concerning the catalyst mass is relevantly higher for the case of thin films. Moreover, the stability of such films regarding reusing experiments is a promising outcome attained here.

3. Materials and Methods

This section summarizes all materials and methods used in the catalytic ozonation of NP using supported catalysts forming thin films. Also, the kinetic characterization of catalytic ozonation of NP is proposed using a simplified model based on approximate pseudo-first-order dynamics.

3.1. Synthesis of Nickel Oxide Films

The synthesis of N i O ( F ) was carried out in a quartz tube within a CVD set-up reported elsewhere. Nickel (II) acetylacetonate N i ( a c a c ) 2 (Sigma-Aldrich, Mexico City, Mexico 99.0%) was used as metal-organic precursor of the corresponding metallic oxide. The conditions for N i O deposition were: (a) 200 °C of N i ( a c a c ) 2 sublimation temperature, (b) 550 °C of substrate temperature, (c) mixture of A r - O 2 ( 60 s c c m - 60 s c c m ) . With these conditions, the allowed pressure in the equipment was 10 mTorr. This parameter was kept constant along the reaction period. The deposition time was 15 min.
The N i O ( F ) grew up on glass plates of 2.5 × 3.0 cm as the substrate. The substrate was washed previously to the deposition with sonication cycles of 15 min using different solvents: acetone, ethanol, and distillate water. The films were used in ozonation without any additional techniques.

3.2. N i O ( F ) Characterization

Characterization of N i O ( F ) was made with the following techniques: XRD, XPS, AFM (Brunker Zeiss Bioscope catalyst), spectroscopic ellipsometry and SEM (JEOL JSM 6701F, Peabody, Massachusetts, USA, 5 kV). These techniques allowed to study the morphology and crystal structure of the obtained N i O ( F ) . The SEM determined the thickness of the N i O film. This parameter was compared with the result obtained by spectroscopic ellipsometry in the HORIBA’s UVISEL equipment where the visible-UV spectra were acquired from a range of 1.5–5.5 eV.
XRD analysis was carried out in the Bruker D8 advance equipment with copper radiation operating at 35 kV and 25 mA (Cu K α , λ = 1.54 Å) in 2 θ between 20–90°. The XRD pattern obtained from N i O ( F ) was compared with N i O ( S ) with the Bruker D8 AXS equipment using the same operating conditions.
XPS (Thermo Fisher Scientific, Waltham, Massachusetts, USA) was applied to determine changes in chemical binding types (Al K α X-ray monochromatic source, 1487 eV; charge correction C1s: 284.6 eV).
AFM and NP-10 probes tips (Bruker, www.brukerafmprobes.com) with V-shaped cantilever and 20 nm radius pyramidal-geometry were used. The measurements were done in Tapping mode. The software NanoScope Analysis v1.4 (Bruker, Billerica, Massachusetts, USA, 2018) was used to calculate the average roughness which determines the deviation in height. Root mean square roughness represents the standard deviation of surface heights from AFM images. The thickness of N i O ( F ) was obtained by spectroscopic ellipsometry.

3.3. Catalytic Ozonation

The stability condition of N i O ( F ) was studied in catalytic ozonation of NP solutions (Sigma-Aldrich, 99.8%; 20 mg/L dissolved in distillate water). The initial pH of the solution was 5.0 ± 0.5 , this parameter was not controlled during the ozonation. In O 3 - N i O ( F ) treatments, ten coated slides were assembled on a Teflon sheet. They were put in a glass bubbled column reactor. This configuration allowed the contact of N i O ( F ) with NP solution (400 mL) and ozone. The mixture O 3 - O 2 (flow: 0.5 L/min and O 3 = 5.5 ± 0.5 mg/L, HTU500 G ozone generator corona discharge type-AZCO Industries) bubbled through a ceramic porous filter located at the bottom of the self-designed reactor (500 mL). NP degradation by O 3 - N i O ( F ) was compared with O 3 - N i O ( S ) using 100 mg/L of NiO nanopowder <50 nm Sigma-Aldrich, 99.0%.

3.4. Analytical Methods

The monitoring of NP and oxalic acid (the main byproduct formed by the NP decomposition by conventional ozonation) by HPLC was carried out in the Perkin Elmer Flexar equipment. The column for the NP analysis was a Platinum C18 Alltech (250 mm × 4.6 mm) and 0.3 mL/min of water:acetonitrile 50:50 with a pH of 2.5 (phosphoric acid) as mobile phase. The separation followed at 240 nm. The byproducts detection was made using a Prevail TM Alltech–Grace column ( 150 × 4.6 mm and 5 μm). The mobile phase was a 0.25 mM of KH2PO4 Buffer pH of 2.5 (phosphoric acid), the determination followed with 1.0 mL/min at 210 nm. The mineralization degree was calculated using TOC data obtained by the Torch IQOQ Teledyne Tekmar equipment by direct injection. All samples were previously filtered with membranes of 0.2 μm.

3.5. Mathematical Modeling and Parameter Estimation

To compare the NP removing efficiency enforced by the three studied methods, the NP ozonation rate constants were determined. For this study, it is used as a simplified approximation of the kinetic model based on pseudo-first-order dynamics. Then, with the data obtained from the decomposition of NP by ozonation, one can propose a set of finite parameters that correspond to the reaction rate constants. The following kinetic model considers the interaction between the measurable components in the reaction (contaminant, byproducts and ozone).
It is known that the reaction of either molecular ozone or hydroxyl radicals with contaminants satisfies a second-order kinetics, i.e.:
d d t c N P ( t ) = k N P , O 3 O 3 , l ( t ) + k N P , O H O H ( t ) c N P ( t ) ,
where k N P , O 3 , min−1 is the reaction rate constant between ozone in the liquid phase O 3 , l , mole/L and NP while k N P , O H is the reaction rate constant between hydroxide radicals O H , mole/L and NP.
Nevertheless, due to the interaction of ozone with the catalyst leading to the corresponding formation of hydroxyl radicals, the explicit quantification of O 3 and O H independently is a complex task in the presence of N i O films. Therefore, in this case, we propose an alternative method to characterize the decomposition of NP. Consider that k ( t ) = k O 3 O 3 ( t ) + k O H O H ( t ) is the pseudo-mono molecular time dependent reaction rate parameter. Now, if one considers that k N P = m a x t 0 k ( t ) it is feasible to propose that the following mathematical structure is given by:
d d t c N P ( t ) = k N P c N P ( t ) ,
where c N P represents the concentration of the contaminant in time during the ozonation and k N P is the kinetic constant associated with the decomposition rate of NP.
Using the differential equations representations of chemical processes and considering that advanced oxidation processes can be sufficiently approximated by pseudo-first-order dynamics. The inherent problem is the available information along with heterogeneous catalytic ozonation reaction. Usually, available measurements along the reaction are concentrations of just a few chemical species including the initial contaminant as well as its byproducts [46]. However, this information is not enough to get an accurate estimation of the first-order reaction rates. Commonly, it is necessary to get estimates of the contaminants’ decomposition velocity. With the aim of getting a precise estimation of such decomposition velocity, a robust differentiation technique can be implemented.
Numerical differentiation is a well-studied topic in systems theory. The most common differentiation technique is based on the Euler approximation [47]. However, this method is highly affected by noises in the measurement. This manuscript proposes the application of the STA, which is a robust exact differentiator [48] based on the sliding mode theoretical results. The advantages of this algorithm are its robustness against parametric uncertainties that are common in the chemical process, well-posed discretization equivalents and finite-time convergence. Therefore, by means of the STA, the reaction kinetics are obtained. With the concentration and the information provided by the STA, a least square regression is performed to obtain a more accurate model representation of the heterogeneous catalytic ozonation.
STA [48] can determine the time derivative of a signal even in the presence of certain class of noises and model uncertainties. The algorithm is given by the following set of differential equations
d C N P ( t ) = x 2 ( t ) k 1 | x 1 ( t ) C N P ( t ) | 1 / 2 sign ( x 1 ( t ) c N P ( t ) ) x ˙ 1 ( t ) = d c N P ( t ) x ˙ 2 ( t ) = k 2 sign ( x 1 ( t ) c N P ( t ) )
In Equation (3), d c N P is the actual time derivative of the concentration c N P ( t ) , x 1 and x 2 are internal variables, k 1 and k 2 are positive constants that define the rate of convergence and the quality of estimation of the algorithm. The function sign ( · ) is defined as
sign ( z ) = 1 i f z < 0 [ 1 , 1 ] i f z = 0 1 i f z > 0
Notice that d d t c N P ( t ) = d c N P ( t ) when the algorithm has converged to the real concentration c N P ( t ) , the estimation error defined as x 1 ( t ) c N P ( t ) is equal zero. Notice the necessity of applying the STA differentiator as many times as the number of compounds identified along with the heterogeneous catalytic ozonation characterization: one for the degradation of NP in the three experimental setups: O 3 -conv, O 3 - N i O ( S ) and O 3 - N i O ( F ) . The complete procedure to estimate the reaction rates is summarized in the Algorithm 1.
Algorithm 1: Parameter estimation in the NP degradation by ozonation techniques
Catalysts 10 00884 i001
For further references, the theoretical background of the STA working as a differentiator can be found in [47,48].

4. Conclusions

CVD method allowed the synthesis of thin N i O films (240 nm thick) with relevant catalytic characteristics in NP degradation by ozone. NP elimination was carried out in five minutes of reaction with and without NiO (powder and film), due to its fast reaction with molecular ozone. The byproduct analysis and TOC removal showed the catalytic activity of the NiO in the ozonation. The treatments with 100 mg/L of N i O ( S ) generated a TOC removal of 35% while in the presence of 10 films of NiO, TOC removal increased 10% in comparison with O 3 -conv. However, NiO mass supported on the films was close to a tenth of the NiO used in suspension. The reuse of films (4 cycles) attained similar TOC removal in each cycle ( 22 ± 2.9 %). This fact showed the stability of the catalyst films. Moreover, the film characterization after ozonation demonstrated some changes in the surface morphology but XRD and XPS patterns confirmed the crystalline stability. The results obtained suggest the possibility of using the deposition of catalyst in the film form in the catalytic ozonation of recalcitrant pollutants with the reduction of several detected disadvantages of the suspended catalyst (elimination and reuse). This study also presented a simplified model characterizing the ozonation kinetics of NP. A novel method yields to estimate a pseudo-monomolecular reaction rate constant which established a comparison between the proposed ozonation of NP with (suspension and films) and without catalysts. This model seems to offer a primary method to explain the reaction kinetics of ozone and NP in the presence of N i O ( F ) as a catalyst.

Author Contributions

Synthesis and characterization of NiO film, J.A.G.-P. and J.A.A.A.; Conventional and Catalytic ozonation, C.M.A.-M. and J.L.R.; Mathematical modeling and parameter estimation, I.S. and I.C.; supervision and writing-review and editing, J.V.-A. and T.P. All authors have read and agreed to the published version of the manuscript.

Funding

This research was funded by Instituto Politécnico Nacional (Project: 20200519) and Consejo Nacional de Ciencia y Tecnología (Posdoctoral studies) and Investigación Científica Básica” 2018 grant no. A1-S-21608.

Acknowledgments

The authors kindly acknowledge to Instituto Politécnico Nacional, Centro de Nanociencias y Micro y Nanotecnologías-IPN, Consejo Nacional de Ciencia y Tecnología (Posdoctoral studies of Claudia M. Aguilar Melo) and PhD. Denisse Fabiola González Ramírez for economical supporting and contribution in this work.

Conflicts of Interest

The authors declare no conflict of interest.

Abbreviations

The following abbreviations are used in this manuscript:
NPNaproxen
CVDChemical vapor deposition
O 3 -convConventional ozonation
N i O ( F ) NiO film
O 3 - N i O ( S ) Catalytic ozonation with suspension NiO
O 3 - N i O ( F ) Catalytic ozonation with film NiO

References

  1. Wang, J.; Chen, H. Catalytic ozonation for water and wastewater treatment: Recent advances and perspective. Sci. Total Environ. 2020, 704, 135249. [Google Scholar] [CrossRef] [PubMed]
  2. Assadi, M.H.N.; Hanaor, D.A. The effects of copper doping on photocatalytic activity at (101) planes of anatase TiO2: A theoretical study. Appl. Surf. Sci. 2016, 387, 682–689. [Google Scholar] [CrossRef] [Green Version]
  3. Zhang, S.; Quan, X.; Wang, D. Catalytic Ozonation in Arrayed Zinc Oxide Nanotubes as Highly Efficient Mini-Column Catalyst Reactors (MCRs): Augmentation of Hydroxyl Radical Exposure. Environ. Sci. Technol. 2018, 52, 8701–8711. [Google Scholar] [CrossRef] [PubMed]
  4. Rosal, R.; Gonzalo, S.; Santiago, J.; Rodríguez, A.; Perdigón-Melón, J.A.; García-Calvo, E. Kinetics and Mechanism of Catalytic Ozonation of Aqueous Pollutants on Metal Oxide Catalysts. Ozone Sci. Eng. 2011, 33, 434–440. [Google Scholar] [CrossRef]
  5. Chen, G.; Wang, Z.; Lin, F.; Zhang, Z.; Yu, H.; Yan, B.; Wang, Z. Comparative investigation on catalytic ozonation of VOCs in different types over supported MnOx catalysts. J. Hazard. Mater. 2020, 391, 122218. [Google Scholar] [CrossRef]
  6. Beltrán, F.J.; Álvarez, P.M.; Gimeno, O. Graphene-Based Catalysts for Ozone Processes to Decontaminate Water. Molecules 2019, 24, 3438. [Google Scholar] [CrossRef] [Green Version]
  7. Wang, B.; Zhang, H.; Wang, F.; Xiong, X.; Tian, K.; Sun, Y.; Yu, T. Application of Heterogeneous Catalytic Ozonation for Refractory Organics in Wastewater. Catalysts 2019, 9, 241. [Google Scholar] [CrossRef] [Green Version]
  8. Hu, J.; Li, Y.; Nan, S.; Yoza, B.A.; Li, Y.; Zhan, Y.; Wang, Q.; Li, Q.X.; Guo, S.; Chen, C. Catalytic Ozonation of Nitrobenzene by Manganese-Based Y Zeolites. Front. Chem. 2020, 8, 80. [Google Scholar] [CrossRef] [PubMed]
  9. Rodríguez, J.L.; Valenzuela, M.A.; Poznyak, T.; Lartundo, L.; Chairez, I. Reactivity of NiO for 2,4-D degradation with ozone: XPS studies. J. Hazard. Mater. 2013, 262, 472–481. [Google Scholar] [CrossRef] [PubMed]
  10. Aguilar, C.M.; Vazquez-Arenas, J.; Castillo-Araiza, O.O.; Rodríguez, J.L.; Chairez, I.; Salinas, E.; Poznyak, T. Improving ozonation to remove carbamazepine through ozone-assisted catalysis using different NiO concentrations. Environ. Sci. Pollut. Res. Int. 2020. [Google Scholar] [CrossRef] [PubMed]
  11. Aguilar, C.M.; Rodríguez, J.L.; Chairez, I.; Tiznado, H.; Poznyak, T. Naphthalene degradation by catalytic ozonation based on nickel oxide: Study of the ethanol as cosolvent. Environ. Sci. Pollut. Res. Int. 2017, 24, 25550–25560. [Google Scholar] [CrossRef] [PubMed]
  12. Biard, P.F.; Werghi, B.; Soutrel, I.; Orhand, R.; Couvert, A.; Denicourt-Nowicki, A.; Roucoux, A. Efficient catalytic ozonation by ruthenium nanoparticles supported on SiO2 or TiO2: Towards the use of a non-woven fiber paper as original support. Chem. Eng. J. 2016, 289, 374–381. [Google Scholar] [CrossRef] [Green Version]
  13. Shahamat, Y.D.; Farzadkia, M.; Nasseri, S.; Mahvi, A.H.; Gholami, M.; Esrafili, A. Magnetic heterogeneous catalytic ozonation: A new removal method for phenol in industrial wastewater. J. Environ. Health Sci. Eng. 2014, 12, 50. [Google Scholar] [CrossRef] [PubMed] [Green Version]
  14. Battiato, S.; Giangregorio, M.M.; Catalano, M.R.; Nigro, R.L.; Losurdo, M.; Malandrino, G. Morphology-controlled synthesis of NiO films: The role of the precursor and the effect of the substrate nature on the films’ structural/optical properties. RSC Adv. 2016, 6, 30813–30823. [Google Scholar] [CrossRef]
  15. Xi, Y.Y.; Li, D.; Djurišić, A.B.; Xie, M.H.; Man, K.Y.K.; Chan, W.K. Hydrothermal Synthesis vs. Electrodeposition for High Specific Capacitance Nanostructured NiO Films. Electrochem. Solid State Lett. 2008, 11, D56. [Google Scholar] [CrossRef]
  16. Vargas Garcia, J.R.; Lazcano Ugalde, E.M.; Hernandez Santiago, F.; Hallen Lopez, J.M. Nanostructured nickel oxide films prepared by chemical vapor deposition and their electrochromic properties. J. Nanosci. Nanotechnol. 2008, 8, 2703–2706. [Google Scholar] [CrossRef]
  17. Pellegrino, F.; De Bellis, N.; Ferraris, F.; Prozzi, M.; Zangirolami, M.; Petriglieri, J.R.; Schiavi, I.; Bianco-Prevot, A.; Maurino, V. Evaluation of the Photocatalytic Activity of a Cordierite-Honeycomb-Supported TiO2 Film with a Liquid-Solid Photoreactor. Molecules 2019, 24, 4499. [Google Scholar] [CrossRef] [Green Version]
  18. Tekin, D.; Tekin, T.; Kiziltas, H. Photocatalytic degradation kinetics of Orange G dye over ZnO and Ag/ZnO thin film catalysts. Sci. Rep. 2019, 9, 1–7. [Google Scholar] [CrossRef]
  19. Guzmán, I.C.; Rodríguez, J.L.; Poznyak, T.; Chairez, I.; Hernández, I.; Hernández, R.T. Catalytic ozonation of 4-chlorophenol and 4-phenolsulfonic acid by CeO2 films. Catal. Commun. 2020, 133, 105827. [Google Scholar] [CrossRef]
  20. Muir, D.; Simmons, D.; Wang, X.; Peart, T.; Villella, M.; Miller, J.; Sherry, J. Bioaccumulation of pharmaceuticals and personal care product chemicals in fish exposed to wastewater effluent in an urban wetland. Sci. Rep. 2017, 7, 16999. [Google Scholar] [CrossRef]
  21. Arnold, K.E.; Brown, A.R.; Ankley, G.T.; Sumpter, J.P. Medicating the environment: Assessing risks of pharmaceuticals to wildlife and ecosystems. Philos. Trans. R. Soc. Biol. Sci. 2014, 369, 20130569. [Google Scholar] [CrossRef] [Green Version]
  22. Emmanuel, E.; Perrodin, Y.; Keck, G.; Blanchard, J.M.; Vermande, P. Ecotoxicological risk assessment of hospital wastewater: A proposed framework for raw effluents discharging into urban sewer network. J. Hazard. Mater. 2005, 117, 1–11. [Google Scholar] [CrossRef]
  23. Wojcieszyńska, D.; Guzik, U. Naproxen in the environment: Its occurrence, toxicity to nontarget organisms and biodegradation. Appl. Microbiol. Biotechnol. 2020, 104, 1849–1857. [Google Scholar] [CrossRef] [Green Version]
  24. Domaradzka, D.; Guzik, U.; Wojcieszyńska, D. Biodegradation and biotransformation of polycyclic non-steroidal anti-inflammatory drugs. Rev. Environ. Sci. Biotechnol. 2015, 14, 229–239. [Google Scholar] [CrossRef] [Green Version]
  25. Li, Z.; Liu, G.; Su, Q.; Lv, C.; Jin, X.; Wen, X. UV-Induced Photodegradation of Naproxen Using a Nano γ-FeOOH Composite: Degradation Kinetics and Photocatalytic Mechanism. Front. Chem. 2019, 7. [Google Scholar] [CrossRef] [Green Version]
  26. Ray, S.K.; Dhakal, D.; Lee, S.W. Rapid degradation of naproxen by AgBr-α-NiMoO4 composite photocatalyst in visible light: Mechanism and pathways. Chem. Eng. J. 2018, 347, 836–848. [Google Scholar] [CrossRef]
  27. Arany, E.; Szabó, R.K.; Apáti, L.; Alapi, T.; Ilisz, I.; Mazellier, P.; Dombi, A.; Gajda-Schrantz, K. Degradation of naproxen by UV, VUV photolysis and their combination. J. Hazard. Mater. 2013, 262, 151–157. [Google Scholar] [CrossRef]
  28. Liu, Y.; Tang, Y.; Wu, Y.; Feng, L.; Zhang, L. Degradation of naproxen in chlorination and UV/chlorine processes: Kinetics and degradation products. Environ. Sci. Pollut. Res. Int. 2019, 26, 34301–34310. [Google Scholar] [CrossRef]
  29. Karaca, M.; Kıranşan, M.; Karaca, S.; Khataee, A.; Karimi, A. Sonocatalytic removal of naproxen by synthesized zinc oxide nanoparticles on montmorillonite. Ultrason. Sonochemistry 2016, 31, 250–256. [Google Scholar] [CrossRef]
  30. Tizhoosh, N.Y.; Khataee, A.; Hassandoost, R.; Soltani, R.D.C.; Doustkhah, E. Ultrasound-engineered synthesis of WS2@ CeO2 heterostructure for sonocatalytic degradation of tylosin. Ultrason. Sonochemistry 2020, 67, 105114. [Google Scholar] [CrossRef]
  31. Dulova, N.; Kattel, E.; Trapido, M. Degradation of naproxen by ferrous ion-activated hydrogen peroxide, persulfate and combined hydrogen peroxide/persulfate processes: The effect of citric acid addition. Chem. Eng. J. 2017, 318, 254–263. [Google Scholar] [CrossRef]
  32. van Kollenburg, G.H.; van Es, J.; Gerreten, J.; Lanters, H.; Bouman, R.; Koelewijn, W.; Davies, A.N.; Buydens, L.; van Manen, H.J.; Jansen, J.J. Understanding Chemical Production Processes by using PLS Path Model Parameters as Soft Sensors. Comput. Chem. Eng. 2020, 139, 106841. [Google Scholar] [CrossRef]
  33. Rosal, R.; Rodríguez, A.; Gonzalo, M.; García-Calvo, E. Catalytic ozonation of naproxen and carbamazepine on titanium dioxide. Appl. Catal. Environ. 2008, 84, 48–57. [Google Scholar] [CrossRef]
  34. Patil, V.P.; Pawar, S.; Chougule, M.; Godse, P.; Sakhare, R.; Sen, S.; Joshi, P. Effect of Annealing on Structural, Morphological, Electrical and Optical Studies of Nickel Oxide Thin Films. J. Surf. Eng. Mater. Adv. Technol. 2011, 1, 720–726. [Google Scholar] [CrossRef] [Green Version]
  35. Lin, S.H.; Chen, F.R.; Kai, J.J. Electrochromic properties of nano-composite nickel oxide film. Appl. Surf. Sci. 2008, 254, 3357–3363. [Google Scholar] [CrossRef]
  36. Kanakaraju, D.; Motti, C.A.; Glass, B.D.; Oelgemöller, M. TiO2 photocatalysis of naproxen: Effect of the water matrix, anions and diclofenac on degradation rates. Chemosphere 2015, 139, 579–588. [Google Scholar] [CrossRef]
  37. Mohamed, A.; Salama, A.; Nasser, W.S.; Uheida, A. Photodegradation of Ibuprofen, Cetirizine, and Naproxen by PAN-MWCNT/TiO2-NH2 nanofiber membrane under UV light irradiation. Environ. Sci. Eur. 2018, 30, 47. [Google Scholar] [CrossRef]
  38. Aguilar, C.M.; Chairez, I.; Rodríguez, J.L.; Tiznado, H.; Santillán, R.; Arrieta, D.; Poznyak, T. Inhibition effect of ethanol in naproxen degradation by catalytic ozonation with NiO. RSC Adv. 2019, 9, 14822–14833. [Google Scholar] [CrossRef] [Green Version]
  39. Magallanes, D.; Rodríguez, J.L.; Poznyak, T.; Valenzuela, M.A.; Lartundo, L.; Chairez, I. Efficient mineralization of benzoic and phthalic acids in water by catalytic ozonation using a nickel oxide catalyst. New J. Chem. 2015, 39, 7839–7848. [Google Scholar] [CrossRef]
  40. Fuentes, I.; Rodriguez, J.L.; Tiznado, H.; Romo-Herrera, J.M.; Chairez, I.; Poznyak, T. Terephthalic acid decomposition by photocatalytic ozonation with VxOy/ZnO under different UV-A LEDs distributions. Chem. Eng. Commun. 2020, 207, 263–277. [Google Scholar] [CrossRef]
  41. Patel, S.; Majumder, S.K.; Das, P.; Ghosh, P. Ozone microbubble-aided intensification of degradation of naproxen in a plant prototype. J. Environ. Chem. Eng. 2019, 7, 103102. [Google Scholar] [CrossRef]
  42. Liu, J.; Ke, L.; Liu, J.; Sun, L.; Yuan, X.; Li, Y.; Xia, D. Enhanced catalytic ozonation towards oxalic acid degradation over novel copper doped manganese oxide octahedral molecular sieves nanorods. J. Hazard. Mater. 2019, 371, 42–52. [Google Scholar] [CrossRef] [PubMed]
  43. Huang, Y.; Sun, Y.; Xu, Z.; Luo, M.; Zhu, C.; Li, L. Removal of aqueous oxalic acid by heterogeneous catalytic ozonation with MnOx/sewage sludge-derived activated carbon as catalysts. Sci. Total Environ. 2017, 575, 50–57. [Google Scholar] [CrossRef] [PubMed]
  44. Jallouli, N.; Elghniji, K.; Hentati, O.; Ribeiro, A.R.; Silva, A.M.; Ksibi, M. UV and solar photo-degradation of naproxen: TiO2 catalyst effect, reaction kinetics, products identification and toxicity assessment. J. Hazard. Mater. 2016, 304, 329–336. [Google Scholar] [CrossRef]
  45. Wu, K.; Zhang, F.; Wu, H.; Wei, C. The mineralization of oxalic acid and bio-treated coking wastewater by catalytic ozonation using nickel oxide. Environ. Sci. Pollut. Res. 2018, 25, 2389–2400. [Google Scholar] [CrossRef]
  46. Zhang, X.; Zou, Y.; Li, S.; Xu, S. A weighted auto regressive LSTM based approach for chemical processes modeling. Neurocomputing 2019, 367, 64–74. [Google Scholar] [CrossRef]
  47. Salgado, I.; Chairez, I.; Bandyopadhyay, B.; Fridman, L.; Camacho, O. Discrete-time non-linear state observer based on a super twisting-like algorithm. IET Control Theory Appl. 2014, 8, 803–812. [Google Scholar] [CrossRef]
  48. Levant, A. Robust exact differentiation via sliding mode technique. Automatica 1998, 34, 379–384. [Google Scholar] [CrossRef]
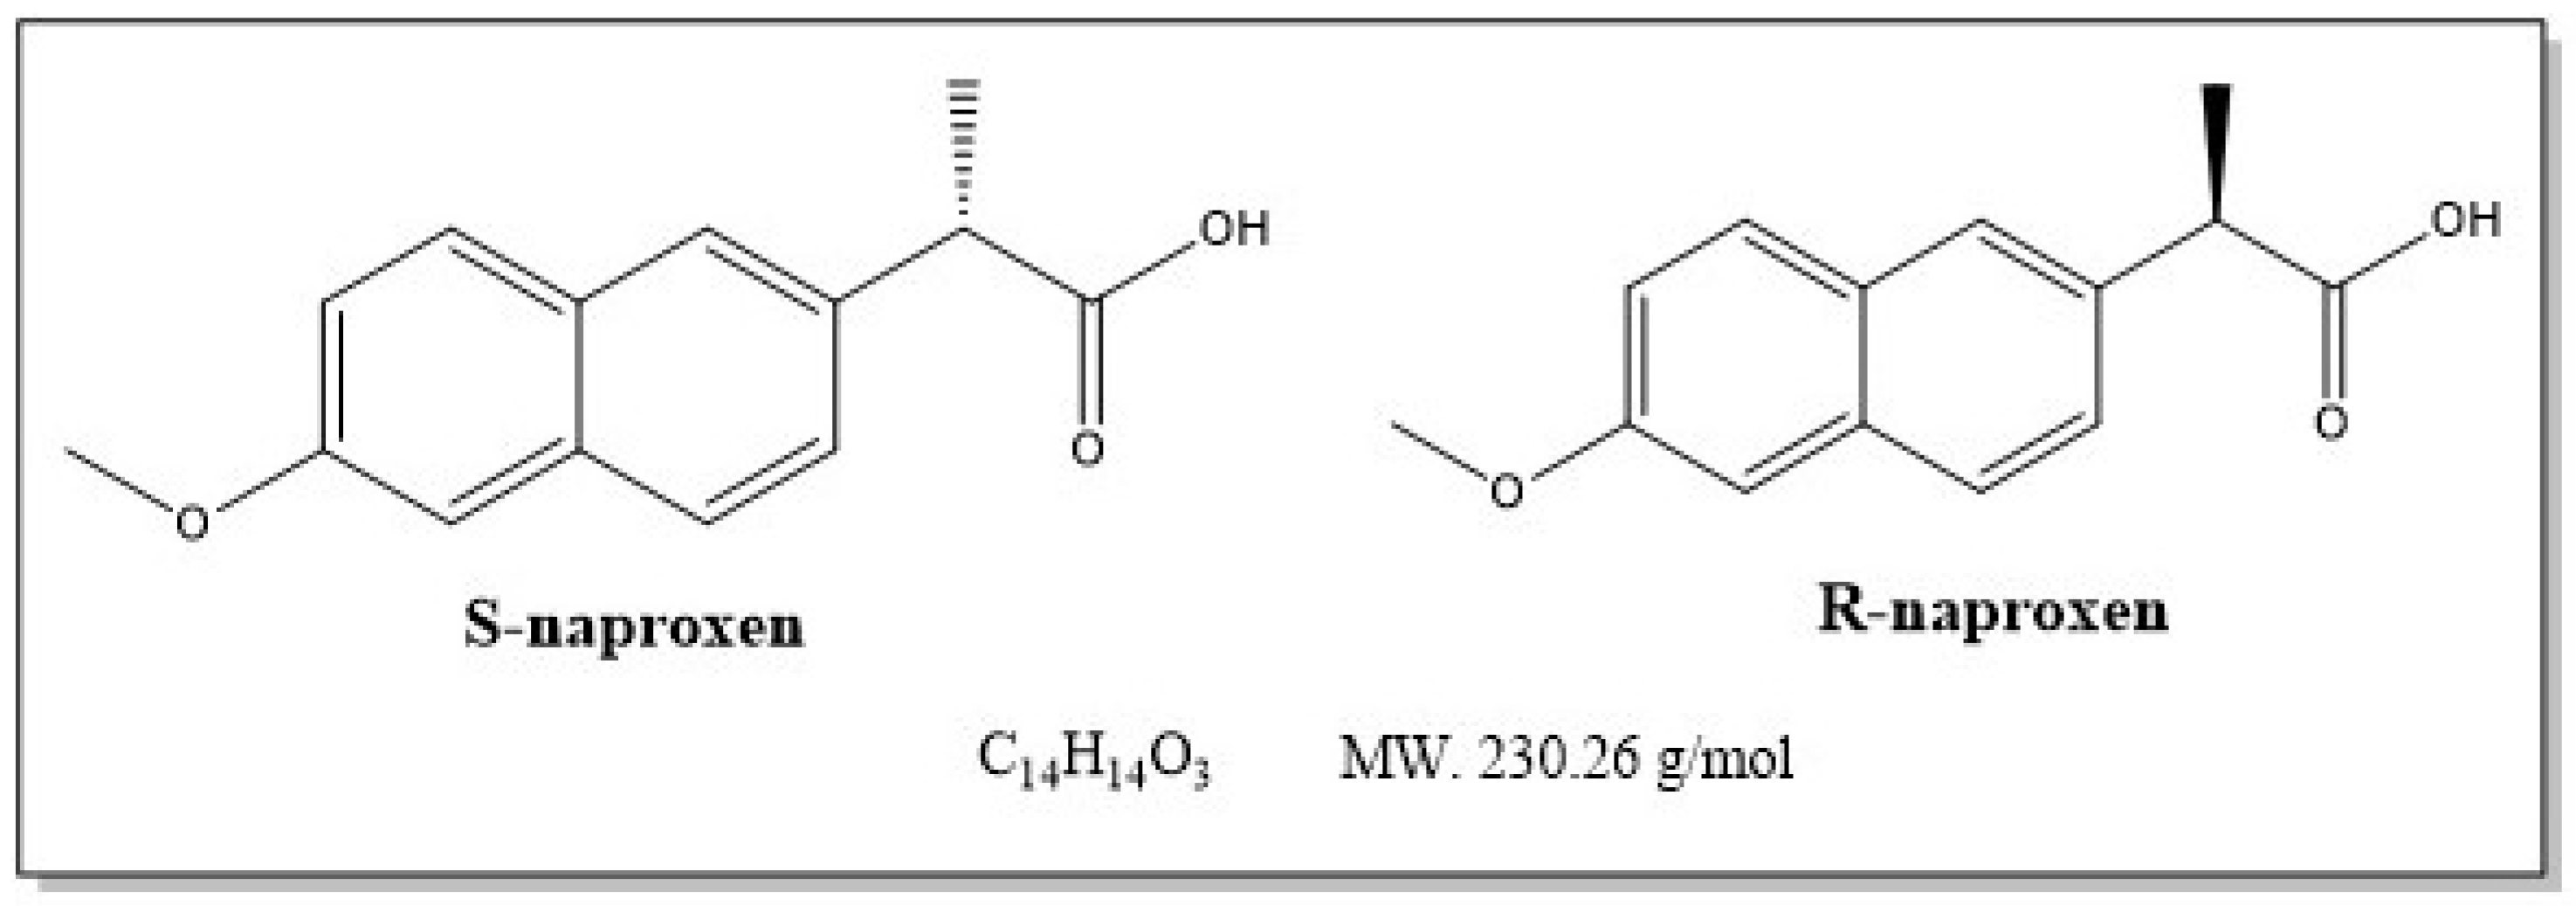
Figure 1. Chemical structures of Naproxen isomers.
Catalysts 10 00884 g001
Figure 2. X-ray diffraction XRD patterns of N i O ( S ) , O 3 - N i O ( F ) and N i O ( F ) .
Catalysts 10 00884 g002
Figure 3. SEM images of N i O ( F ) before and after ozonation (60 min of treatment). Insert Figure 2a presents the cross-sectional image of the N i O ( F ) : (a) N i O ( F ) , (b) O 3 - N i O ( F ) .
Catalysts 10 00884 g003
Figure 4. AFM images of N i O F before and after ozonation (60 min of ozonation): (a) N i O ( F ) . (b) O3- N i O ( F ) .
Catalysts 10 00884 g004
Figure 5. XPS patterns of N i O ( F ) , N i O ( S ) and O 3 - N i O ( F ) . (a) Ni2p and (b) O1s regions.
Catalysts 10 00884 g005
Figure 6. NP [20 mg/L] degradation (a) and oxalic acid concentration (b) generated by O 3 -conv, O 3 - N i O ( S ) (100 mg/L) and O 3 - N i O ( F ) . [ O 3 ] = 5.5 ± 0.5 mg/L, flow ( O 3 O 2 ) = 0.5 L/min.
Catalysts 10 00884 g006
Figure 7. Unidentified compound (12.9 min time retention HPLC) during the NP degradation with conventional and catalytic systems.
Catalysts 10 00884 g007
Figure 8. TOC removal (%) in conventional and catalytic ozonation and the effect of reusing films during three cycles with 10 films of NiO.
Catalysts 10 00884 g008
Figure 9. Time evolution corresponding to the variables of the mathematical model and kinetic constant of NP degradation by ozonation. In all the figures the blue circles represent the data obtained by HPLC, the continuous black line represents the interpolated data and the red dotted line describes the model approximation. The second row of graphs depicts the process of kinetic constant estimation based on the STA method: (a) O 3 -conv. (b) O 3 - N i O ( S ) . (c) O 3 - N i O ( P ) .
Catalysts 10 00884 g009
Table 1. Reaction rate constants for the NP degradation by conventional and catalytic ozonations.
Parameter O 3 -conv O 3 - N i O ( S ) O 3 - N i O ( F )
k NP , [min−1]0.66050.69140.6784