Article

Comparison of Ag and AgI-Modified ZnO as Heterogeneous Photocatalysts for Simulated Sunlight Driven Photodegradation of Metronidazole

Shanghai Institute of Pollution Control and Ecological Security, Key Laboratory of Yangtze River Water Environment Ministry of Education, College of Environmental Science and Engineering, Tongji University, Shanghai 200092, China
*
Authors to whom correspondence should be addressed.
Catalysts 2020, 10(9), 1097; https://doi.org/10.3390/catal10091097
Submission received: 10 August 2020 / Revised: 7 September 2020 / Accepted: 13 September 2020 / Published: 22 September 2020

Abstract

:
Ag and AgI-modified ZnO composites (Ag/ZnO and AgI/ZnO) were synthesized in facile ways. The photocatalysts were used for the photodegradation of metronidazole (MNZ) under the irradiation of simulated sunlight. The results of experiments showed that both Ag/ZnO and AgI/ZnO had a specific molar ratio to reach the best performance. Ag/ZnO performed better in the photodegradation of MNZ than AgI/ZnO under the same conditions. The reaction rate constant of AgI/ZnO was less affected by the variation of initial concentration of MNZ or pH values. The main reactive oxygen species of the photocatalytic process are OH, O2 and h+, but the free radicals which play the most critical part differ in Ag/ZnO and AgI/ZnO. Several intermediates were revealed by LC–MS/MS analysis. The stability of the photocatalysts was evaluated by a series of repeated MNZ photodegradation experiments. The results showed that AgI/ZnO had better stability than Ag/ZnO.

1. Introduction

Metronidazole (MNZ) has been widely used as a typical antiprotozoal and antibacterial drug in recent years. It has the potential ability to inhibit the growth of the anaerobic bacteria [1,2]. Residues of MNZ in the environment could cause animal-derived food contamination [3]. In addition, with its neural toxicity, MNZ has the potential to harm human body [4]. It was reported that the maximum concentration of MNZ was at 9400 ng/L and 127 ng/L, respectively in hospital wastewater [5] and the wastewater treatment plants [6]. As a persistent pollutant, MNZ cannot be easily eliminated by the traditional water treatment processes [7,8]. This may lead to a potential MNZ accumulation in the water environment [9,10].
Plenty of research has been conducted [11,12,13,14,15,16,17] to study the removal of MNZ in water environment. Among them, photocatalysis has attracted much interest due to its eco-friendly property of utilizing solar energy. CuBi2O4/CuO heterojunctions [18], UV/TiO2 [19], Ag-doped ZnO [20], Fe2TiO5 [21], etc. are some recent studies which are based on the photodegradation of MNZ. As an alternative of well-applied photocatalyst TiO2, zinc oxide (ZnO) has drawn much attention owing to its extraordinary properties of low cost, innocuity, appropriate bandgap energy and exciton binding energy [22,23]. In some studies, ZnO exhibited even more photoactivity than TiO2 for the photodegradation of organics [24]. However, the photocatalytic capability of ZnO is restricted since the recombination of photoelectron–hole pairs and relatively low quantum efficiency [25]. One of the most effective methods to compensate for the defects of ZnO in photocatalysis is the modification with silver (Ag) or silver halide (AgX, X = Cl, Br, I). Ag nanoparticles have strong absorption of the visible light, narrow bandgap and can improve electron transport [26]. When incorporated with semiconductor materials, Ag nanoparticles can perform functional abilities of promotion of interfacial charge–transfer, due to its high Schottky barrier at the semiconductor interface [27,28,29]. Meanwhile, as photosensitive materials, silver halides absorb photons and generate electron–hole pairs [30]. Comparing with AgCl and AgBr, AgI has a smaller band gap [31]. Thus, AgI may have more excellent application prospects in photocatalysis. To date, as we know, there have already been plenty of studies that utilize Ag, AgI and ZnO composite materials to eliminate micropollutants in water, most target compounds of the studies are chosen to be dyes [32,33,34,35] and phenol [23,35,36], etc. However, few have focused on the degradation of refractory antibiotics, such as MNZ. By conducting several MNZ photodegradation experiments under simulated sunlight, the aim of this research is to compare the differences between the photocatalytic performance of Ag/ZnO and AgI/ZnO composites as catalysts. To take a step further, the structural distinction of the two composites were investigated and the different reaction mechanism which led to the differences of photocatalytic performances was discussed and illustrated. Finally, a possible degradation pathway of MNZ was proposed on the basis of LC–MS/MS results.

2. Results and Discussion

2.1. Structure and Composition of Ag and AgI-Modified ZnO Photocatalysts

2.1.1. XRD

The XRD results of Ag/ZnO and AgI/ZnO photocatalysts are shown in Figure 1. In both patterns, ZnO displays strong characteristic diffraction peaks at 31.75°, 34.40°, 36.24°, 47.52°, 56.57°, 62.83°, 67.90°, which match to the (100), (002), (101), (102), (110), (103) and (112) planes of the crystalline structure of ZnO, respectively. Among these, (100), (002) and (101) planes are the Wurtzite structure of ZnO (JCPDS NO. 36-1451) [37]. As shown in Figure 1a, diffraction peaks at 38.05°, 44.26° and 64.43°, referring to the (111), (200) and (220) planes of Ag, respectively. These planes match the standard Ag pattern (JCPDS NO. 04-0783) [37]. On the other hand, in Figure 1b, diffraction peaks at 22.39°, 23.71°, 25.31°, 39.20°, 43.45°, 46.33° are corresponding to the (100), (002), (101), (110), (103) and (112) planes of the hexagonal β-AgI phase (JCPDS No. 09-0374) [30]. Moreover, there are neither other impure phases nor changes of all diffraction peaks observed in both graphs, suggesting that the materials have high crystallinity and good crystal form.

2.1.2. XPS

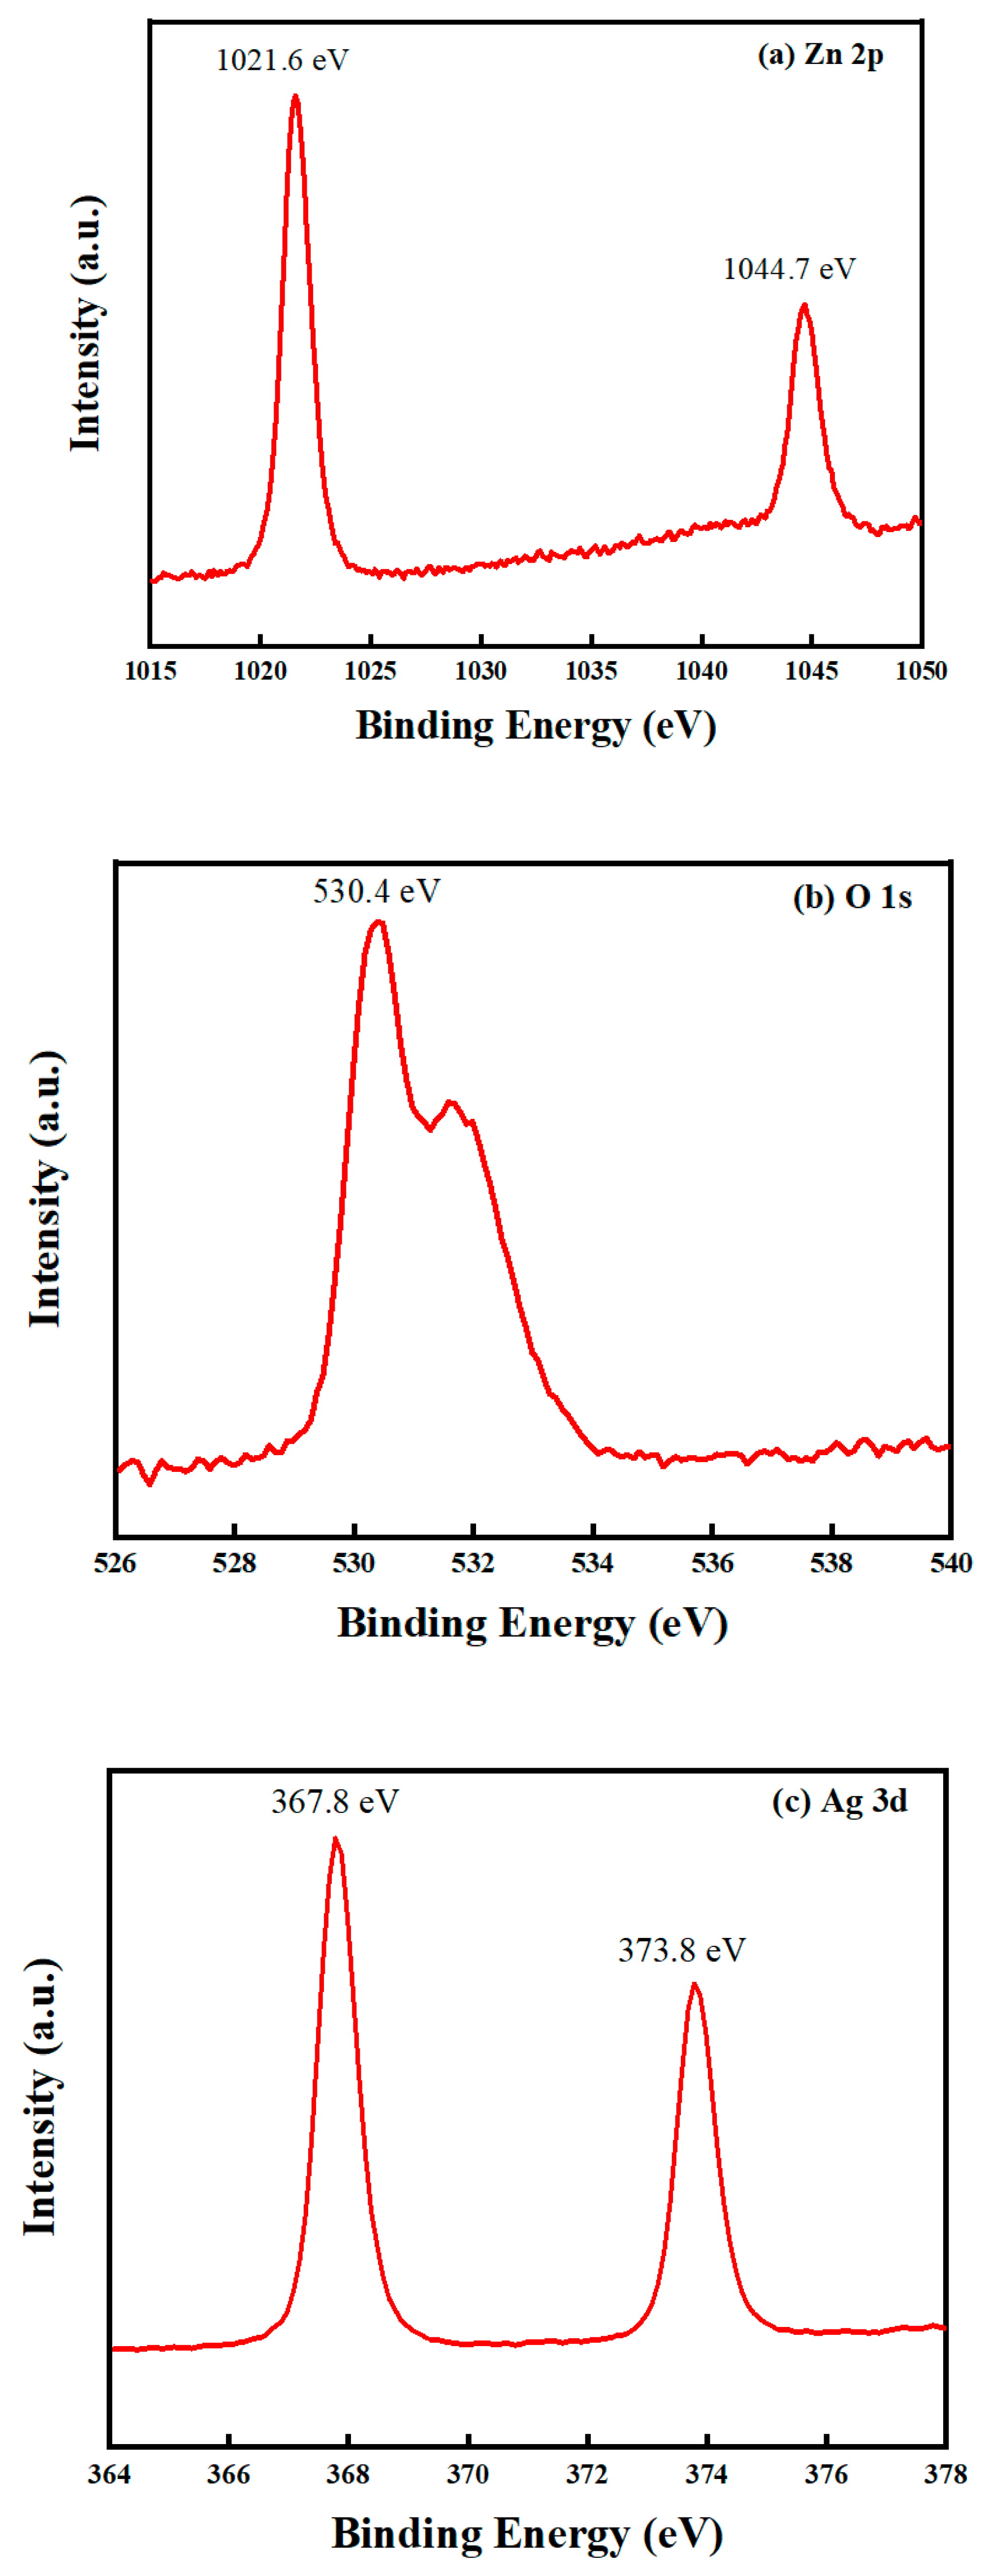
In order to verify the chemical composition and elemental valent state of the photocatalysts Ag/ZnO and AgI/ZnO, XPS was performed; the results are shown in Figure 2 and Figure 3. Figure 2a and Figure 3a are the Zn 2p spectra, the two peaks are located at 1041.3 and 1018.2 eV, 1044.7 and 1021.6 eV, respectively. These results all refer to Zn 2p1/2 and Zn 2p3/2, indicating that the form of Zn is Zn2+ [38]. Figure 2b and Figure 3b are the O 1s spectra, the feature peaks are 526.9 eV and 530.4 eV, which are related to the lattice oxygen of nanocomposite (the bond of Zn–O). Figure 2c is the spectrum of Ag 3d of Ag in Ag/ZnO, the two peaks are at 370.1 eV and 364.1 eV, with a gap of 6.0 eV, which is assigned to the metallic Ag0 species [39]. Figure 3c shows the spectrum of Ag 3d and the two peaks are located at 373.8 eV and 367.8 eV, which should be attributed to Ag 3d5/2 and Ag 3d3/2, belonging to Ag+ [40]. Figure 3d is the I 3d spectrum, the two peaks at the binding energy of 630.6 eV and 619.1 eV refer to I 3d5/2 and I 3d3/2 of I [41]. Consequently, all these results confirm the heterojunction structure of Ag/ZnO and AgI/ZnO.

2.2. Optical Properties of Ag and AgI-Modified ZnO Photocatalysts

2.2.1. UV-Vis Diffuse Reflectance Spectra

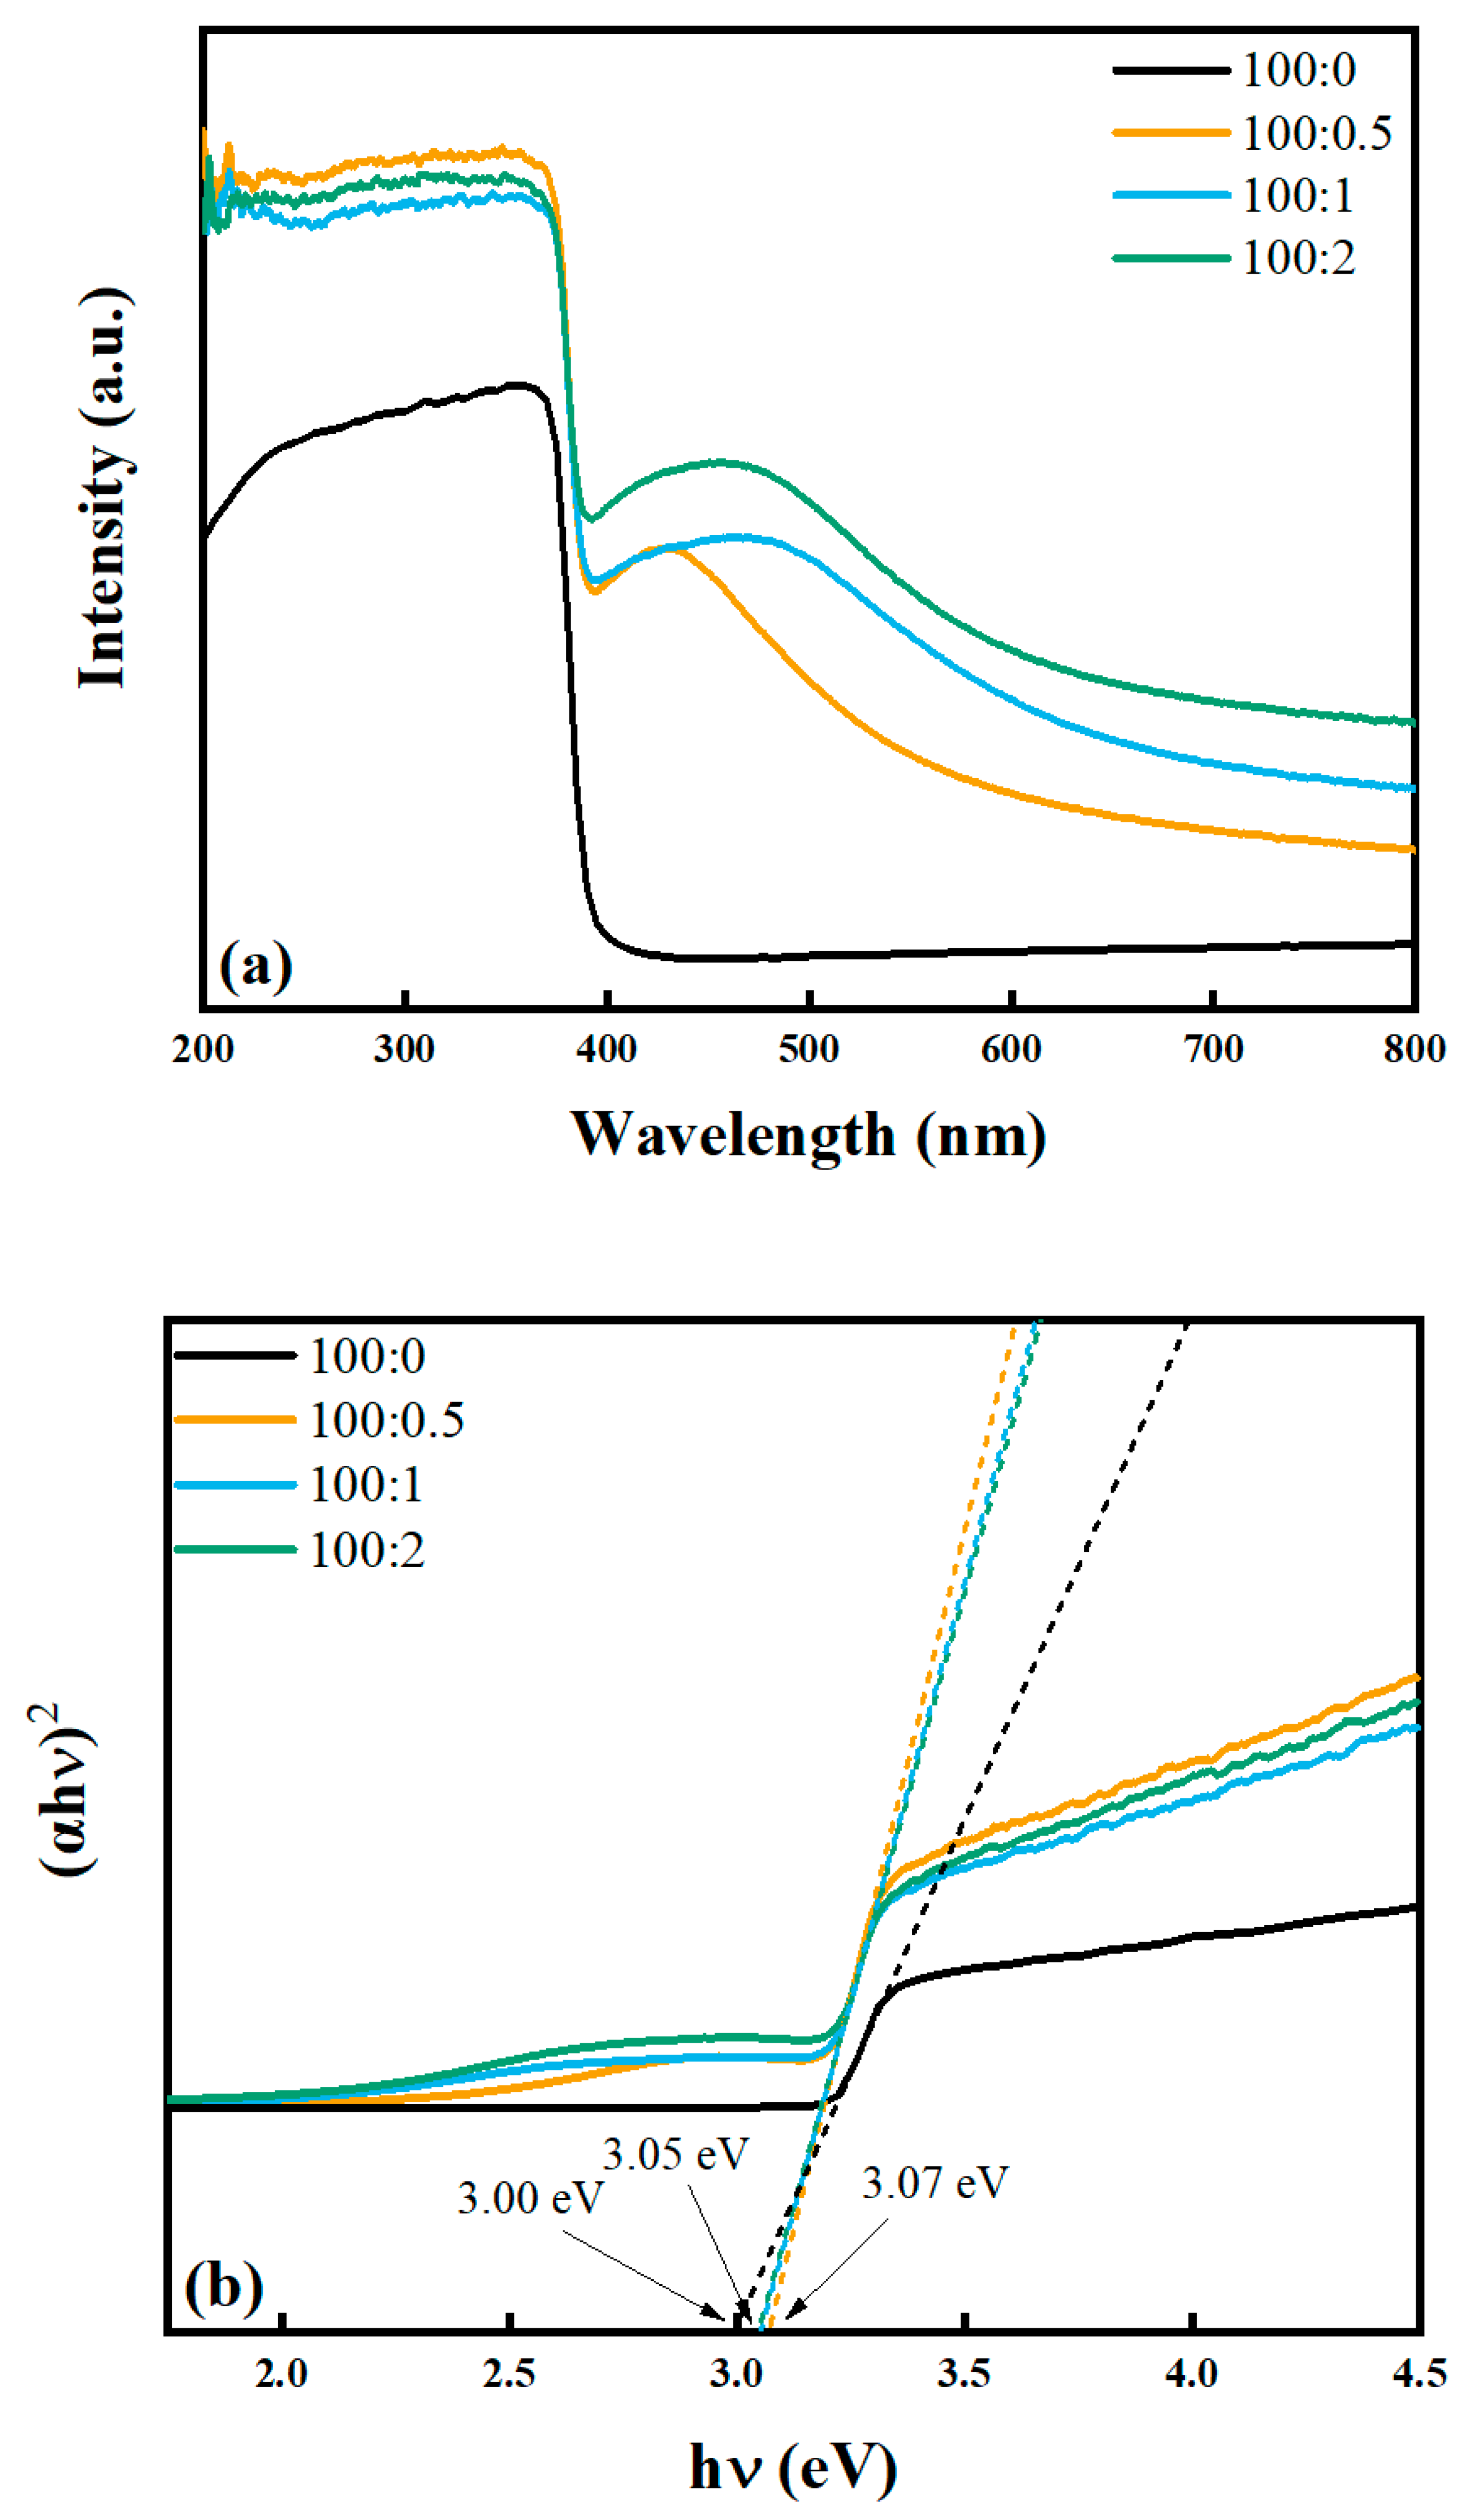
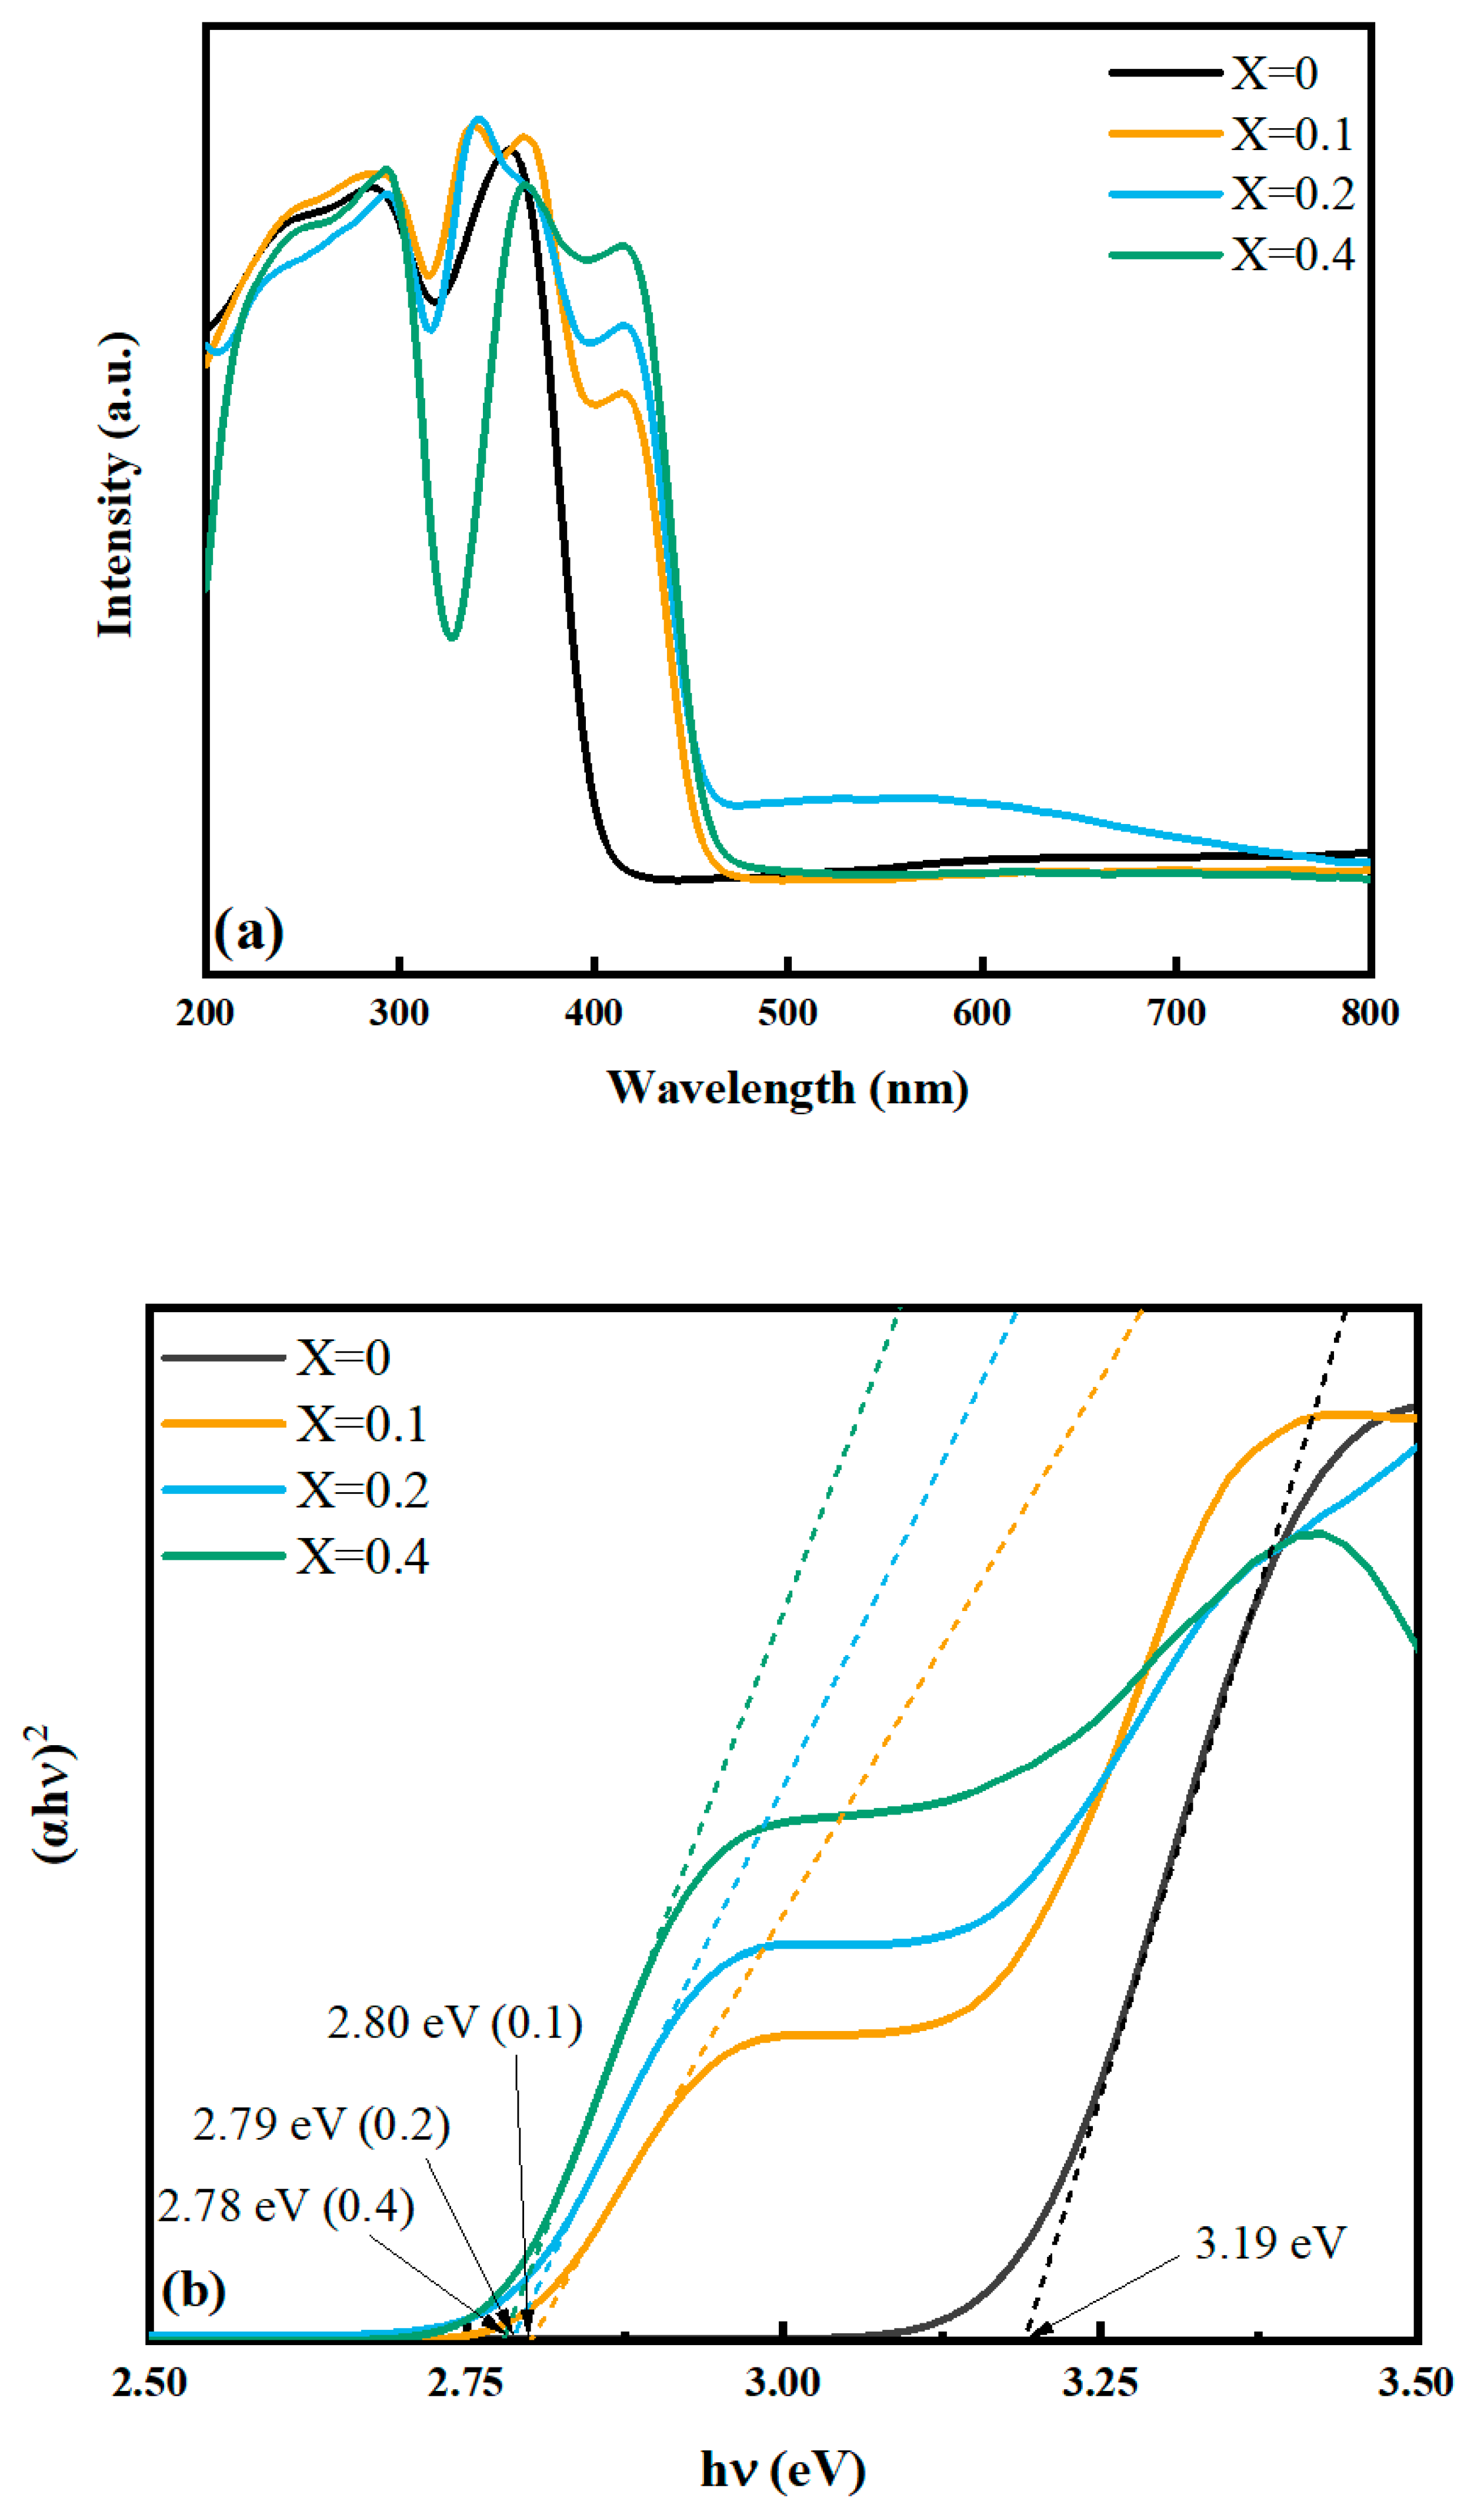
Figure 4 and Figure 5 show the UV-vis DRS spectra and (αhν)2 versus energy (hν) plots of the photocatalysts. All photocatalysts show significant absorption in the UV range. This is due to ZnO’s properties as a semiconductor [42]. The absorption edge of pure ZnO is around 400 nm. After being modified with silver, the catalysts’ absorption range expands significantly to the visible light region, with the edge of approximately 500 nm. This could be attributed to the surface plasma absorption of Ag [43]. The red shift of the resonance peak occurs more obviously when the size of the nanoparticles gets larger, so the absorption peak of Ag/ZnO (100:1) at 450 nm is due to the SPR effect of Ag particles with the size at around 14 nm (related data are shown in TEM images). When being modified with AgI, the catalysts have border light absorption in the visible light region than bare ZnO, and the absorption edge is at about 415 nm. Moreover, as the contents of Ag and AgI increase, the light absorption in the visible light area also increases.
In order to determine the band gap energy of the photocatalysts, based on the Kubelka–Munk function, the relationship of (αhν)2 and (hν) was plotted and shown in Figure 4b and Figure 5b. The results show that the band gaps of ZnO in the two photocatalysts are 3.00 eV and 3.19 eV, respectively. This can be classified as the near monodispersed ZnO microrods, which is consistent with the previous literature [44]. The band gaps of Ag/ZnO (100:0.5, 100:1, 100:2) and AgI/ZnO (X = 0.1, 0.2, 0.4) are 3.07 eV, 3.05 eV, 3.05 eV and 2.80 eV, 2.79 eV, 2.78 eV, respectively. The results show that Ag has little effects on the band gap of ZnO. However, with the deposition of AgI, the band gaps of composites become smaller, indicating the modification of ZnO by AgI can enhance the light absorption, so that photocatalysts can produce electron–hole pairs more effectively, the recombination of photoelectron and hole is inhibited. In addition, there are clearly two steps at the curves of AgI/ZnO in Figure 5b, the curves at around 2.80 eV and 3.10 eV are attributed to AgI and ZnO in the composites, respectively, since the band gap values are typical for AgI and ZnO.

2.2.2. PL Spectra

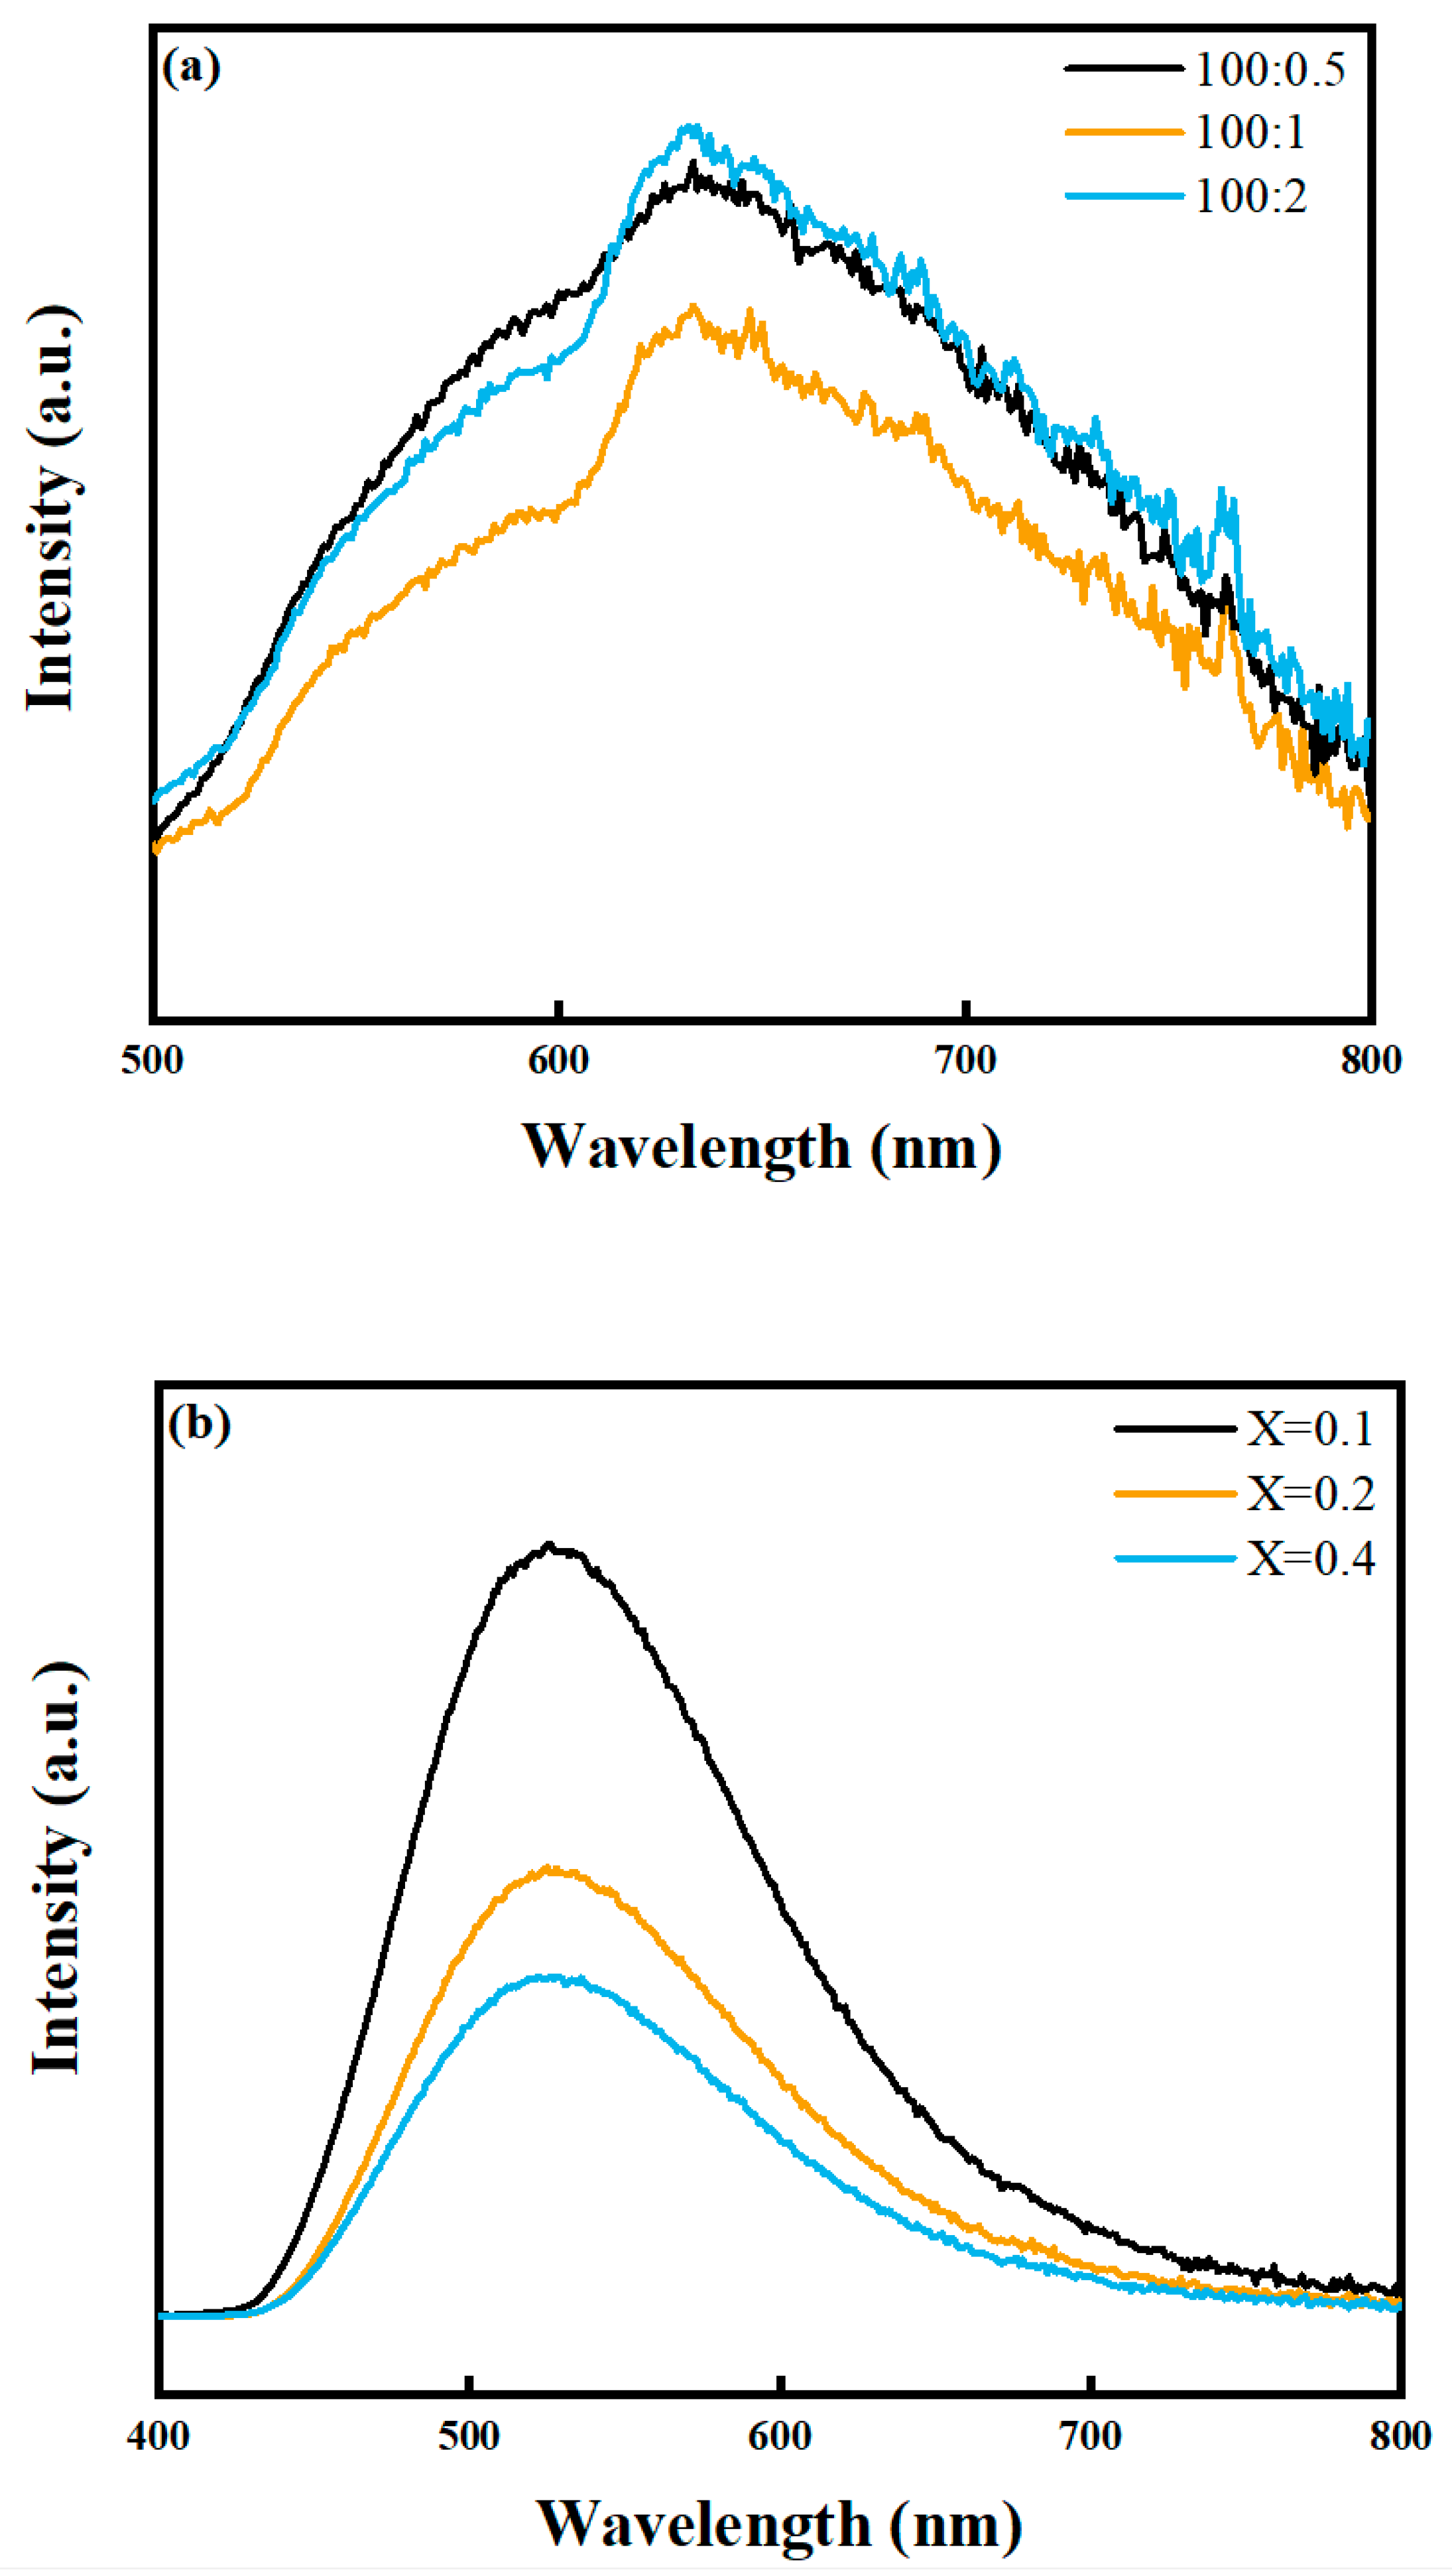
PL spectra can reveal the generation, migration and recombination processes of photoelectron–hole pairs. The results are illustrated in Figure 6. Due to the recombination of photoelectron–hole pairs, the decrease of the intensity of PL spectra commonly indicates the increase of catalytic performance. As displayed in Figure 6a, Ag/ZnO (100:1) shows the minimum PL intensity; but for Ag/ZnO (100:0.5) and Ag/ZnO (100:2), PL intensity is mostly the same. PL intensity depends on the Ag concentration. With appropriate amount of Ag content, more metal sites that accept electrons can be formed under light excitation, leading to the enhancement of separation effects of the photoelectron–hole pairs [45]. Thus, the PL intensity decreases. However, with much higher silver concentration, the nanoparticles tend to aggregate and form clusters, eventually cover the surface of ZnO. This process may hinder the heterojunction structure from utilizing light energy and reduce the transportation of electron [46], thus the PL intensity rises. For AgI/ZnO, as displayed in Figure 6b, in the range of 200–800 nm, PL intensity decreases with the increase of silver content. Indicating that the presence of AgI quenches PL intensity, since the electron transfer becomes more efficient on the surface of the heterojunction as the content of AgI increases.

2.3. Morphology of Ag and AgI-Modified ZnO Photocatalysts

2.3.1. TEM

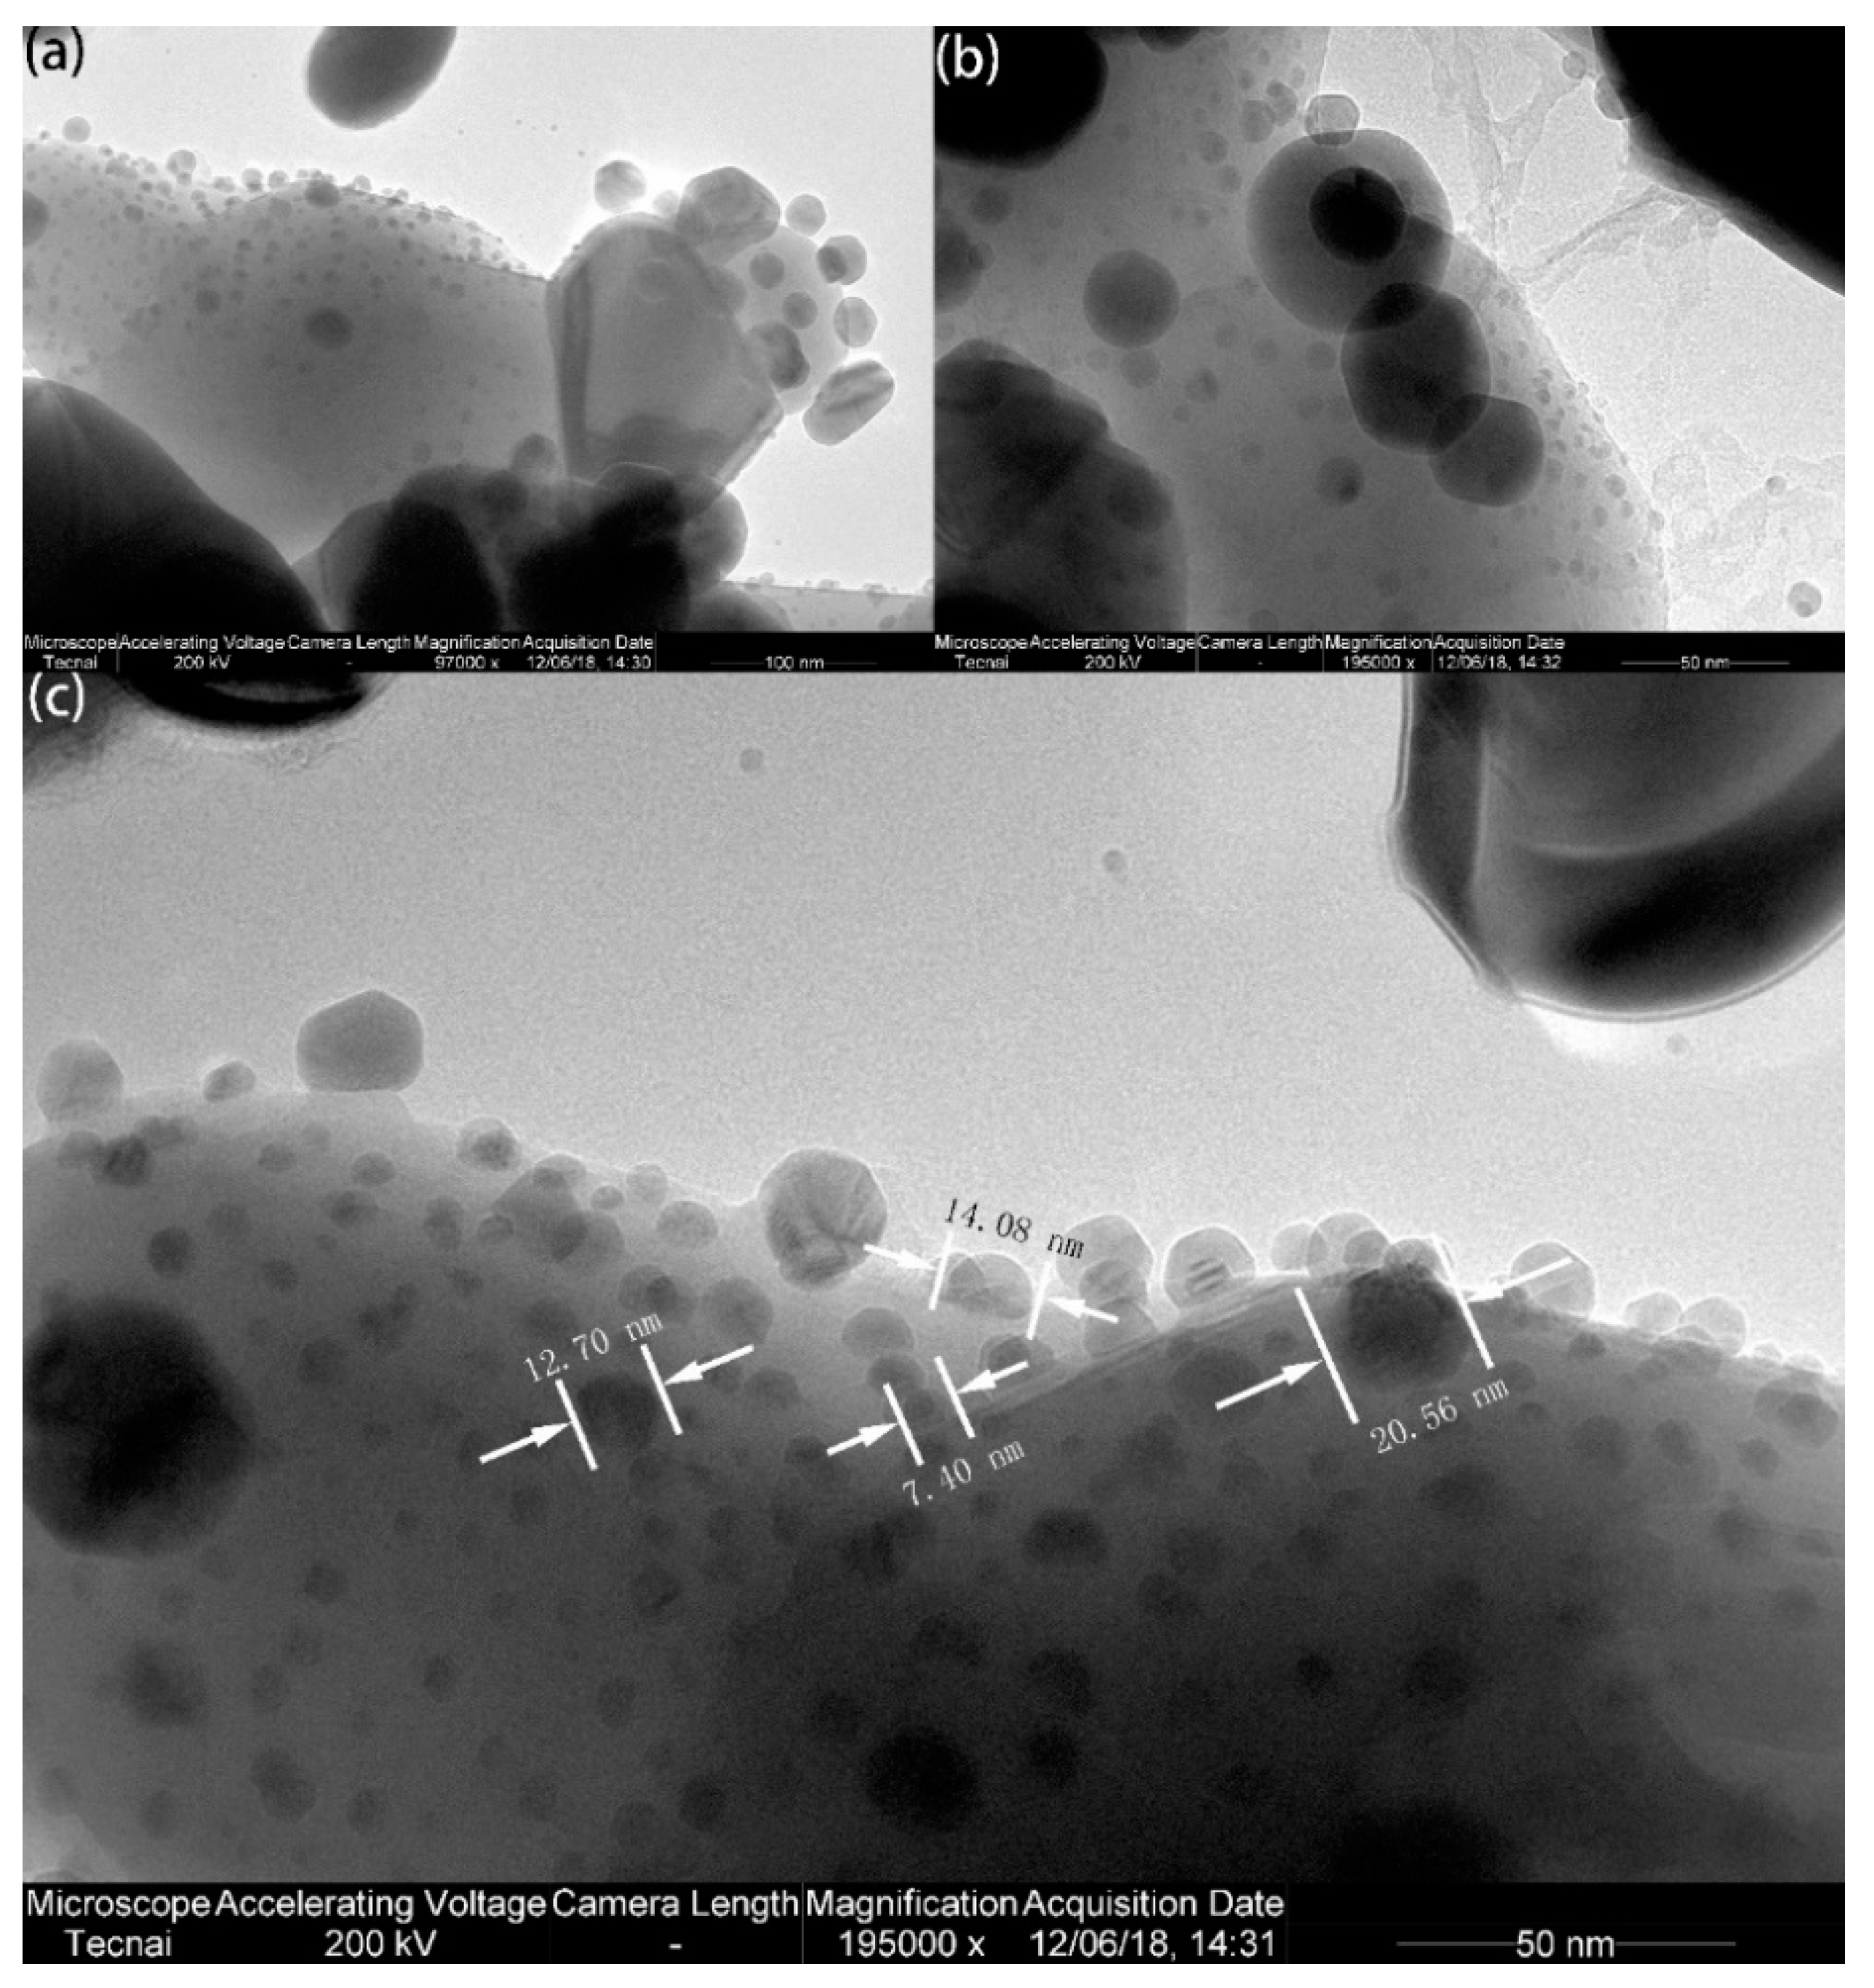
The surface morphology and structure of the composites was observed by TEM and SEM. As shown in Figure 7, ZnO remains in good shape after Ag deposition. The dark-colored dots on the surface of ZnO in the images refer to Ag particles. Figure 8 shows that AgI particles are distributed on ZnO surfaces uniformly. The particle size of Ag and AgI were also determined. As shown in Figure 7c and Figure 8c, the average size of the as-selected Ag and AgI particles are 13.63 nm and 13.69 nm, respectively.

2.3.2. SEM and EDS Mapping

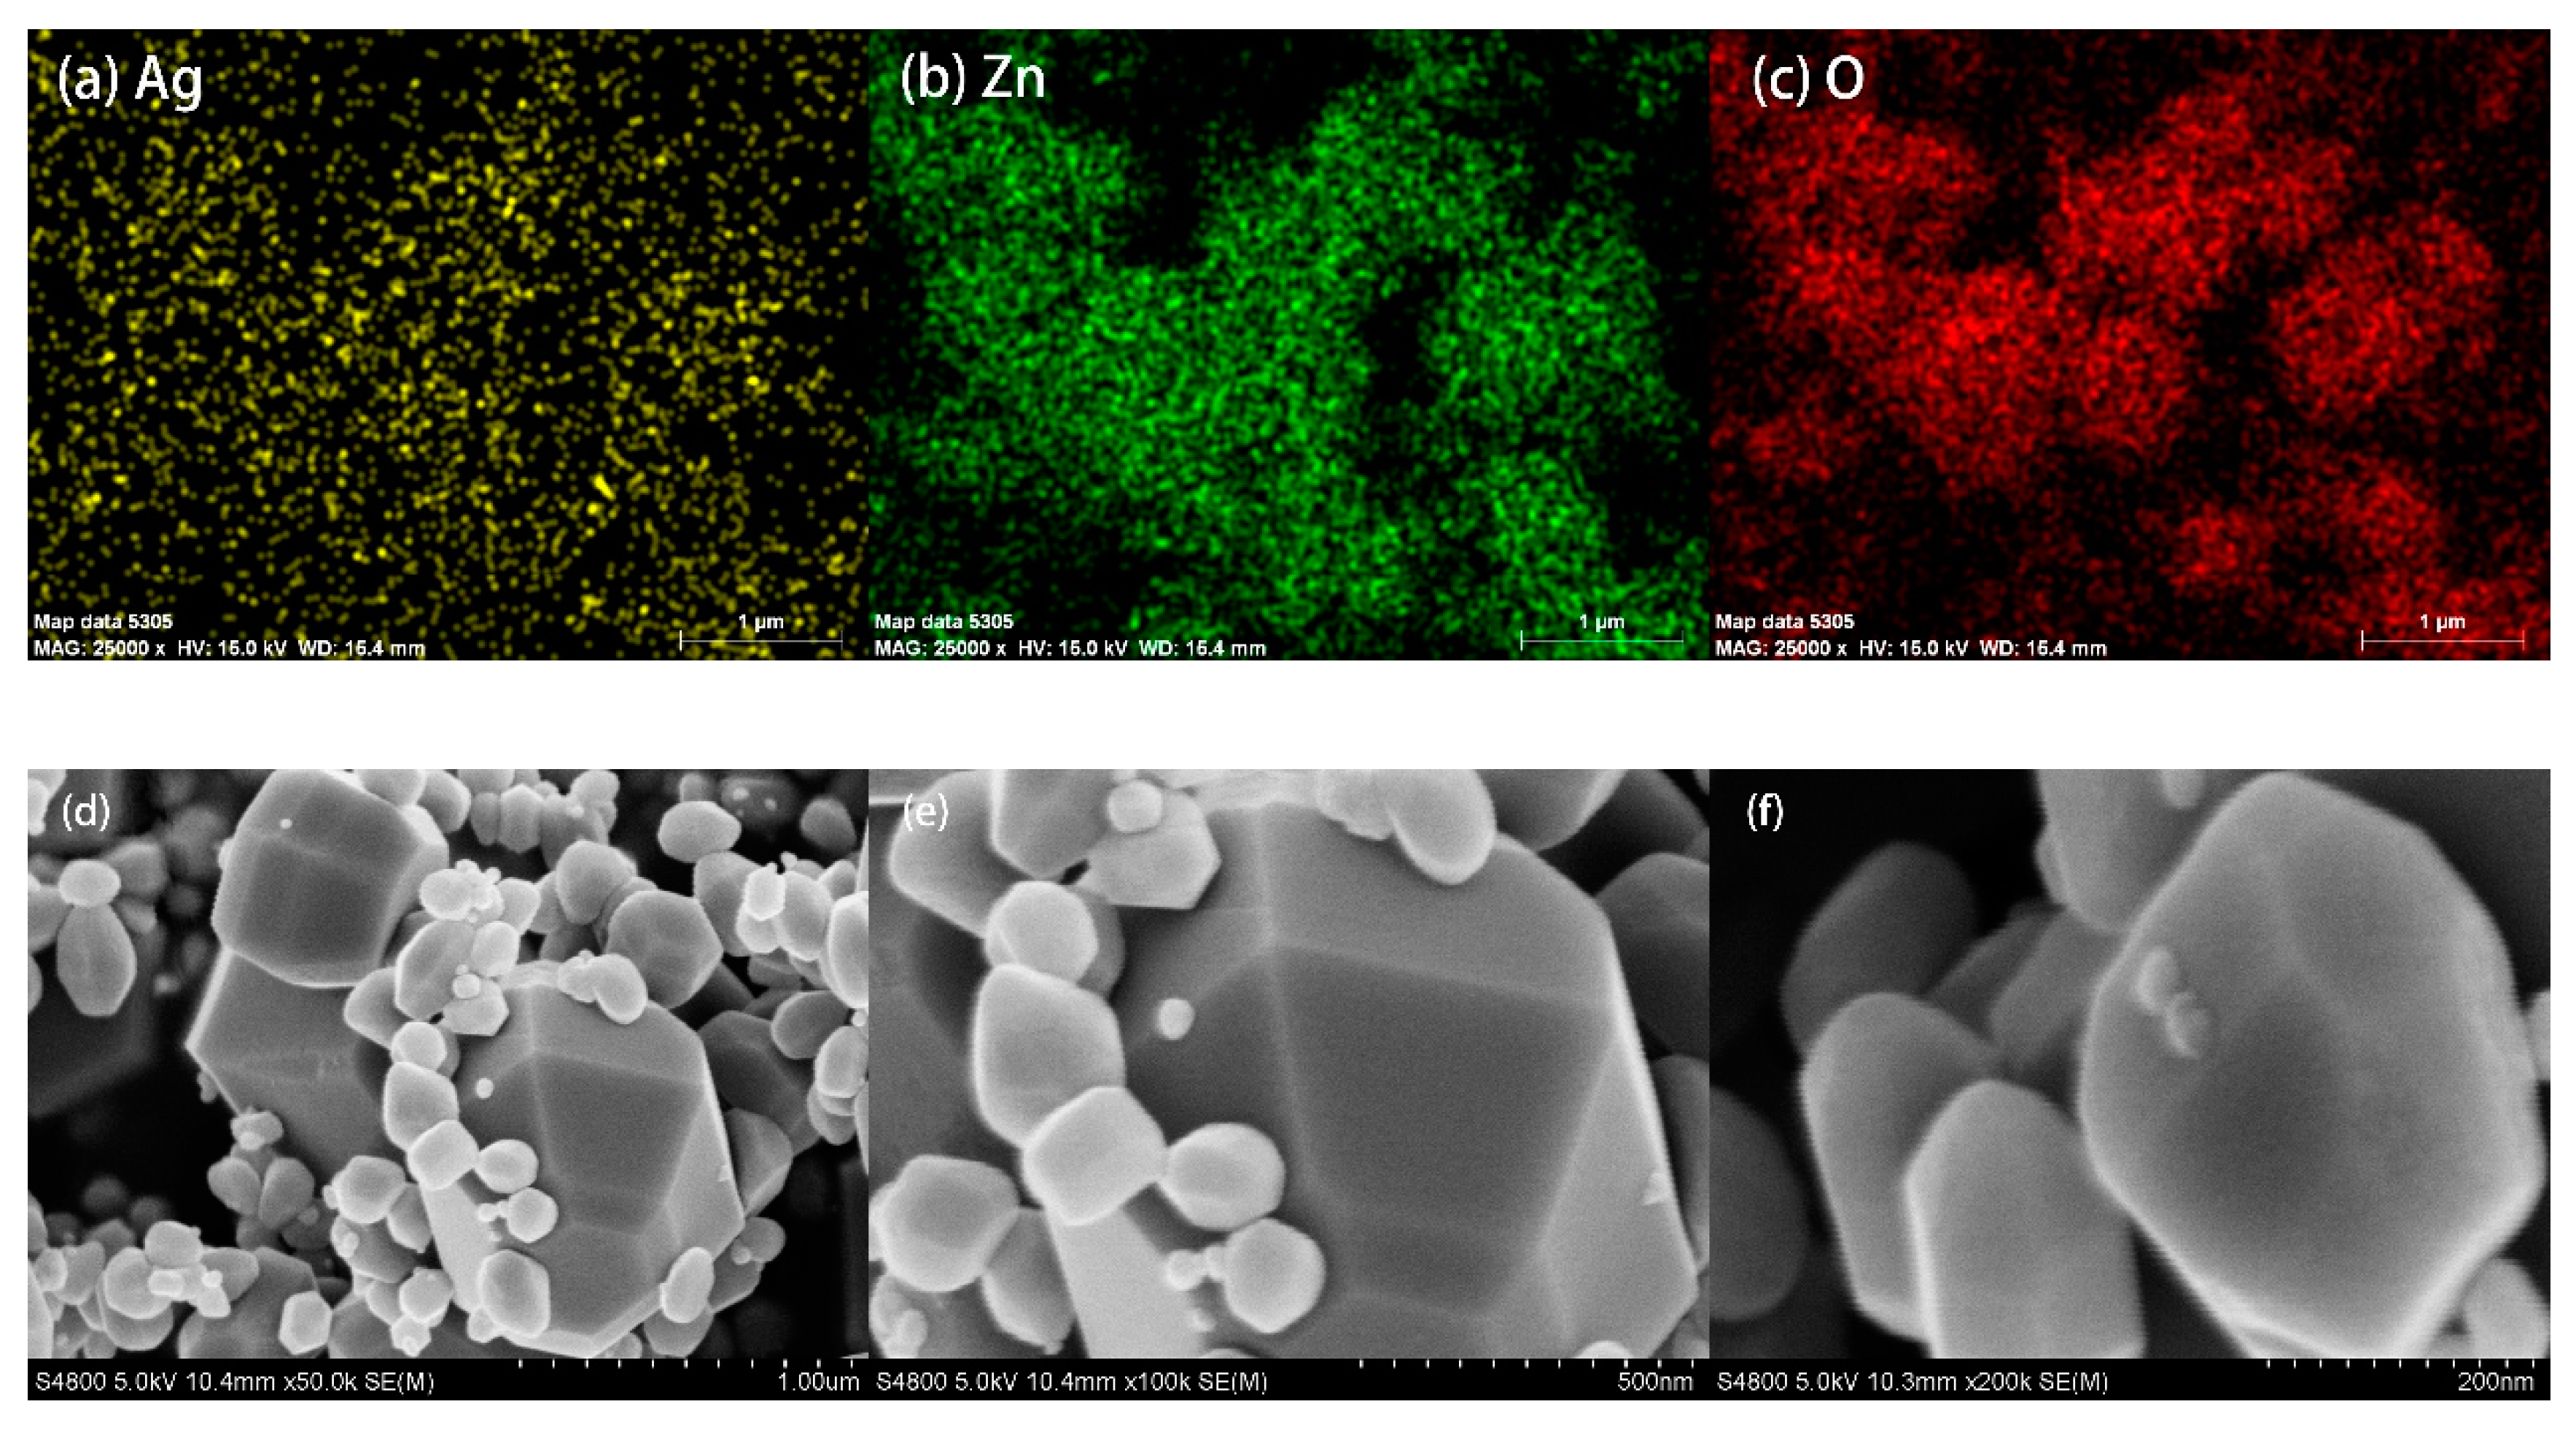
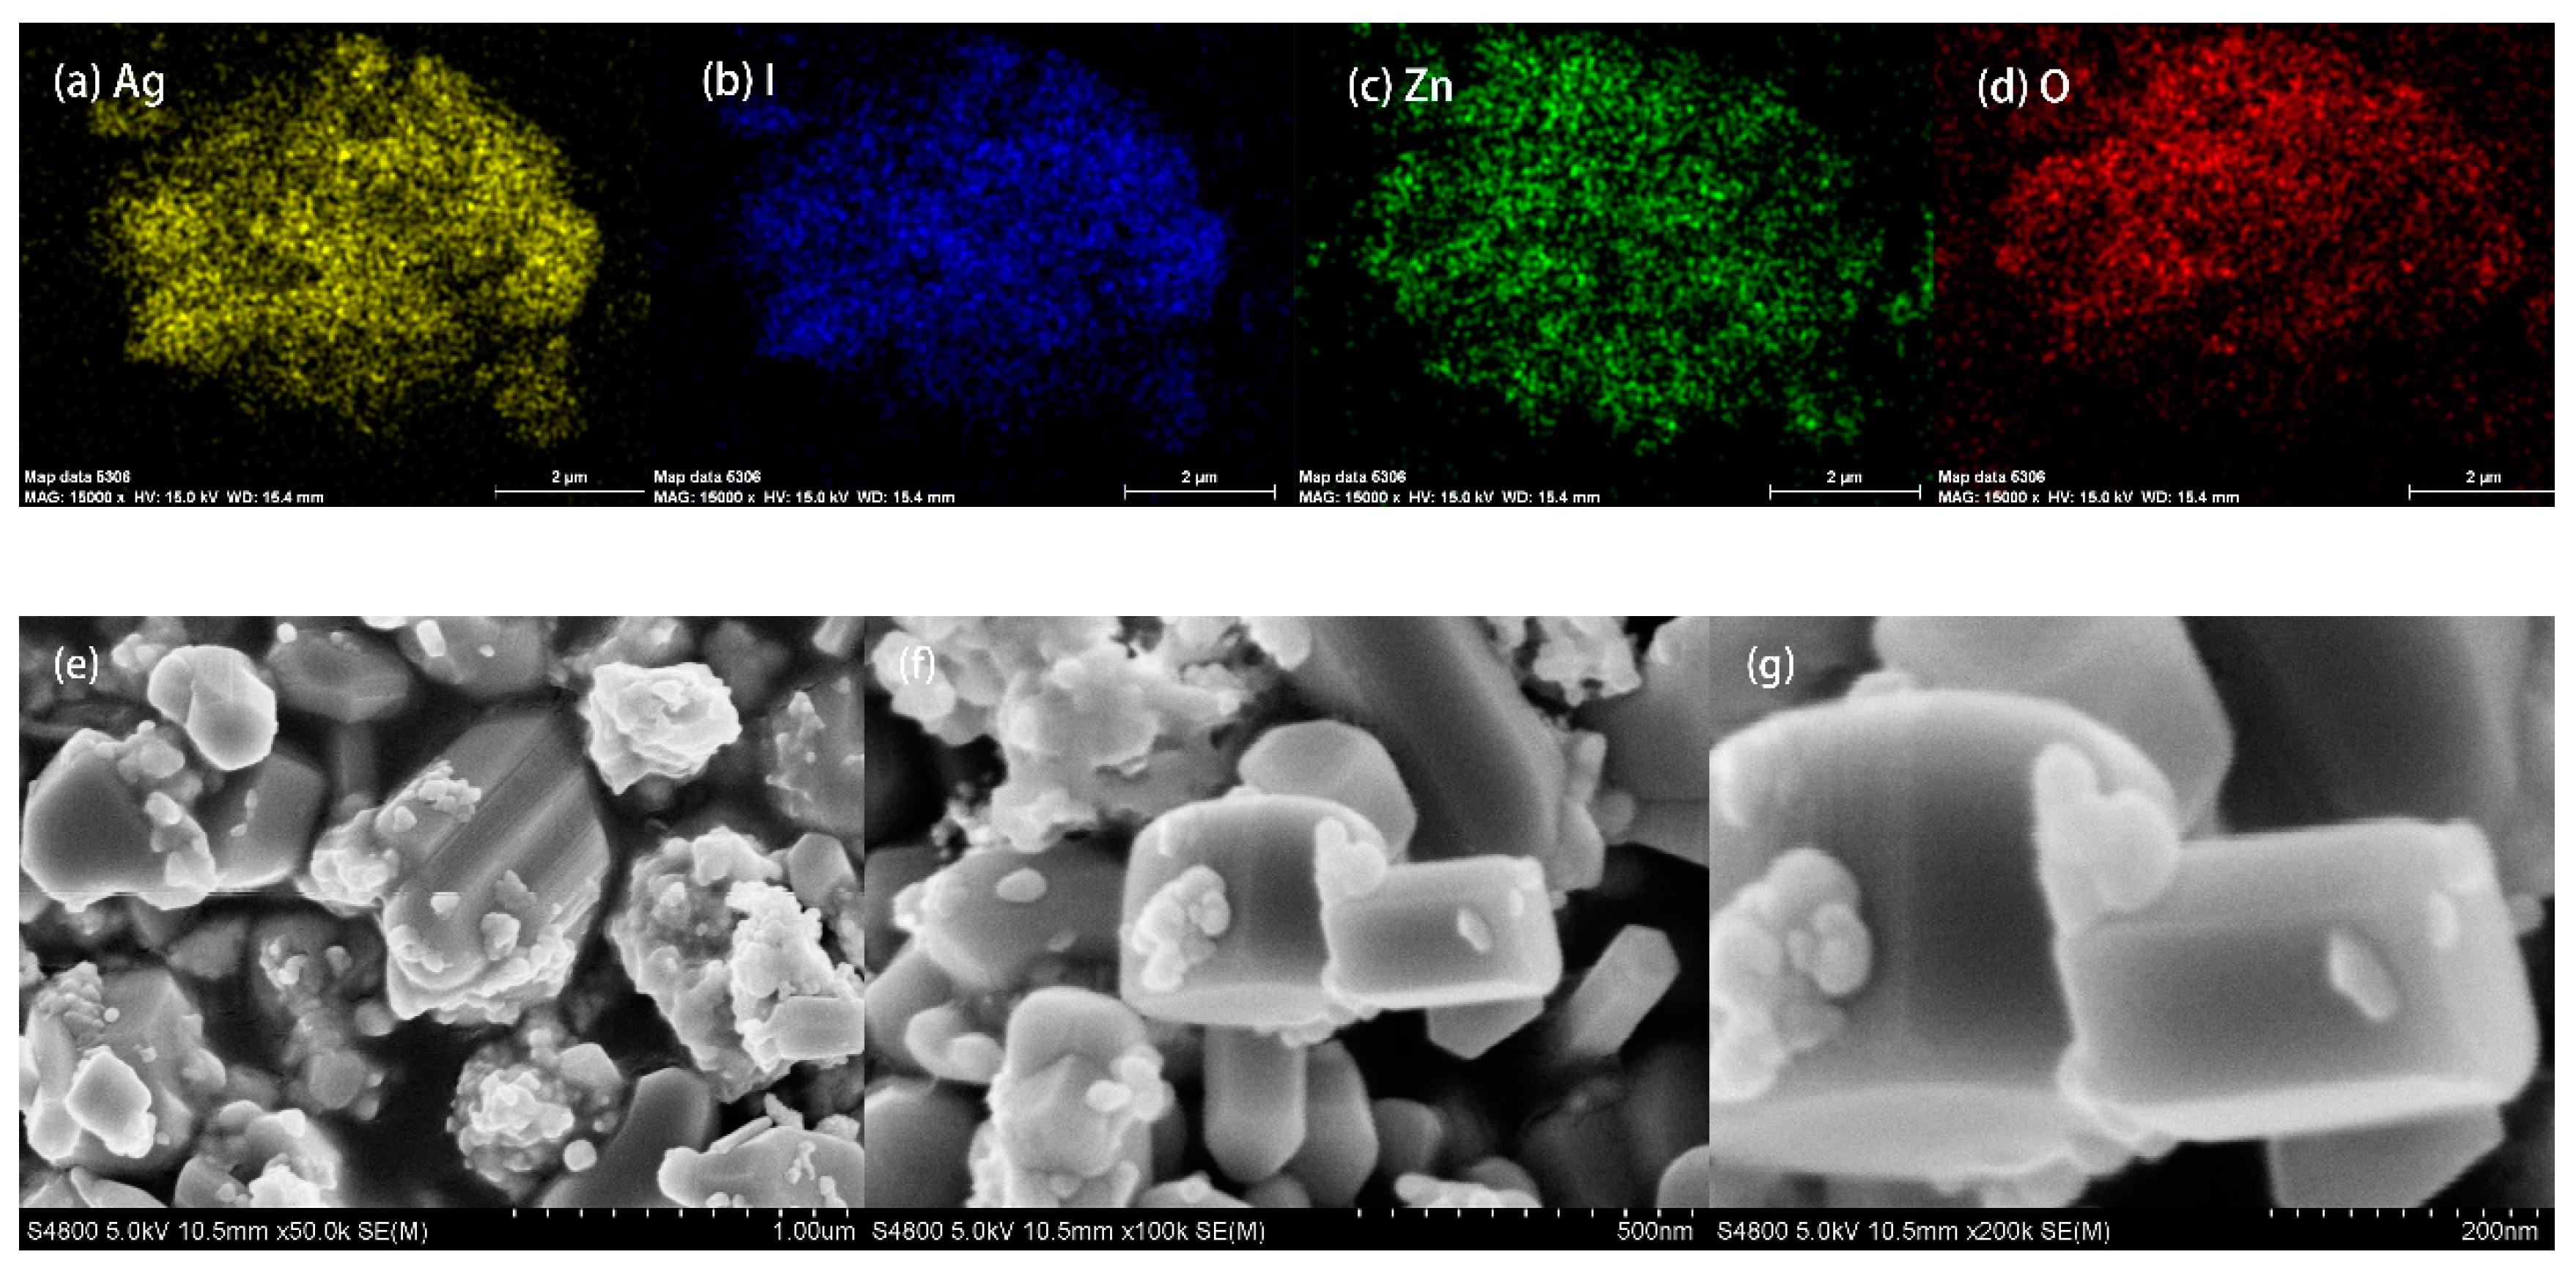
As illustrated in Figure 9a–c, the presence of element Ag, Zn and O is confirmed in Ag/ZnO (100:1), element Ag is uniformly distributed within the photocatalysts. Meanwhile, Figure 10a–d reveal that AgI/ZnO (X = 0.4) possesses the elements of Ag, I, Zn and O. SEM results are shown in Figure 9a–c and Figure 10a–d. In these images, rodlike ZnO shows good geometry, Ag and AgI particles are well dispersed on the surface, following the EDS results.

2.4. The Photodegradation of Metronidazole under Simulated Sunlight Irradiation

2.4.1. The Effect of Ag and AgI Loading

The MNZ degradation experiments were conducted to evaluate the performance of photocatalysts Ag/ZnO and AgI/ZnO under simulated sunlight irradiation. The tests were carried out in a 100 mL reaction vessel, with MNZ solution of 2 mg L−1 and catalysts dosage of 100 mg. The results are shown in Figure 11. It can be found in Figure 11a that the MNZ cannot be completely degraded without any catalysts after 90 minutes’ irradiation of simulated sunlight, only 53.4% is removed. When pristine ZnO and Ag/ZnO (100:2) are used to be the photocatalysts, 91.4% of the MNZ can be eliminated in 30 min. However, with the presence of photocatalyst Ag/ZnO (100:0.5) and Ag/ZnO (100:1), the MNZ is all removed also in 30 min. This improvement is probably due to the enhancement of photocatalytic activity by Ag deposition, which can be approved by the various characterization mentioned previously. The Ag/ZnO (100:1) catalyst showed the highest performance. It reveals the fact that the increase in catalytic efficiency is not merely positively correlated with the content of silver [47]; there is an optimal value. This can be interpreted by the fact that a specific amount of noble metal may become the center for the capture of photoelectrons, but an excess amount of noble metal can also be the core of promoting the recombination of photoelectrons and hole pairs, resulting in a weakened catalytic effect [48].
Figure 11b shows the degradation of MNZ with different AgI/ZnO photocatalysts under simulated sunlight. In 30 min, 50.3%, 63.3% and 67.1% of MNZ can be removed by AgI, AgI/ZnO (X = 0.1), AgI/ZnO (X = 0.2) and AgI/ZnO (X = 0.4), respectively. Compared to bare AgI, the degradation efficiency of MNZ is improved when combined with ZnO. It should be noted that efficiency increased with the AgI content. The enhancement can be attributed to the heterojunction structure of AgI and ZnO, which can increase not only the light adsorption, but also the generation and transportation of photoelectron and hole pairs.
To explore the kinetics of photocatalytic reactions, the pseudo-first-order apparent reaction rate constants (k) were calculated according to the graphs of reaction time versus Ln (Ct/C0) and are shown in Figure S5. According to the results, the photocatalytic degradation of MNZ follows the pseudo-first-order kinetics (−dC/dt = kC) [49]. The rate constants of Ag modified ZnO catalysts are approximately ten times higher than that of MNZ photodegradation without catalysts. In contrast, the rate constants of AgI/ZnO are almost four times higher than that of non-catalyst MNZ photodegradation, 1.3 times higher than that of MNZ photodegradation with AgI. These results confirm that the modification of ZnO can significantly enhance the photocatalytic activity of the catalysts. Overall, the Ag/ZnO catalysts perform better than AgI/ZnO catalysts.

2.4.2. Initial Concentration of MNZ

The influence of initial concentration is displayed in Figure 12. In MNZ photodegradation processes with both Ag/ZnO and AgI/ZnO as photocatalysts, as the initial concentration of MNZ increases, the degradation efficiency tends to decrease. Since the generation and transfer of active groups is the main factor controlling the rate of photocatalytic degradation, the activity sites on catalyst surface will gradually be occupied by target organics to reach a saturation point and the active groups in contact with MNZ are also reduced accordingly. Moreover, a high concentration of MNZ leads to the formation of more intermediates. The intermediates will compete with MNZ for active groups, resulting in a decrease in the photocatalytic degradation of MNZ. Figure S6a,b shows the pseudo-first-order apparent reaction rate constants (k) of each reaction. With the initial concentration of MNZ increases from 0.5 mg/L to 10 mg/L, the k values of Ag/ZnO decrease from 0.45 min−1 to 0.057 min−1; whereas the k values of AgI/ZnO decreases from 0.034 min−1 to 0.02 min−1.
Overall, for both photocatalysts, the initial concentration shows noticeable effect on the enhancement for MNZ photodegradation. The variation of initial concentration has bigger impact on Ag/ZnO than on AgI/ZnO, the highest k value (when C0 = 0.5 mg/L) is around eight times than the lowest k (when C0 = 10 mg/L), while that of AgI/ZnO is 1.7 times.

2.4.3. pH

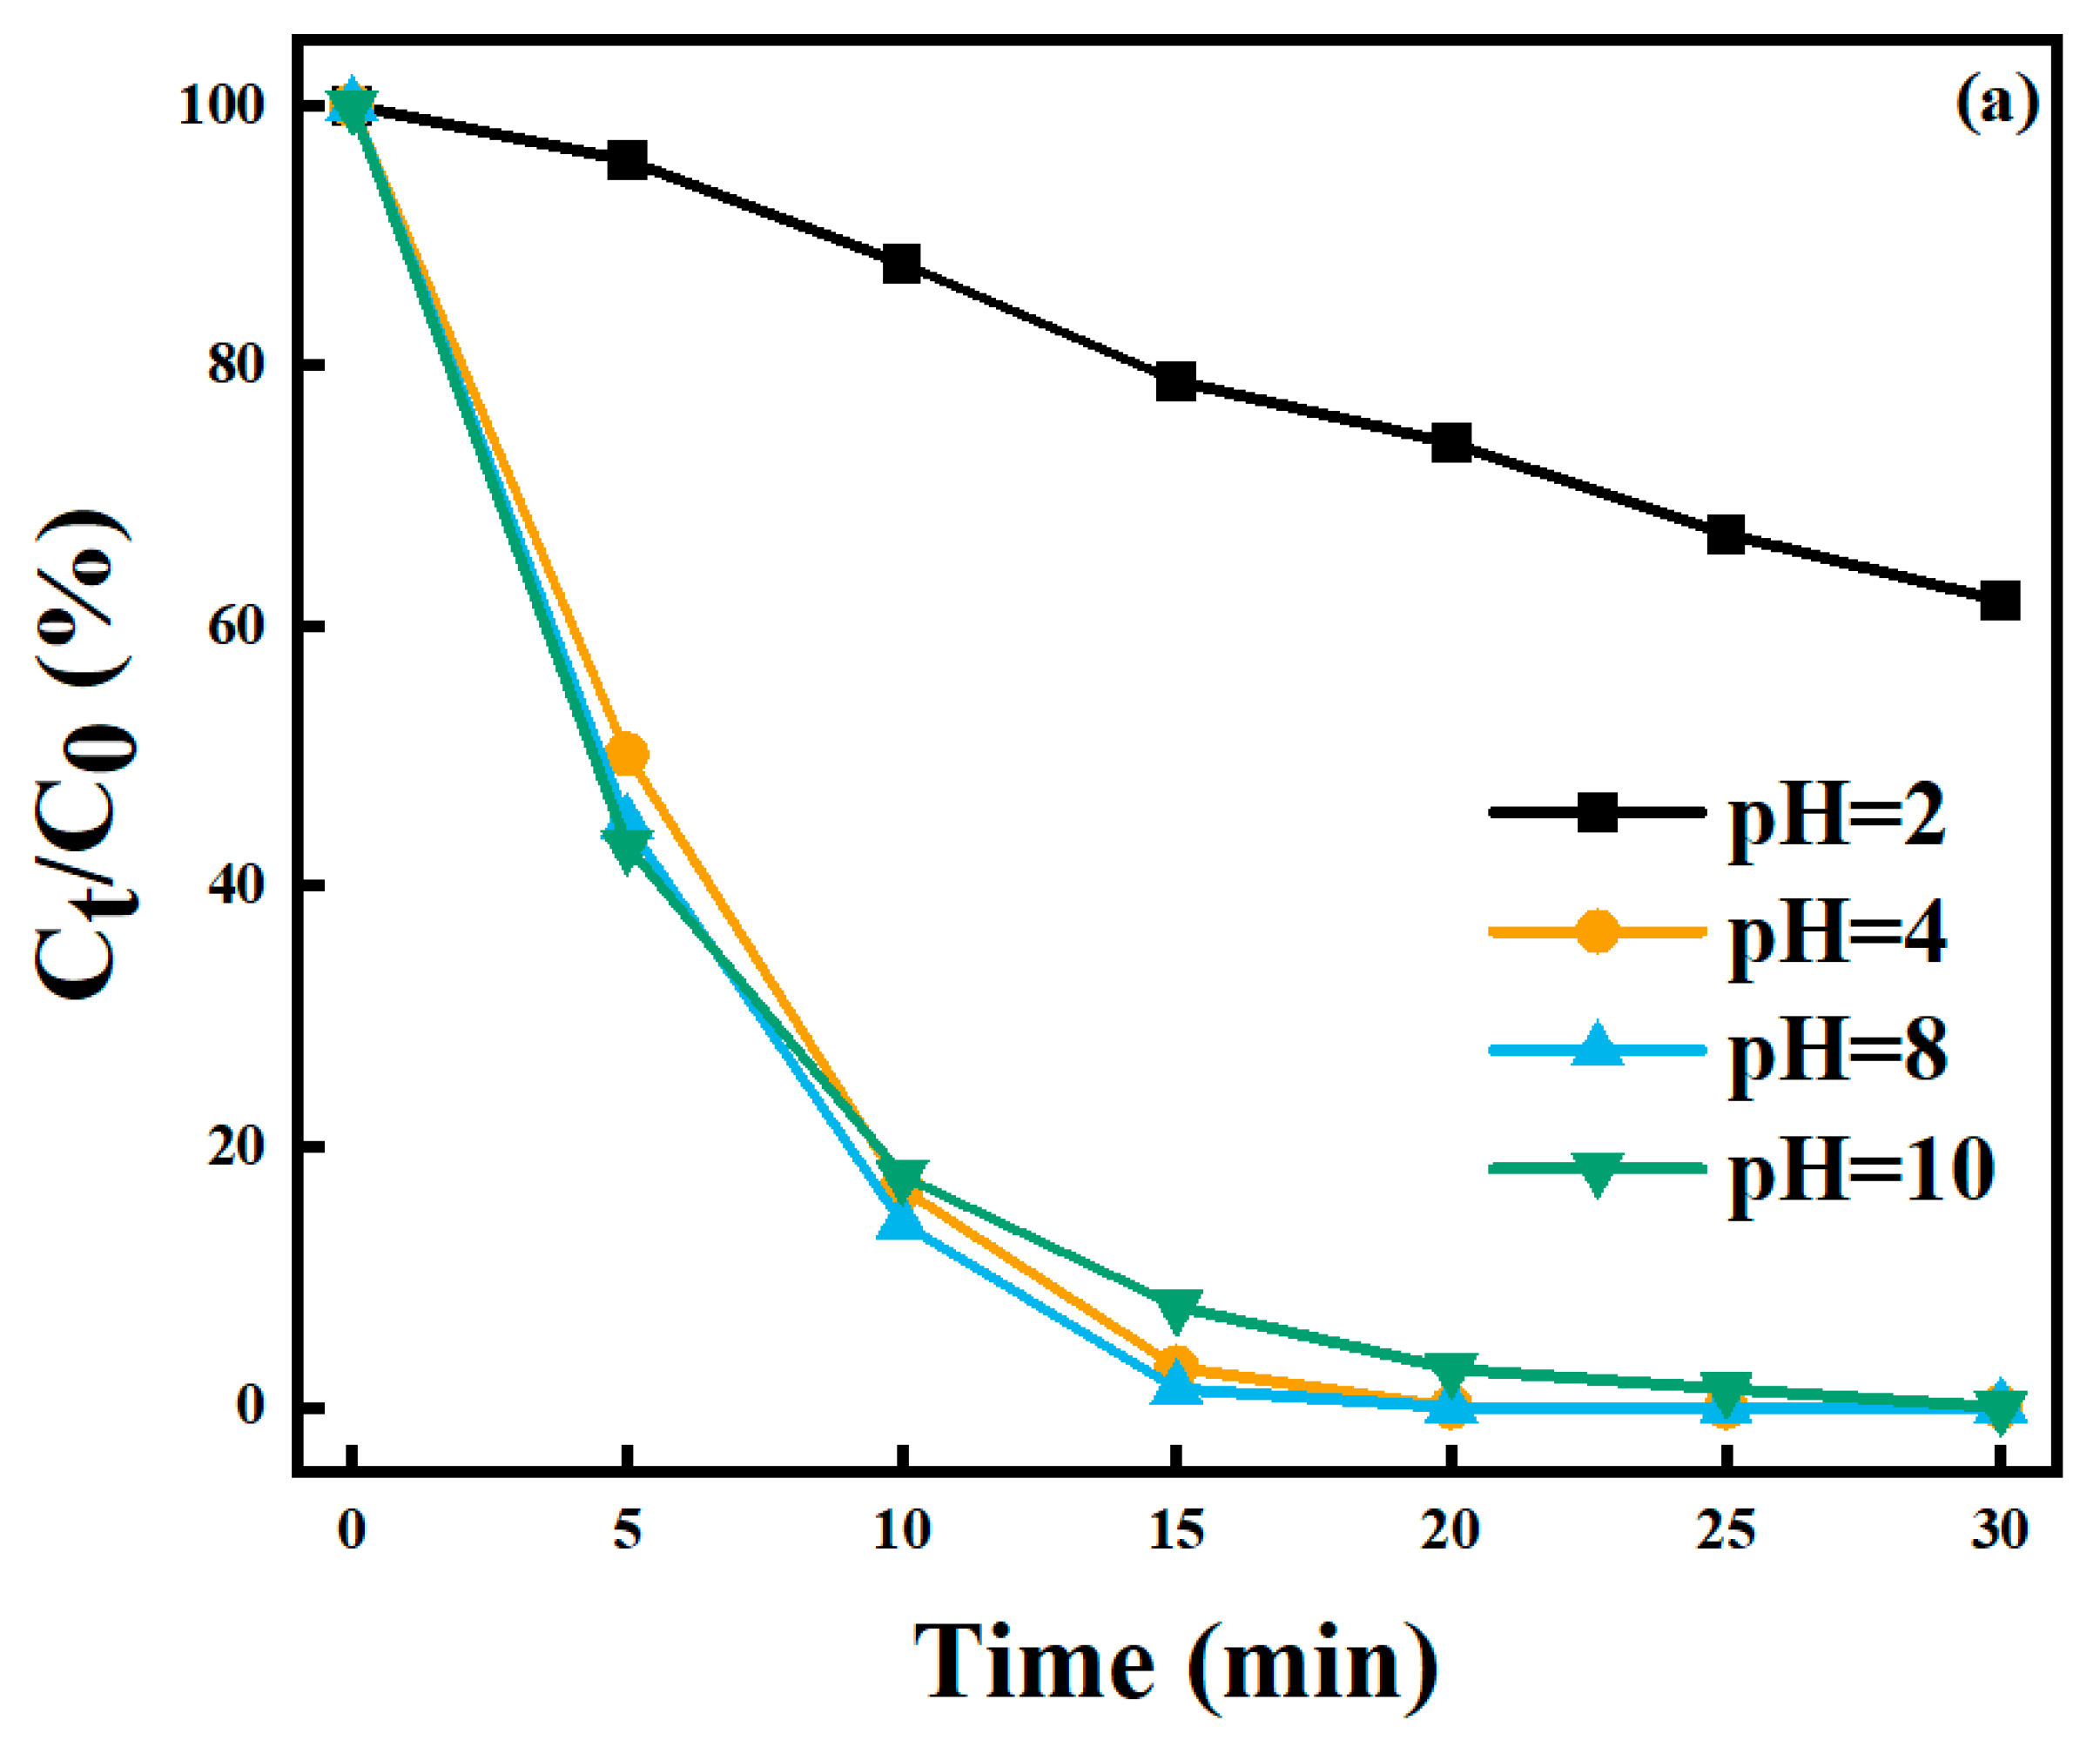
In photocatalytic reactions, pH value plays an important role. To determine how pH affects the surface charge of photocatalysts, Zeta potential was measured under different pH conditions; the results are shown in Figure S3. It can be found that the Zeta potential of Ag/ZnO (100:1) is 7.12. For AgI/ZnO (X = 0.4), the isoelectric point is 2.38. The initial pH was adjusted to 2, 4, 8, 10 × 0.1 M H2SO4 and NaOH solution in the experiments. The results can be observed in Figure 13a,b, the pseudo-first-order apparent reaction rate constants are calculated and plotted in Figure S7a,b. When using Ag/ZnO (100:1) as catalysts, the reaction is immensely contained when the pH is 2 and the MNZ degradation rate constant (k) is the lowest. Moreover, k (pH = 8) > k (pH = 4) > k (pH = 10). This is because of the changes in the charges of MNZ and the charges on the surface of the catalysts under different pH conditions. According to previous research, the pKa of MNZ is 2.55 [50], therefore when pH is below 2.55, both MNZ and Ag/ZnO are positively charged, which reduces MNZ’s adsorption capacity on the catalysts’ surface and causing a decrease in the degradation rate. When pH is at 2.55–7.12, the catalyst surface is still positively charged, but MNZ becomes negative and the adsorption of MNZ on catalyst surface becomes stronger, thus promoting the photolysis degradation of MNZ. When pH is higher than 7.12, both MNZ and Ag/ZnO are negatively charged, the rate of photodegradation is not greatly affected in such conditions. The –OH generation will be facilitated when OH massively exists. Thus, the reaction rates will increase, the effects of electrostatic rejection will be weakened. As a result, the photocatalytic reaction efficiency reach maximum at pH = 8. When the pH is further increased to 10, the electrostatic repulsion becomes more significant, so the reaction rates decrease. Similarly, for AgI/ZnO (X = 0.4), the photodegradation efficiency is greatly inhibited when pH is 2. However, when the pH gradually increases to greater than 2.38, but less than 2.55, the catalyst and MNZ are oppositely charged. Therefore, the photocatalytic reaction efficiency will be enhanced. When pH is greater than 2.55, both MNZ and AgI/ZnO will be negatively charged, likewise, the mass generation of ·OH counteracts with the decrease of degradation rate causing by electrostatic repulsion.
In general terms, pH has a significant effect on the MNZ photodegradation with Ag/ZnO and AgI/ZnO under simulated sunlight. The reaction is significantly inhibited in acidic environments due to electrical rejection. Only under this circumstance, AgI/ZnO performs similarly as Ag/ZnO, but as pH grows higher, Ag/ZnO performs much better than AgI/ZnO.

2.5. Mechanism of Photocatalytic Reactions

2.5.1. Validating the Presence of Reactive Oxygen Species

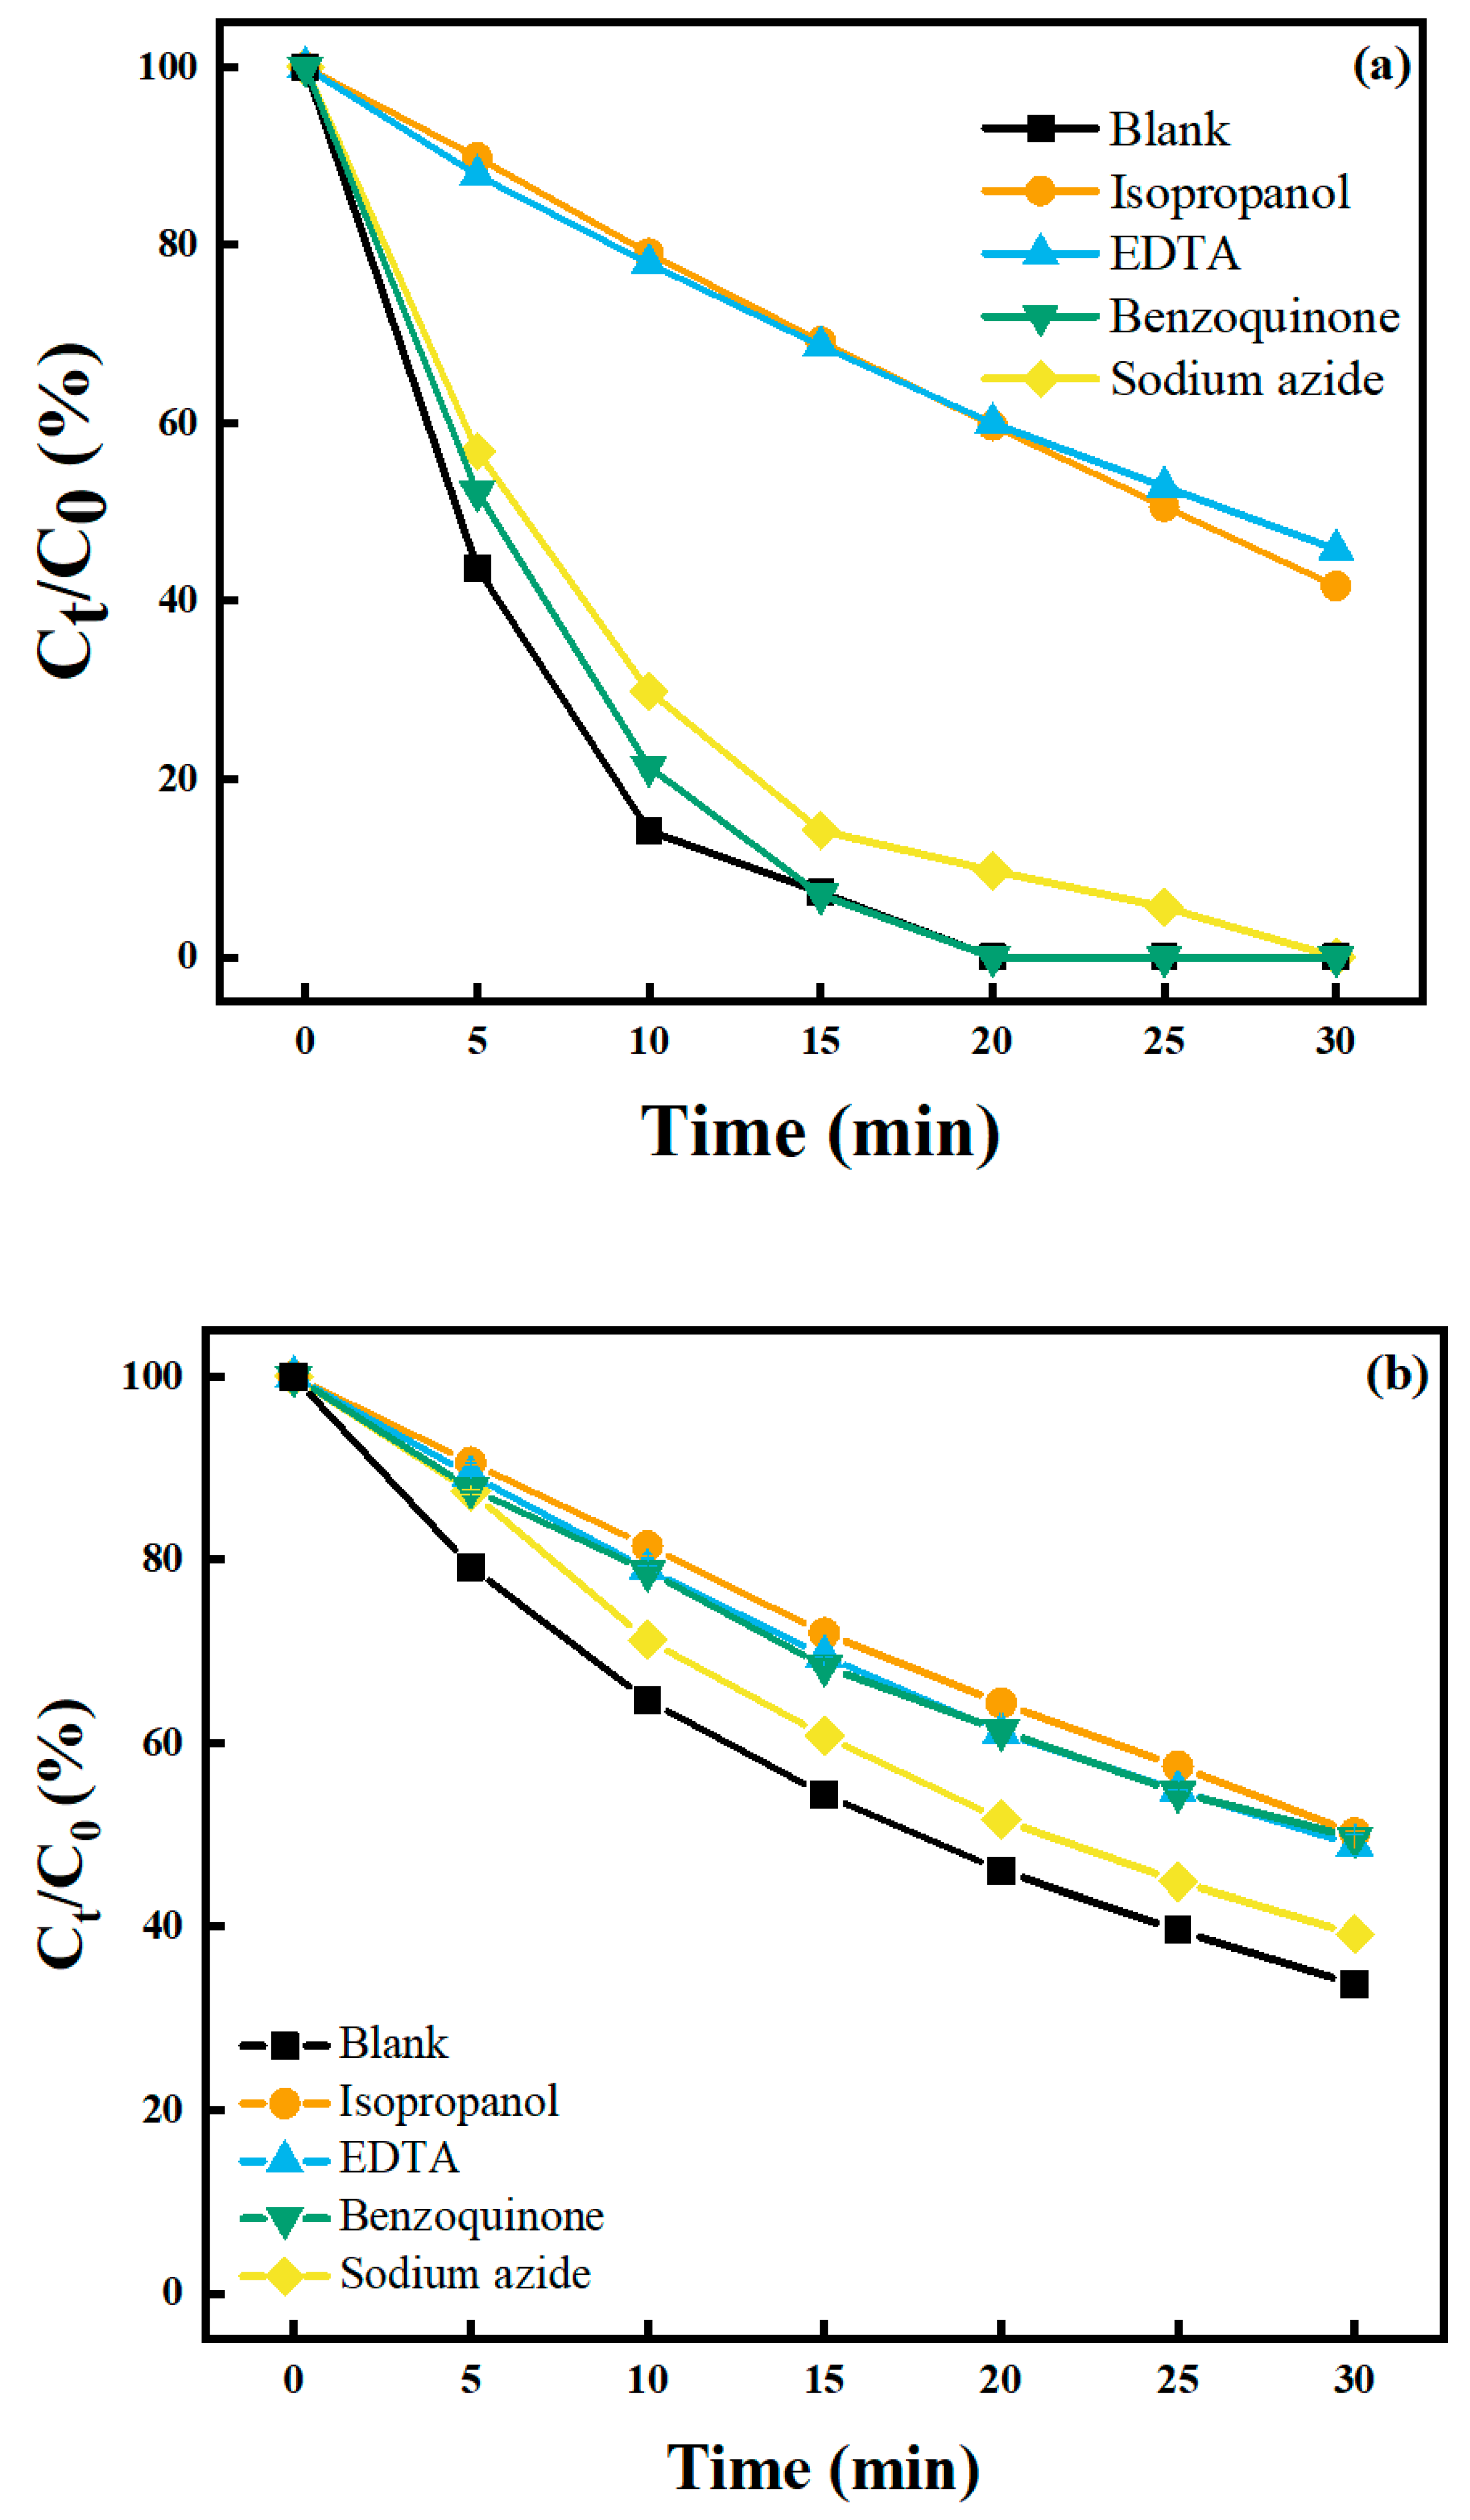
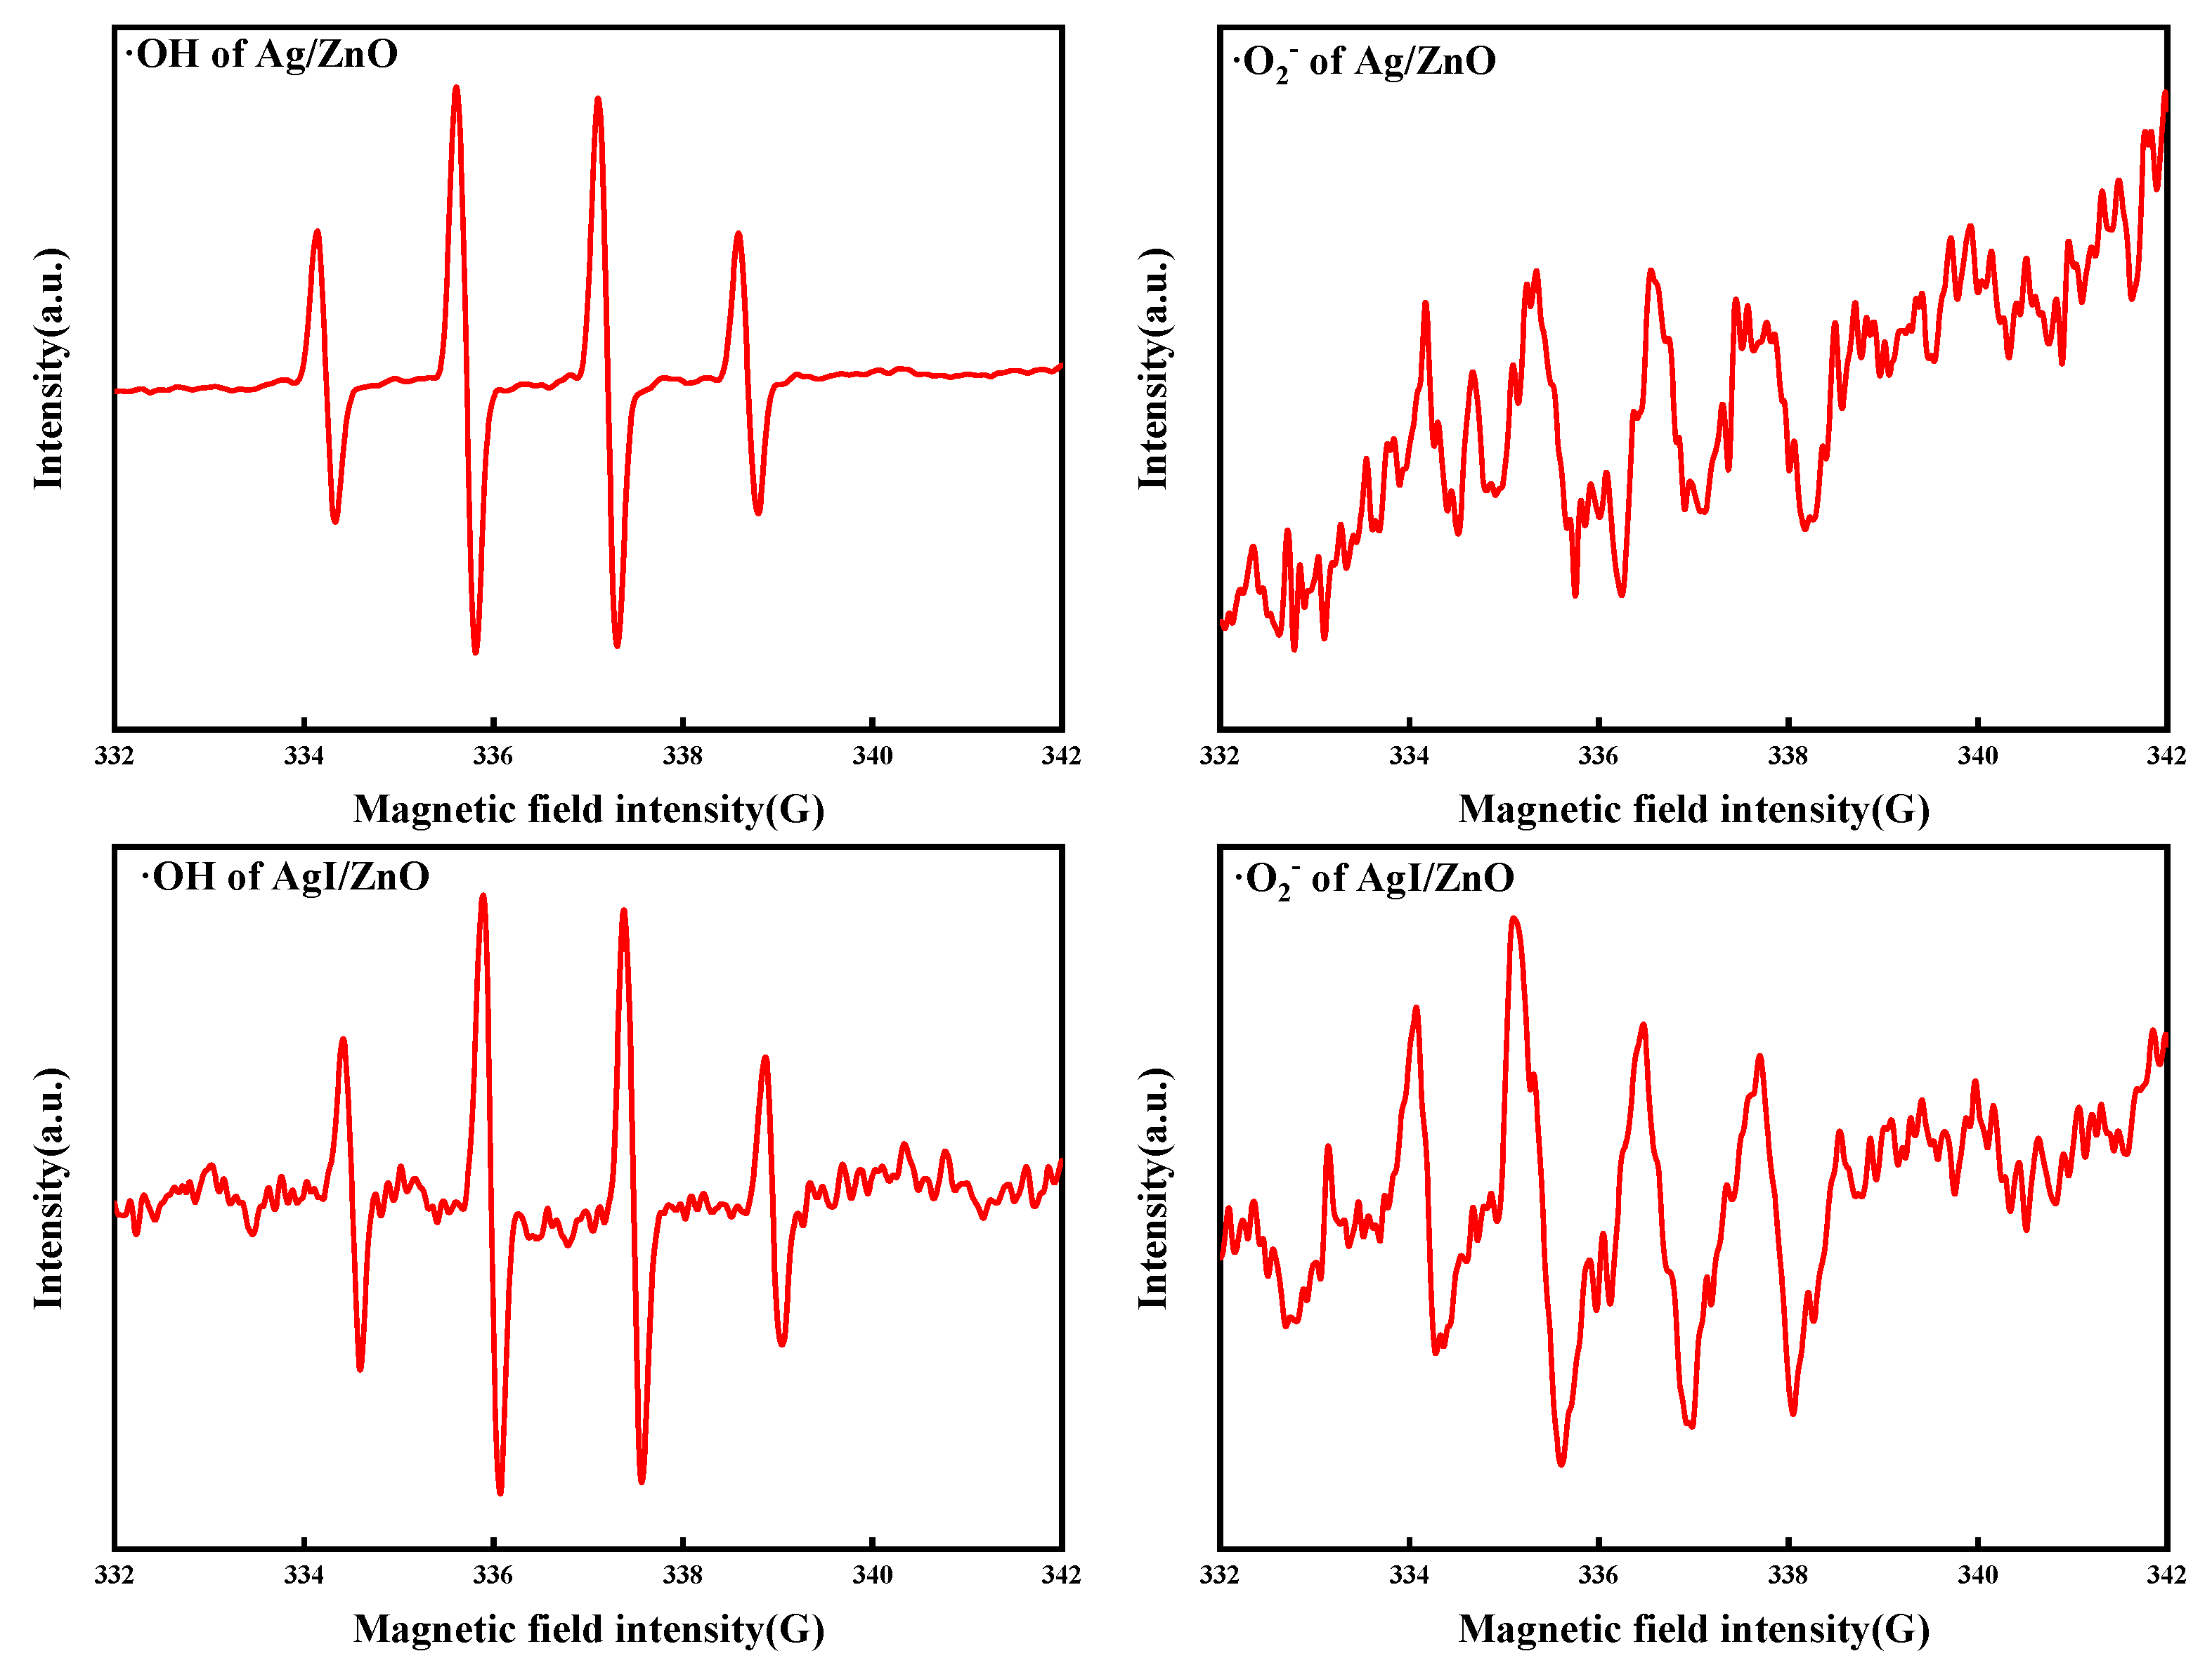
The presence of the reactive oxygen species were validated by quenching experiments. The common reactive oxygen species and their quenchers are OH and isopropanol (10 mM), O2 and benzoquinone (0.5 μM), photogenerated holes (h+) and EDTA disodium (5 mM), 1O2 and sodium azide (0.5 μM) [39], respectively. Figure 14 shows the results of the quenching experiments. It can be seen from Figure 14a that the presence of isopropanol and EDTA significantly inhibited the photocatalytic activity of Ag/ZnO. The effects of benzoquinone and sodium azide were minimal, indicating that OH are the main reactive oxygen species. Figure 14b shows that the quenchers suppressed the photocatalytic activity of AgI/ZnO to different extent. Among them, isopropanol has the most apparent inhibition effect. Hence, OH plays a major role, h+ and O2 are secondary. To further determine the main reactive oxygen species, EPR analysis was conducted. As Figure 15 displays, Ag/ZnO patterns show the four characteristic peaks of OH with significant intensity, implying the existence and abundance of OH. Meanwhile, though the OH pattern of AgI/ZnO also shows the characteristic peaks, the baseline is not smooth enough, revealing that the intensity is not as good as that of Ag/ZnO. For the O2 pattern of Ag/ZnO, the feature peaks are not clear enough and the intensity is insufficient. The O2 pattern of AgI/ZnO is much more defined than that of Ag/ZnO. This suggests that O2 plays a more critical role in the photocatalysis with AgI/ZnO. These results all correspond to quenching experiments.

2.5.2. Proposed Photocatalytic Mechanism

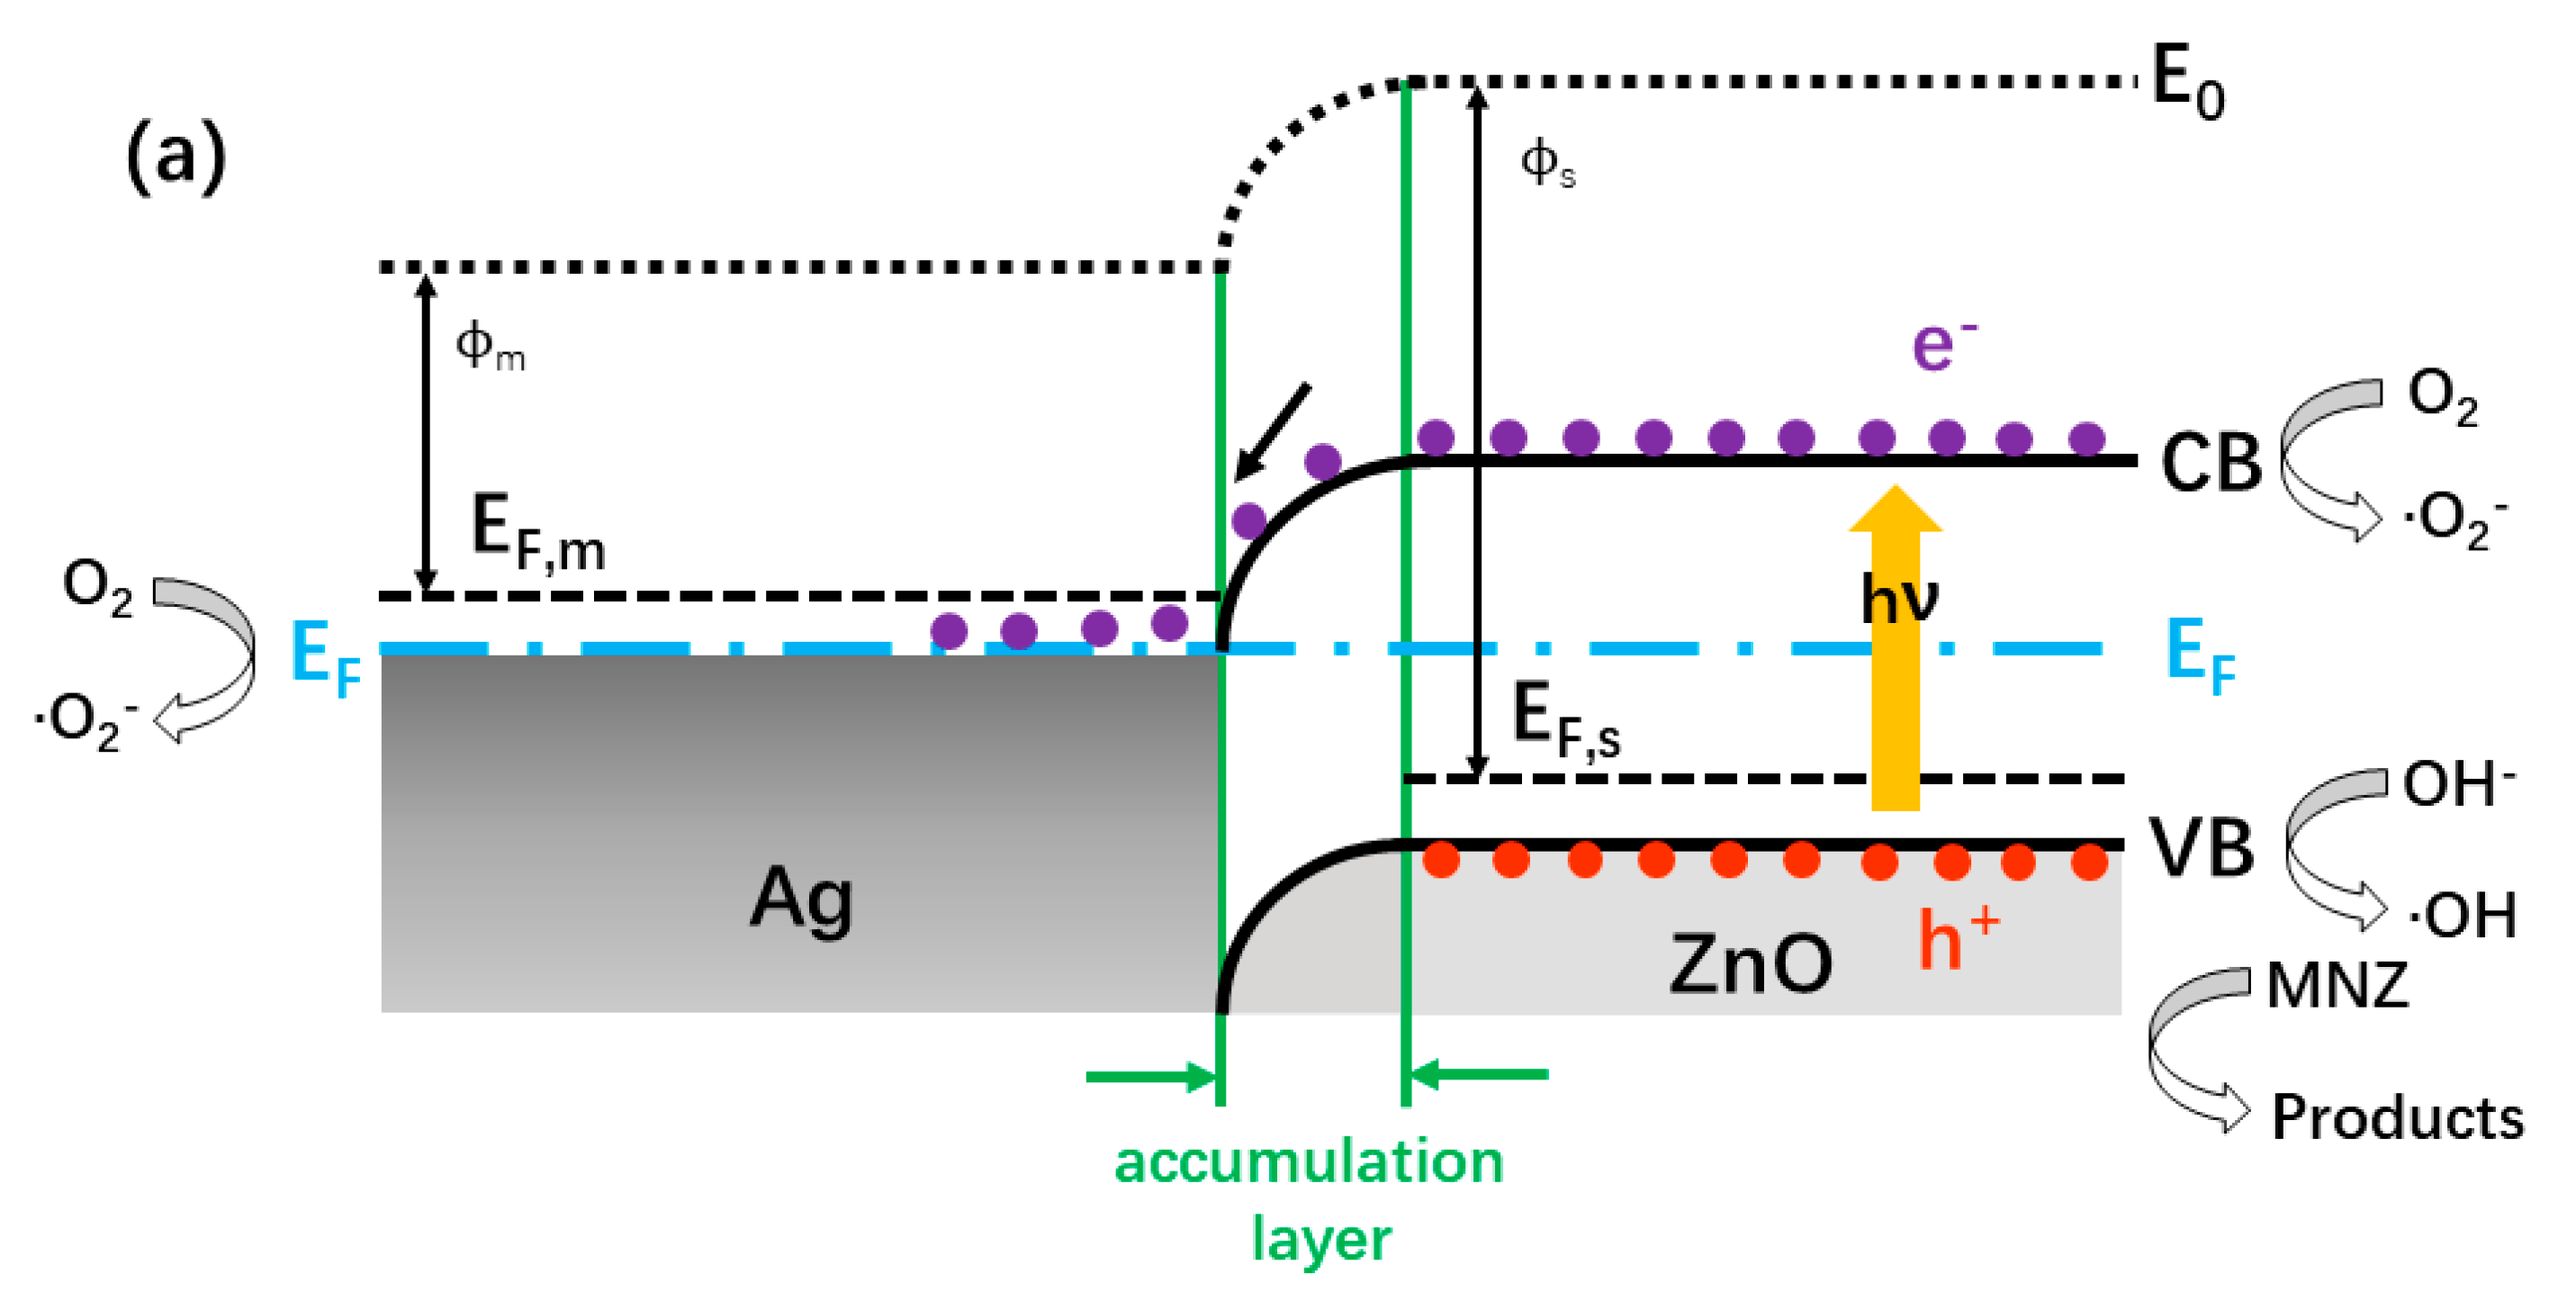
For Ag/ZnO, as an n-type semiconductor, the work function (ϕs) of ZnO is 5.2 eV [37], the band gap is around 3.2 eV, the conduction band (CB) and valence band (VB) are −4.19 eV and −7.39 eV (vs. AVS), respectively [51]. It is well known that Ag as a noble metal is also a good conductor, its CB overlaps with VB, so it contains many free electrons and the work function (ϕm) of Ag is 4.26 eV [52]. At the time Ag and ZnO contact with each other, free electrons start to transfer. Since ϕm < ϕs, electrons transfer from Ag to ZnO until the Fermi levels of Ag (EF,m) and ZnO (EF,s) are at the same level. This results in the formation of accumulation layer, where the electrons accumulate in the space charge region [53]. This process can be described as:
Ag Ag + + e
Eventually, the energy band edges of ZnO shift due to the charge transfer and band bending happens. The proposed scheme of band structure and photocatalytic mechanism for Ag/ZnO under the irradiation of simulated sunlight is displayed in Figure 16a. When the catalysts are under the radiation and receiving energy higher than band gap of ZnO, the electrons on VB will be excited and transferred to CB and the same amount of h+ will be generated on the VB, thus the photoelectron–hole pairs are formed. The O2 molecules in water can trap the photoelectrons on Ag and CB of ZnO and transfer to O2. The h+ on VB of ZnO can react with OH to generate OH. Furthermore, the defects at the interface of Ag and ZnO can also restrain the recombination process by transferring the electrons to organic matters in solution [37]. The active oxygen species and h+ can all react with MNZ and decompose it. Ag+ will absorb photoelectrons and be reduced to Ag. Thus, the catalysts remain stable. The rest of the photocatalytic process can be described as:
ZnO + h ν ZnO   ( e + h + )
h + + OH OH
e + O 2 O 2
e + Ag + Ag
O 2 / · OH / h + + MNZ Products
As for AgI/ZnO, the band gap of AgI is around 2.79 eV, the CB and VB are −0.42 eV and 2.37 eV, respectively [54,55]. The CB and VB of ZnO are −0.34 eV and 2.86 eV (vs. NHE), respectively [56]. Figure 16b illustrates the proposed photocatalytic mechanism of AgI/ZnO. After contact, AgI and ZnO will become heterojunction structure. Under the radiation of simulated sunlight, photoelectrons on CB of AgI can easily transfer to CB of ZnO, since CBAgI is more negative than CBZnO. The potential energy of O2/ O2 (−0.33 eV [57]) is less negative than that of AgI and ZnO, so O2 molecules in water can capture the electrons on CB of AgI and ZnO to generate O2. The potential energy of ·OH/OH (2.38 eV) is higher than VB energy of AgI, thus the h+ on VB of AgI cannot oxidize OH to OH, instead, it can directly react with MNZ molecules [58]. On the other hand, the potential energy of ·OH/H2O (2.72 eV) is lower than the VB energy of ZnO, so the h+ on the VB of ZnO will react with H2O molecules to produce ·OH [29]. The photocatalytic process can be described as:
AgI + h ν AgI ( e + h + )
ZnO + h ν ZnO   ( e + h + )
e + O 2 O 2
h + + H 2 O OH + H +
O 2 / · OH / h + + MNZ Products
According to former experiment results, under the irradiation of simulated sunlight, Ag/ZnO performs much better in the photodegradation of MNZ than AgI/ZnO as the photocatalyst. The reason is evident through the proposed photocatalytic mechanism. OH plays a key role in the photodegradation of MNZ. Owing to the existence of an accumulation layer [59], the photoelectron transmission process from ZnO to Ag is boosted, so that the recombination of photoelectron–hole pairs is reduced in Ag/ZnO, thus the OH generation is promoted. Moreover, the surface plasmon resonance (SPR) of Ag also improves the utilization of light energy and the efficiency of electronic transmission [39]. Noticeably, as shown in Figure 16b, since the Fermi levels of AgI and ZnO are close to their VB, comparing to Ag/ZnO, when the electronic transfer of the two interfaces is balanced, the direction of band bending in AgI and ZnO is opposite, resulting in discontinuous energy edges [57,58]. This is unfavorable not only to the transfer of photoelectron–hole pairs, but also to the mass generation of OH. To conclude, the structural distinctions of Ag/ZnO and AgI/ZnO lead to differences in their ability to produce free radicals, which is why the photocatalysis capabilities of the two catalysts are different.

2.6. Identification of Possible Intermediates during Photocatalytic Degradation

To determine the main intermediates during the photodegradation of MNZ, LC–MS/MS analysis was conducted. The mass spectrum of MNZ produced a molecular ion at m/z 171 and the intermediates of MNZ photodegradation were determined at m/z 184, 149, 121, 158, 98, 142. Figure 17 shows the possible photodegradation pathway of MNZ, which is based on the LC–MS/MS results and reported MNZ degradation by hydroxyl radicals [3,59,60,61]. The images of TOC removal are shown in Figure S4, the TOC removal rates are nearly 50% in the process of MNZ photodegradation under simulated sunlight.

2.7. Stability of the Photocatalysts

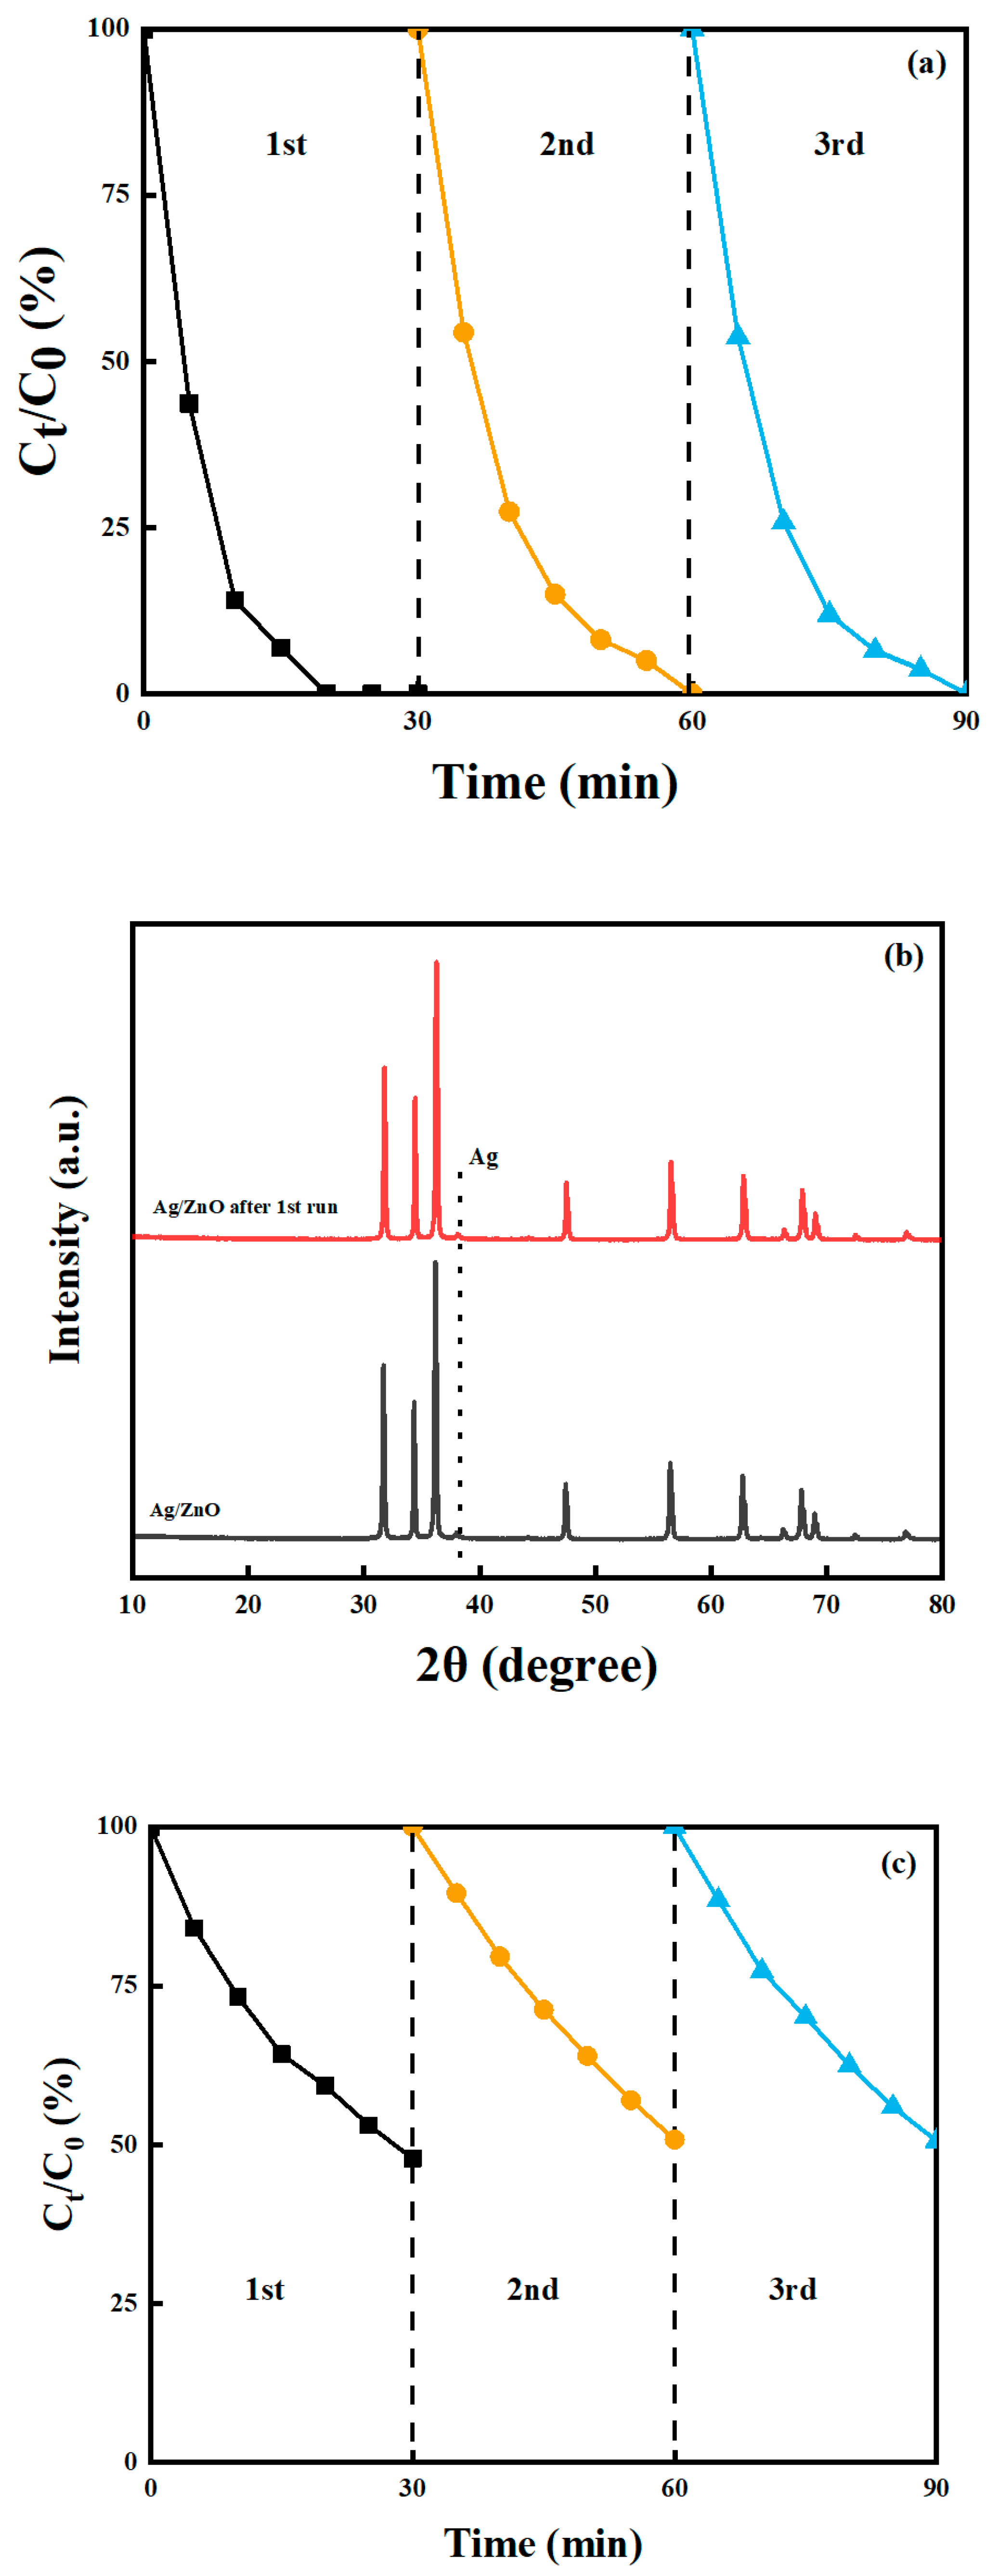
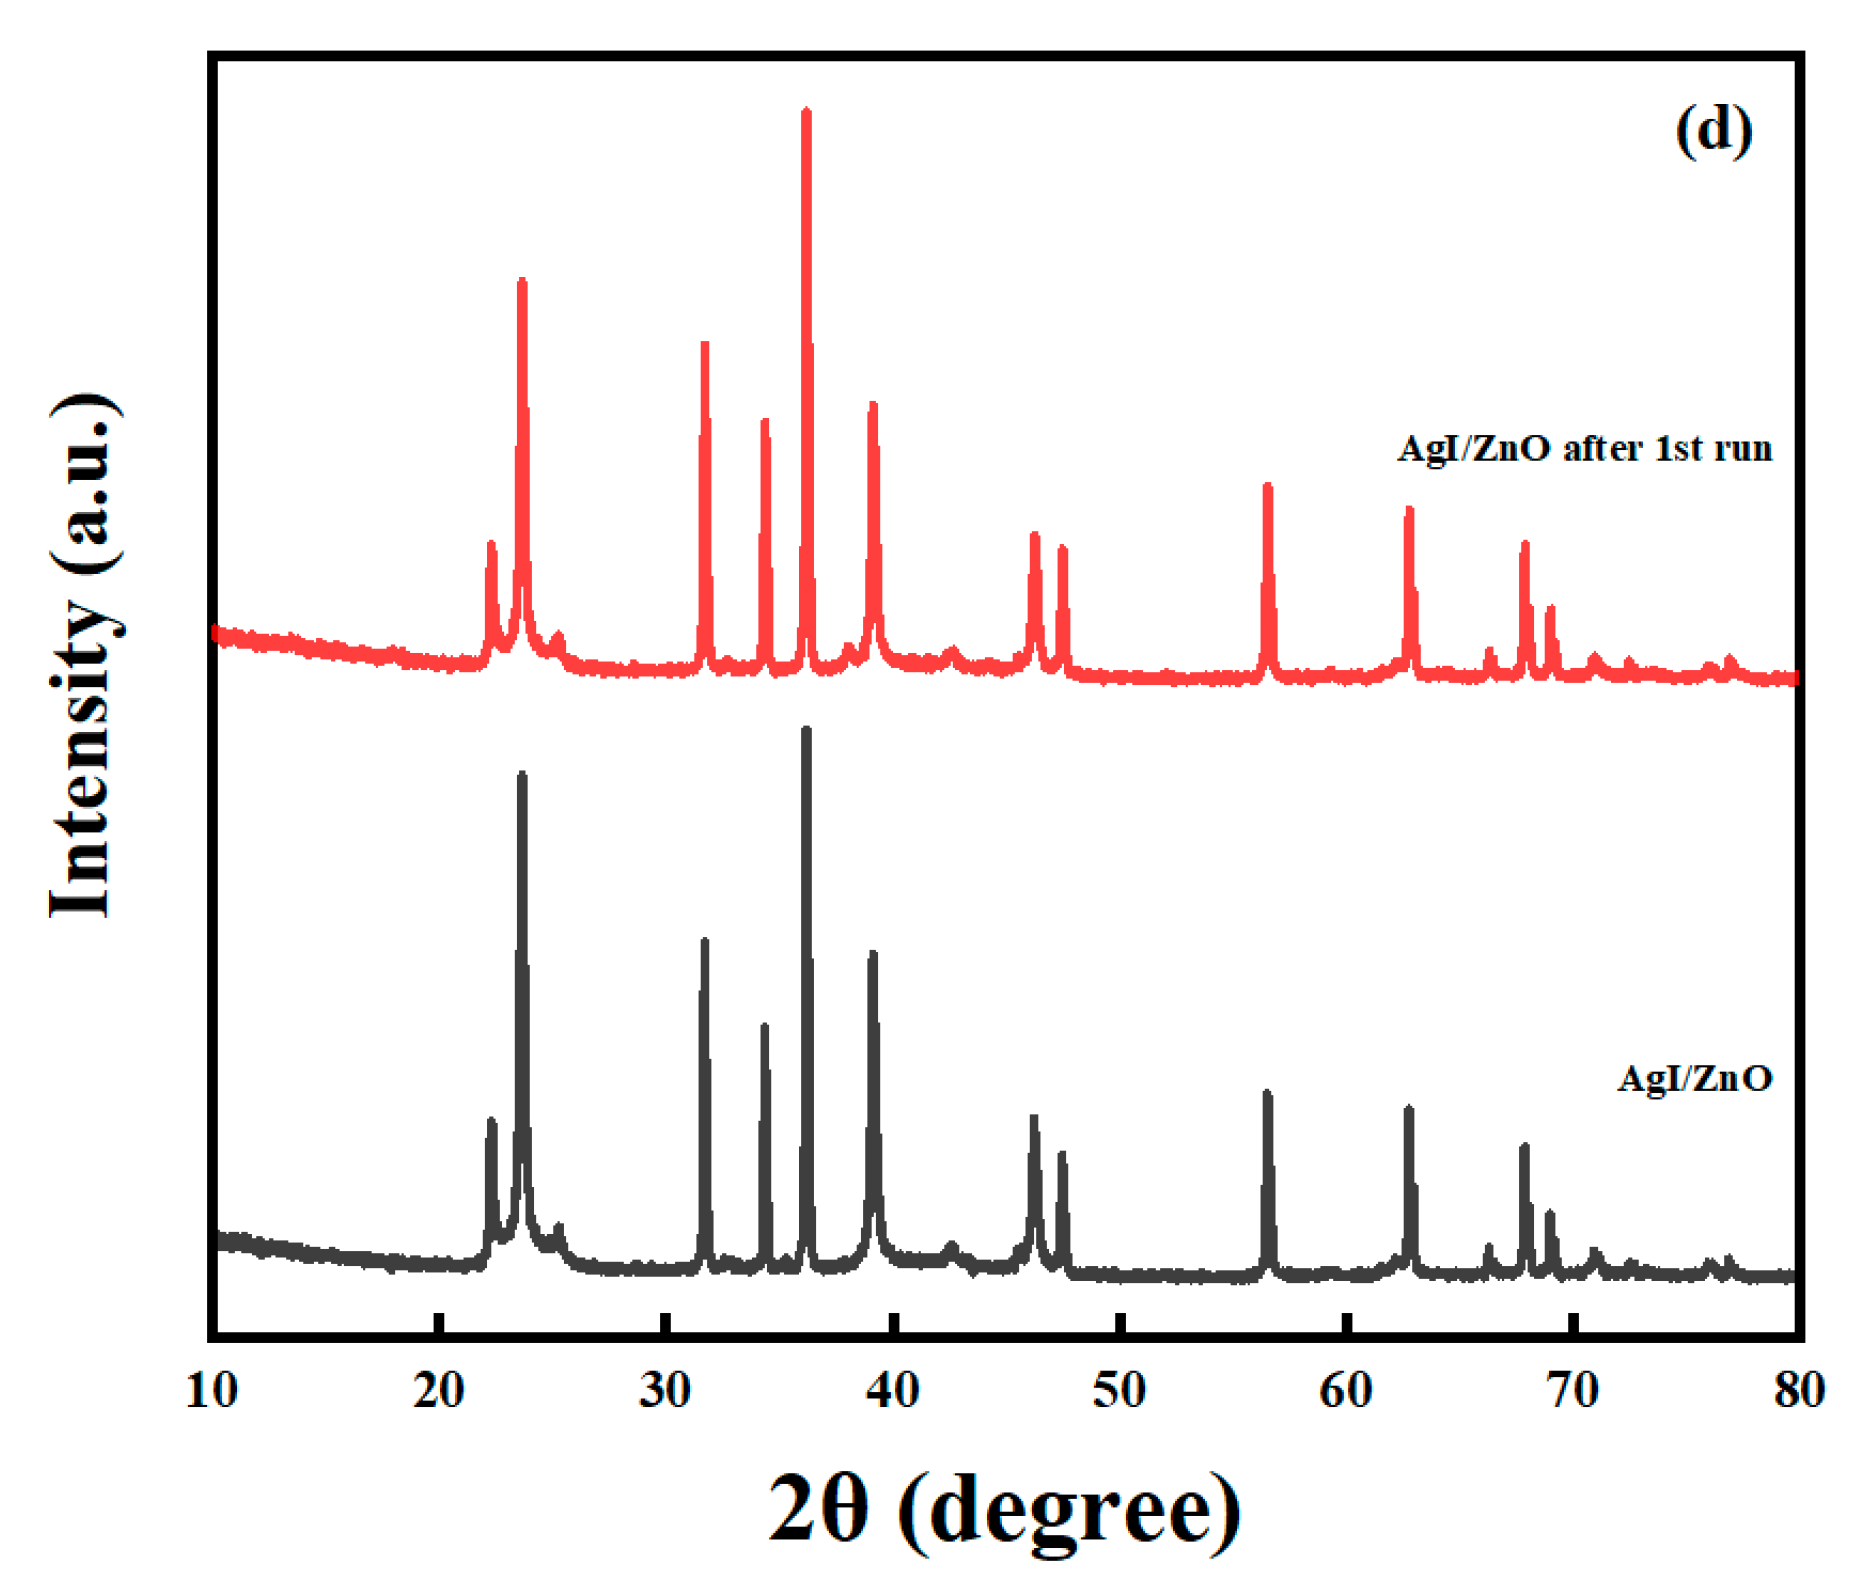
To investigate the stability of Ag/ZnO (100:1) and AgI/ZnO (X = 0.4), three-time cycling experiments of MNZ photodegradation were conducted. As shown in Figure 18a, there is a slight decline of the efficiency after the first run. It takes more time to get 100% degradation rate. Figure 18b shows the XRD patterns of Ag/ZnO (100:1) before and after the reaction. The characteristic peaks of Ag and ZnO are not changed, but the intensity of Ag has a small decrease. The results of ICP-MS test show that the Ag+ concentration of the reaction system increases from 0.0 to 62.9 ppb after the first run, confirming that it was the leaching of Ag content which caused the decline of photocatalytic efficiency. As for AgI/ZnO (X = 0.4), it can be found in Figure 18c that degradation rate generally remains at the same level, the XRD patterns in Figure 18d also displays no changes. Furthermore, the results of the ICP-MS test show that the concentrations of Ag+ before and after the reaction are 1.2 ppb and 1.5 ppb, respectively, which is negligible. These results suggest that AgI/ZnO is more stable than Ag/ZnO.

3. Materials and Methods

3.1. Materials

Metronidazole (MNZ, analytical reagent) was obtained from Sigma-Aldrich (St. Louis, MO, USA). Silver nitrate (AgNO3, analytical reagent), sodium hydroxide (NaOH, analytical reagent), ethanol absolute (CH3CH2OH, analytical reagent), sodium chloride (NaCl, analytical reagent), sodium sulfate (Na2SO4, analytical reagent), sodium nitrate (NaNO3, analytical reagent) and sodium humate were purchased from Sino-pharm Chemical Reagent Corp (Shanghai, China). Zinc acetate dihydrate (Zn(CH3COO)2·2H2O, analytical reagent) and potassium iodide (KI, analytical reagent) were purchased from CNW Technologies GmbH (Dusseldorf, Germany).

3.2. Preparation of the Catalysts

Ag/ZnO photocatalysts with different molar ratios of Ag and Zn (named as Ag/ZnO 100:1, etc.) were synthesized by a hydrothermal method [61]. AgI/ZnO photocatalysts with different molar ratios of ZnO and Ag (named as AgI/ZnO X = 0.1, etc.) were synthesized by a coprecipitation method. The details of preparation methods are described in the supporting information file.

3.3. Characterization

X-ray diffraction (XRD, Bruker D8 Advance X-ray diffractometer equipped with Cu-Kα radiation. λ = 1.5406 Å, the scanning rate is 10° min−1 and 2θ range is from 10° to 80°.) was used to examine the crystal structure of the photocatalyst. X-ray photoelectron spectroscopy (XPS) was carried out on a Kratos Supra instrument (Kratos Analytical, Manchester, UK) with monochromatic Al radiate (1486.7 eV, 150 W), to confirm surface composition and chemical bonds of the photocatalysts. UV-vis diffuse reflectance spectra (UV-vis DRS) were operated by UV-2550 spectrophotometer, Shimadzu, Japan. The photoluminescence spectroscopy (PL) of photocatalysts was tested on Edinburgh Instruments FLS980. Transmission electron microscopy (TEM) observation was performed by FEI Tecnai G2 F20 S-Twin. The zeta potential was measured by nano particle potentiometer: Malvern Zetasizer Nano ZS90. The possible silver ion stoic in the reaction system was detected by inductively coupled plasma mass spectrometry (ICPMS): Agilent 7700, USA. Electron spin resonance (EPR) spectra were performed on Bruker JES FA200.

3.4. Evaluation of Photocatalytic Activity

The photocatalytic activity was assessed by the degradation of MNZ under simulated sunlight irradiation. The light source was a 300 W Xenon lamp (PLS-SXE 300, Beijing Perfectlight Technology Co., Ltd. China). The light intensity of the reaction system surface was 100 mW cm−2. Typically, 100 mL MNZ solution with a concentration of 2 mg/L was added to a quartz reactor, 100 mg of the catalysts were added and mixed. During the experiment, when illuminated, water circulation was enabled to keep the reaction system at room temperature (25 °C). The samples were taken with disposable syringes every five minutes. When the effects of influencing factors were examined, the factors to be studied were changed while the others were controlled. A three-cycle experiment was conducted to evaluate the stability of the photocatalysts. The used catalysts were collected after each cycle by filtering of 0.45 μm polyether sulfone membranes, then washed and dried for the next cycle. The possible silver ions emission was detected by ICPMS.

3.5. Evaluation of Reactive Oxygen Species

There are several typical free radicals which are functional in photocatalysis: OH [36,37], O2, 1O2 and h+ [38]. A series of quencher experiments were conducted to determine which reactive species play a part in photodegradation. Isopropanol (10 mmol L−1) was selected as the quencher for ·OH, while benzoquinone (0.5 μmol L−1) for O2, sodium azide (0.5 μmol L−1) for 1O2 and EDTA disodium (0.5 μmol L−1) for h+. Moreover, the results were further verified by electron paramagnetic resonance spectrometer (MiniScope MS-5000, Magnettech, Germany).

3.6. Analytical Methods

The concentration of MNZ was measured by high-performance liquid chromatography (HPLC, Agilent 1200) with a diode array detector (DAD), using a C18 column (Athena C18-WP, 100 Å, 4.6 × 250 mm, 5 μm, CNW) at the wavelength of 318 nm. The mobile phases consisted acetonitrile and water. The byproducts during the degradation of MNZ was distinguished by LC–MS/MS (TSQ Quantum, Thermo Fisher Scientific). The mobile phases consisted acetonitrile and water with ammonium acetate and formic acid [4].

4. Conclusions

A series of Ag/ZnO and AgI/ZnO composites were successfully prepared by hydrothermal method and coprecipitation method, respectively. The deposition of Ag and AgI enhanced the photocatalytic activity of ZnO without changing its surface property and crystalline structure. Ag/ZnO (100:1) and AgI/ZnO (X = 0.4) have the best photocatalytic activity among all Ag/ZnO and AgI/ZnO composites, respectively. Under the same conditions, Ag/ZnO (100:1) performed better than AgI/ZnO (X = 0.4), the reaction rate constant of Ag/ZnO (100:1) is 3.25 times higher. The main drawback of Ag/ZnO is that it can be easily affected by the changes of reaction conditions. The efficiency of Ag/ZnO decreases after the reaction is because of the leaching of Ag+. AgI/ZnO is more stable. The main reactive oxygen species of the photocatalytic process are OH, O2 and h+. In Ag/ZnO system, OH and h+ play the leading role, O2 has a minor effect. In AgI/ZnO, system OH, O2 and h+ contribute to the photocatalytic process to a similar extent. Structural differences lead to the discrepancy between two catalysts. Ag/ZnO is a metal-semiconductor structure. With the SPR of Ag and defects on the interface of Ag and ZnO, the catalytic capability is enhanced. AgI/ZnO is a typical heterojunction structure, but the electron transportation is weaker than that of Ag/ZnO due to the discontinuous energy edges, resulting in the disparity of catalytic capability.

Supplementary Materials

The following are available online at https://www.mdpi.com/2073-4344/10/9/1097/s1, Figure S1: Kinetic analysis of photocatalytic degradation of MNZ with (a) Ag/ZnO, (b) AgI/ZnO. Figure S2: Kinetic analysis of photocatalytic degradation of MNZ in different initial pH conditions with (a) Ag/ZnO, (b) AgI/ZnO. Figure S3: Effect of pH on the Zeta potential and isoelectric point of (a) Ag/ZnO (100:1), and (b) AgI/ZnO (X = 0.4). Figure S4: TOC removal by Ag/ZnO (100:1) and AgI/ZnO (X = 0.4). Figure S5: The pseudo-first order apparent reaction rate constants (k) of different catalysts. Figure S6: The pseudo-first order apparent reaction rate constants (k) of MNZ photocatalytic degradation with (a) Ag/ZnO (100:1) and (b) AgI/ZnO (X = 0.4) under conditions of different initial MNZ concentrations. Figure S7: The pseudo-first order apparent reaction rate constants (k) of MNZ photocatalytic degradation with (a) Ag/ZnO (100:1) and (b) AgI/ZnO (X = 0.4) under different initial pH conditions.

Author Contributions

C.D.: data curation; K.F.: Formal analysis; Y.P.: Methodology; J.L.: data curation; H.D.: Funding acquisition, Supervision; J.S.: Methodology, Project administration. All authors have read and agreed to the published version of the manuscript.

Funding

This research received no external funding.

Acknowledgments

This study was supported by the Major Science and Technology Program for Water Pollution Control and Treatment (2017ZX07201003 and 2017ZX07501001), China.

Conflicts of Interest

The authors declare no conflict of interest.

References

  1. Al, A.E.; Elasala, G.S.; Ibrahim, R.S. Synthesis, Characterization, spectral, thermal analysis and Biological Activity studies of metronidazole complexes. J. Mol. Struct. 2018, 1176, 673–684. [Google Scholar] [CrossRef]
  2. Santana, D.R.; Espino-Estévez, M.R.; Santiago, D.E.; Méndez, J.A.O.; González-Díaz, O.; Doña-Rodríguez, J.M. Treatment of aquaculture wastewater contaminated with metronidazole by advanced oxidation techniques. Environ. Nanotechnol. Monit. Manag. 2017, 8, 11–24. [Google Scholar] [CrossRef]
  3. Aboudalle, A.; Djelal, H.; Fourcade, F.; Domergue, L.; Assadi, A.A.; Lendormi, T.; Taha, S.; Amrane, A. Metronidazole removal by means of a combined system coupling an electro-Fenton process and a conventional biological treatment: By-products monitoring and performance enhancement. J. Hazard. Mater. 2018, 359, 85–95. [Google Scholar] [CrossRef] [PubMed]
  4. Tian, W.; Gao, L.; Zhao, Y.; Peng, W.; Chen, Z. Simultaneous determination of metronidazole, chloramphenicol and 10 sulfonamide residues in honey by LC–MS/MS. Anal. Methods 2013, 5, 1283–1288. [Google Scholar] [CrossRef]
  5. Gomez, M.J.; Malato, O.; Ferrer, I.; Aguera, A.; Fernandez-Alba, A.R. Solid-phase extraction followed by liquid chromatography-time-of-flight-mass spectrometry to evaluate pharmaceuticals in effluents. A pilot monitoring study. J. Environ. Monit. 2007, 9, 718–729. [Google Scholar] [CrossRef] [PubMed]
  6. Rosal, R.; Rodriguez, A.; Perdigon-Melon, J.A.; Petre, A.; Garcia-Calvo, E.; Gomez, M.J.; Aguera, A.; Fernandez-Alba, A.R. Occurrence of emerging pollutants in urban wastewater and their removal through biological treatment followed by ozonation. Water Res. 2010, 44, 578–588. [Google Scholar] [CrossRef]
  7. Hilla, S.K.; Kunukcu, Y.K.; Linden, K.G. Degradation of the pharmaceutical metronidazole via UV, Fenton and photo-Fenton processes. Chemosphere 2006, 63, 269–276. [Google Scholar]
  8. Kitsiou, V.; Filippidis, N.; Mantzavinos, D.; Poulios, I. Heterogeneous and homogeneous photocatalytic degradation of the insecticide imidacloprid in aqueous solutions. Appl. Catal. B Environ. 2009, 86, 27–35. [Google Scholar] [CrossRef]
  9. Kümmerer, K. Drugs in the environment: Emission of drugs, diagnostic aids and disinfectants into wastewater by hospitals in relation to other sources—A review. Chemosphere 2001, 45, 957–969. [Google Scholar] [CrossRef]
  10. Dantas, R.F.; Rossiter, O.; Teixeira, A.K.R.; Simões, A.S.M.; Da Silva, V.L.D. Direct UV photolysis of propranolol and metronidazole in aqueous solution. Chem. Eng. J. 2010, 158, 143–147. [Google Scholar] [CrossRef]
  11. Aboudalle, A.; Fourcade, F.; Assadi, A.A.; Domergue, L.; Djelal, H.; Lendormi, T.; Taha, S.; Amrane, A. Reactive oxygen and iron species monitoring to investigate the electro-Fenton performances. Impact of the electrochemical process on the biodegradability of metronidazole and its by-products. Chemosphere 2018, 199, 486–494. [Google Scholar] [CrossRef] [PubMed]
  12. Luo, T.; Wang, M.; Tian, X.; Nie, Y.; Yang, C.; Lin, H.-M.; Luo, W.; Wang, Y. Safe and efficient degradation of metronidazole using highly dispersed beta-FeOOH on palygorskite as heterogeneous Fenton-like activator of hydrogen peroxide. Chemosphere 2019, 236, 124367. [Google Scholar] [CrossRef] [PubMed]
  13. Yi, Y.Q.; Tu, G.Q.; Zhao, D.Y.; Tsang, P.E.; Fang, Z.Q. Pyrolysis of different biomass pre-impregnated with steel pickling waste liquor to prepare magnetic biochars and their use for the degradation of metronidazole. Bioresour. Technol. 2019, 289, 121613. [Google Scholar] [CrossRef] [PubMed]
  14. Pan, Y.; Li, X.; Fu, K.; Deng, H.; Shi, J. Degradation of metronidazole by UV/chlorine treatment: Efficiency, mechanism, pathways and DBPs formation. Chemosphere 2019, 224, 228–236. [Google Scholar] [CrossRef]
  15. Sun, Q.; Zhu, G.C.; Wu, J.; Lu, J.; Zhang, Z.H. Simultaneous catalytic ozonation degradation of metronidazole and removal of heavy metal from aqueous solution using nano-magnesium hydroxide. Environ. Technol. 2019. [Google Scholar] [CrossRef] [PubMed]
  16. Farzadkia, M.; Esrafili, A.; Baghapour, M.A.; Shahamat, Y.D.; Okhovat, N. Degradation of metronidazole in aqueous solution by nano-ZnO/UV photocatalytic process. Desalin. Water Treat. 2014, 52, 4947–4952. [Google Scholar] [CrossRef]
  17. Nogueira, A.C.; Gomes, L.E.; Ferencz, J.A.P.; Rodrigues, J.E.F.S.; Gonçalves, R.V.; Wender, H. Improved Visible Light Photoactivity of CuBi2O4/CuO Heterojunctions for Photodegradation of Methylene Blue and Metronidazole. J. Phys. Chem. C 2019, 123, 25680–25690. [Google Scholar] [CrossRef]
  18. Tran, M.L.; Fu, C.; Juang, R. Effects of water matrix components on degradation efficiency and pathways of antibiotic metronidazole by UV/TiO2 photocatalysis. J. Mol. Liq. 2019, 276, 32–38. [Google Scholar] [CrossRef]
  19. Tran, M.L.; Nguyen, C.H.; Fu, C.-C.; Juang, R.-S. Hybridizing Ag-Doped ZnO nanoparticles with graphite as potential photocatalysts for enhanced removal of metronidazole antibiotic from water. J. Environ. Manag. 2019, 252, 109611. [Google Scholar] [CrossRef]
  20. Bahareh, K.; Habibi, M.H. High photocatalytic activity of light-driven Fe2TiO5 nanoheterostructure toward degradation of antibiotic metronidazole. J. Ind. Eng. Chem. 2019, 80, 292–300. [Google Scholar] [CrossRef]
  21. Pawar, R.C.; Lee, C.S. Single-step sensitization of reduced graphene oxide sheets and CdS nanoparticles on ZnO nanorods as visible-light photocatalysts. Appl. Catal. B Environ. 2014, 144, 57–65. [Google Scholar] [CrossRef]
  22. Vaiano, V.; Matarangolo, M.; Murcia, J.J.; Rojas, H.; Navío, J.A.; Hidalgo, M.C. Enhanced photocatalytic removal of phenol from aqueous solutions using ZnO modified with Ag. Appl. Catal. B Environ. 2018, 225, 197–206. [Google Scholar] [CrossRef]
  23. Sakthivel, S.; Neppolian, B.; Shankar, M.V.; Arabindoo, B.; Palanichamy, M.; Murugesan, V. Solar photocatalytic degradation of azo dye: Comparison of photocatalytic efficiency of ZnO and TiO2. Sol. Energy Mater. Sol. Cells 2003, 77, 65–82. [Google Scholar] [CrossRef]
  24. Sun, F.Z.; Qiao, X.L.; Tan, F.T.; Wang, W.; Qiu, X.L. One-step microwave synthesis of Ag/ZnO nanocomposites with enhanced photocatalytic performance. J. Mater. Sci. 2012, 47, 7262–7268. [Google Scholar] [CrossRef]
  25. Fei, J.B.; Li, J.B. Controlled Preparation of Porous TiO2-Ag Nanostructures through Supramolecular Assembly for Plasmon-Enhanced Photocatalysis. Adv. Mater. 2014, 27, 314–319. [Google Scholar] [CrossRef] [PubMed]
  26. El-Sayed, M.A. Some interesting properties of metals confined in time and nanometer space of different shapes. Acc. Chem. Res. 2001, 34, 257–264. [Google Scholar] [CrossRef] [PubMed]
  27. Jana, N.R.; Sau, T.K.; Pal, T. Growing small silver particle as redox catalyst. J. Phys. Chem. B 1999, 103, 115–121. [Google Scholar] [CrossRef]
  28. Jiang, J.; Li, H.; Zhang, L. New insight into daylight photocatalysis of AgBr@Ag: Synergistic effect between semiconductor photocatalysis and plasmonic photocatalysis. Chemistry 2012, 18, 6360–6369. [Google Scholar] [CrossRef]
  29. Cheng, H.; Huang, B.; Dai, Y.; Qin, X.; Zhang, X. One-step synthesis of the nanostructured AgI/BiOI composites with highly enhanced visible-light photocatalytic performances. Langmuir 2010, 26, 6618–6624. [Google Scholar] [CrossRef]
  30. Victora, R.H. Calculated electronic structure of silver halide crystals. Phys. Rev. B 1997, 56, 4417–4421. [Google Scholar] [CrossRef]
  31. Wang, X.; Wan, X.; Xu, X.; Chen, X. Facile fabrication of highly efficient AgI/ZnO heterojunction and its application of methylene blue and rhodamine B solutions degradation under natural sunlight. Appl. Surf. Sci. 2014, 321, 10–18. [Google Scholar] [CrossRef]
  32. Adhikari, S.P.; Pant, H.R.; Kim, J.H.; Kim, H.J.; Park, C.H.; Kim, C.S. One pot synthesis and characterization of Ag-ZnO/g-C 3 N 4 photocatalyst with improved photoactivity and antibacterial properties. Colloids Surf. A Physicochem. Eng. Asp. 2015, 482, 477–484. [Google Scholar] [CrossRef]
  33. Shaker-Agjekandy, S.; Habibi-Yangjeh, A. Facile one-pot method for preparation of AgI/ZnO nanocomposites as visible-light-driven photocatalysts with enhanced activities. Mater. Sci. Semicond. Process. 2015, 34, 74–81. [Google Scholar] [CrossRef]
  34. Jaramillo-Paez, C.; Navio, J.A.; Hidalgo, M.C.; Macias, M. High UV-photocatalytic activity of ZnO and Ag/ZnO synthesized by a facile method. Catal. Today 2017, 284, 121–128. [Google Scholar] [CrossRef]
  35. Gao, L.K.; Gan, W.T.; Xiao, S.L.; Zhan, X.X.; Li, J. A robust superhydrophobic antibacterial Ag-TiO2 composite film immobilized on wood substrate for photodegradation of phenol under visible-light illumination. Ceram. Int. 2016, 42, 2170–2179. [Google Scholar] [CrossRef]
  36. Zheng, Y.; Zheng, L.; Zhan, Y.; Lin, X.; Zheng, Q.; Wei, K. Ag/ZnO heterostructure nanocrystals: Synthesis, characterization, and photocatalysis. Inorg. Chem. 2007, 46, 6980–6986. [Google Scholar] [CrossRef]
  37. Herrmann, J.-M. Heterogeneous photocatalysis: Fundamentals and applications to the removal of various types of aqueous pollutants. Catal. Today 1999, 53, 115–129. [Google Scholar] [CrossRef]
  38. Palominos, R.; Freer, J.; Mondaca, M.A.; Mansilla, H.D. Evidence for hole participation during the photocatalytic oxidation of the antibiotic flumequine. J. Photochem. Photobiol. A-Chem. 2008, 193, 139–145. [Google Scholar] [CrossRef]
  39. Chamjangali, M.A.; Bagherian, G.; Javid, A.; Boroumand, S.; Farzaneh, N. Synthesis of Ag-ZnO with multiple rods (multipods) morphology and its application in the simultaneous photo-catalytic degradation of methyl orange and methylene blue. Spectrochim. Acta Part A Mol. Biomol. Spectrosc. 2015, 150, 230–237. [Google Scholar] [CrossRef]
  40. Sun, L.; Shao, R.; Tang, L.; Chen, Z. Synthesis of ZnFe2O4/ZnO nanocomposites immobilized on graphene with enhanced photocatalytic activity under solar light irradiation. J. Alloys Compd. 2013, 564, 55–62. [Google Scholar] [CrossRef]
  41. Zhang, W.; Zhou, L.; Deng, H. Ag modified g-C 3 N 4 composites with enhanced visible-light photocatalytic activity for diclofenac degradation. J. Mol. Catal. A Chem. 2016, 423, 270–276. [Google Scholar] [CrossRef]
  42. Shu, J.X.; Wang, Z.H.; Xia, G.Q.; Zheng, Y.Y.; Yang, L.H.; Zhang, W. One-pot synthesis of AgCl@Ag hybrid photocatalyst with high photocatalytic activity and photostability under visible light and sunlight irradiation. Chem. Eng. J. 2014, 252, 374–381. [Google Scholar] [CrossRef]
  43. Reddy, D.A.; Choi, J.; Lee, S.; Kim, T.K. Controlled synthesis of heterostructured Ag@AgI/ZnS microspheres with enhanced photocatalytic activity and selective separation of methylene blue from mixture dyes. J. Taiwan Inst. Chem. Eng. 2016, 66, 200–209. [Google Scholar] [CrossRef]
  44. Chen, C.; Zheng, Y.; Zhan, Y.; Lin, X.; Zheng, Q.; Wei, K. Enhanced Raman scattering and photocatalytic activity of Ag/ZnO heterojunction nanocrystals. Dalton Trans. 2011, 40, 9566–9570. [Google Scholar] [CrossRef] [PubMed]
  45. Ansari, S.A.; Khan, M.M.; Ansari, M.O.; Lee, J.; Cho, M.H. Biogenic Synthesis, Photocatalytic, and Photoelectrochemical Performance of Ag–ZnO Nanocomposite. J. Phys. Chem. C 2013, 117, 27023–27030. [Google Scholar] [CrossRef] [Green Version]
  46. Sarma, B.; Sarma, B.K. Fabrication of Ag/ZnO heterostructure and the role of surface coverage of ZnO microrods by Ag nanoparticles on the photophysical and photocatalytic properties of the metal-semiconductor system. Appl. Surf. Sci. 2017, 410, 557–565. [Google Scholar] [CrossRef]
  47. Georgekutty, R.; Seery, M.K.; Pillai, S.C. A highly efficient Ag-ZnO photocatalyst: Synthesis, properties, and mechanism. J. Phys. Chem. C 2008, 112, 13563–13570. [Google Scholar] [CrossRef] [Green Version]
  48. Liu, H.R.; Shao, G.X.; Zhao, J.F.; Zhang, Z.X.; Zhang, Y.; Liang, J.; Liu, X.G.; Jia, H.S.; Xu, B.S. Worm-Like Ag/ZnO Core–Shell Heterostructural Composites: Fabrication, Characterization, and Photocatalysis. J. Phys. Chem. C 2012, 116, 16182–16190. [Google Scholar] [CrossRef]
  49. LiQiang, J.; Dejun, W.; Baiqi, W.; Shudan, L.; Baifu, X.; Honggang, F.; Jiazhong, S. Effects of noble metal modification on surface oxygen composition, charge separation and photocatalytic activity of ZnO nanoparticles. J. Mol. Catal. A Chem. 2006, 244, 193–200. [Google Scholar] [CrossRef]
  50. Linsebigler, A.L.; Lu, G.Q.; Yates, J.T. Photocatalysis on TiO2 Surfaces—Principles, Mechanisms, and Selected Results. Chem. Rev. 1995, 95, 735–758. [Google Scholar] [CrossRef]
  51. Huang, H.; Huang, N.; Wang, Z.; Xia, G.; Chen, M.; He, L.; Tong, Z.; Ren, C. Room-temperature synthesis of carnation-like ZnO@AgI hierarchical nanostructures assembled by AgI nanoparticles-decorated ZnO nanosheets with enhanced visible light photocatalytic activity. J. Colloid Interface Sci. 2017, 502, 77–88. [Google Scholar] [CrossRef] [PubMed]
  52. Zhou, X.D.; Xiao, X.H.; Xu, J.X.; Cai, G.X.; Ren, F.; Jiang, C.Z. Mechanism of the enhancement and quenching of ZnO photoluminescence by ZnO-Ag coupling. EPL (Europhys. Lett.) 2011, 93, 57009. [Google Scholar] [CrossRef]
  53. Lin, D.; Wu, H.; Zhang, R.; Pan, W. Enhanced Photocatalysis of Electrospun Ag−ZnO Heterostructured Nanofibers. Chem. Mater. 2009, 21, 3479–3484. [Google Scholar] [CrossRef]
  54. Zhang, Z.; Yates, J.T., Jr. Band bending in semiconductors: Chemical and physical consequences at surfaces and interfaces. Chem. Rev. 2012, 112, 5520–5551. [Google Scholar] [CrossRef]
  55. Shaker-Agjekandy, S.; Habibi-Yangjeh, A. Ultrasonic-assisted preparation of novel ternary ZnO/AgI/Ag2CrO4 nanocomposites as visible-light-driven photocatalysts with excellent activity. Mater. Sci. Semicond. Process. 2016, 44, 48–56. [Google Scholar] [CrossRef]
  56. Kim, J.; Lee, C.W.; Choi, W. Platinized WO3 as an Environmental Photocatalyst that Generates OH Radicals under Visible Light. Environ. Sci. Technol. 2010, 44, 6849–6854. [Google Scholar] [CrossRef] [PubMed]
  57. Chen, X.H.; Chen, Y.T.; Ren, F.F.; Gu, S.L.; Tan, H.H.; Jagadish, C.; Ye, J.D. Band alignment and band bending at α-Ga2O3/ZnO n-n isotype hetero-interface. Appl. Phys. Lett. 2019, 115, 202101. [Google Scholar] [CrossRef]
  58. Wu, D.; Long, M. Realizing Visible-Light-Induced Self-Cleaning Property of Cotton through Coating N-TiO2 Film and Loading AgI Particles. ACS Appl. Mater. Interfaces 2011, 3, 4770–4774. [Google Scholar] [CrossRef]
  59. Pérez, T.; Garcia-Segura, S.; El-Ghenymy, A.; Nava, J.L.; Brillas, E. Solar photoelectro-Fenton degradation of the antibiotic metronidazole using a flow plant with a Pt/air-diffusion cell and a CPC photoreactor. Electrochim. Acta 2015, 165, 173–181. [Google Scholar] [CrossRef]
  60. Ammar, H.B.; Brahim, M.B.; Abdelhédi, R.; Samet, Y. Green electrochemical process for metronidazole degradation at BDD anode in aqueous solutions via direct and indirect oxidation. Sep. Purif. Technol. 2016, 157, 9–16. [Google Scholar] [CrossRef]
  61. Ammar, H.B.; Brahim, M.B.; Abdelhédi, R.; Samet, Y. Enhanced degradation of metronidazole by sunlight via photo-Fenton process under gradual addition of hydrogen peroxide. J. Mol. Catal. A Chem. 2016, 420, 222–227. [Google Scholar] [CrossRef]
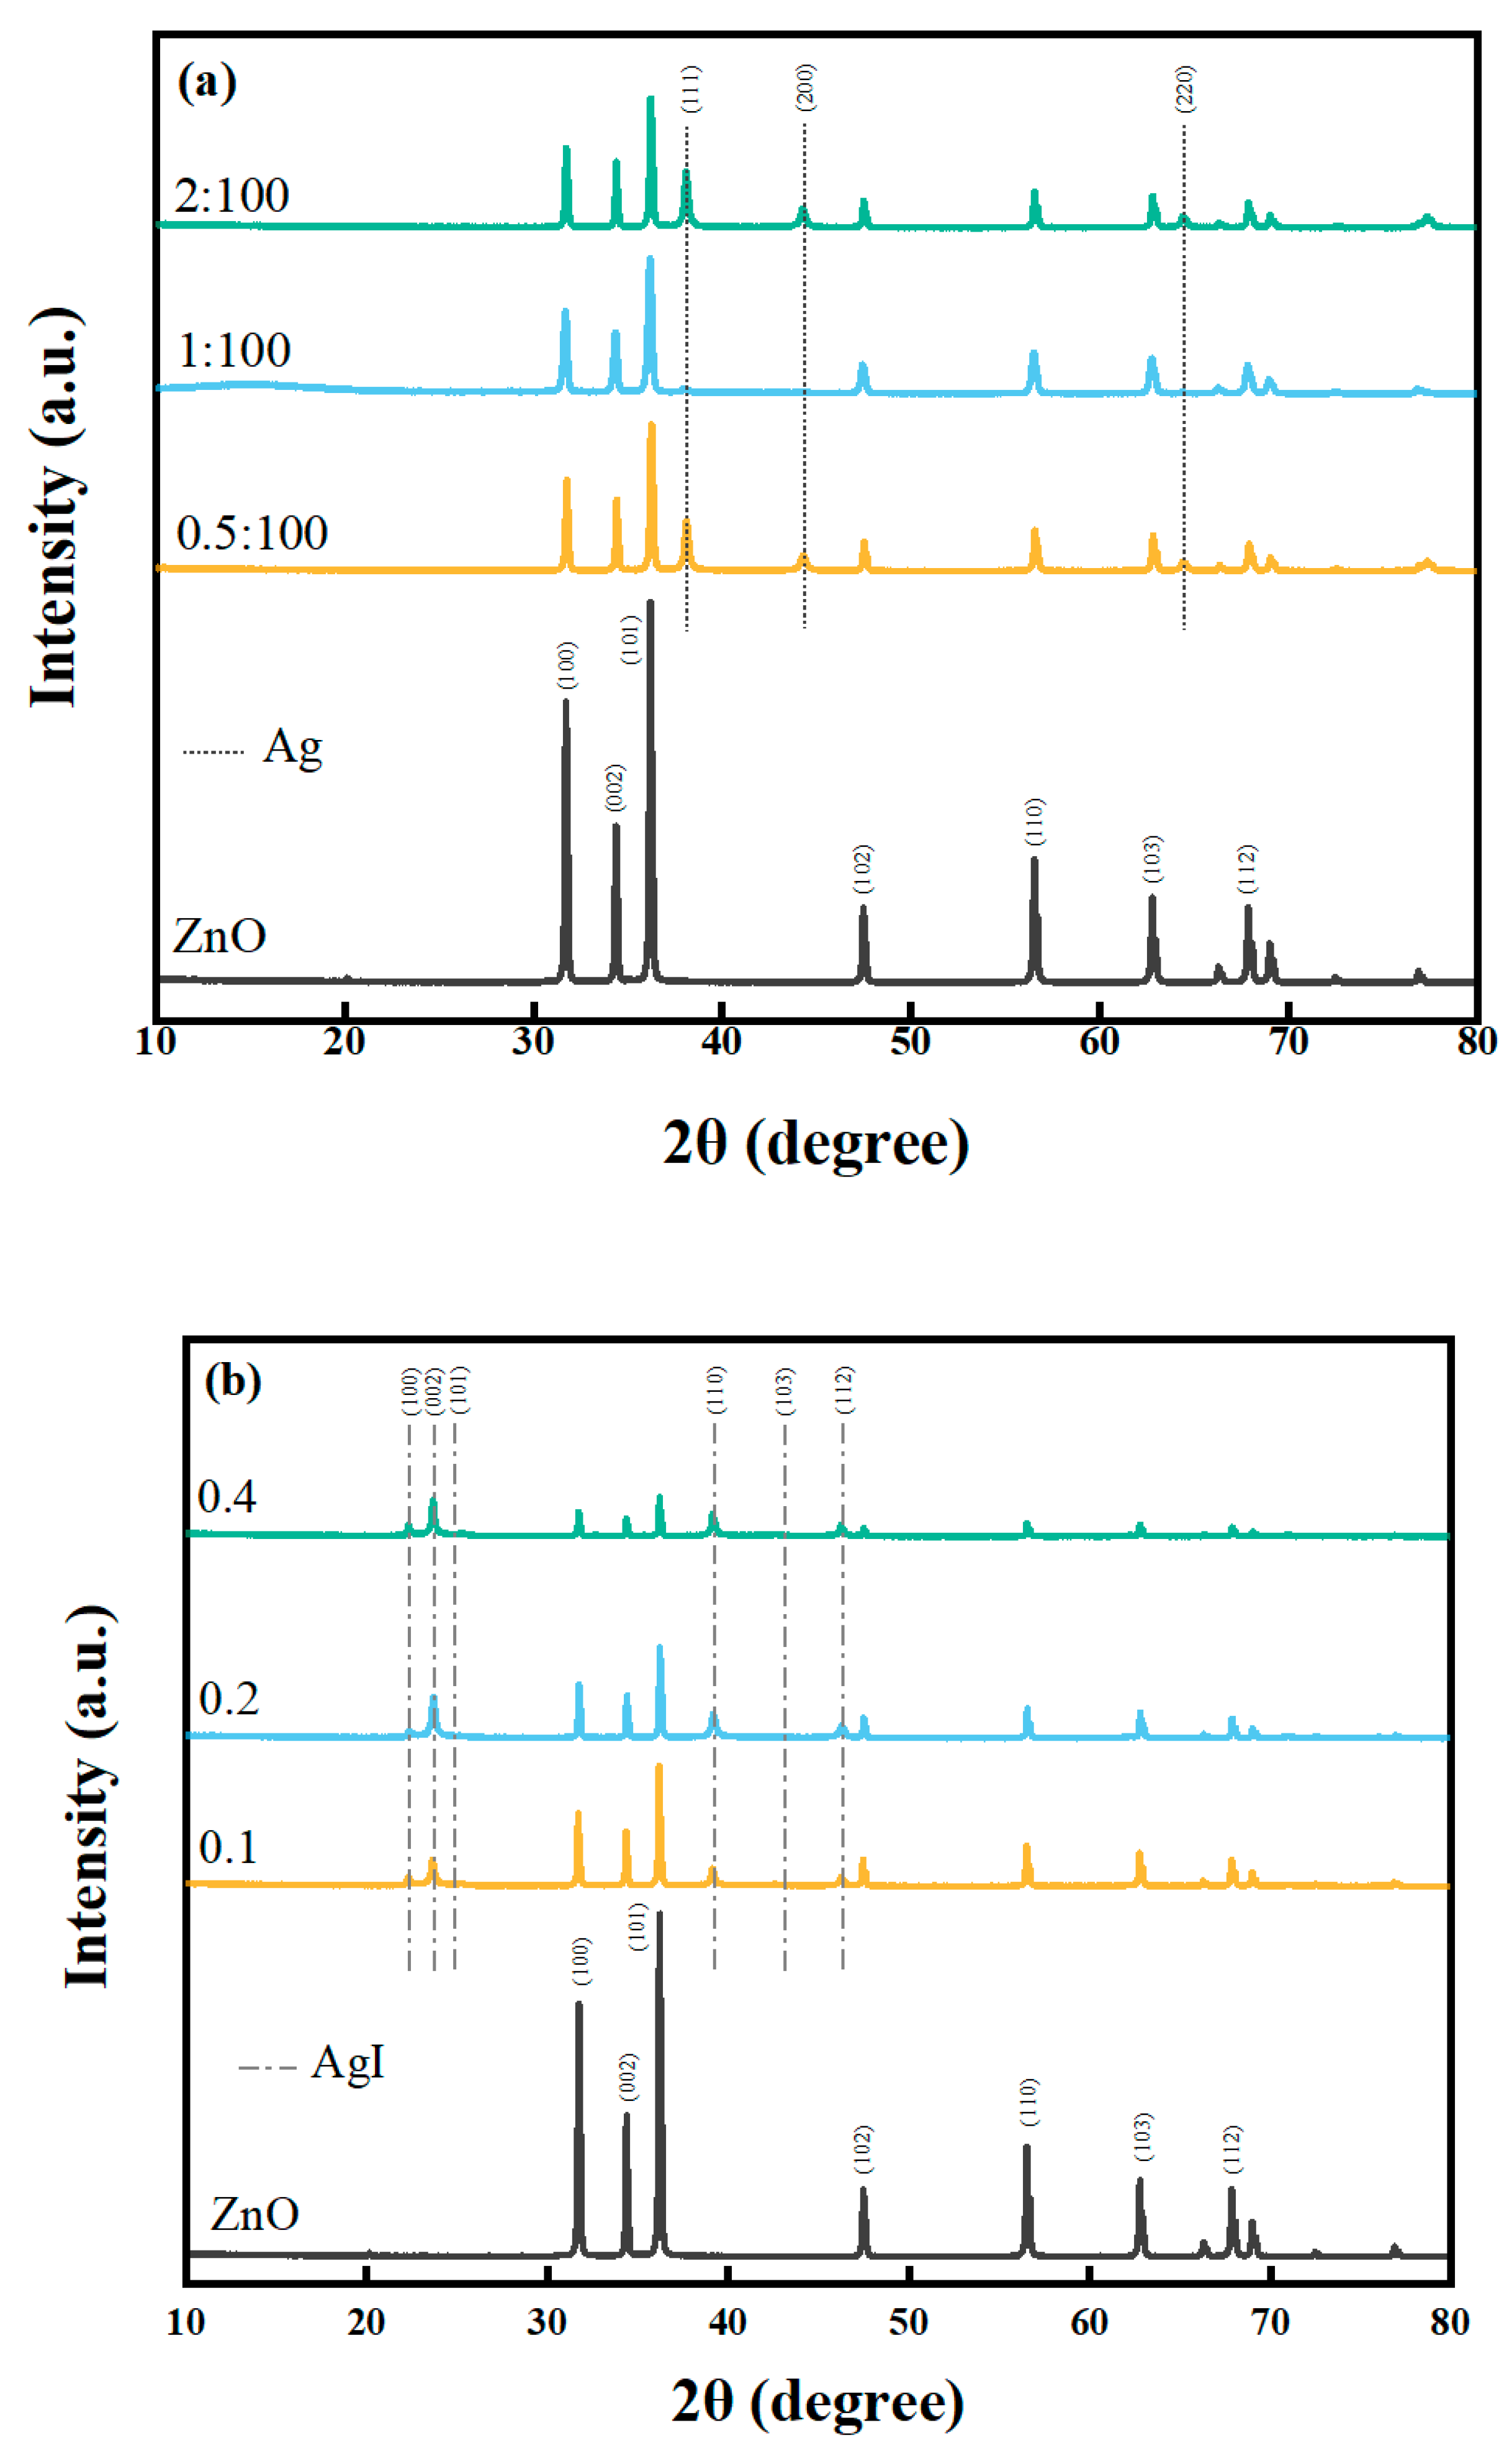
Figure 1. XRD patterns of different Ag/ZnO and AgI/ZnO photocatalysts in the range 10–80°. (a) Ag/ZnO, (b) AgI/ZnO.
Catalysts 10 01097 g001
Figure 2. XPS spectra of Ag/ZnO (100:1). (a) Zn 2p, (b) O 1s, (c) Ag 3d.
Catalysts 10 01097 g002
Figure 3. XPS spectra of AgI/ZnO (X = 0.4). (a) Zn 2p, (b) O 1s, (c) Ag 3d, (d) I 3d.
Catalysts 10 01097 g003aCatalysts 10 01097 g003b
Figure 4. (a) UV-vis spectra and (b) plots of (αhν)2 versus energy (hν) of all prepared photocatalysts Ag/ZnO.
Catalysts 10 01097 g004
Figure 5. (a) UV-vis spectra and (b) plots of (αhν)2 versus energy (hν) of all prepared photocatalysts AgI/ZnO.
Catalysts 10 01097 g005
Figure 6. PL spectra of (a) Ag/ZnO, (b) AgI/ZnO.
Catalysts 10 01097 g006
Figure 7. TEM images of Ag/ZnO (100:1), (a) 100 nm, (b) 50 nm, (c) 20 nm.
Catalysts 10 01097 g007
Figure 8. TEM images of AgI/ZnO (X = 0.4). (a) 100 nm, (b,c) 50 nm.
Catalysts 10 01097 g008
Figure 9. (ac) EDS mapping of Ag/ZnO (100:1); (df) SEM images of Ag/ZnO (100:1).
Catalysts 10 01097 g009
Figure 10. (ad) EDS mapping of AgI/ZnO (X = 0.4); (eg) SEM images of AgI/ZnO (X = 0.4).
Catalysts 10 01097 g010
Figure 11. Photocatalytic degradation of MNZ under simulated sunlight with (a) Ag/ZnO, (b) AgI/ZnO, of MNZ.
Catalysts 10 01097 g011
Figure 12. Effects of initial concentration on MNZ photodegradation under simulated sunlight with (a) Ag/ZnO (100:1) and (b) AgI/ZnO (X = 0.4).
Catalysts 10 01097 g012
Figure 13. Effect of initial pH for MNZ photodegradation by (a) Ag/ZnO (100:1) and (b) AgI/ZnO (X = 0.4) as catalysts.
Catalysts 10 01097 g013aCatalysts 10 01097 g013b
Figure 14. Effects of different quenchers for the photodegradation of MNZ under simulated sunlight irradiation with (a) Ag/ZnO (100:1) and (b) AgI/ZnO (X = 0.4).
Catalysts 10 01097 g014
Figure 15. EPR patterns of OH and O2 in the photodegradation of MNZ under simulated sunlight irradiation with Ag/ZnO (100:1) and AgI/ZnO (X = 0.4).
Catalysts 10 01097 g015
Figure 16. Proposed band structure and photocatalytic mechanism of (a) Ag/ZnO [57], (b) AgI/ZnO.
Catalysts 10 01097 g016aCatalysts 10 01097 g016b
Figure 17. Degradation pathway of MNZ during the reaction. MNZ C0 = 2 mg L−1, photocatalyst dosage = 0.1 g L−1.
Catalysts 10 01097 g017
Figure 18. (a,c) Circling runs of MNZ photodegradation in the presence of the photocatalysts Ag/ZnO (100:1) and AgI/ZnO (X = 0.4); (b,d) XRD patterns of photocatalysts Ag/ZnO (100:1) and AgI/ZnO (X = 0.4) before and after MNZ photodegradation under simulated sunlight irradiation. MNZ’s initial concentration is 2 mg L−1, photocatalyst dosage is 0.1 g L−1.
Catalysts 10 01097 g018aCatalysts 10 01097 g018b