Article

Promoting Role of Amorphous Carbon and Carbon Nanotubes Growth Modes of Methane Decomposition in One-Pot Catalytic Approach

by
Lifang Chen
1,*,
Luis Enrique Noreña
2,*,
Jin An Wang
1,
Roberto Limas
1,
Ulises Arellano
3 and
Oscar Arturo González Vargas
4
1
Escuela Superior de Ingeniería Química e Industrias Extractivas, Instituto Politécnico Nacional, Av. Instituto Politécnico Nacional s/n, Col. Zacatenco, Ciudad de México 07738, Mexico
2
Departamento de Ciencias Básicas, Universidad Autónoma Metropolitana-Azcapotzalco, Av. San Pablo 180, Ciudad de México 02200, Mexico
3
Departamento de Química, Universidad Autónoma Metropolitana-Iztapalapa, Av. San Rafael Atlixco No. 186, Ciudad de México 09340, Mexico
4
Departamento de Ingeniería en Control y|Automatización, Escuela Superior de Ingeniería Mecánica y Eléctrica-Zacatenco, Instituto Politécnico Nacional, Av. Instituto Politécnico Nacional s/n, Col. Zacatenco, Ciudad de México 07738, Mexico
*
Authors to whom correspondence should be addressed.
Catalysts 2021, 11(10), 1217; https://doi.org/10.3390/catal11101217
Submission received: 8 September 2021 / Revised: 30 September 2021 / Accepted: 3 October 2021 / Published: 9 October 2021

Abstract

:
We report the simultaneous production of hydrogen fuel and carbon nanotubes (CNTs) via methane dehydrogenation catalyzed with Ni/SBA-15. Most Ni nanoparticles (NPs) with size between 10 and 30 nm were highly dispersed on SBA-15 and most of them had a strong interaction with the support. At temperatures ranging from 500 to 800 °C, methane could be decomposed to release hydrogen with 100% selectivity at conversion between 51 and 65%. There was no CO or CO2 detectable in the reaction fluent. In the initial stage of the reaction, amorphous carbon and dehydrogenated methane species adsorbed on the Ni NPs promoted the CH4 decomposition. The amorphous carbon atoms were then transformed into carbon nanotubes which chiefly consisted of a multiwall structure and grew towards different orientations via a tip-growth or a base-growth modes, controlled by the interaction strength between the Ni NPs and the SBA-15 support. Reaction temperature affected not only methane conversion, but also the diffusion of carbon atoms on/in the Ni NPs and their precipitation at the interfaces. At higher temperature, bamboo-like CNTs or onion-like metal-encapsulated carbons were formed, mainly due to the rate of carbon atom formation greater than that of carbon precipitation for CNTs construction. The CNTs formation mechanisms are discussed and their growth modes under different conditions are proposed.

Graphical Abstract

1. Introduction

Natural gas is a versatile and efficient fuel resource with a wide spectrum of applications, principally in the electronic power plants, residential and transportation uses. In comparison with the coal-fired power plants, natural gas-fired plants are environmentally friendly as they release far less carbon monoxide, nitrogen oxides, and particulates. The value of natural gas can be further upgraded by widening its utilization. One of the alternatives is to use it for the simultaneous production of COx–free hydrogen-rich fuel and nanocarbon materials through a one-pot catalytic approach, i.e., the catalytic decomposition technique [1,2,3,4,5]. It is a fully green chemistry process due to zero pollutants release. As the products of this catalytic process are gaseous hydrogen and solid carbon, they can be automatically separated. Particularly, this reaction does not produce CO and CO2; there is no need of subsequent processes for COx separation.
For hydrogen production, methane catalytic decomposition is better than the steam reforming process from an economical point of view. It is also superior to the photocatalytic spilling of water from a technical and efficiency point of view [6,7]. Moreover, carbon nanomaterials as co-products can be also obtained from this technical route [8]. Carbon nanomaterials have extraordinary properties including chemical stability, electric conductivity, catalytic activity, and a wide range of applications in the fields of the electronic industry [9,10], optical engineering [11], pharmaceutical production [12], cathode catalysis for fuel cells [13,14], and environmental control such as wastewater treatment and toxic gases adsorption and separation [15,16].
Designing of an effective catalyst is the key for the application of methane catalytic decomposition technique. Usually, non-reducible oxides such as Al2O3, MgO, SiO2, and MgAl2O4 solids have been used as support materials [17,18,19,20]. Mesoporous materials like MCM-41 were also reported as support for methane decomposition [21,22]. For the selection of active phases, the transition metals in the VIII A group (Fe, Co, and Ni) have been commonly used as active phases in the catalyst design [8,21,22,23,24,25,26]. Some researchers focused on the use of unsupported catalysts such as Fe-Ni, Ni-Co-Cu, or Fe-Co-Cu alloys prepared by the high energy ball milling method for hydrogen production [27,28,29]. Various feedstocks such as natural gas (methane, acetylene, and their mixture, etc.), polymers and waste plastics (low density polyethylene, polypropylene, etc.) were used to produce hydrogen, liquid fuels, and carbon nanomaterials [30,31,32].
In the methane catalytic decomposition reaction, both amorphous and graphite carbons are formed. Effects of their formation on the methane decomposition reaction are still under investigation. Li et al. reported that a high degree of graphitization at high temperature was the key factor resulting in the catalytic deactivation of Ni-Cu-SiO2 catalysts [27]. During methane decomposition various nanocarbon materials including amorphous carbons and CNTs can be formed. The influence of the amorphous carbon produced in the initial reaction stage on the catalytic decomposition of methane has not been reported yet.
In the present work, we selected Ni NPs as active phase, due to its high activity and low cost, and SBA-15 as support, because of its highly ordered pore system, large surface area and high thermal stability. Some new findings of the promoting effect of amorphous carbon generated in the initial reaction stage on the catalytic behaviors were reported. The formation mechanisms and the growth modes of five kinds of nanocarbons including CNTs, bamboo-like and onion-like carbons under different reaction conditions were proposed.

2. Results and Discussion

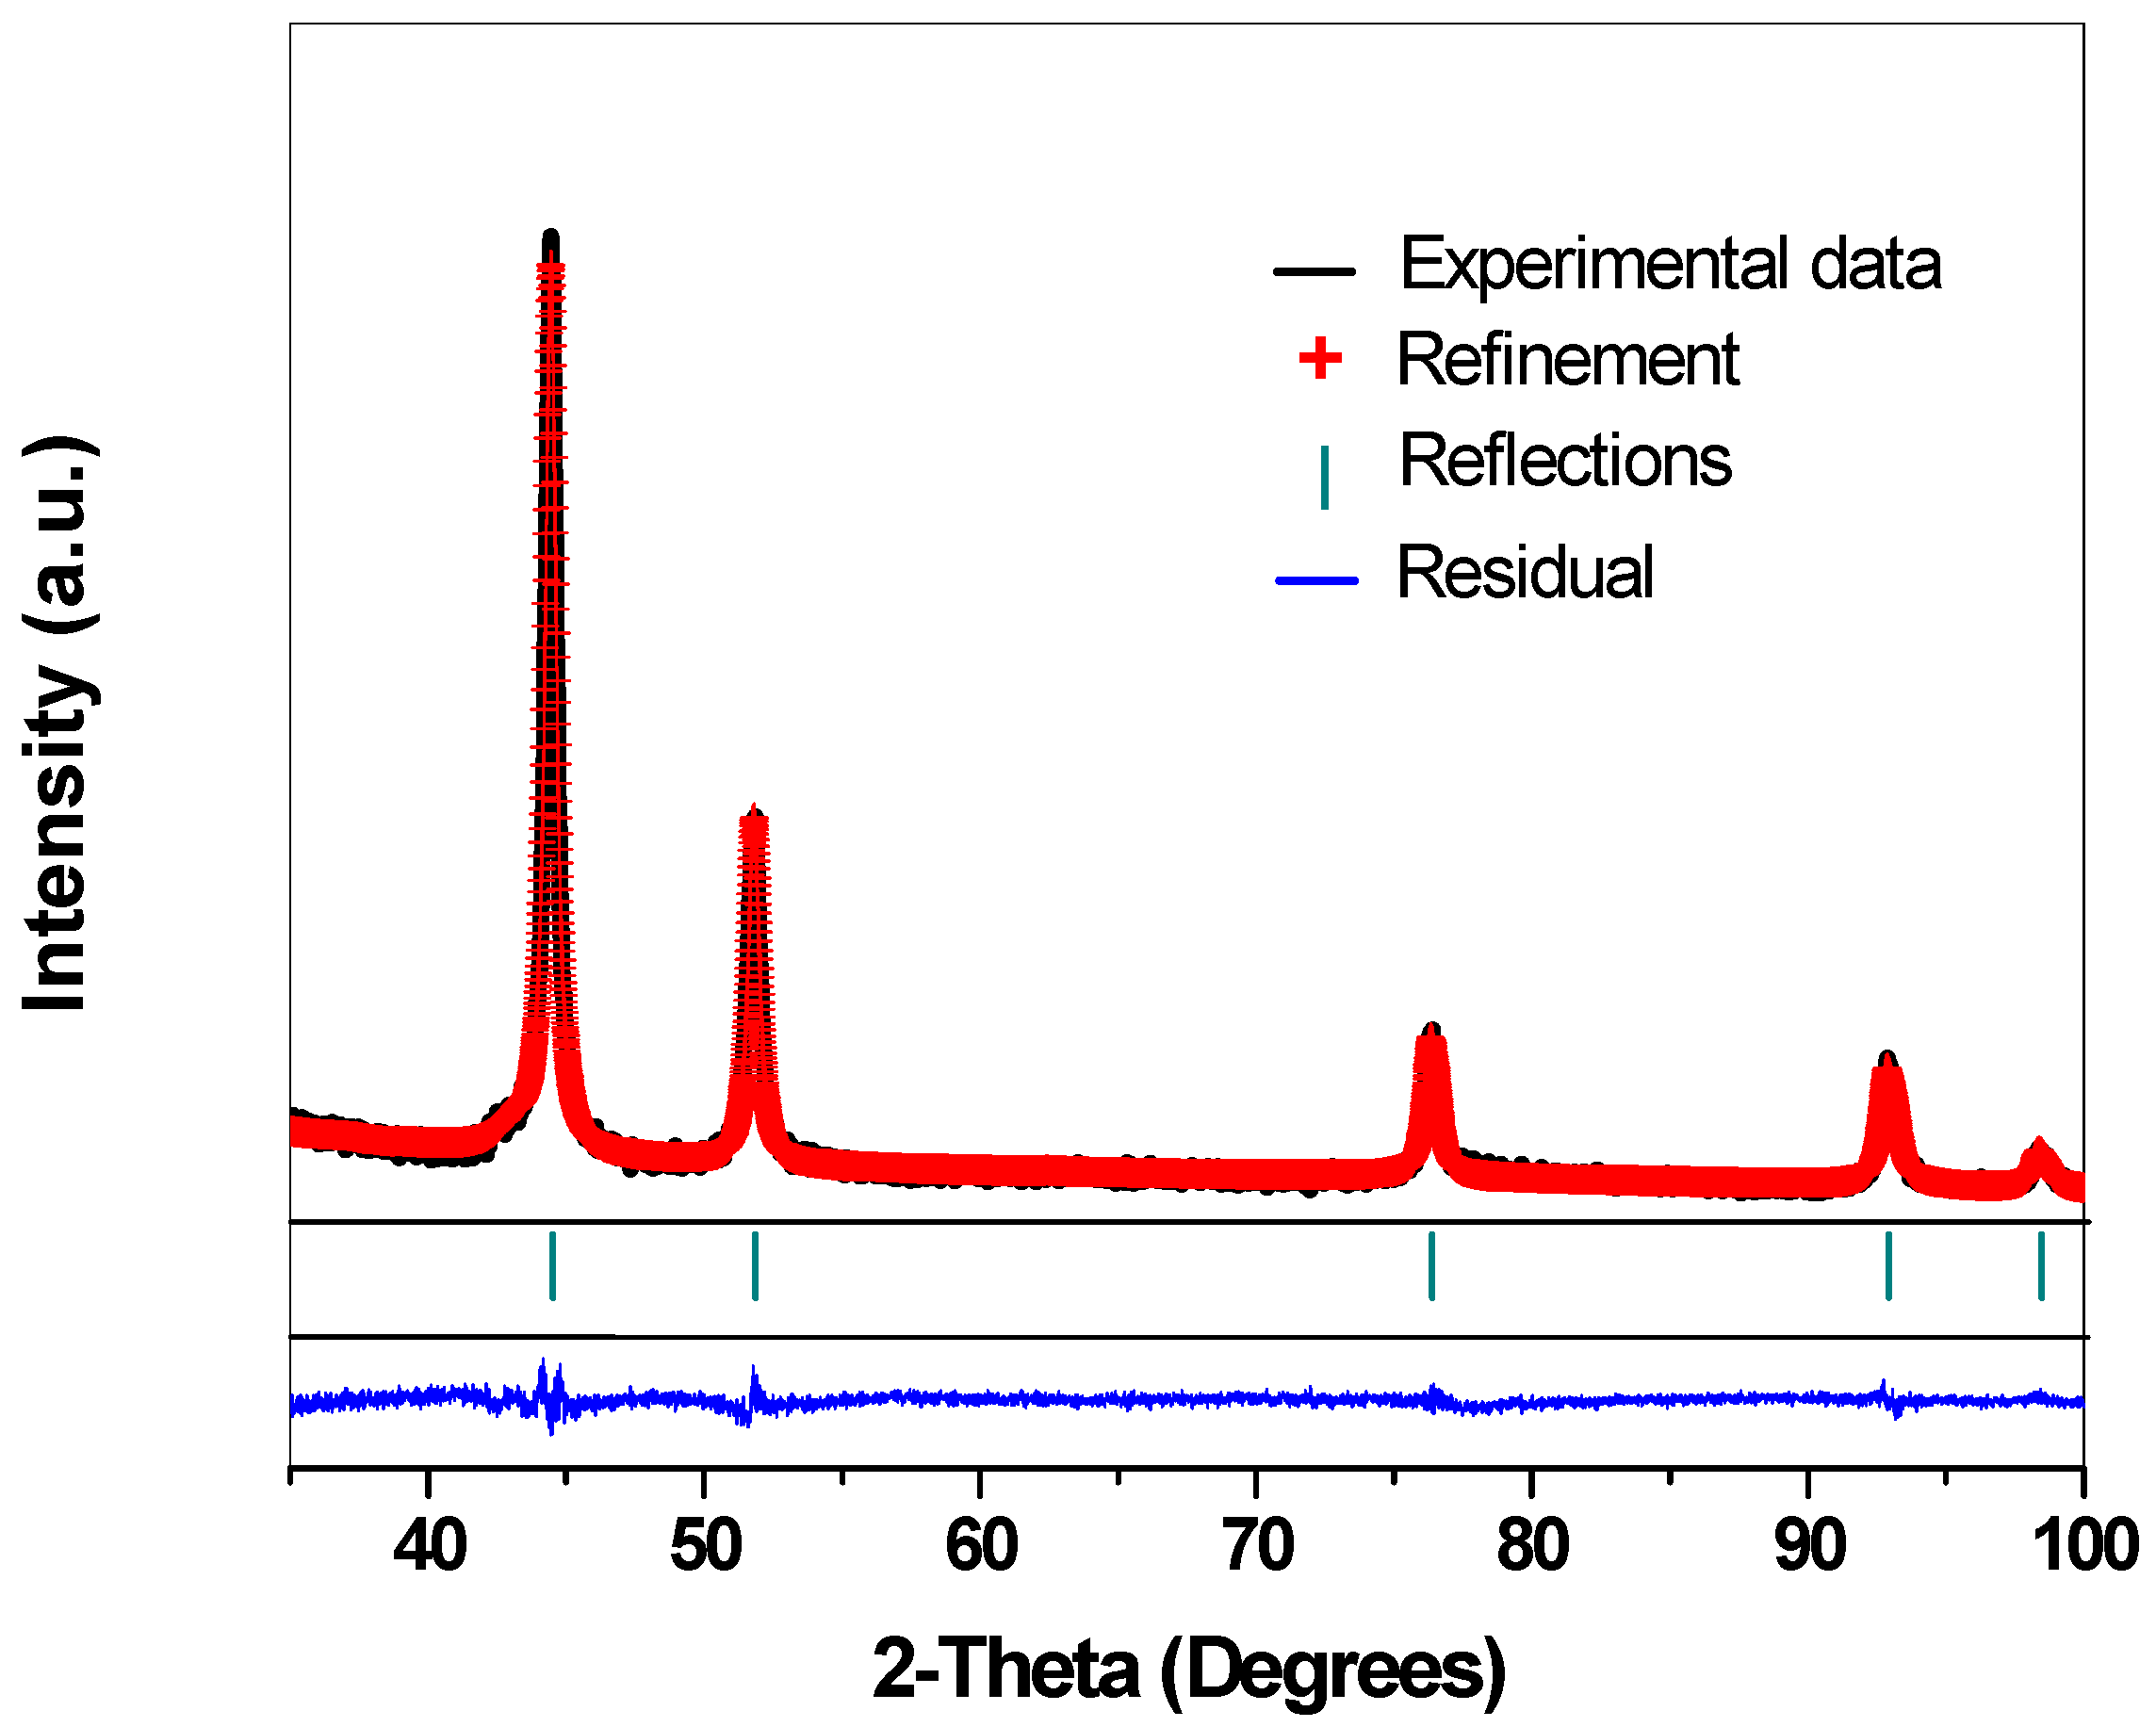
2.1. Crystalline Structure—X-ray Diffraction Analysis

In the preparation of Ni/SBA-15 catalysts, the precipitation–deposition method was applied using urea as precipitating agent. As the reaction proceeded, the hydroxide species (OH-) were released from the urea hydrolysis at 90 °C in the whole solution and they reacted with Ni2+, leading to the precipitation of Ni(OH)2, that was deposited on the surface of the SBA-15 solid (Equations (1)–(3)).
(NH2)2C = O + H2O = 2NH3 + CO2
NH3 + H2O = NH4OH → NH4+ + OH
Ni2+ + 2OH → Ni(OH)2
Ni(OH)2 → NiO + H2O
NiO + H2 → Ni + H2O
Because the urea hydrolysis rate is relatively slow, the Ni(OH)2 precipitate was slowly formed and finally a hydroxide solid layer was formed on the outer surface of the SBA-15 during 24 h of reaction. Afterwards, water in the mixture was removed at 110 °C; the resultant sample was dried at 110 °C for 12 h and calcined at 800 °C for 4 h in air for obtaining NiO/SBA-15 (Equation (4)). The calcined solids were then reduced with H2 at 400 °C for 4 h to obtain the reduced Ni/SBA-15 catalysts (Equation (5)).
Figure 1 shows the XRD patterns of the Ni/SBA-15 catalysts. In the 2θ region between 30° and 100°, five diffraction peaks at 44.3°, 51.6°, 76.1°, 93.0°, and 98.6° were observed, corresponding to the reflections of the (111), (200), (220), (311), and (222) planes of metallic Ni crystals. The crystalline structure of Ni NPs was refined using the Rietveld method. A refinement plot of the 25 wt%Ni/SBA-15 sample is shown in Figure 2.
The structural data obtained from the Rietveld refinements are reported in Table 1. The parameter Rwp obtained from the structure refinement was smaller than 5%, indicating the good simulation of the calculated data with respect to the actual experiment data. Metallic Ni NPs have a cubic structure with a lattice cell parameter a0 varying between 3.5241 and 3.5369 Å. The crystallite size increases from 12.23 nm for the 10 wt%Ni/SBA-15 to 25.59 nm for the 15 wt%Ni/SBA-15 and 28.50 nm for the 25 wt%Ni/SBA-15. Therefore, the nanosized Ni PNs were formed on the SBA-15 using the combination of the precipitation–deposition method.

2.2. Textural Properties—N2 Physisorption Isotherms Measurement

The textural properties including surface area, pore diameter and pore volume of the three catalysts are reported in Table 2. Higher Ni loading led to a smaller surface area and pore volume. Similarly, the pore diameter also diminished by increasing the Ni content, due to the possibility of blocking some pores with the Ni particles.

2.3. Morphology–Transmission Electron Microscopy (TEM)

Figure 3 shows the TEM micrographs of the pure SBA-15 and the Ni/SBA-15 catalysts. The Ni NPs distribution and morphological features can be observed. For the SAB-15 support, highly ordered cylinder channels were clearly viewed when the electron beam was perpendicular to the main axis (Figure 3A). When the electron beam was parallel to the main axis, highly ordered pores with hexagonal arrangement were observed. The average pore diameter of the pure SBA-15 support was around 7 nm (Figure 3B). Regarding the 10 wt%Ni/SBA-15 catalyst, Figure 3C, many Ni NPs highly distributed on the SBA-15 surface; some of them were anchored into the SBA-15 framework. The Ni nanoparticles are approximately 5 to 15 nm size. For the 15 wt%Ni/SBA-15 catalyst, Ni NPs were also well distributed in a range between 10~25 nm (Figure 3D). However, on the 25 wt%Ni/SBA-15 catalyst, some larger Ni NPs were formed and unevenly distributed on the SBA-15 surface, some of them had a particle size greater than 50 nm (Figure 3E).

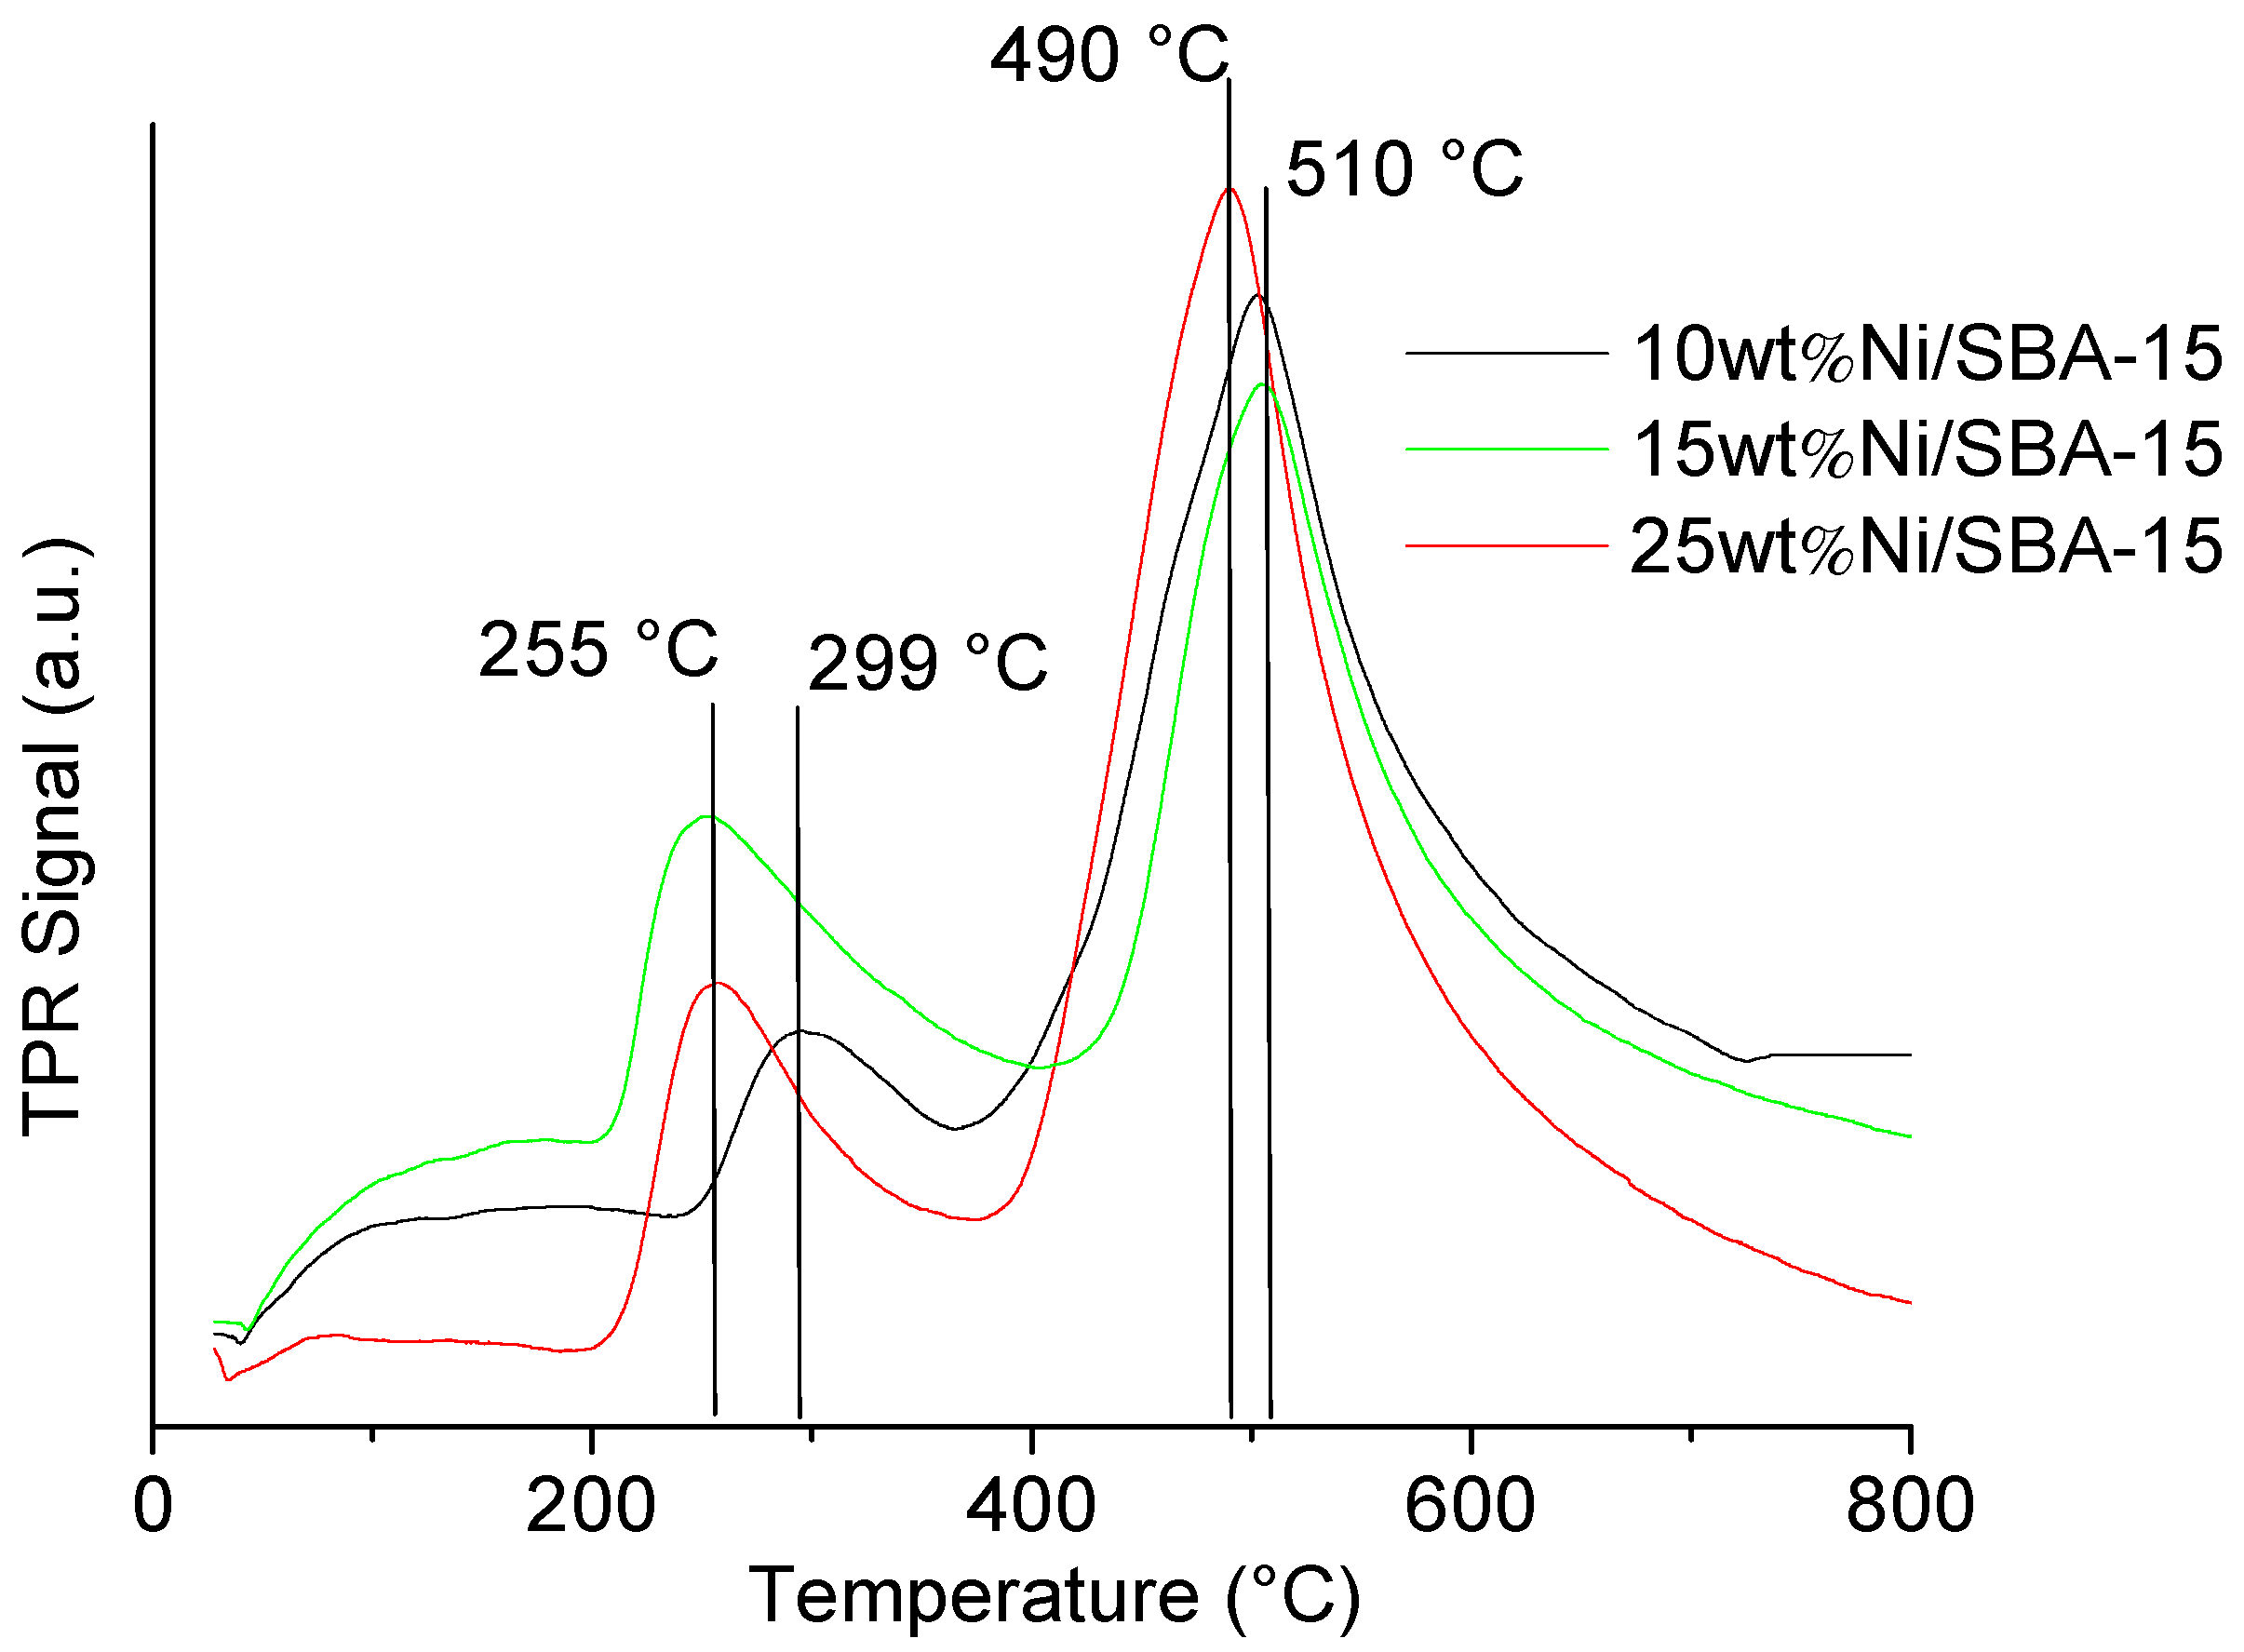
2.4. Oxygen Species Reducibility–Temperature-Programmed Reduction (TPR)

Figure 4 shows the H2-TPR profiles of three Ni/SBA-15 catalysts. These samples were calcined in air at 800 °C without reduction treatment before the H2-TPR experiments. Two peaks in the TPR profiles were observed: one appeared between 200 °C and 380 °C with a smaller area, and the other appeared between 400 and 700 °C with a greater area. Generally, the temperature of the peak maximum (Tmax) measures the difficulty degree for the metal oxide reduction; and the area of the TPR peak accounts for the amount of the reduced oxygen in the metal oxide. The low-temperature peak indicates a weak interaction of some NiO particles with SBA-15; while, the high-temperature peak indicates the strong interaction of NiO with SBA-15. Most of NiO particles had a strong interaction with the SBA-15 support, indicated by the greater peak area at higher temperature around 500 °C.

2.5. Catalytic Properties–Methane Catalytic Decomposition

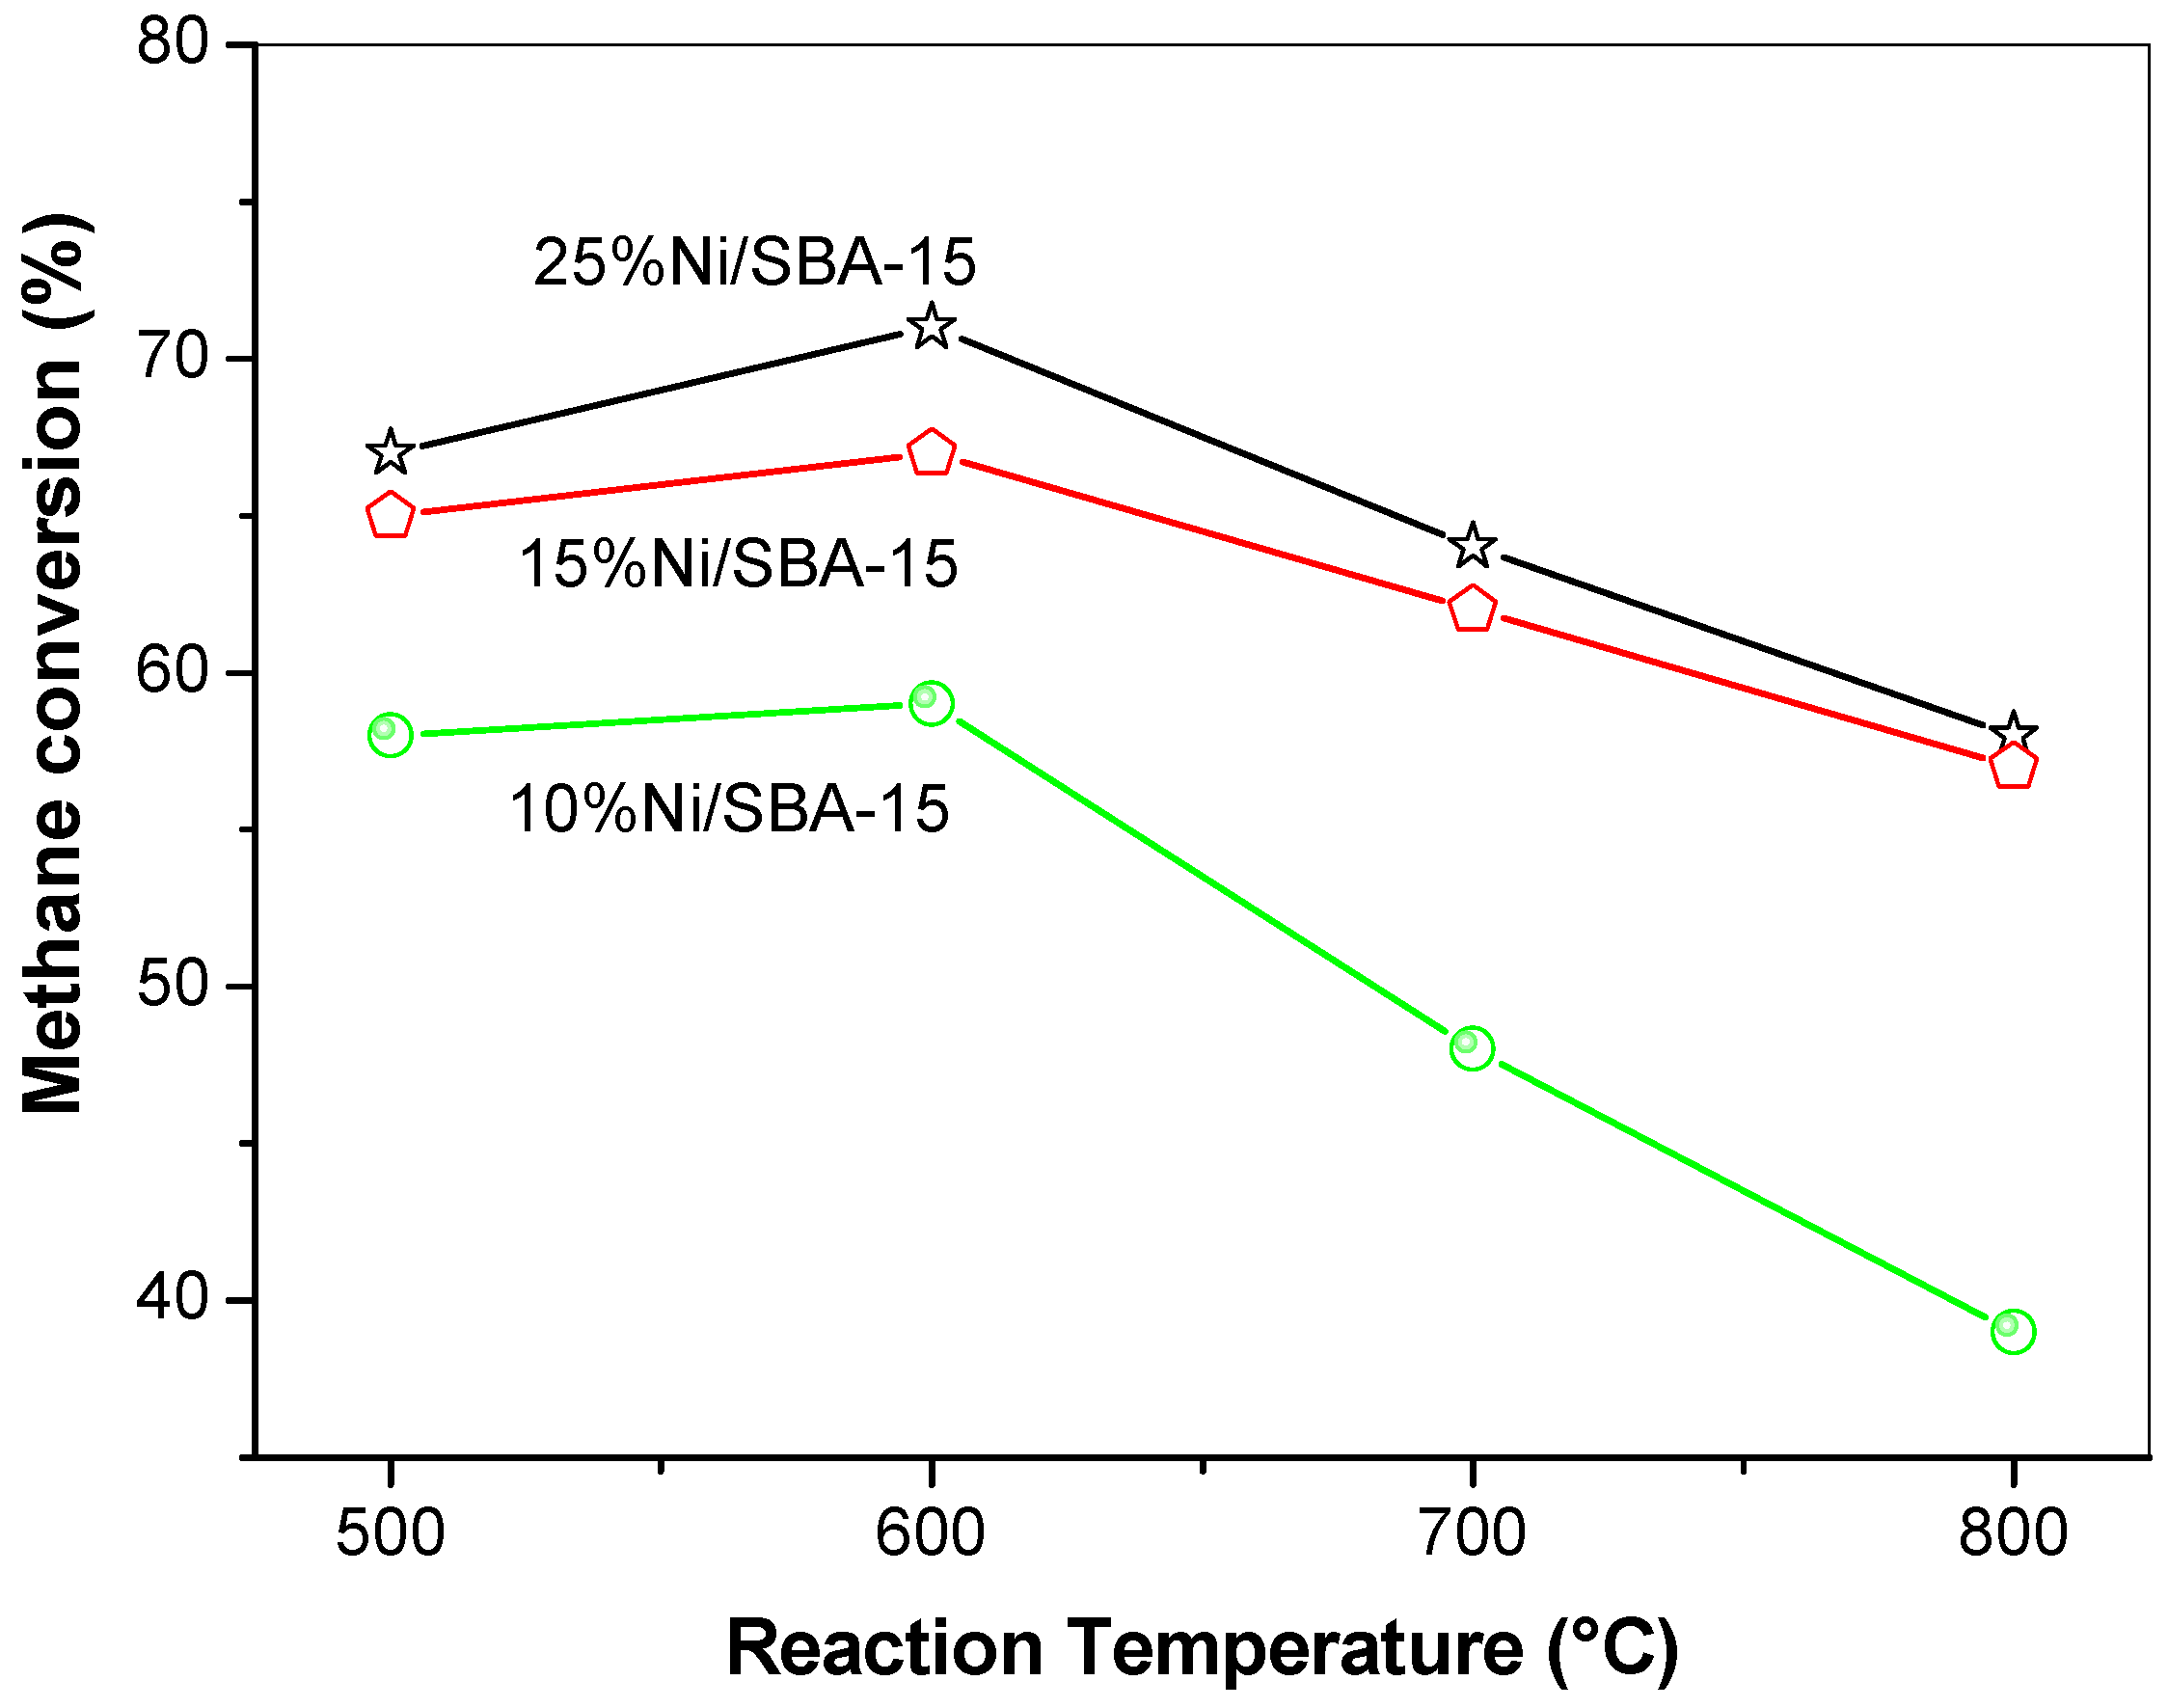
2.5.1. CH4 Conversion as a Function of Reaction Temperature

The methane catalytic decomposition was performed at different temperatures. After 60 min of reaction, as shown in Figure 5, the methane conversion over the 25 wt%Ni/SBA-15 increased from 66.4% at 500 °C to 70.7% at 600 °C and then decreased to 65.2% at 700 °C and 59.1% at 800 °C. Similar results were obtained from the other two catalysts. Therefore, the catalysts exhibited the highest activity at 600 °C. The reaction rate decreased more rapidly for the 10 wt%Ni/SBA-15 catalyst in comparison with the catalysts with 15 and 25 wt% Ni at the higher reaction temperature. The reaction temperature above 600 °C is near or higher than the Tammann temperature of metallic Ni (691 °C), which led to the Ni NPs at quasi or semi-liquid state and thus they may easily undergo sintering [33]. This resulted in a bigger crystallite size, a reduced surface area and a lower catalytic activity. In addition, higher temperature may lead to some Ni NPs being encapsulated by carbon materials, which will be discussed in detail later. These negative effects are more significant on the Ni with smaller particle size than that with large size. The former can be easily encapsulated by carbon materials and lose activity. Therefore, the 10 wt%Ni/SBA-15 catalyst is more sensitive to the reaction temperature because it contains more Ni NPs with a smaller than 10 nm size.

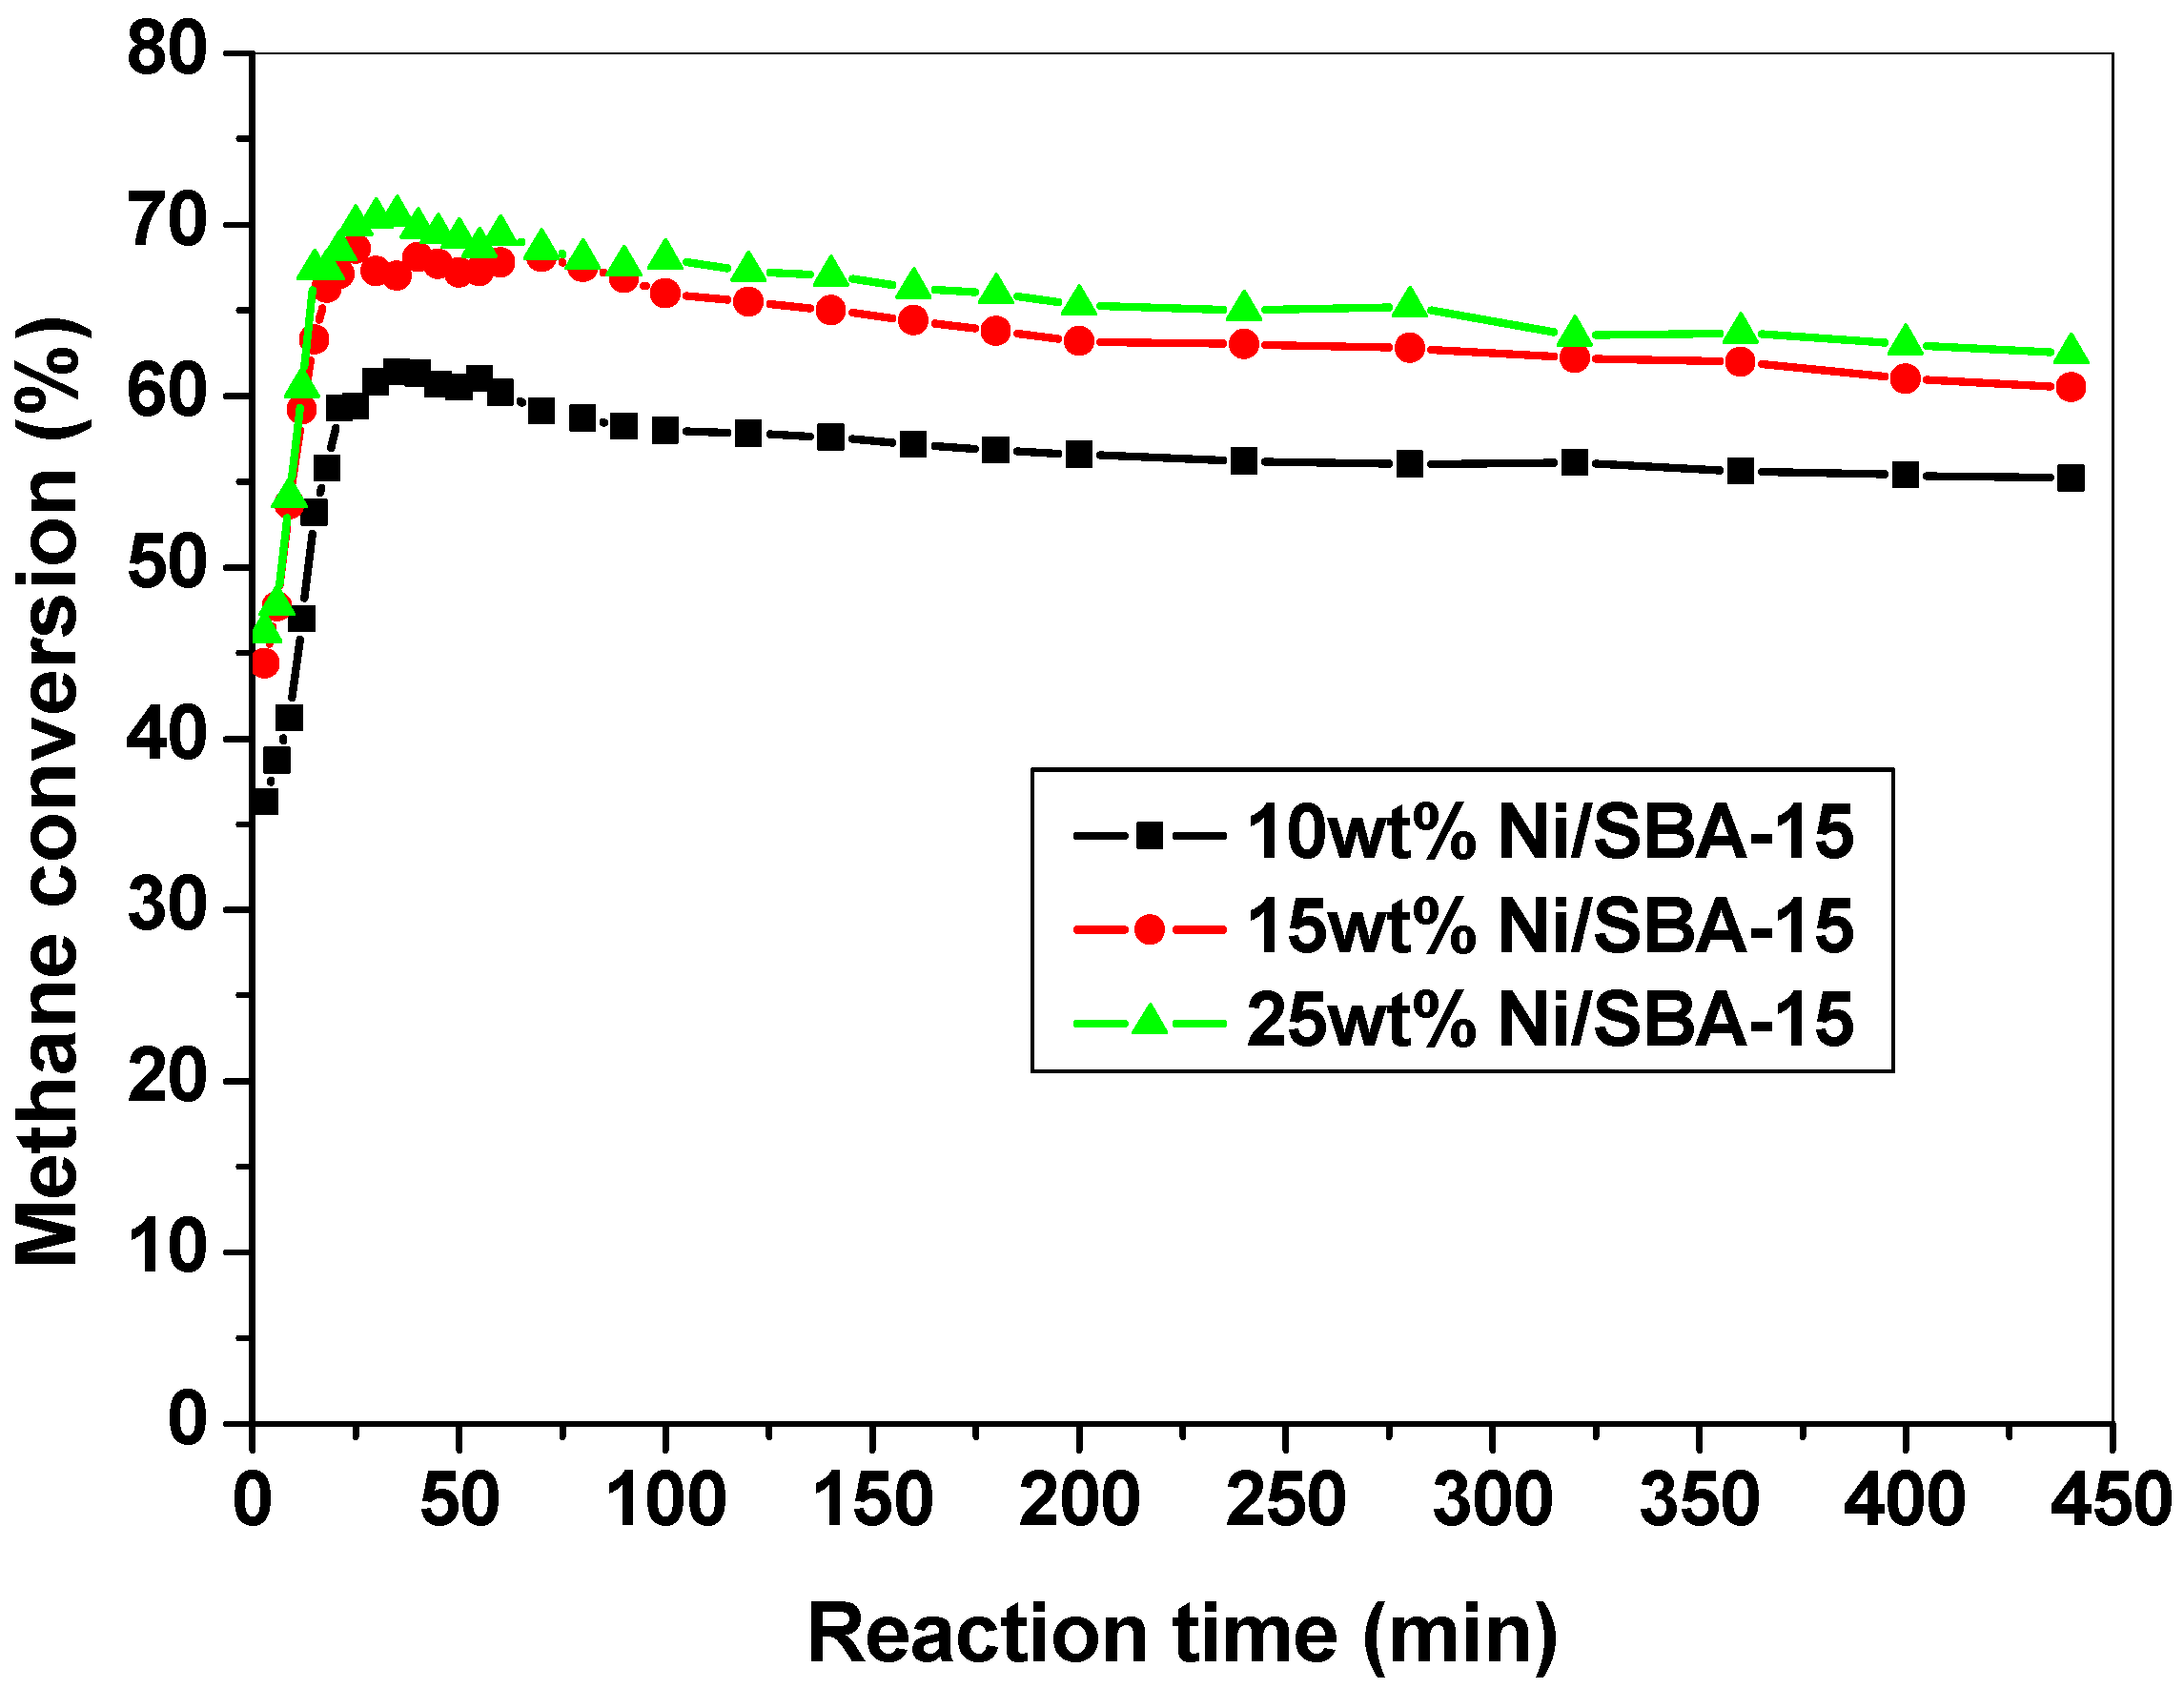
2.5.2. CH4 Conversion as a Function of Reaction Time

The methane conversion over the Ni/SBA-15 catalysts as a function of reaction time was carried out at 600 °C. The average conversion of methane in 440 min of reaction was around 57% for the 10%Ni/SBA-15, 63% for the 15%Ni/SBA-15, and 65% for the 25%Ni/SBA-15 catalysts, Figure 6. Both CO and CO2 were not detectable in the effluent, and H2 was the only gas product. Therefore, hydrogen selectivity was 100%. The catalytic activity remained almost stable with a slight decrease by approximately 5~8% during the 440 min of reaction, probably due to the partial coverage of the Ni surface by carbon deposits.
It is very interesting to observe that in the initial stage of reaction, methane conversion rapidly increased with time on steam in the first 35 min of reaction. For better understanding this phenomenon, we particularly analyzed the catalyst samples obtained at different reaction time in the initial reaction stage using Raman spectroscopy.

2.5.3. Raman Spectra

Figure 7 shows the Raman spectra of the 15 wt%Ni/SBA-15 catalyst discharged at different reaction times. After 10 min of reaction, two bands at 1326 cm−1 and 1576 cm−1 were formed in the catalyst, corresponding to the amorphous carbon (Ca) with disordered structure and lattice defects (terms D band), and to the sp3 C‒C stretching vibration of the graphite carbon (Cg) terms G band, respectively [25,26,27]. As the reaction time increased from 10 min to 20 and 30 min, the intensity of the G band remained almost the same, but the D band significantly increased. The intensity ratio of the D and G bands (ID/IG) is a measure of the carbon crystallization degree. A lower ID/IG value indicates a higher degree of the carbon crystallization. The ID/IG value increased from 3.3 to 10.8 and 14.1 as the reaction time increased from 10 to 20 and 30 min, clearly showing that more amorphous carbon than graphite carbon was formed on increasing steam time in the initial reaction stage.
The correlation of ID/IG values with the CH4 conversion in the initial reaction stage was plotted in Figure 8. Both, CH4 conversion and ID/IG values, followed a similar increasing tendency. It has been reported that the CH4 decomposition reaction follows a successive dehydrogenation mechanism [26,32], which yields the adsorbed CHx(ads) (x = 1, 2, or 3) intermediates, H2 and carbon. These adsorbed CHx(ads) intermediates may adsorb on the Ni surface and finally transform into amorphous carbon clusters. The Raman spectroscopic characterization confirmed that amorphous carbon clusters species were predominately produced at the initial stage of reaction. Because the methane decomposition rate was rapidly increased in this stage, the formation of amorphous carbon clusters and the adsorbed CHx(ads) species may serve as active centers for catalyzing the CH4 further dehydrogenation, as described in Equations (6)–(11):
CH4(gas) → CH4(ads)
CH4(ads)·CH3(ads) + ·H(ads)
·CH(ads) + ·H(ads) → H2(ads) + Ca
·H(ads) + ·H(ads) → H2(ads)
H2(ads) → H2(gas)
Ca → Cg
It is proposed that not only Ni crystals but also amorphous carbon or hydrocarbon clusters bearing H species (coke-like materials) participated in the CH4 dehydrogenation for hydrogen formation. When the amount of such hydrocarbon clusters reached to a certain value, they may start building up CNTs by transforming amorphous carbon (Ca) into graphite carbon (Cg).

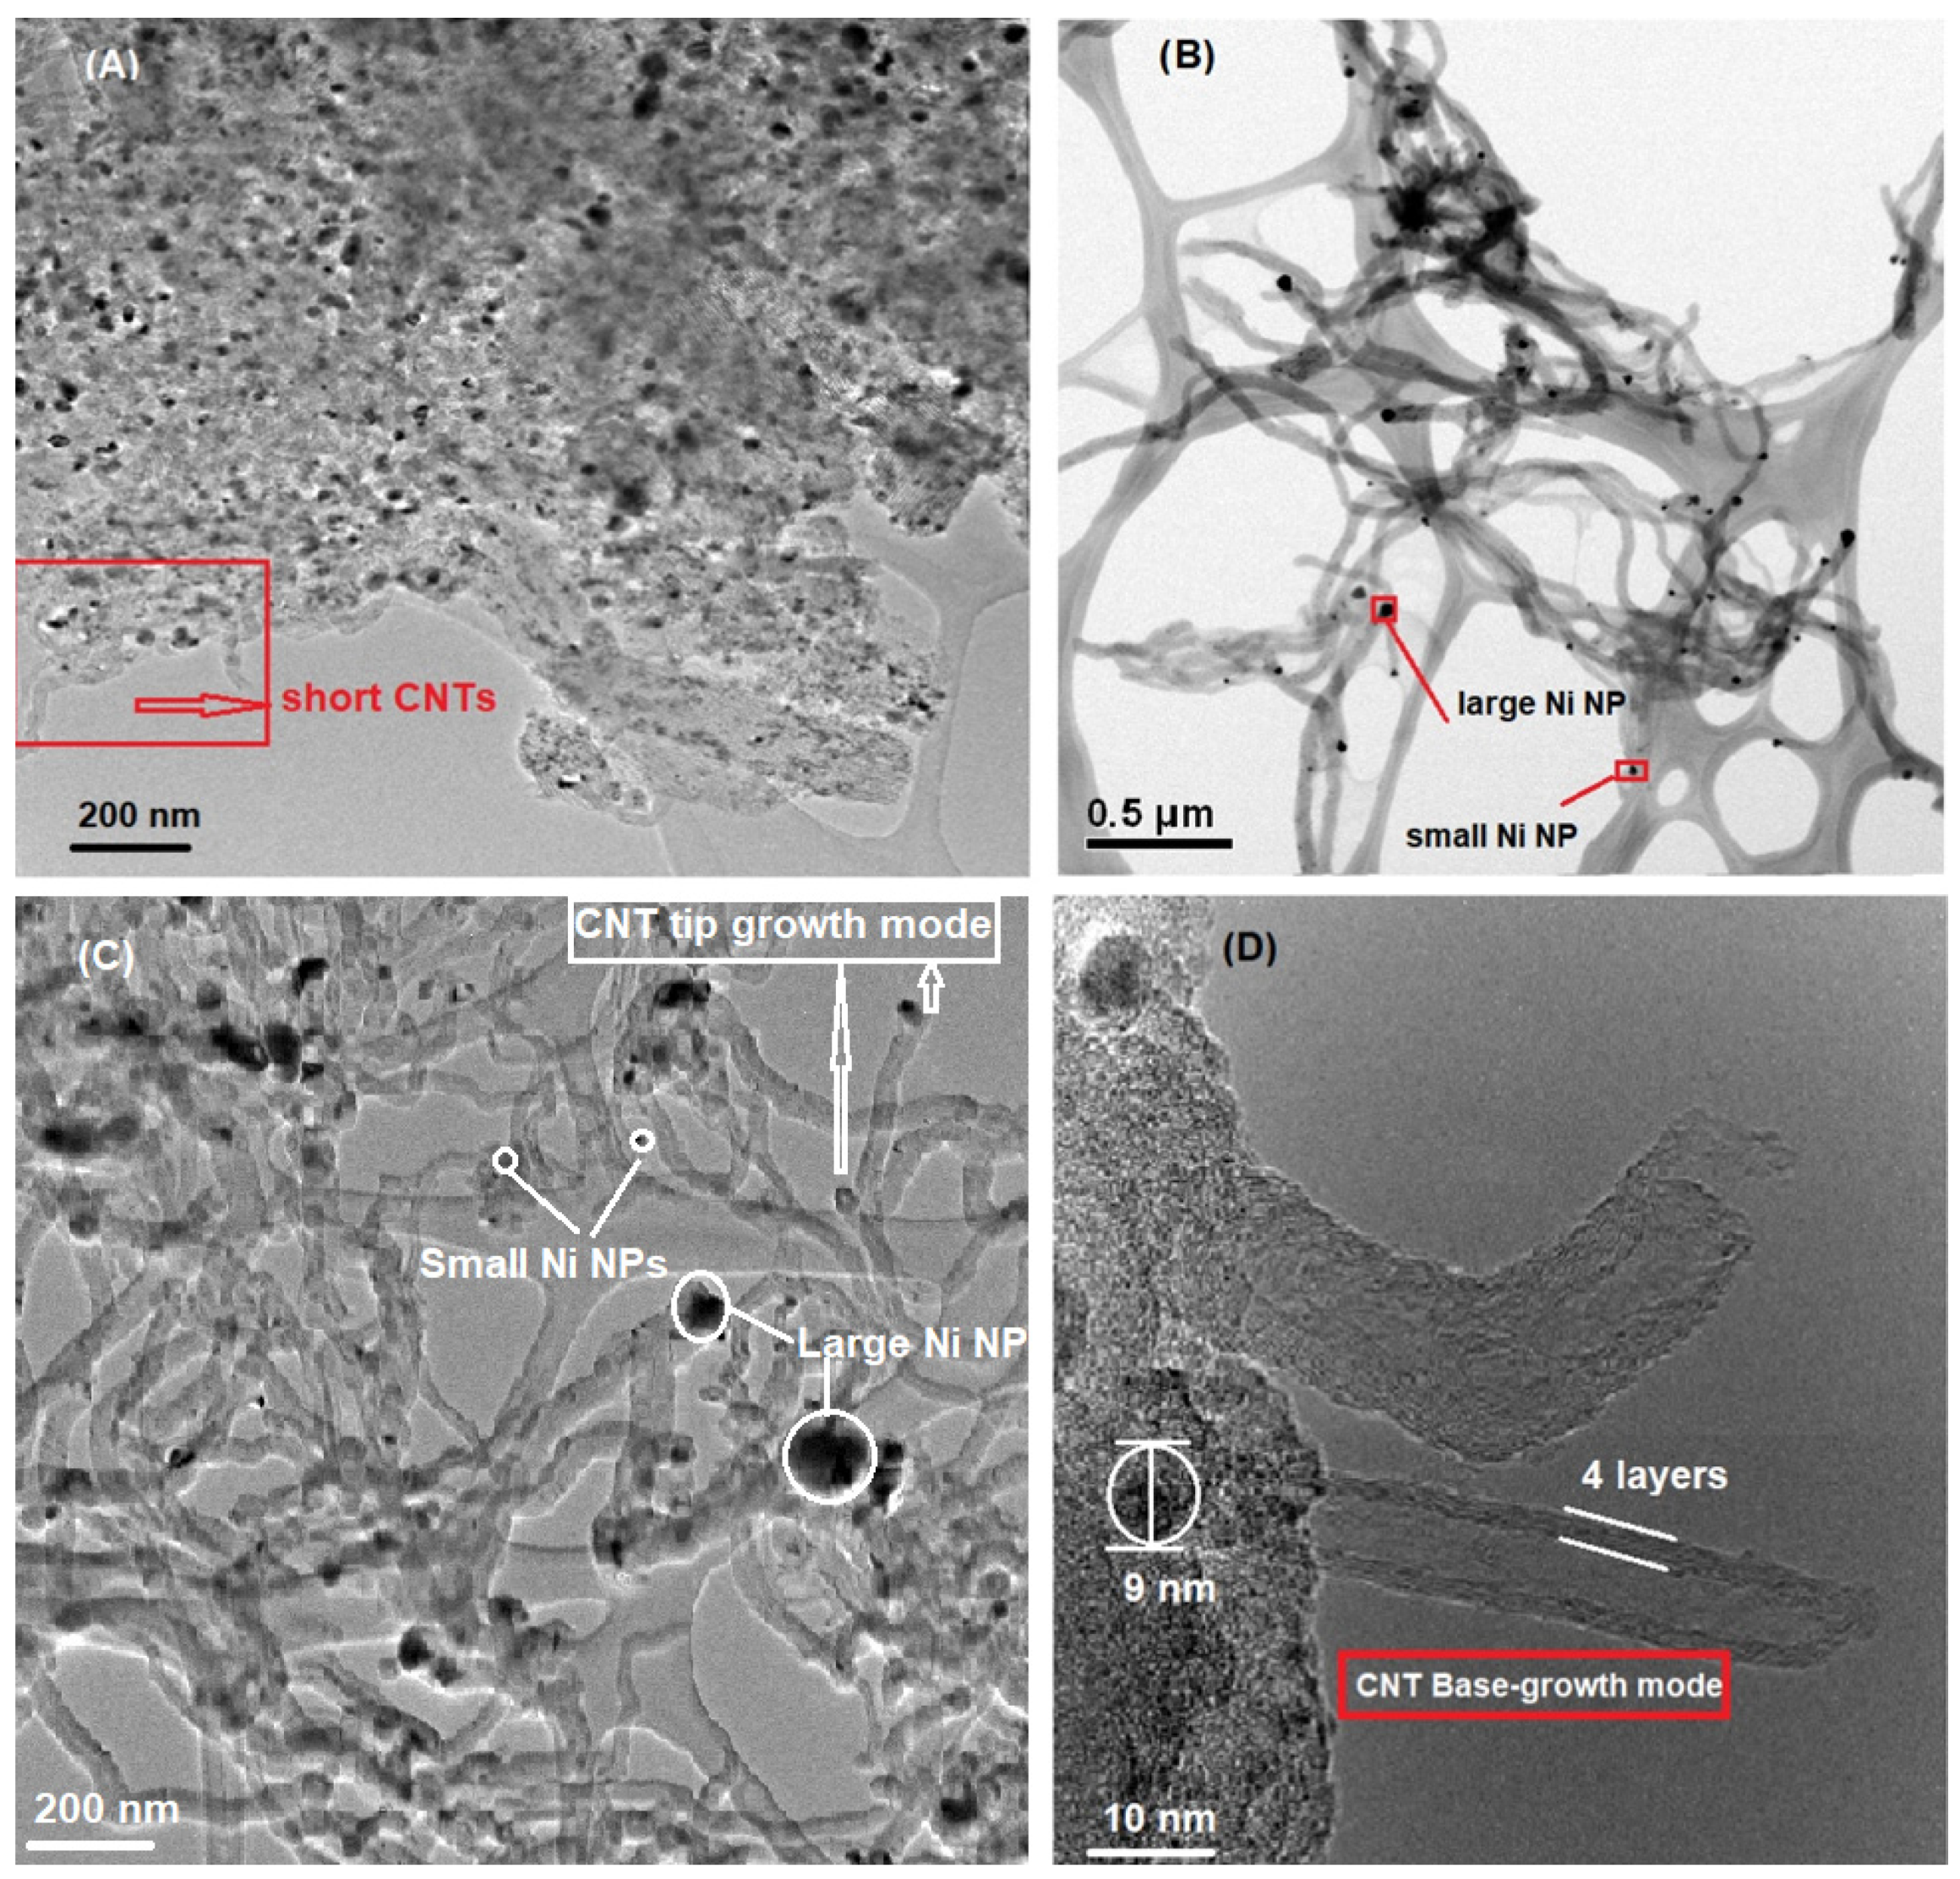
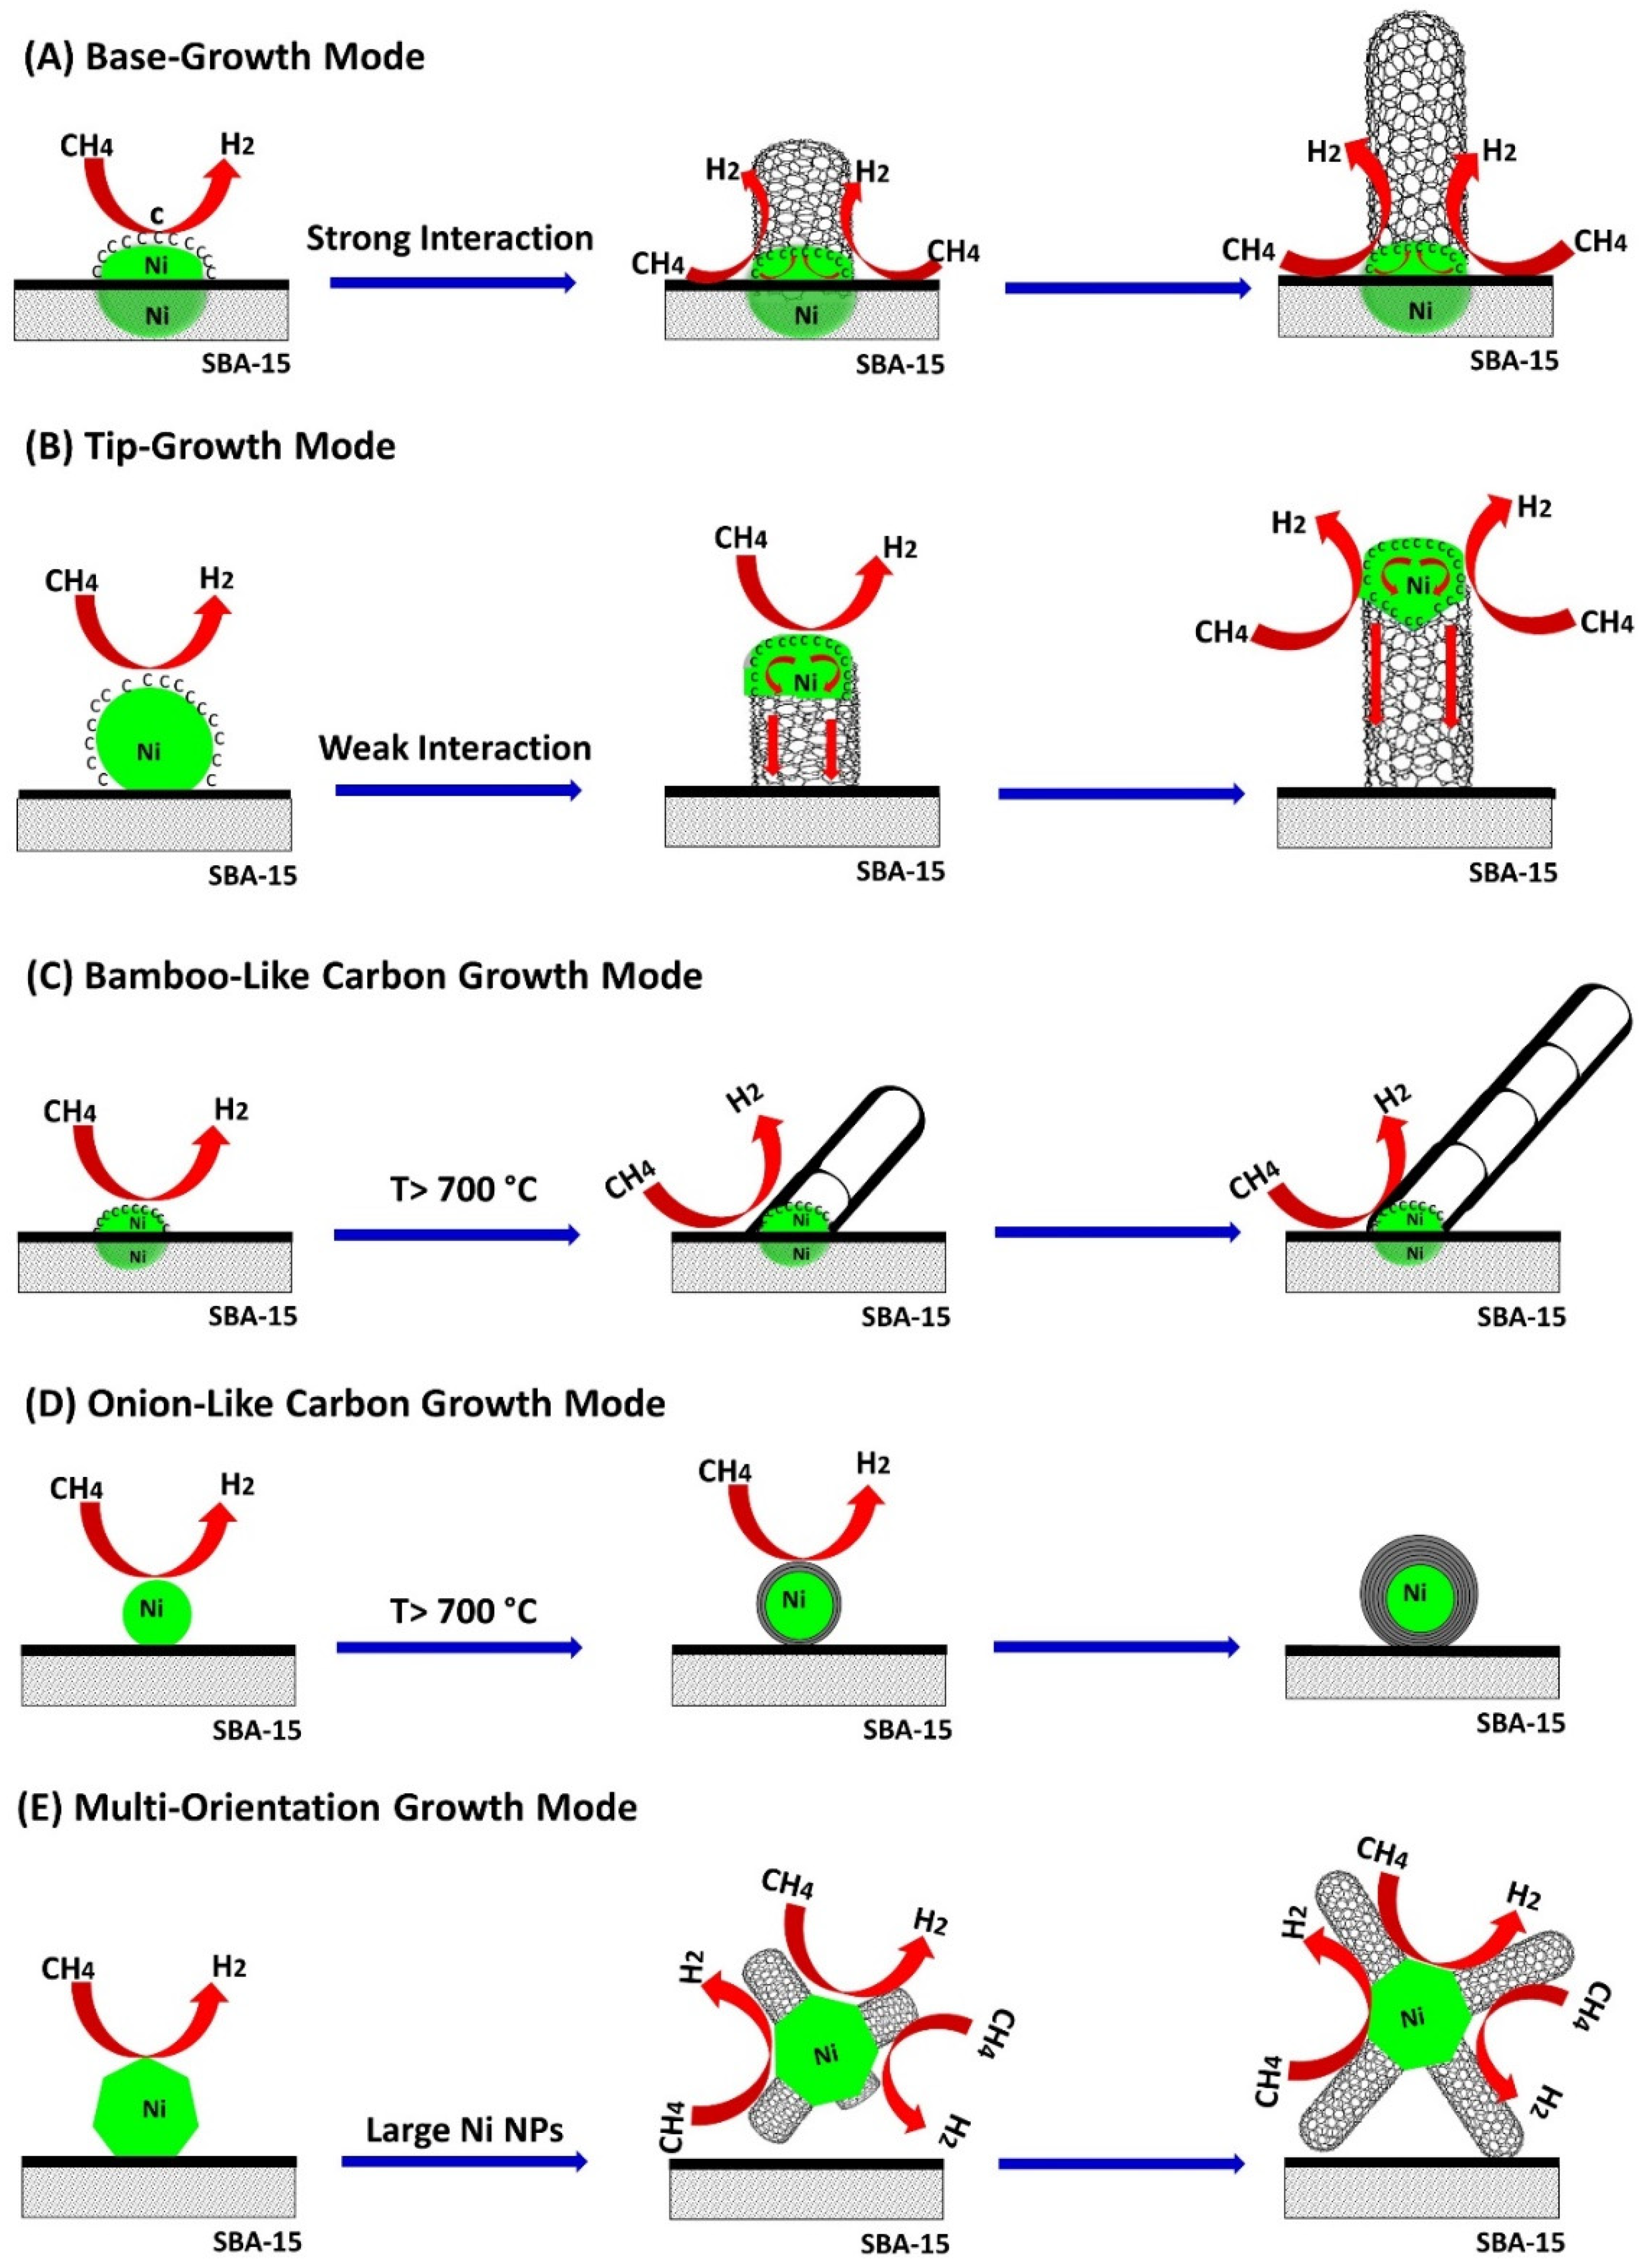
2.5.4. Formation of Nanocarbon and Growth Modes

The formation of CNTs on the Ni/SBA-15 catalysts was also investigated by the TEM technique (Figure 9 and Figure 10). In Figure 9A, after 10 min of reaction, the surface of most Ni NPs was covered with some carbon materials. On some Ni NPs, a few short CNTs were formed. After 120 min (Figure 9B) and 440 min of reaction (Figure 9C), many longer CNTs with a multiwall structure were formed, with length varying from tens to hundred nanometers. Several forms of carbon materials were observed:
1)
Some CNTs had Ni NPs on their tip as shown in Figure 9B,C; and they grew following a tip-growth mode;
2)
Some CNTs were formed through a base-growth mode where Ni particles anchored into the catalyst support and CNTs grew based on the surface of Ni NPs, Figure 9D;
3)
Some bamboo-like CNTs were formed at higher temperature, i.e., 800 °C, as shown in Figure 10A,B;
4)
Some metal-encapsulated carbon composites were observed at higher temperature, forming onion-like carbon nanomaterials as shown in Figure 10C,D;
5)
It was observed some large size Ni NPs have several crystal faces where CNTs grew towards different orientations (Figure 10D).
The CNTs formation and growth modes could be correlated with the interaction strength between the Ni NPs and the SBA-15 support. The H2-TPR profiles of Ni/SBA-15 shown in Figure 4 confirmed that there were two kinds of Ni particles on the SBA-15 support: one weakly interacting with SBA-15, as evidenced by the low reduction temperature peak at 200–380 °C; and another strong interacting with SBA-15, indicated by the TPR peak at high temperature region between 400 and 700 °C. When carbon atoms were released from the CH4 decomposition on the surface of the Ni NPs strongly anchored into the SBA-15, carbon nanotubes were constructed on the Ni surface via the base-growth mode because it was difficult for carbon atoms to move-up the Ni NPs strongly trapped by SBA-15.
When methane was decomposed on the surface of Ni NPs weakly interacting with the support, carbon atoms were able to diffuse along the surface of the Ni NPs to the interfaces between Ni and SBA-15, for building CNTs. As the reaction proceeded, growing CNTs could separate the Ni NPs from the support, and thus CNTs construction could follow the tip-growth mode. These results are similar to those observed for Ni/Ce-MCM-41 catalysts reported by Guevara et al. [21] and the coprecipitated Ni–Al and Ni–Cu–Al catalysts reported by Shaikhutdinov et al. [34], where both, the tip-growth and the base-growth modes of CNTs are proposed.
Therefore, it is possible to control the CNTs growth modes by modifying the interaction degree between Ni and SBA-15 which can be controlled by the methods for introducing Ni. For instance, when introducing Ni on the surface of the support by the impregnation method, the interaction between Ni and support is usually weak; while if Ni is introduced by the sol-gel method, or the precipitation–deposition route as this work, the interaction is usually stronger.
It is noted by comparison of Figure 9B,C with Figure 9A, that after long reaction times, i.e., 120 min and 440 min, the morphology of the sample clearly differed from that observed for the sample after 10 min of reaction. This confirmed that the graphite CNTs were formed after long time of reaction via the transformation of the amorphous carbon. This is in good agreement with the results from Raman spectra shown in Figure 7.
Figure 11 shows the CNTs formation modes under various conditions. Figure 11A,B show the CNTs formation through tip-growth and base-growth modes, respectively. They are controlled by the interaction strength between Ni NPs and the SBA-15 support. The formation mechanism of CNTs with bamboo-like morphology is pictured in Figure 11C.
Usually, in the initial stage of methane decomposition, carbon atoms deposit on the surface of the Ni NPs to form a carbon thin cap; as the methane decomposition continues, some carbon atoms start building up the CNTs at the interface between the Ni NPs and the carbon cap, forming graphite CNTs. However, there exists a competition between the carbon atom release and the CNTs construction. If the CNTs growth rate is relatively slow, the C atom precipitating rate can be inhibited to some extent, leading to some of the carbon atoms depositing again on the surface of the Ni NPs and forming a new cap, which may separate from the Ni NPs surface, forming a carbon separator inside the CNTs. The carbon cap can be periodically produced, leading to the formation of bamboo-like CNTs.
The CNTs growth modes were also affected by the reaction temperature. At a higher reaction temperature, i.e., T ≥ 700°C, some Ni NPs were at quasi-liquid state. Carbon atoms released from methane decomposition may dissolve into the bulk of quasi-liquid Ni NPs and diffuse through the Ni bulk or on the surface to then precipitate at the interface between the Ni metal nanoparticle and the support for constructing carbon nanotubes. If the carbon atom precipitating rate at the interface for CNTs construction is greater than their surface or bulk diffusing rate, then CNTs were predominately formed, producing the normal CNTs via the tip-growth and base-growth modes. However, if the rate of surface carbon atoms formation is much greater than the rate of C precipitation for CNTs formation, they may accumulate on the surface of Ni nanoparticle to encapsulate it, forming the onion-like carbon encapsulated composites, preventing Ni further reacting with methane, and leading to the catalyst deactivation. This terminates the methane decomposition reactions. Ganesh et al. reported that, at higher temperatures, the formation of the onion-like carbon is related to the carbon transformation in a step-wise manner with the outermost shell quickly transforming with large jumps in energy, assisted initially by some quick transformations in the innermost core [35]. These are possibly a result of the sudden anisotropic release of internal pressure in the cap of the catalyst nanoparticles. The onion-like carbons consist of multi-shell graphite carbon and are formed at higher temperature [36]. The formation mechanism of the onion-like carbon encapsulated composites is pictured in Figure 11D. For the 25 wt%Ni/SBA-15 catalyst, on some larger Ni NPs, carbon nanotubes grew toward different orientations. This is because large Ni particles usually have several crystal planes, and on each of those Ni crystal planes, carbon atoms can be deposited for CNTs construction, resulting in CNTs with different orientations, as depicted in Figure 11E.

3. Materials and Methods

3.1. Ultrasonic-Assisted Synthesis of SBA-15

SBA-15 was synthesized employing the ultrasonic-assisted hydrothermal method by using tetraethylorthosilicate (TEOS) (Sigma, St.Louis, MO, USA) as Si precursor and triblock copolymer [(polyethylene oxide)–block-(polypropylene oxide)–block-(polyethylene oxide)] (noted as P123) as structural linker. 4 g P123 were added to 144 mL of 1.7M HCl and stirred for 4 h at 40 °C. Then, a calculated amount of TEOS was added dropwise. The mass ratio of TEOS/P123 molar ratio was controlled at 2. The above mixture was stirred for 2 h and sonicated for 2h using an ultrasonic generator (Brasonic 5510R-DTH, Marshall Scientific, Boston, MA, USA), at 42 kHz frequency. The resultant mixture was transferred into a Teflon bottle which was tightly sealed and maintained at 100 °C for 48 h under static conditions. The suspended product was filtered and washed with water and then dried at 80 °C for 12 h. The dried sample was calcined at 800 °C for 4 h in air flow at a temperature increasing rate of 1 °C/min.

3.2. Synthesis of Ni/SBA-15 Catalysts

The Ni loaded catalysts were prepared by the combination of the precipitation–deposition method using urea as precipitating agent. The urea/Ni molar ration was controlled at 5. The SBA-15 powders were loaded with a desired amount of an aqueous solution of Ni(NO3)2∙6H2O (98.5%, Sigma, St. Louis, MO, USA), in order to obtain a 10, 15, 25 wt% of Ni loading. The precipitation was operated in a rotary evaporator in which the temperature was set at 90°C in an oil bath. The rotary evaporator was installed with a water-cooling system in order to collect the condensed water vapor during the synthesis procedure. Afterwards, water in the mixture was removed at 110 °C; the resultant sample was dried at 110 °C for 12 h and calcined at 800 °C for 4 h in air for obtaining NiO/SBA-15. The calcined solids were then reduced with H2 at 400 °C for 4 h to obtain the reduced Ni/SBA-15 catalysts. These materials were labeled as xNi/SBA-15, where x represents the Ni weight percentage.

3.3. Characterization

The crystalline structures of the SBA-15 support and the Ni/SBA-15 catalysts were analyzed with the X-ray diffraction method on a Siemens D500 diffractometer (Siemens D500, Munich, Germany) using a Kα radiation and a diffracted beam monochromator (λ = 1.5405 Å). For the XRD analysis of SBA-15, the 2θ low angle range was analyzed between 0.5 to 5°. For the XRD analysis of the catalysts, the 2θ range was set between 10° and 100°.
The crystalline structure of the Ni/SBA-15 catalysts was refined with the Rietveld refinement method. The Ni atoms are set at 4a sites with atomic fractional coordinate (x, y, z) = (0, 0, 0). The JAVA based software namely Materials Analysis Using Diffraction (MAUD) was applied to refine each XRD pattern [37,38]. The estimated standard deviations or weighted profile R factors (Rwp) were not estimated for the analysis as a whole, but only for the minimum probable errors based on their normal distribution.
The textural properties of the support and the catalysts were measured by the nitrogen physisorption isotherms method on a Nova 4000 Series instrument (Quantahrome Instruments, Boynton Beach, FL, USA). Before N2 adsorption experiments, the sample was thermally treated at 300 °C for 4 h. The surface area data were obtained according to the model of Brunauer–Emmett–Teller (BET) method. The pore size distribution was calculated by using the Barrett–Joyner–Halenda (BJH) model using the data from the desorption branch of the hysteresis loops.
The surface oxygen reduction behavior of NiO and the interaction between NiO and SBA-15 were investigated with the H2 temperature-programmed reduction (H2-TPR) method on a TRR/TPD 2900 instrument (Quantachrome Instruments, Boynton Beach, FL, USA). Two hundred milligrams of the catalyst solid were placed in a quartz reactor and heated up to 100 °C for 1 h under a 40 mL/min He flow. Then, the reactor was cooled down to 50 °C and a 5%H2/95%Ar mixture was introduced at a rate of 40 mL/min. The sample was heated up to from 50 °C to 800 °C at a temperature increasing rate 10 °C/min. The amount of hydrogen consumed during the TPR procedure was monitored on-line by a thermal conductivity detector.
The morphological features and the Ni nanoparticle size distribution on the Ni/SBA-15 catalysts, and the formation of carbon nanotubes of the spent catalysts were studied by transmission electron microscope (JEM-ARM200CF model, JEOL, Tokyo, Japan) at an accelerating voltage of 200 kv.
Raman spectroscopy was employed to explore the formation of amorphous carbon and carbon nanotubes of the spent catalysts. The Raman spectra were recorded on a Labram HR800 Raman spectrometer (LabRAM HR800 model, HORIBA, Paris, France) within the wavenumber range from 100 cm−1 to 1200 cm−1. A He-Kr ion laser diode was used to generate a 514 nm wavelength exciting line as excitation laser source.

3.4. Catalytic Activity Evaluation

The methane catalytic decomposition over Ni/SBA-15 catalysts was performed inside a microreactor between 400 and 600 °C temperature under atmospheric pressure. One hundred and fifty milligrams of the catalysts were loaded in a stainless-steel reactor (10 mm outer diameter × 30 cm length) with an expanded reaction bed. The total reaction gases inlet flow was 75 mL/min (consisting of 6 mL of methane and 69 mL of Ar). The gaseous composition of the effluents was analyzed by an on-line gas chromatograph (GC) analyzer which was in couple with a PE-Molsieve capillary column, a thermal conductivity detector (TCD), and a flame ionization detector (FID). The TCD was used for hydrogen analysis and the FID for methane or other hydrocarbons determination.

4. Conclusions

In the Ni/SBA-15 catalysts, Ni nanoparticles (NPs) formed during the reduction procedure had different interaction strength with the SBA-15 support. Most Ni NPs were highly dispersed on SBA-15 and had a strong interaction with the support. In the CH4 catalytic decomposition reaction, the amorphous carbon predominately formed at the beginning of the methane decomposition reaction over Ni/SBA-15 catalysts, which may promote CH4 dehydrogenation. After the amount of amorphous carbon reached a certain value, they converted into graphite carbon, building up the carbon nanotubes, CNTs. All the CNTs consisted of a multiwall structure and grew towards different orientations through different mechanisms. Most of the CNTs were formed via the tip-growth mode or the base-growth mode, depending on the interaction strength between the Ni NPs and the SBA-15 support. Reaction temperature was found to affect the formation of the carbon morphologies. A higher reaction temperature led to formation of bamboo-like CNTs and onion-like carbon. During the methane decomposition procedure, hydrogen was produced with a 100% selectivity, whereas COx (CO2 and CO) was not detectable. The COx-free hydrogen and controllable growth CNTs were simultaneously produced, and they could be automatically separated in a single reactor. COx-free H2 is a clean fuel used for fuel cell engines and the formation of CNTs with different growth modes will be particularly important in applications such as sensors and design of field emission devices.

Author Contributions

Conceptualization, J.A.W.; Methodology, R.L.; Investigation, O.A.G.V. and U.A.; Writing, L.C.; Writing—Review and Editing, L.E.N.; Supervision, J.A.W.; Funding Acquisition, L.C., L.E.N. and J.A.W. All authors have read and agreed to the published version of the manuscript.

Funding

This work was funded by the Instituto Politécnico Nacional in Mexico (Grant No. SIP-20210451 and SIP20210888).

Data Availability Statement

Not applicable.

Acknowledgments

Help in the Rietveld refinements from Julio González is acknowledged.

Conflicts of Interest

The authors claim that there is no interest conflict.

References

  1. Aiello, R.; Fiscus, J.E.; Loye, H.-C.Z.; Amiridis, M.D. Hydrogen production via the direct cracking of methane over Ni/SiO2: Catalyst deactivation and regeneration. Appl. Catal. A Gen. 2000, 192, 227–234. [Google Scholar] [CrossRef]
  2. Holladay, J.D.; Hu, J.; King, D.L.; Wang, Y. An overview of hydrogen production technologies. Catal. Today 2009, 139, 244–260. [Google Scholar] [CrossRef]
  3. Armor, J. The multiple roles for catalysis in the production of H2. Appl. Catal. A Gen. 1999, 176, 159–176. [Google Scholar] [CrossRef]
  4. Song, C. Fuel processing for low-temperature and high-temperature fuel cells Challenges, and opportunities for sustainable development in the 21st century. Catal. Today 2002, 77, 17–49. [Google Scholar] [CrossRef]
  5. McHugh, K. Hydrogen Production Methods; MPR Associates Inc.: Alexandria, VA, USA, 2005; Volume 41, Available online: www.mpr.com/pubs (accessed on 10 September 2015).
  6. Song, H.; Zhang, L.; Ozkan, U.S. Effect of synthesis parameters on the catalytic activity of Co–ZrO2 for bio-ethanol steam reforming. Green Chem. 2007, 9, 686–694. [Google Scholar] [CrossRef]
  7. Zhang, Y.; Smith, K.J. CH4 decomposition on Co catalysts: Effect of temperature, dispersion, and the presence of H2 or CO in the feed. Catal. Today 2002, 77, 257–268. [Google Scholar] [CrossRef]
  8. Li, Y.; Li, D.; Wang, G. Methane decomposition to COx-free hydrogen and nano-carbon material on group 8–10 base metal catalysts: A review. Catal. Today 2011, 162, 1–48. [Google Scholar] [CrossRef]
  9. Collins, P.G.; Avouris, P. Nanotubes for Electronics. Sci. Am. 2000, 283, 62–69. [Google Scholar] [CrossRef]
  10. Collins, P.G.; Arnold, M.S.; Avouris, P. Engineering Carbon Nanotubes and Nanotube Circuits Using Electrical Breakdown. Science 2001, 292, 706–709. [Google Scholar] [CrossRef] [PubMed]
  11. Coleman, J.N.; Khan, U.; Blau, W.J.; Gun’Ko, Y. Small but strong: A review of the mechanical properties of carbon nanotube–polymer composites. Carbon 2006, 44, 1624–1652. [Google Scholar] [CrossRef]
  12. Barone, P.W.; Baik, S.; Heller, D.A.; Strano, M.S. Near-infrared optical sensors based on single-walled carbon nanotubes. Nat. Mater. 2004, 4, 86–92. [Google Scholar] [CrossRef]
  13. He, H.; Pham-Huy, L.A.; Dramou, P.; Xiao, D.; Zuo, P.; Pham-Huy, C. Carbon Nanotubes: Applications in Pharmacy and Medicine. BioMed Res. Int. 2013, 2013, 1–12. [Google Scholar] [CrossRef] [Green Version]
  14. Jhi, S.-H.; Kwon, Y.-K.; Bradley, K.; Gabriel, J.-C.P. Hydrogen storage by physisorption: Beyond carbon. Solid State Commun. 2004, 129, 769–773. [Google Scholar] [CrossRef]
  15. Peera, S.G.; Maiyalagan, T.; Liu, C.; Ashmath, S.; Lee, T.G.; Jiang, Z.; Mao, S. A review on carbon and non-precious metal based cathode catalysts in microbial fuel cells. Int. J. Hydrog. Energy 2021, 46, 3056–3089. [Google Scholar] [CrossRef]
  16. Camilli, L.; Pisani, C.; Gautron, E.; Scarselli, M.; Castrucci, P.; D’Orazio, F.; Passacantando, M.; Moscone, D.; De Crescenzi, M. A three-dimensional carbon nanotube network for water treatment. Nanotechnology 2014, 25, 065701. [Google Scholar] [CrossRef]
  17. Venugopal, A.; Kumar, S.N.; Ashok, J.; Prasad, D.H.; Kumari, V.D.; Prasad, K.; Subrahmanyam, M. Hydrogen production by catalytic decomposition of methane over Ni/SiO2. Int. J. Hydrog. Energy 2007, 32, 1782–1788. [Google Scholar] [CrossRef]
  18. Wang, H.; Baker, R.T.K. Decomposition of Methane over a Ni−Cu−MgO Catalyst to Produce Hydrogen and Carbon Nanofibers. J. Phys. Chem. B 2004, 108, 20273–20277. [Google Scholar] [CrossRef]
  19. Zaikovskii, V.I.; Chesnokov, V.V.; Buyanov, R.A. The Relationship between the State of Active Species in a Ni/Al2O3Catalyst and the Mechanism of Growth of Filamentous Carbon. Kinet. Catal. 2001, 42, 813–820. [Google Scholar] [CrossRef]
  20. Salmones, J.; Wang, J.; Valenzuela, M.; Sánchez, E.; García, A. Pore geometry influence on the deactivation behavior of Ni-based catalysts for simultaneous production of hydrogen and nanocarbon. Catal. Today 2009, 148, 134–139. [Google Scholar] [CrossRef]
  21. Guevara, J.; Wang, J.; Chen, L.; Valenzuela, M.; Salas, P.; García-Ruiz, A.F.; Toledo, J.; Cortes-Jácome, M.; Angeles-Chavez, C.; Novaro, O. Ni/Ce-MCM-41 mesostructured catalysts for simultaneous production of hydrogen and nanocarbon via methane decomposition. Int. J. Hydrog. Energy 2010, 35, 3509–3521. [Google Scholar] [CrossRef]
  22. Wang, Z.; Navarrete, J. Production of Carbon Nanotubes and Hydrogen Catalyzed with Ni/MCM-41 Catalysts. Green Sustain. Chem. 2012, 2, 91–96. [Google Scholar] [CrossRef] [Green Version]
  23. Ciuparu, D.; Chen, Y.; Lim, S.; Yang, Y.; Haller, G.L.; Pfefferle, L. Mechanism of Cobalt Cluster Size Control in Co-MCM-41 during Single-Wall Carbon Nanotubes Synthesis by CO Disproportionation. J. Phys. Chem. B 2004, 108, 15565–15571. [Google Scholar] [CrossRef]
  24. Ermakova, M.A.; Ermakov, D.Y.; Chuvilin, A.; Kuvshinov, G.G. Decomposition of Methane over Iron Catalysts at the Range of Moderate Temperatures: The Influence of Structure of the Catalytic Systems and the Reaction Conditions on the Yield of Carbon and Morphology of Carbon Filaments. J. Catal. 2001, 201, 183–197. [Google Scholar] [CrossRef]
  25. Pudukudy, M.; Yaakob, Z. Methane decomposition over Ni, Co and Fe based monometallic catalysts supported on sol gel derived SiO2 microflakes. Chem. Eng. J. 2015, 262, 1009–1021. [Google Scholar] [CrossRef]
  26. An, W.; Zeng, X.C.; Turner, C.H. First-principles study of methane dehydrogenation on a bimetallic Cu/Ni(111) surface. J. Chem. Phys. 2009, 131, 174702. [Google Scholar] [CrossRef]
  27. Li, J.; Xiao, C.; Xiong, L.; Chen, X.; Zhao, L.; Dong, L.; Du, Y.; Yang, Y.; Wang, H.; Peng, S. Hydrogen production by methane decomposition over Ni–Cu–SiO2 catalysts: Effect of temperature on catalyst deactivation. RSC Adv. 2016, 6, 52154–52163. [Google Scholar] [CrossRef]
  28. Lua, A.C.; Wang, H.Y. Hydrogen production by catalytic decomposition of methane over Ni-Cu-Co alloy particles. Appl. Catal. B Environ. 2014, 156–157, 84–93. [Google Scholar] [CrossRef]
  29. Yao, D.; Zhang, Y.; Williams, P.T.; Yang, H.; Chen, H. Co-production of hydrogen and carbon nanotubes from real-world waste plastics: Influence of catalyst composition and operational parameters. Appl. Catal. B Environ. 2018, 221, 584–597. [Google Scholar] [CrossRef]
  30. Hernández, A.; Noreña-Franco, L.E.; Chen, L.F.; Wang, J.A.; Aguilar, J. Refinery Oil Fraction Fuels Obtained from Polyethylene Catalytic Cracking Employing Heteropolyacid-MCM-41 Materials. Adv. Mater. Res. 2010, 132, 236–245. [Google Scholar] [CrossRef]
  31. Wen, X.; Chen, X.; Tian, N.; Gong, J.; Liu, J.; Rümmeli, M.H.; Chu, P.K.; Mijiwska, E.; Tang, T. Nanosized Carbon Black Combined with Ni2O3 as “Universal” Catalysts for Synergistically Catalyzing Carbonization of Polyolefin Wastes to Synthesize Carbon Nanotubes and Application for Supercapacitors. Environ. Sci. Technol. 2014, 48, 4048–4055. [Google Scholar] [CrossRef]
  32. Michaelides, A.; Hu, P. Softened C–H modes of adsorbed methyl and their implications for dehydrogenation: An ab initio study. J. Chem. Phys. 2001, 114, 2523–2526. [Google Scholar] [CrossRef]
  33. Sharma, A.; Saito, I.; Nakagawa, H.; Miura, K. Effect of carbonization temperature on the nickel crystallite size of a Ni/C catalyst for catalytic hydrothermal gasification of organic compounds. Fuel 2007, 86, 915–920. [Google Scholar] [CrossRef]
  34. Shaikhutdinov, S.K.; Avdeeva, L.; Goncharova, O.; Kochubey, D.; Novgorodov, B.; Plyasova, L. Coprecipitated Ni-Al and Ni-Cu-Al catalysts for methane decomposition and carbon deposition I. Genesis of Calcined and reduced catalysts. Appl. Catal. A Gen. 1995, 126, 125–139. [Google Scholar] [CrossRef]
  35. Ganesh, P.; Kent, P.R.C.; Mochalin, V. Formation, characterization, and dynamics of onion-like carbon structures for electrical energy storage from nanodiamonds using reactive force fields. J. Appl. Phys. 2011, 110, 073506. [Google Scholar] [CrossRef]
  36. Zeiger, M.; Jäckel, N.; Mochalin, V.N.; Presser, V. Review: Carbon onions for electrochemical energy storage. J. Mater. Chem. A 2015, 4, 3172–3196. [Google Scholar] [CrossRef] [Green Version]
  37. Lutterotti, L. MAUD Version 2.55. Available online: http://www.maud.radiographema.com (accessed on 15 May 2015).
  38. Young, R.A.; Sakthivel, A.; Moss, T.S.; Paiva-Santos, C.O. DBWS-9411—An upgrade of the DBWS*.* programs for Rietveld refinement with PC and mainframe computers. J. Appl. Crystallogr. 1995, 28, 366–367. [Google Scholar] [CrossRef]
Figure 1. XRD patterns of the Ni/SBA-15 catalysts.
Catalysts 11 01217 g001
Figure 2. A Rietveld refinement plot of the 25 wt%Ni/SBA-15 catalyst.
Catalysts 11 01217 g002
Figure 3. TEM micrographs of SBA-15 and Ni/SBA-15 catalysts. (A) SBA-15; (B) SBA-15; (C) 10 wt%Ni/SBA-15; (D) 15 wt%Ni/SBA-15; (E) 25 wt%Niwt%/SBA-15.
Catalysts 11 01217 g003
Figure 4. H2-TPR profiles of the Ni/SBA-15 catalysts.
Catalysts 11 01217 g004
Figure 5. CH4 conversion over the Ni/SBA-15 catalysts at different temperatures.
Catalysts 11 01217 g005
Figure 6. CH4 conversion as a function of reaction time over the SBA-15 catalysts.
Catalysts 11 01217 g006
Figure 7. Raman spectra of 15 wt%Ni/SBA-15 catalyst recorded at the different times at the initial reaction stage.
Catalysts 11 01217 g007
Figure 8. Methane conversion and ID/IG ratios as a function of reaction time in the initial reaction stage. The data of the ID/IG ratio were obtained from the 15 wt%Ni/SBA-15 catalyst.
Catalysts 11 01217 g008
Figure 9. TEM micrographs of Ni/SBA-15 catalysts. (A) 15 wt%Ni/SBA-15 after 10 min of reaction at 600 °C; (B) 15 wt%Ni/SBA-15 after 120 min of reaction at 600 °C; (C) 15 wt%Ni/SBA-15 after 440 min of reaction at 600 °C. Many CNTs with a base-growth mode were formed: (D) CNTs with a base-growth mode on 15 wt%Ni/SBA-15 after 440 min of reaction at 600 °C.
Catalysts 11 01217 g009
Figure 10. TEM micrographs of Ni/SBA-15 catalysts. (A,B) CNTs with bamboo-like shape on 15 wt%Ni/SBA-15 after 120 min of reaction at 800 °C. (C) Onion-like carbons formation on 10 wt%Ni/SBA-15 after 120 min of reaction at 800 °C. (D) CNTs grew toward different orientations on 25 wt%Ni/SBA-15 after 120 min of reaction at 600 °C.
Catalysts 11 01217 g010
Figure 11. Nanocarbon growth modes on the Ni/SBA-15 catalysts. (A) CNTs base-growth mode; (B) CNTs tip-growth mode; (C) CNTs bamboo-like growth mode; (D) onion-like carbon formation mode; (E) carbon formation with multi-orientation on large size Ni NPs.
Catalysts 11 01217 g011
Table 1. Crystalline structure data of Ni NPs obtained from the Rietveld refinement *.
CatalystCrystallite Size
(nm)
Cell Parameter a0
(Å)
Rwp
(%)
10 wt%Ni/SBA-1512.233.52414.62
15 wt%Ni/SBA-1525.593.53601.06
25 wt%Ni/SBA-1528.503.52590.58
* The crystal structure: cubic; Space group: Fm-3m; Space Group Number: 225. The Ni atom sites are at 4a with atomic fractional coordinate (x, y, z) = (0, 0, 0).
Table 2. Textural properties of Ni/SBA-15 catalysts.
CatalystSurface Area
(m2/g)
Pore Diameter
(nm)
Pore Volume
(cm3/g)
SBA-15695.06.90.804
10% Ni/SBA-15627.46.60.725
15% Ni/SBA-15517.76.00.649
25% Ni/SBA-15383.15.20.600
Publisher’s Note: MDPI stays neutral with regard to jurisdictional claims in published maps and institutional affiliations.

