Article

Synthesis and Characterization of Sn/Ni Single Doped and Co–Doped Anatase/Rutile Mixed–Crystal Nanomaterials and Their Photocatalytic Performance under UV–Visible Light

1
Intelligent Manufacturing College, Chengdu Jincheng College, Chengdu 611731, China
2
College of Mechanical Engineering, Chengdu University, Chengdu 610106, China
*
Authors to whom correspondence should be addressed.
Catalysts 2021, 11(11), 1341; https://doi.org/10.3390/catal11111341
Submission received: 19 October 2021 / Revised: 5 November 2021 / Accepted: 5 November 2021 / Published: 8 November 2021

Abstract

:
Pure and Sn/Ni co–doped TiO2 nanomaterials with anatase/rutile mixed crystal were prepared and characterized. The results show that pure TiO2 is a mixed crystal structure composed of a large amount of anatase and a small amount of rutile. Sn doping promotes the phase transformation from anatase to rutile, while Ni doping inhibits the transformation. Both single doping and co–doping are beneficial to the inhibition of photoinduced charge recombination. Sn doping shows the best inhibitory effect on photogenerated charge recombination, and increases the utilization of visible light, displaying the highest photocatalytic activity. The decolorization degree of methylene blue (MB) by Sn–TiO2 is 79.5% after 150 min. The reaction rate constant of Sn–TiO2 is 0.01022 min−1, which is 5.6 times higher than pure TiO2 (0.00181 min–1).

1. Introduction

Employing photocatalytic technology to degrade harmful substances is a feasible way to solve the problem of environmental pollution. Among the numerous photocatalysts, TiO2 has attracted the most attention and has been widely studied [1,2,3,4,5]. The lack of visible light utilization and quantum efficiency of pure TiO2 limit its photocatalytic activity [6,7]. Metal ion doping can form impurity level in the band gap and increase visible light absorption, which is one of the most commonly used methods in TiO2 modification [8,9,10,11,12,13]. Krishnakumar et al.’s work shows that the grain size and energy gap are reduced and the recombination of photogenerated pairs is suppressed by Cu doping, improving the photocatalytic activity [8]. Multiple elements co–doping could yield a cooperation effect in improving the performance of TiO2, obtaining better modification effect than single–element doping [14,15,16,17]. Kalantari et al. [16] found Fe and N co–doping develops a cooperation effect on improving the utilization of visible light because N doping move the valence band upward, and Fe doping introduces impurity levels below the conduction band.
It is generally believed that rutile exhibits lower photocatalytic activity than anatase due to its small specific surface area, poor adsorption performance, and few surface defects [18]. When rutile and anatase form a mixed crystal, since the mixed crystal structure will advance the transfer of photoinduced charges at the two–phase interface, it shows higher activity than single crystal [19,20,21,22,23].
Rutile is a thermodynamically stable phase and anatase will gradually transform into rutile with temperature rising. Therefore, anatase/rutile mixed crystal TiO2 may be obtained within a certain temperature range [24,25]. The two–phase composition has an important influence on the photocatalytic property of anatase/rutile mixed crystal. It is a common method to control the relative content of anatase and rutile in the mixed crystal by heat treatment temperature and holding time [26,27,28]. Elsellami et al. [27] found that the mixed crystal TiO2 composed of anatase 96% and rutile 4% shows the highest photocatalytic activity, which was heat treated at 600 °C. In addition, the two–phase composition can be controlled by regulating the ratio of reactants [29,30]. Li et al. [29] prepared a series of mixed crystal TiO2 by changing the ratio of tartaric acid: TiCl3. The photocatalyst composed of 77% anatase and 23% rutile (tartaric acid: TiCl3 = 0.1) shows the highest activity.
Abundant researches focus on controlling phase composition of anatase/rutile mixed crystal by heat treatment temperature. In this work, the influence of doping elements on the anatase→rutile phase transformation was adopted to regulate the phase composition at a fixed temperature. Sn and Ni elements doping were employed to modify TiO2 and adjust the content of anatase and rutile. The effect of co–doping on the structure and photocatalytic property of anatase/rutile mixed TiO2 were studied.

2. Results and Discussion

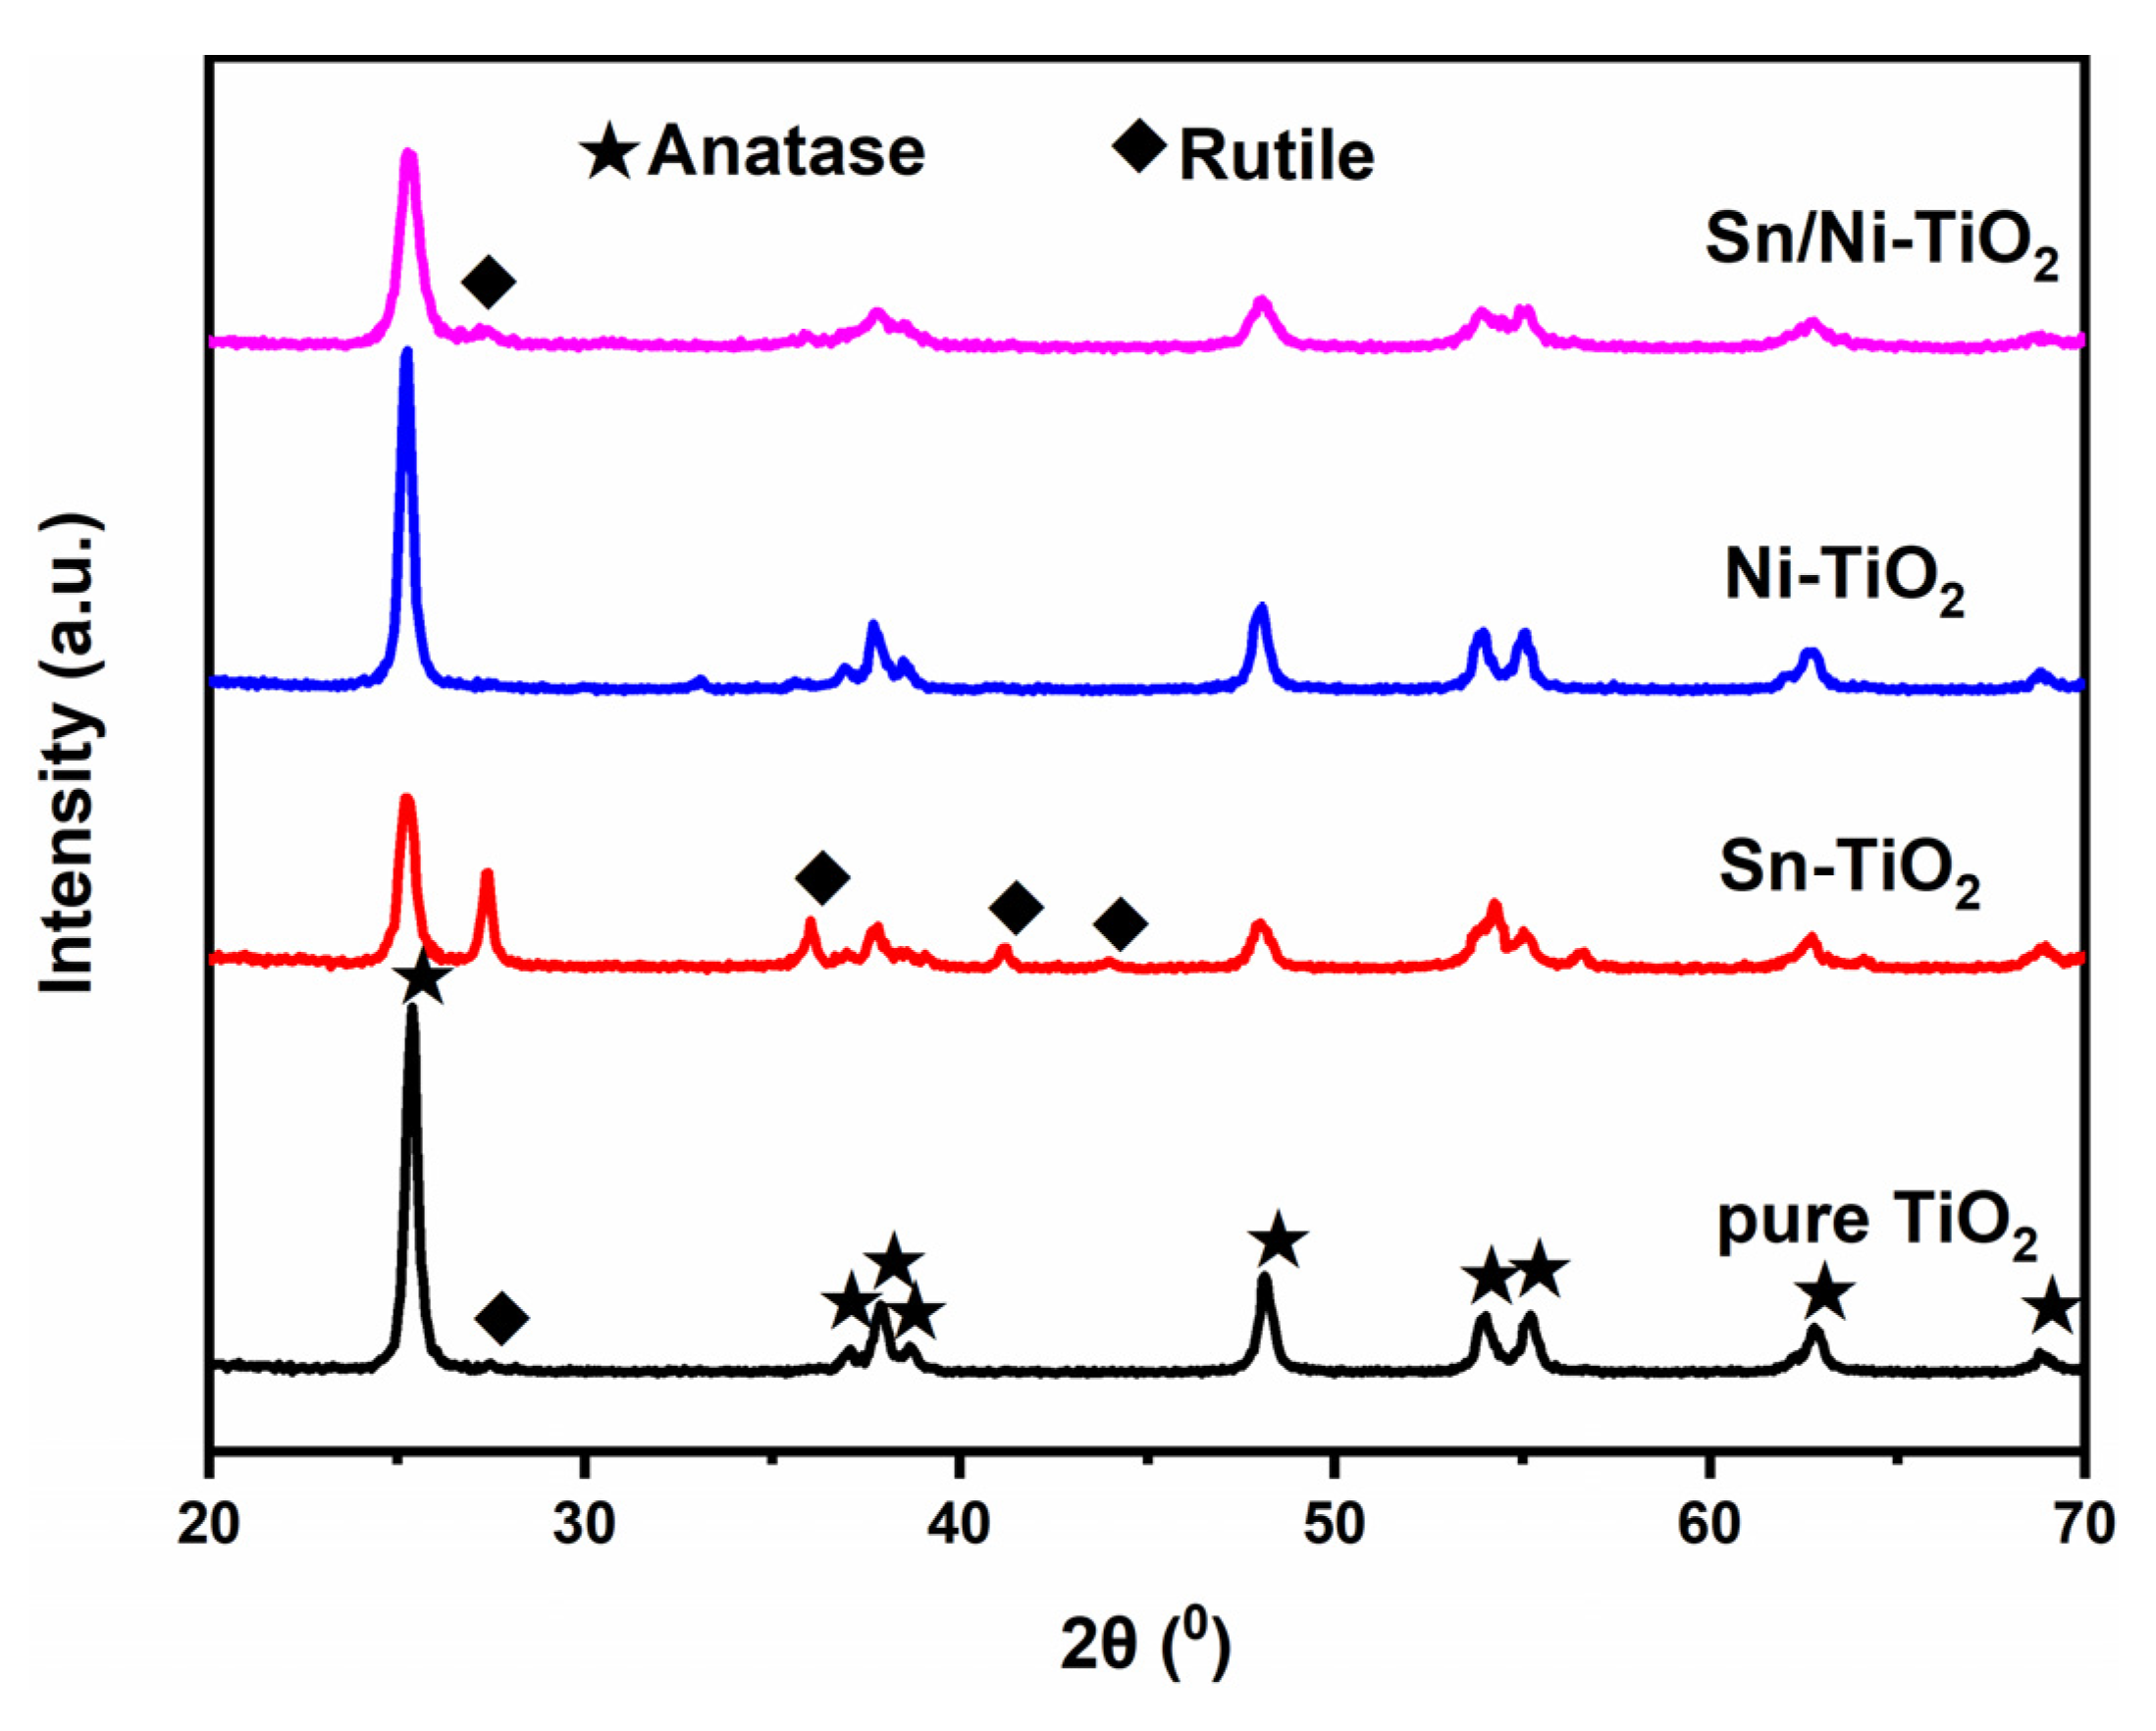
2.1. Crystal Structure
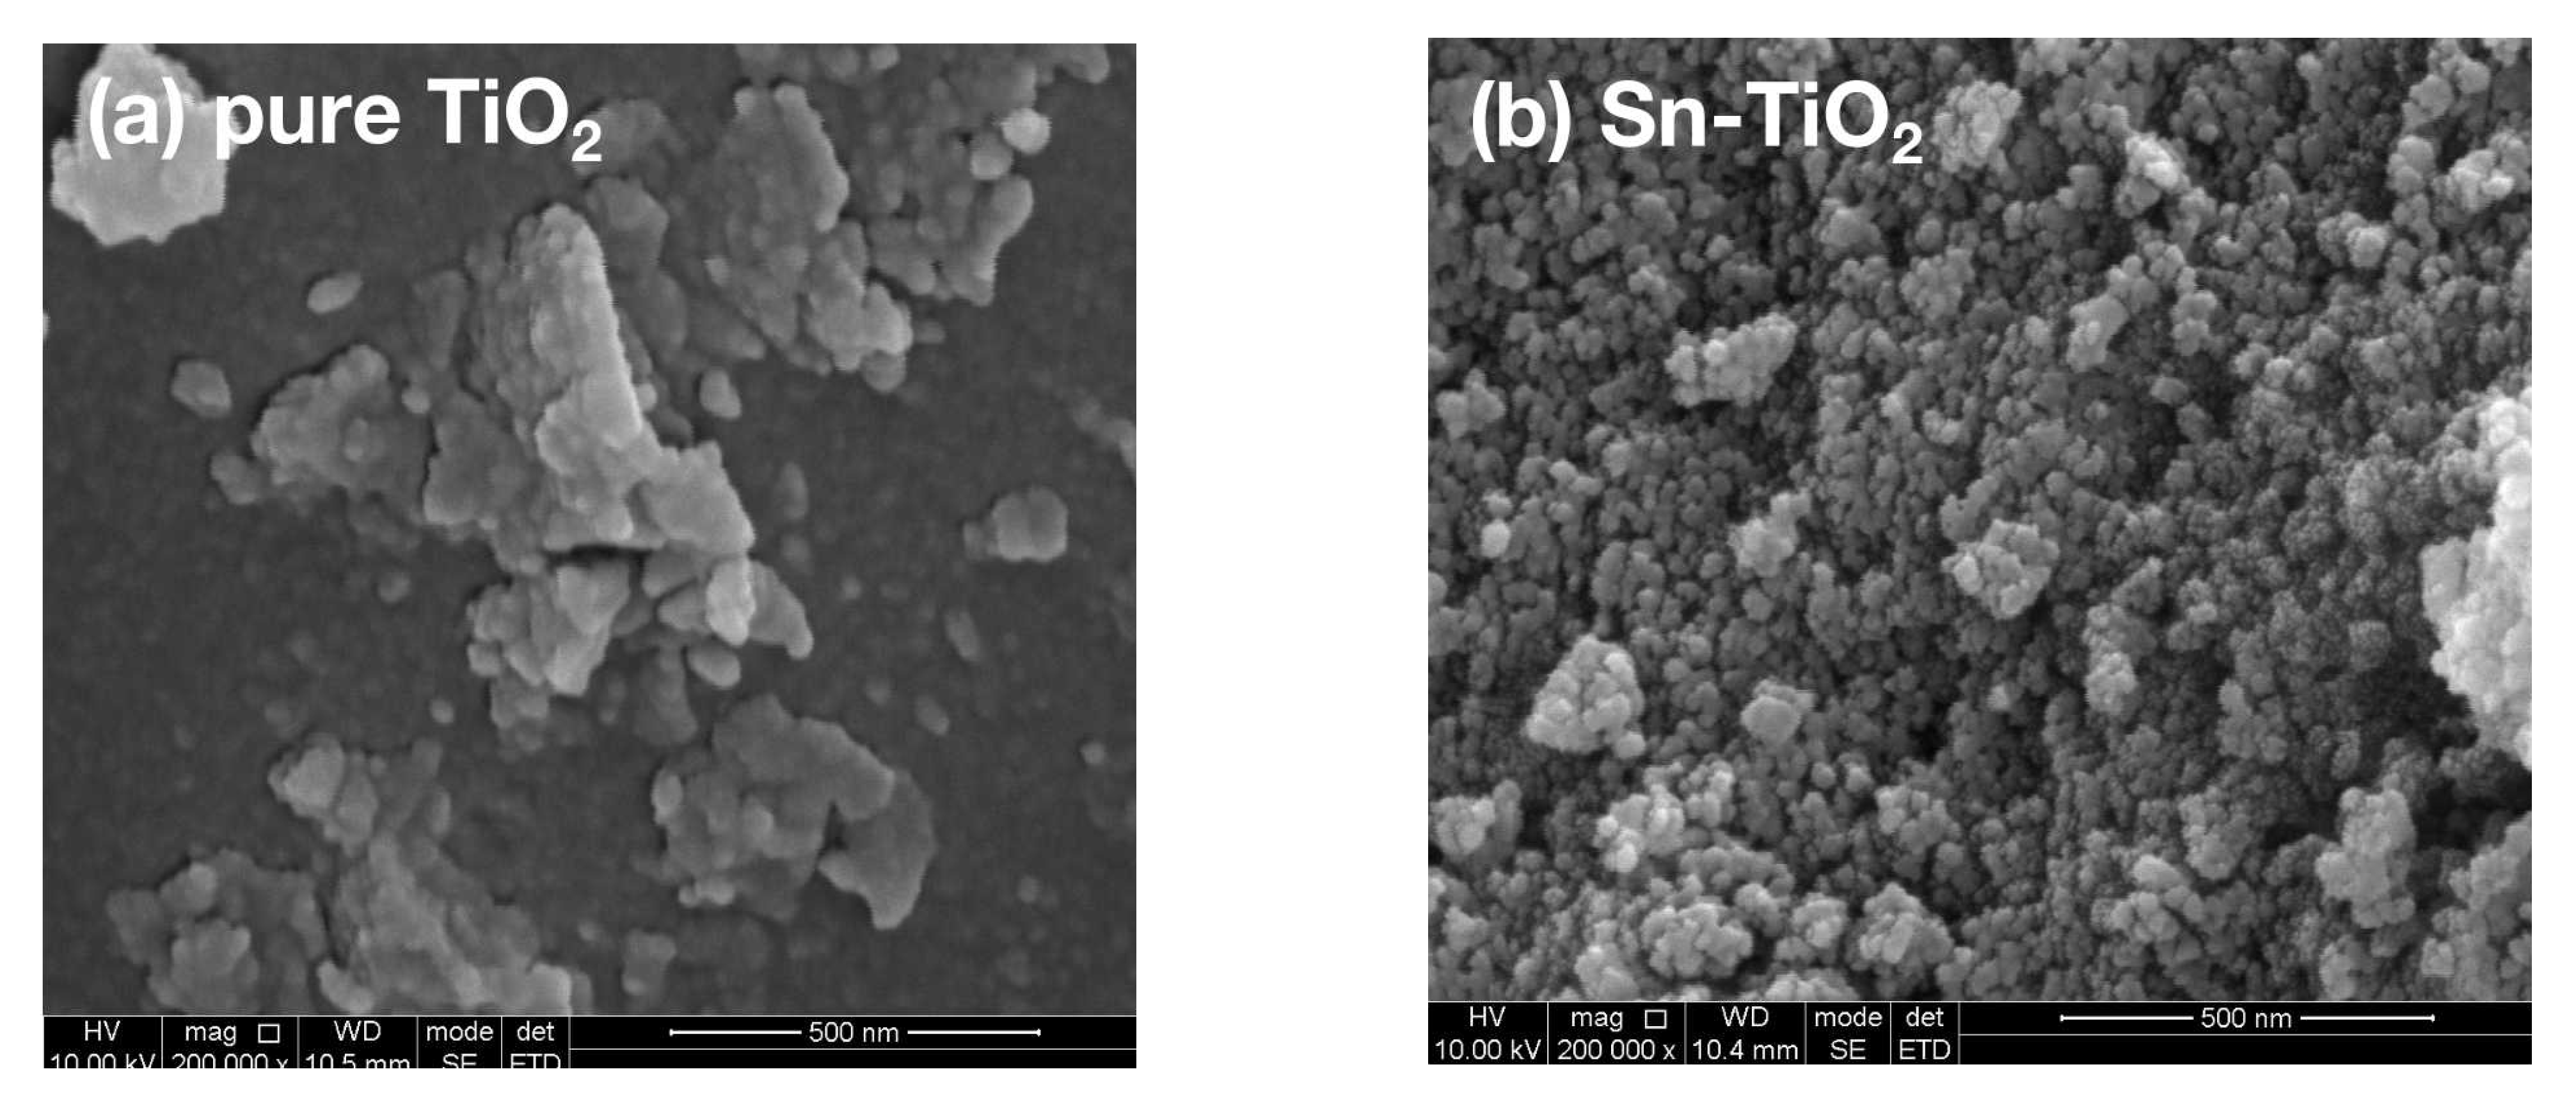
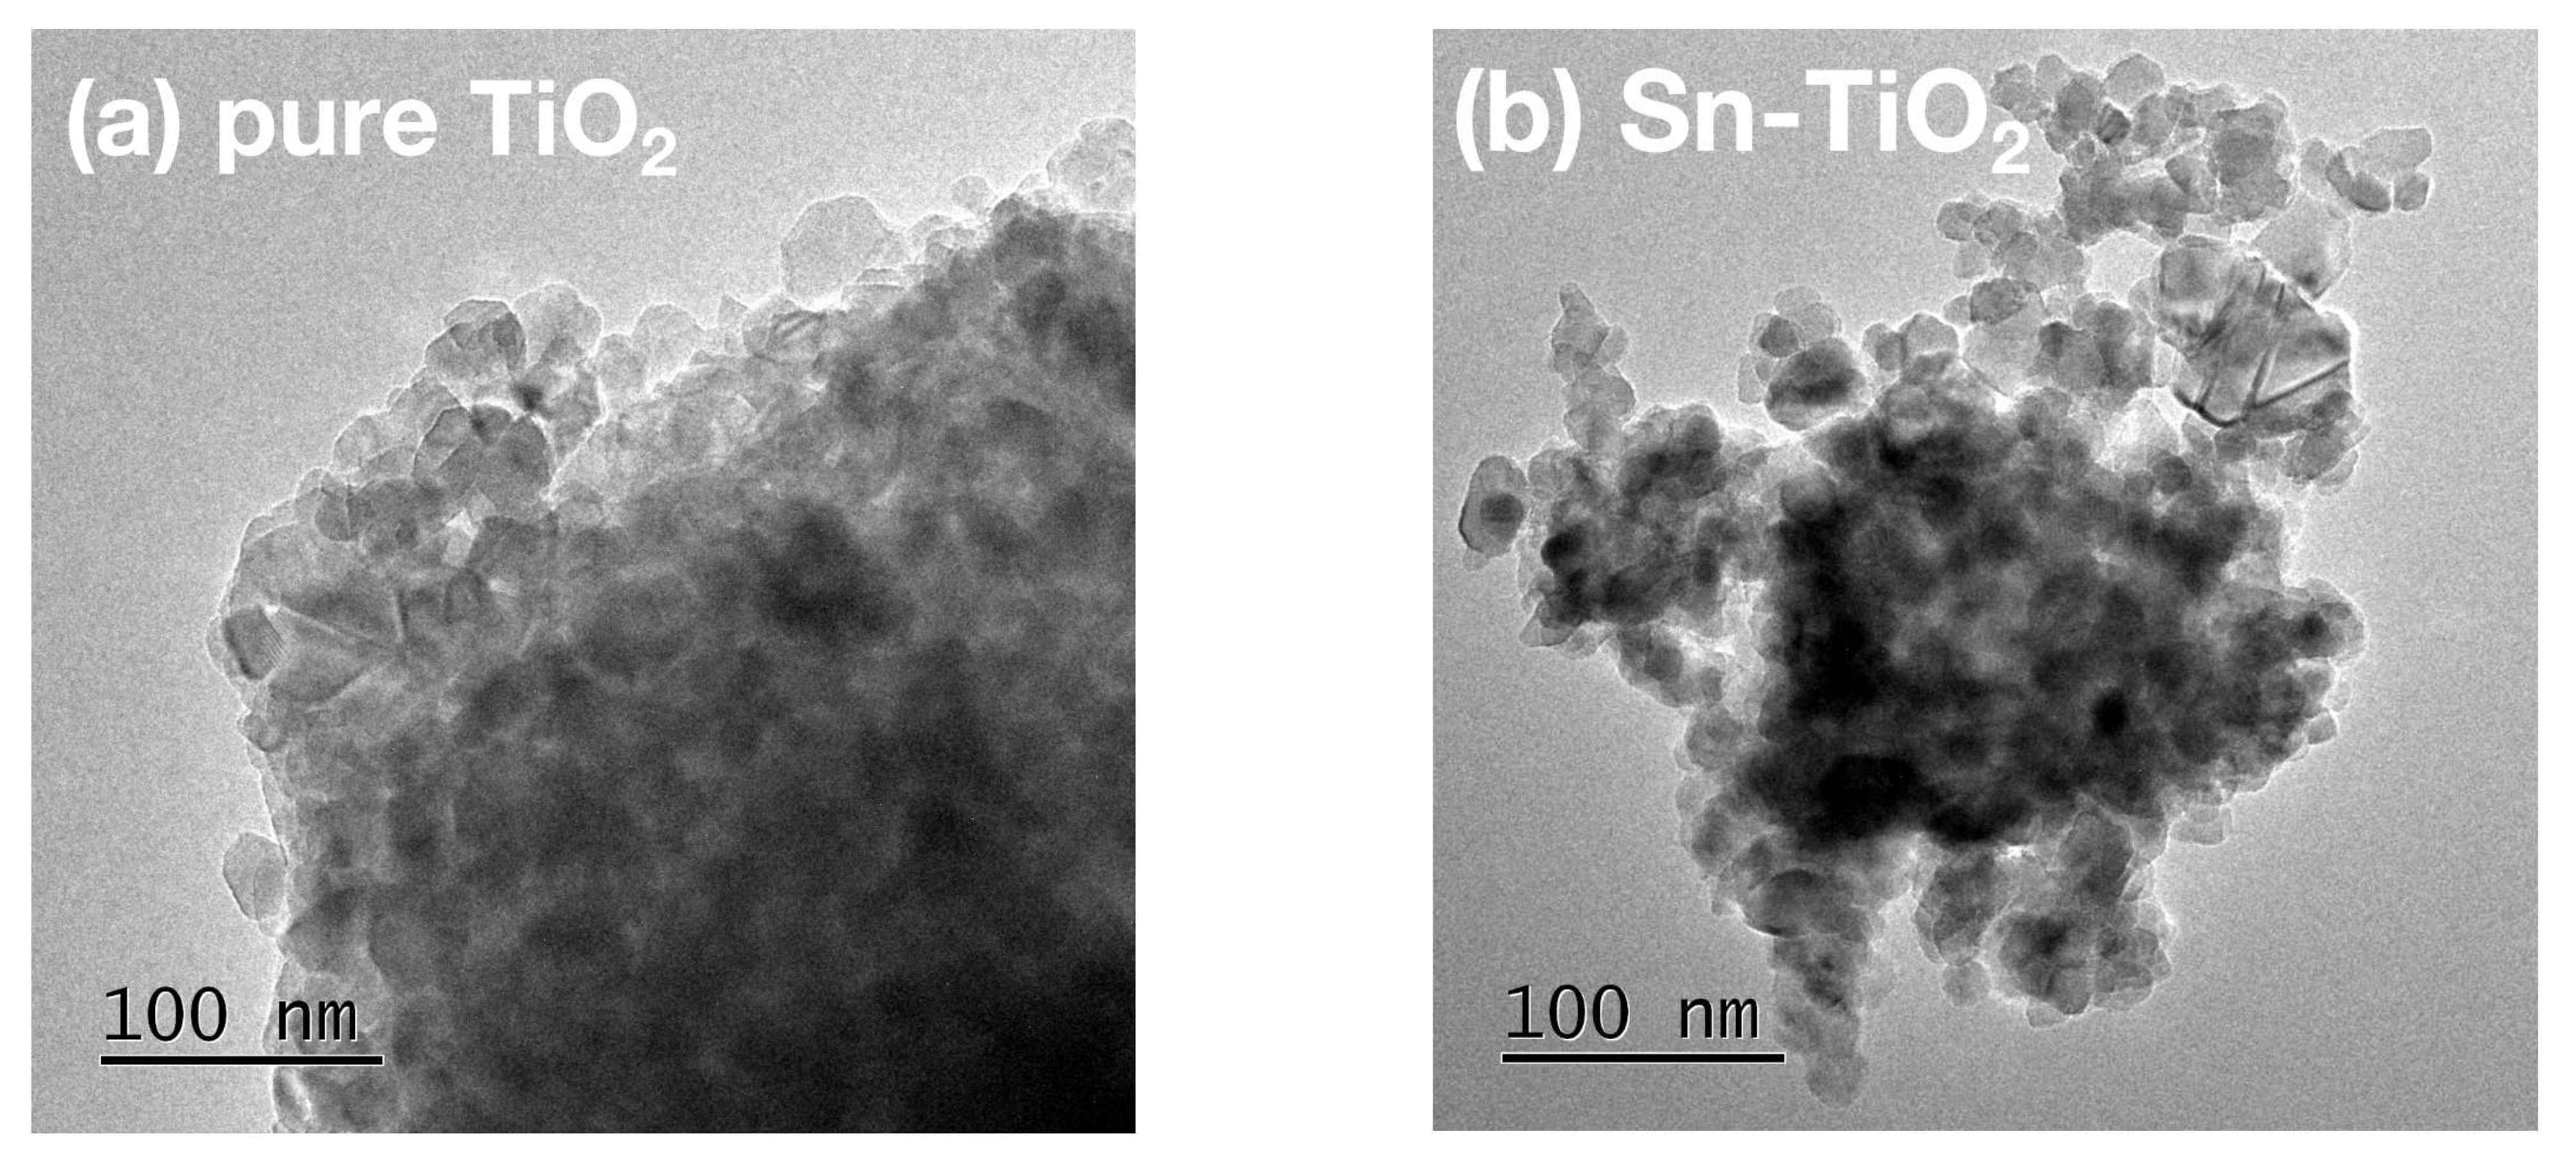
Figure 1 displays the XRD patterns of samples. The diffraction peaks of pure TiO2 at 25.4°, 37.1°, 37.9°, 38.7°, 48.2°, 54.0°, 55.2°, and 62.7° correspond to the (101), (103), (004), (112), (200), (105), (211), and (204) crystal planes of anatase structure. Besides, a faint diffraction peak around 27.5° can be ascribed to the (110) plane of rutile structure, which confirms that pure TiO2 is anatase/rutile mixed crystal structure. Compared with pure TiO2, the anatase peak intensity of Sn–TiO2 decreases, while the peak intensity of rutile increases. The rutile content is 41.1%, which is higher than that of pure TiO2 (2.1%), indicating that the transformation from anatase to rutile was advanced by Sn doping. The crystal structure SnO2 is similar to rutile, which can act as the nucleation center of rutile and accelerate the formation and growth process of rutile nucleus, thus promotes the phase transformation [31]. No peak of rutile is detected in Ni–TiO2 and all the peaks are ascribing to anatase, which indicates that Ni doping inhibits the phase transformation [32]. The effect of doping on phase transformation may be related to the oxide fusing point of doped elements [33]. If the fusing point of the oxide is higher than TiO2, it shows inhibition effect, and when it is lower than TiO2, it promotes the phase transformation. The fusing point of SnO2 (1127 °C) is lower than TiO2 (1640 °C), and the fusing point of NiO is (1990 °C) higher than TiO2. On the other hand, the radium of Sn4+ and Ni2+ (0.069 nm) is close to Ti4+ radium (0.0605 nm), which makes Sn4+ and Ni2+ ions able to enter into the lattice to replace Ti4+ ions, bringing more crystal defects and promoting the phase transformation [34]. In summary, Sn doping and Ni doping exhibit the promotion and suppression of phase transition, respectively. The rutile content of Sn/Ni–TiO2 sample is 5.3%, which is higher than pure TiO2, indicating that the promotion effect of Sn doping on phase transformation is greater than the inhibition effect of Ni doping. The crystalline size and phase composition of the obtained photocatalysts are listed in Table 1.

2.2. Morphology

Figure 2 shows the SEM images of samples. The pure TiO2 is granular and the size of a single particle is 20 nm, approximately. The agglomeration is serious, and the sizes of the agglomerates range from 20–200 nm. Ni–TiO2 and Sn/Ni–TiO2 exhibit similar morphology to pure TiO2. However, the particles in Sn–TiO2 are looser, the agglomeration relieves, and the agglomerate size decreases.
The TEM and HRTEM images of pure TiO2 (a, c) and Sn–TiO2 (b, d) were exhibited in Figure 3. It is observed that the single particle size of pure TiO2 is 20–30 nm, and the particle size of Sn–TiO2 is smaller (15–20 nm). The crystal plane spacing marked in Figure 3c 0.348 nm can be attributed to the anatase (101) crystal plane. In Figure 3d, the marked crystal plane spacing is 0.355 nm, ascribing to the crystal plane of anatase (101), which is slightly increased compared to pure TiO2 [20]. As the radius of Sn4+ is larger than Ti4+, Sn4+ ions enter into TiO2 lattice to replace Ti4+ ions, causing lattice expansion and increasing the crystal plane spacing [35,36,37]. The interplanar spacing 0.325 nm in Figure 3d can be ascribed to the rutile (110) crystal plane, indicating that Sn–TiO2 is mixed crystal structure [38]. This is consistent with XRD results.

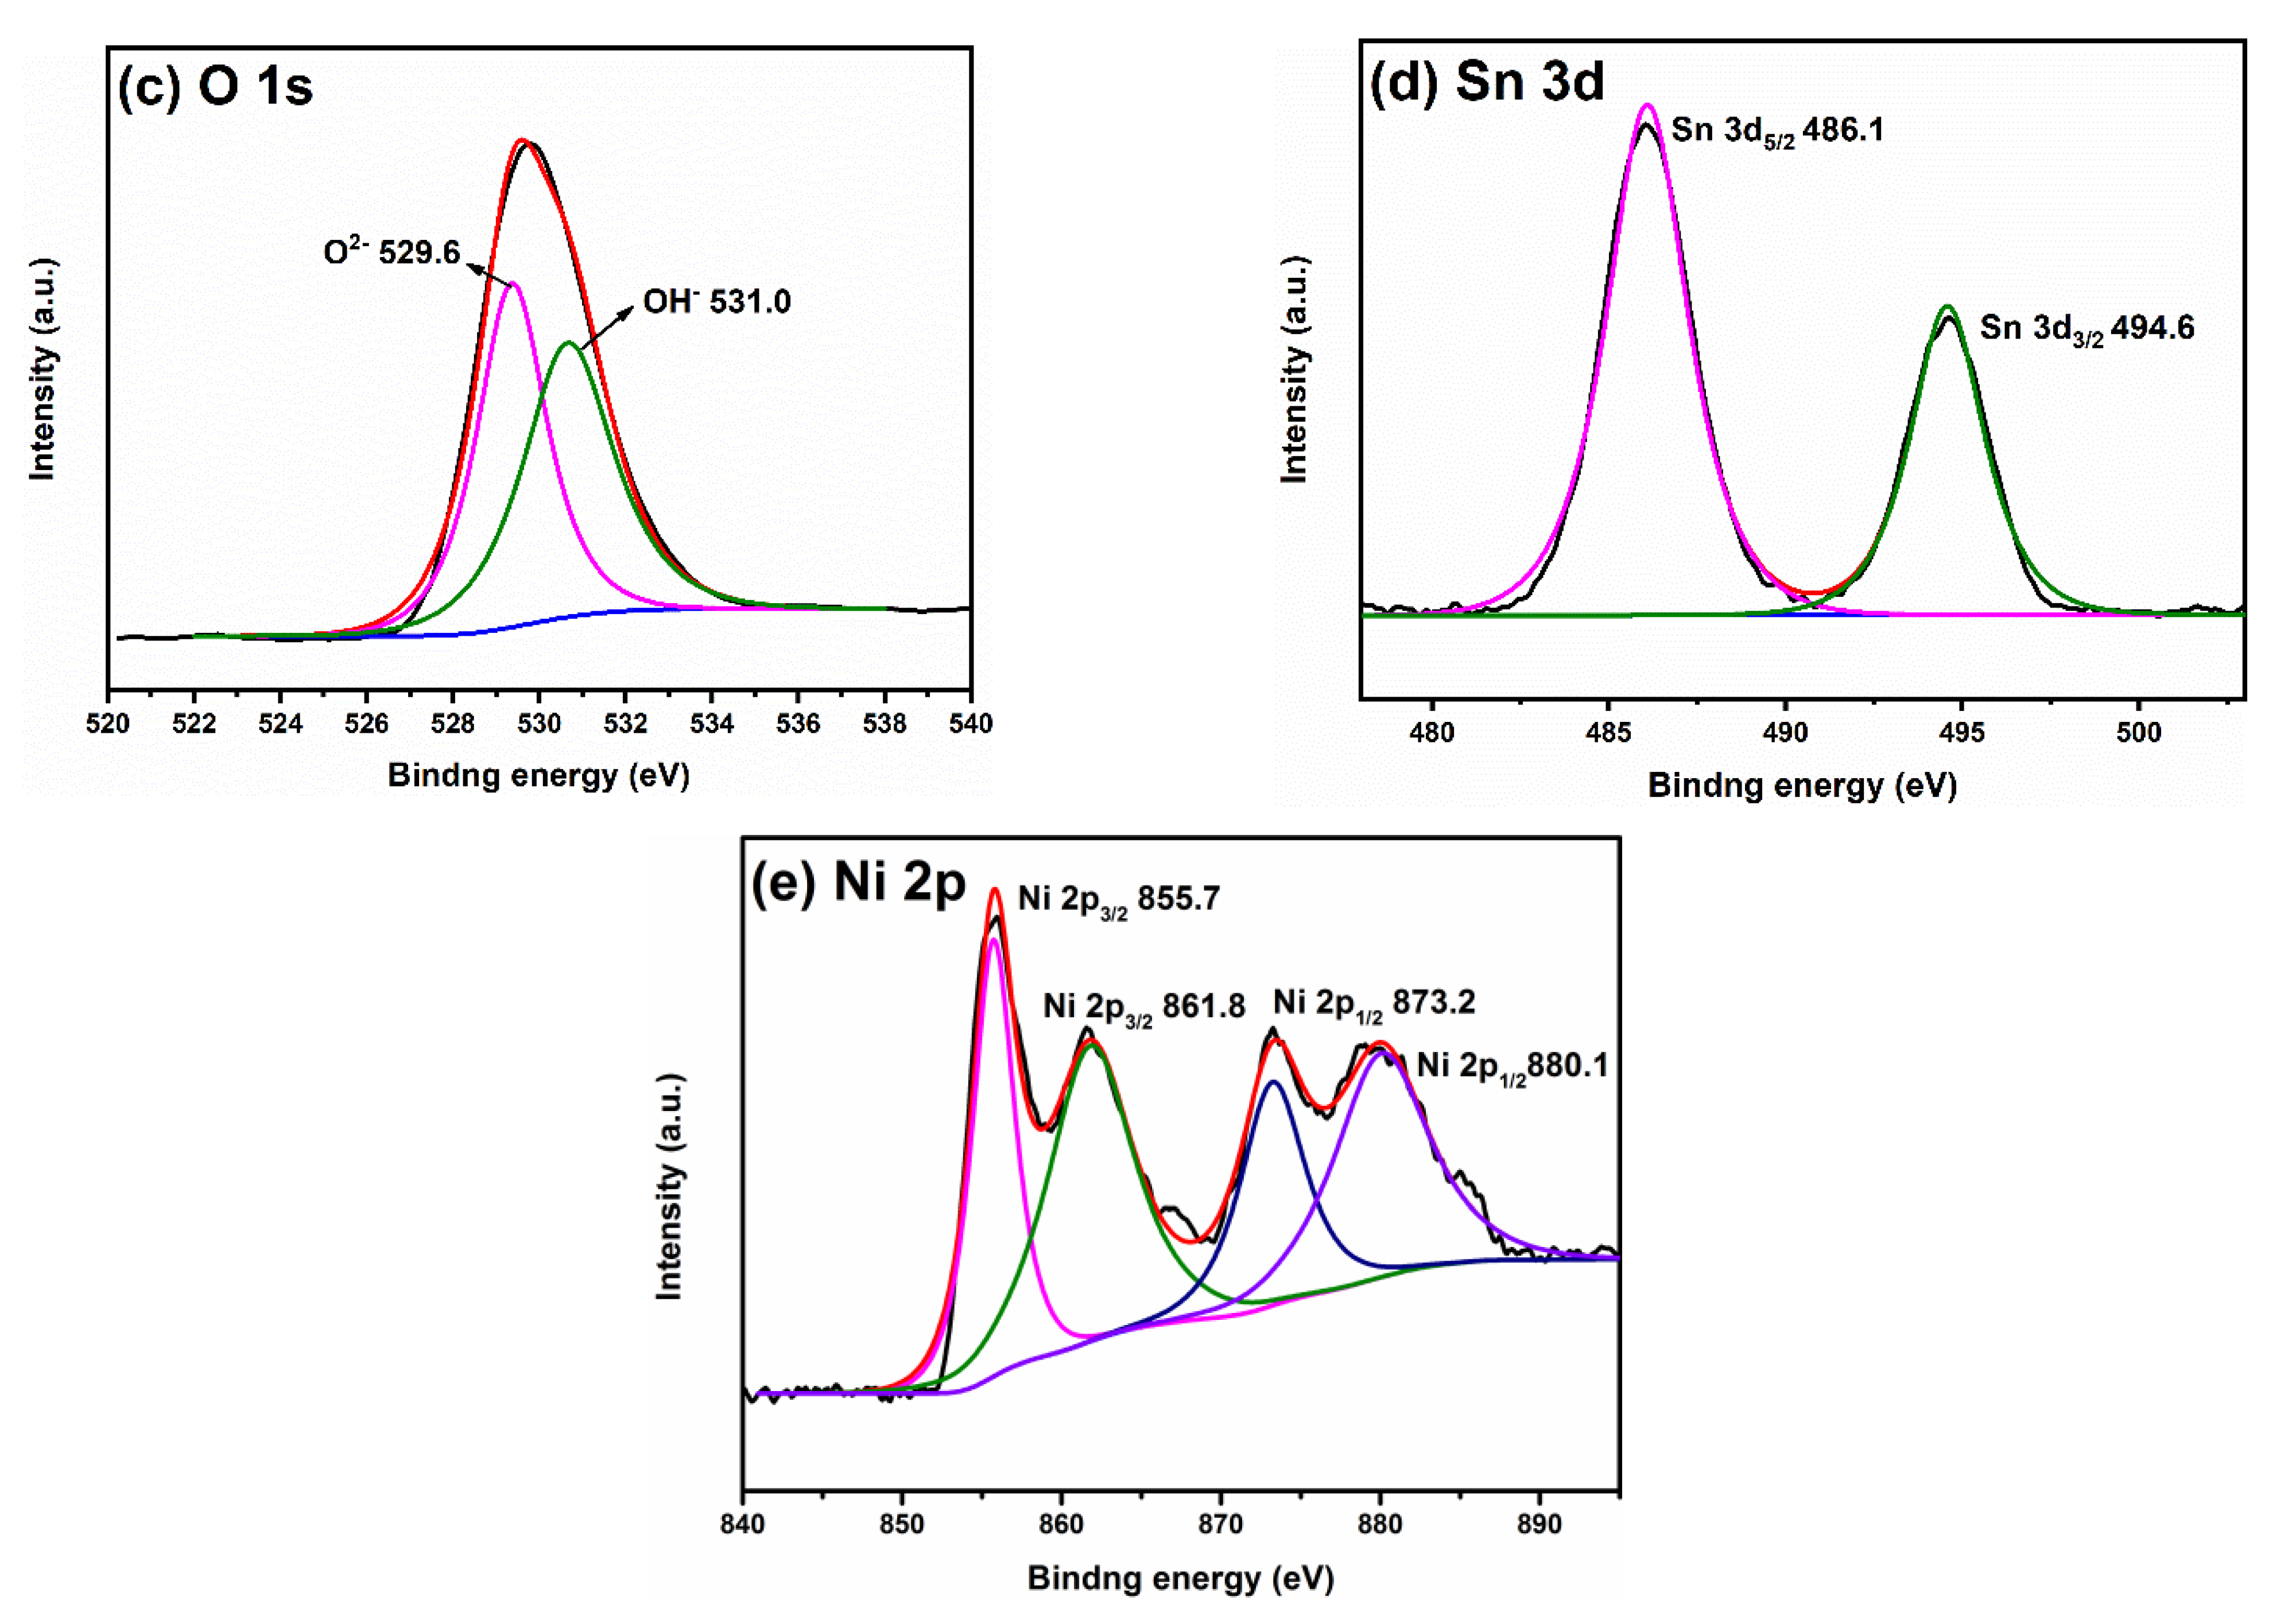
2.3. Element Composition and State

Figure 4 presents the XPS spectra of Sn/Ni–TiO2. The full spectrum displays that Sn/Ni–TiO2 sample contains five elements: Ti, O, C, Sn, and Ni. Two characteristic peaks of Ti 2p located at 458.3 eV and 464.0 eV are attributed to Ti 2p3/2 and Ti 2p1/2. The distance between the two peaks is 5.7 eV, implying that Ti element exists as Ti4+ [38,39]. The O 1s peak splits into two characteristic peaks at 529.6 eV and 531.0 eV, corresponding to lattice oxygen (O2−) and surface hydroxyl (OH) [5,38]. The Sn 3d spectrum consists of two peaks at 486.1 eV and 494.6 eV, which are ascribed to Sn 3d5/2 and Sn 3d3/2, indicating that Sn element exists as Sn4+ [35]. The peaks located at 855.7 eV and 861.8 eV correspond to Ni 2p3/2 and the peaks located at 873.2 eV and 880.1 eV correspond to Ni 2p1/2, suggesting that Ni element exists in the form of +2 valence [14,40,41].

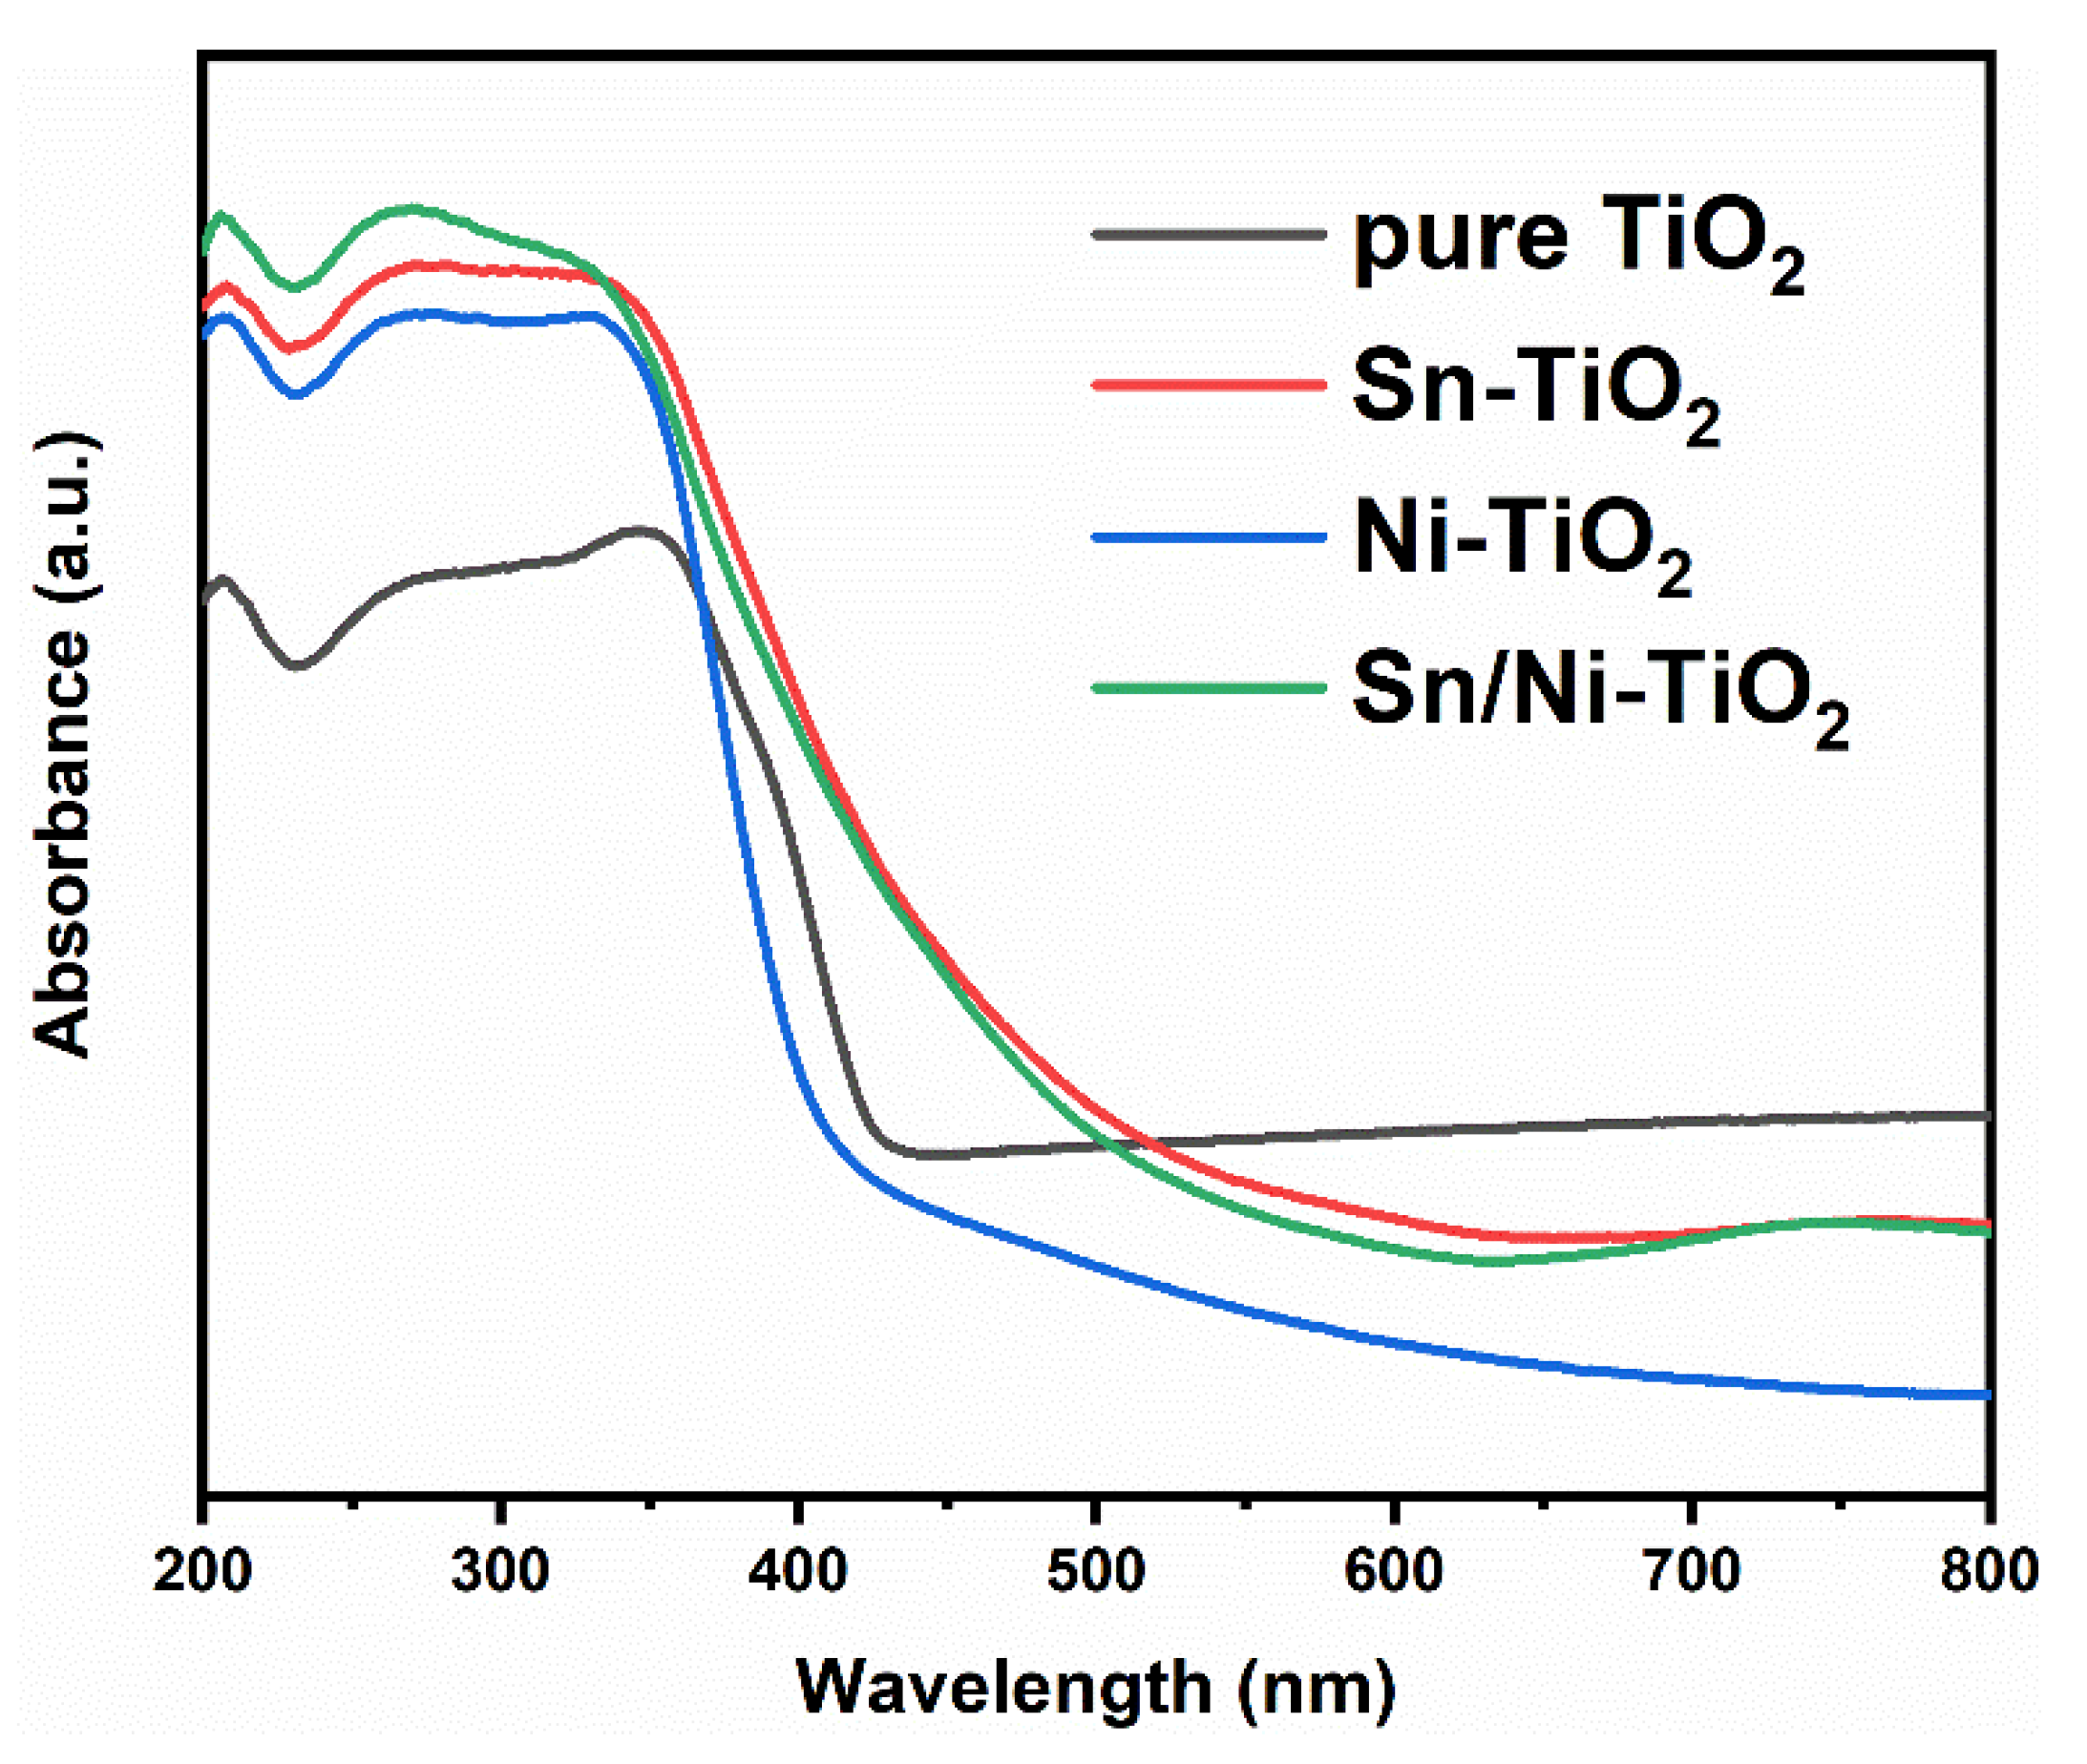
2.4. Optical Property

Figure 5 displays the PL spectra. The main peak of pure TiO2 is around 400 nm, which is derived from the direct recombination of photogenerated electrons from conduction band back to valence band with holes. The PL peaks between 440–480 nm mainly originated from the recombination of photogenerated electrons in oxygen vacancies or crystal defects [42,43]. All of the doped samples show less PL peak intensity than pure TiO2, indicating that both single doping and co-doping are beneficial to inhibiting the recombination of photogenerated charges. Crystal defects and oxygen vacancies are introduced by doping, which capture photoinduced charges, improving quantum efficiency. Remarkably, Sn–TiO2 shows the lowest PL peak intensity. XRD and HRTEM results reveal that Sn–TiO2 is anatase/rutile mixed phase structure, which is beneficial to the migration of photogenerated charges between phase interfaces [44]. Multi–doping produces a synergistic effect on introducing defects and inhibiting carrier recombination and improves quantum efficiency [15]. Nevertheless, the peak intensity of Sn/Ni–TiO2 is less than Ni–TiO2 but higher than Sn–TiO2. The rutile ratio in Sn/Ni–TiO2 is trace (5.3%), which makes the mixed crystal effect insufficient [21,26]. Therefore, Sn/Ni–TiO2 is inferior to Sn–TiO2 in inhibiting photogenerated charges recombination because the anatase/rutile phase composition of Sn–TiO2 is suitable, which can reflect the mixed crystal effect to a large extent.
Figure 6 shows the UV–Vis absorption spectra. The absorption of doped samples in the ultraviolet part is higher than that of pure TiO2. Ni–TiO2 shows a blue shift, while Sn–TiO2 and Sn/Ni–TiO2 show a red shift. Sn doping is in favor of the visible light utilization.

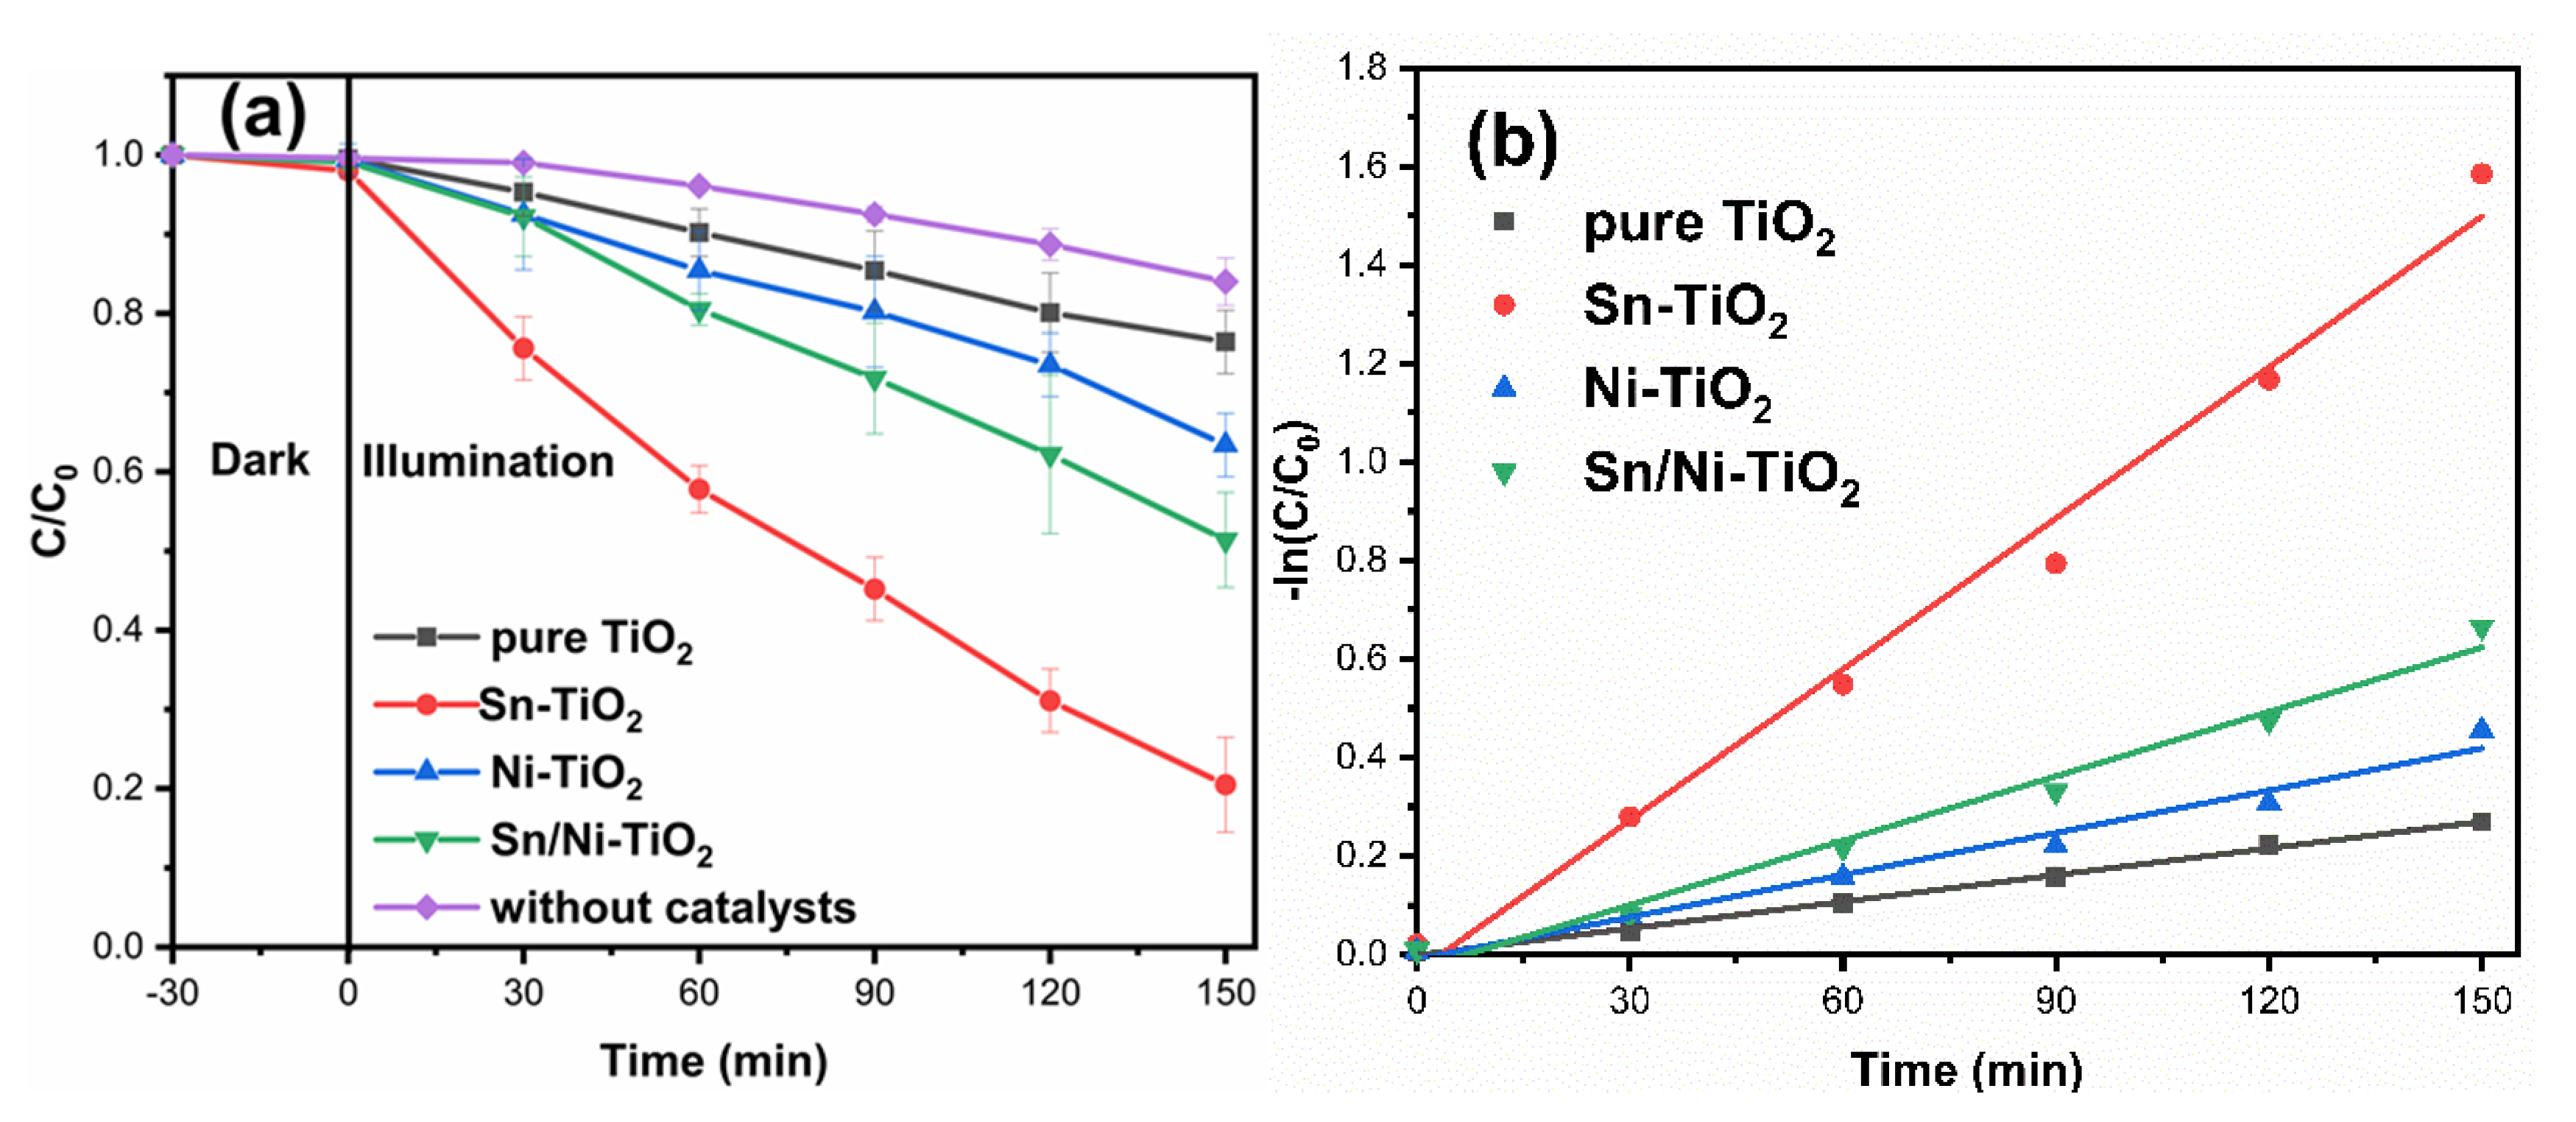
2.5. Photocatalytic Activity

Figure 7a displays the decolorization degree curves of samples. Without catalyst, the decolorization degree of MB is 16.0% under irradiation after 150 min. The decolorization degree of pure TiO2 is 23.6%, which is lower than Ni–TiO2 (36.6%). The PL results prove that the recombination rate decreases after Ni doping, which is conducive to photocatalytic property. The decolorization degree of Sn–TiO2 is 79.5%, which is significantly higher than pure TiO2. Sn–TiO2 exhibits the highest quantum efficiency and Sn doping improves the utilization of visible light, therefore, the photocatalytic property of Sn–TiO2 is the best. The decolorization degree of Sn/Ni–TiO2 is 48.6%, which is lower than Sn–TiO2 but higher than Ni–TiO2. This is in line with the PL results.
Figure 7b shows the kinetics curve of samples. The decolorization of MB conforms to first–order reaction. The reaction rate constant k is computed using the formula kt = −ln (Ct/C0) (where t represents the reaction time, C0 represents the initial concentration of MB, and Ct represents the concentration of MB at time t). The higher k is, the faster the reaction rate is. The calculated results show that the reaction rate constant of Sn–TiO2 is 0.01022 min−1, which is 5.6 times higher than pure TiO2 (0.00181 min−1).

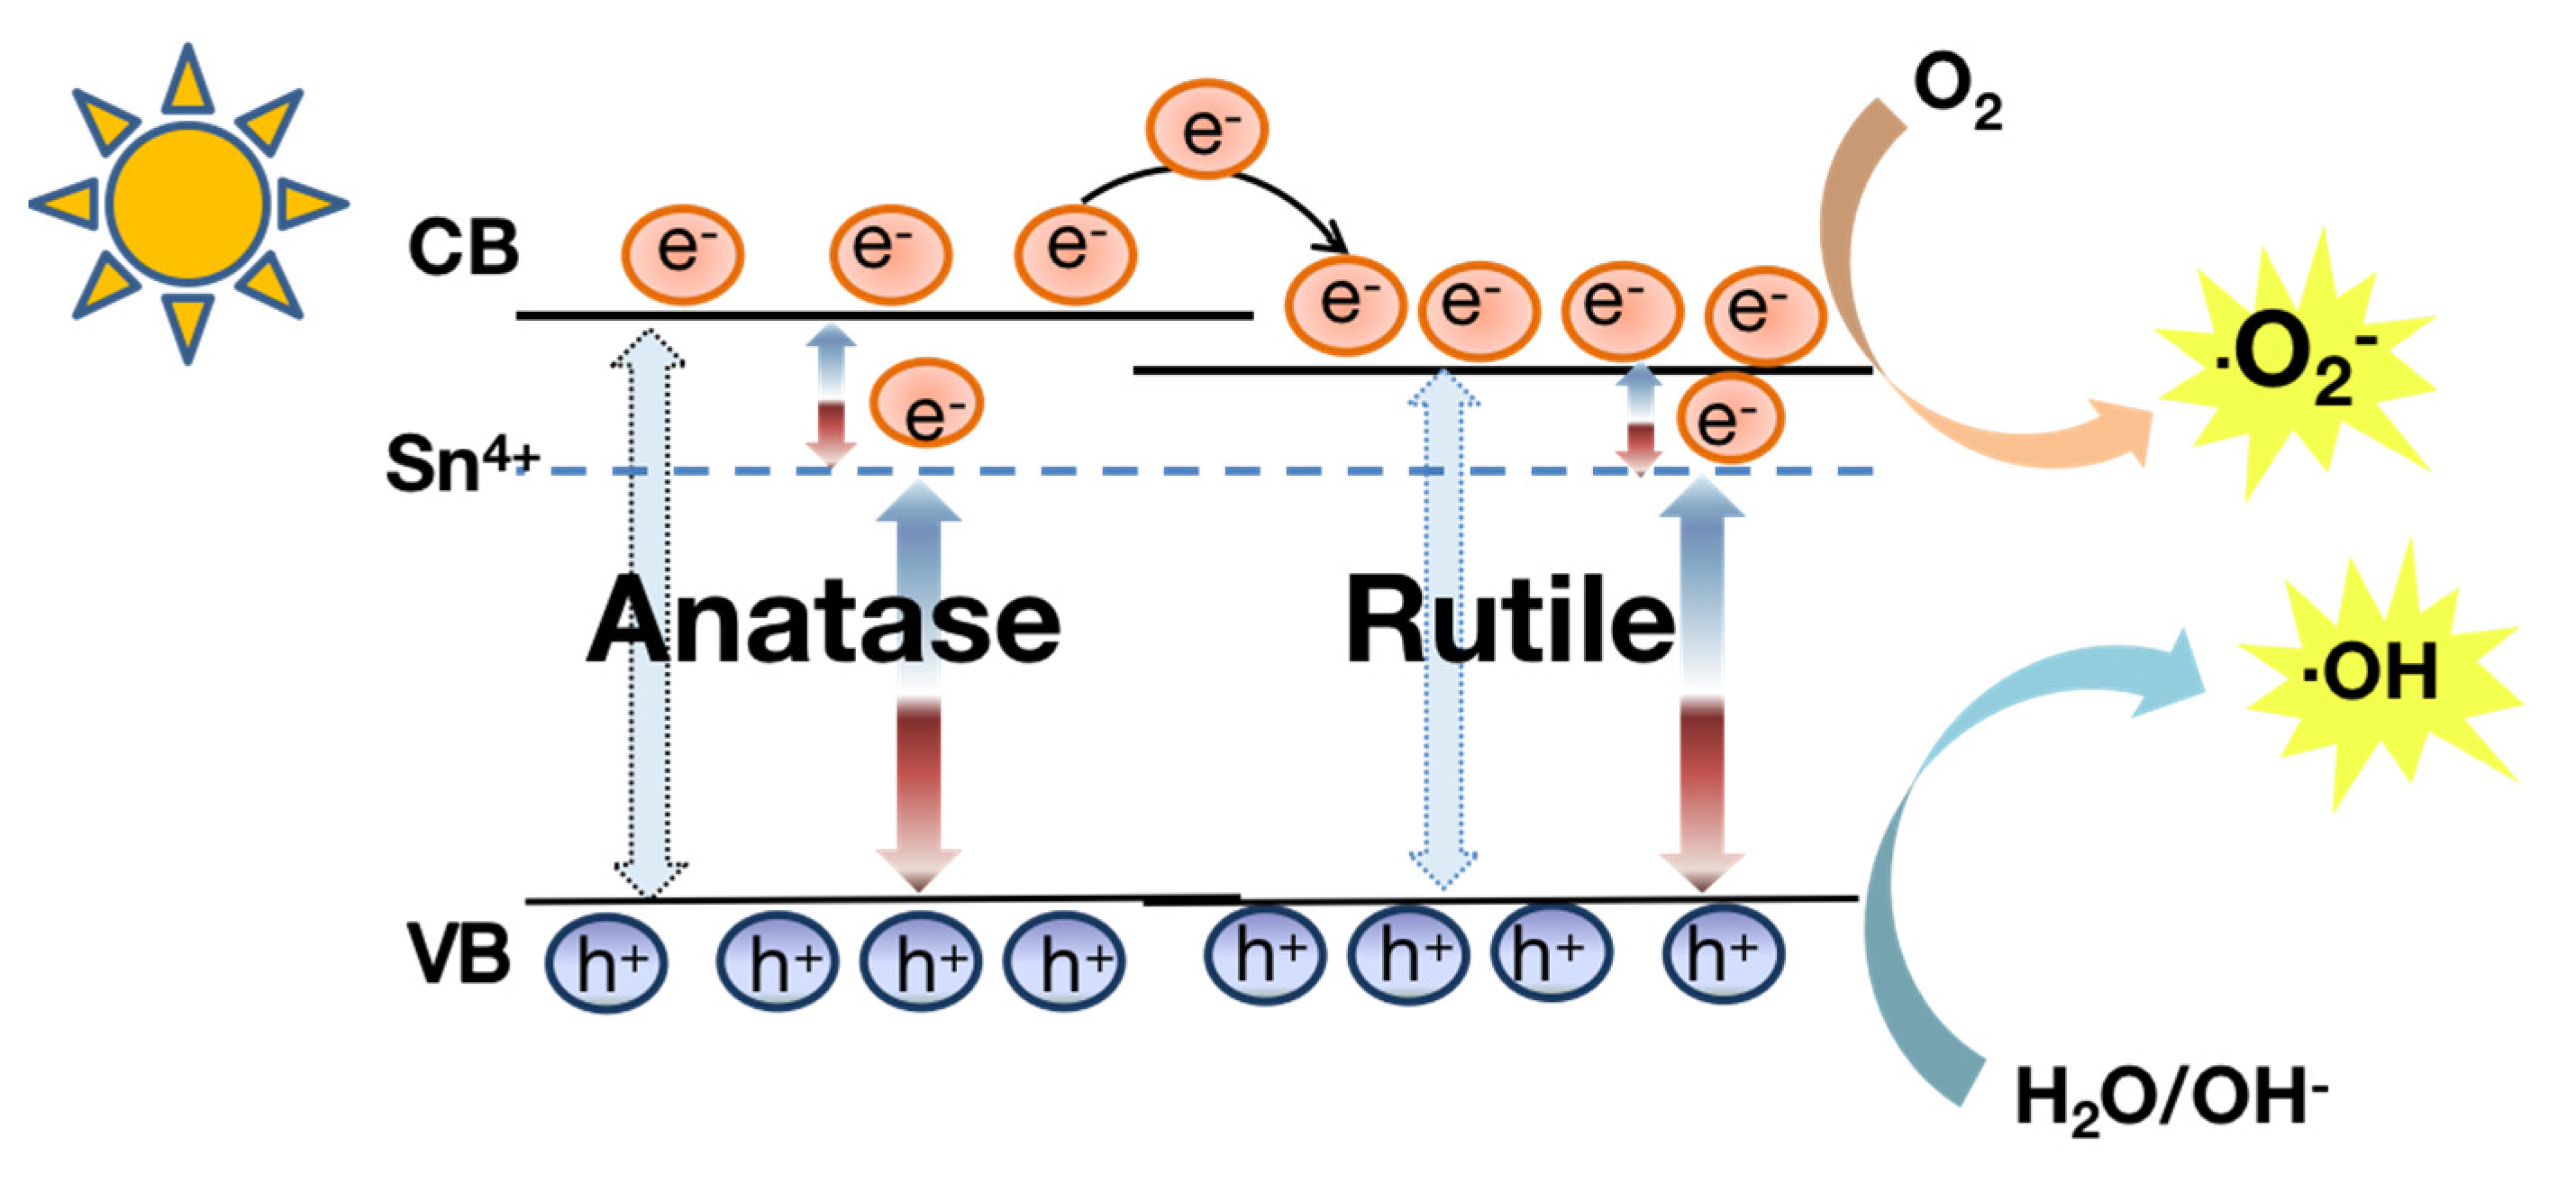
2.6. Mechanism of Photocatalytic

Figure 8 is the schematic diagram of transfer path of the photogenerated charges in Sn–TiO2. XRD and HRTEM results confirm that Sn–TiO2 is an anatase/rutile mixed crystal structure. Electrons in valence band (VB) will be excited to conduction band (CB) to form photogenerated electrons when TiO2 is exposed under light irradiation, leaving corresponding holes in VB. On the one hand, Sn doping introduces impurity energy level in forbidden band, reducing the excitation energy, promoting the utilization of light source. On the other hand, since the position of rutile CB is lower than anatase, the electrons in anatase CB will migrate to rutile CB, which speeds up the transfer of photoinduced electrons, prolongs the carrier life and improves the quantum efficiency [19,20,21]. The separated photogenerated electrons react with O2 to generate superoxide free radicals •O2 and holes react with OH to generate •OH radicals. These free radicals and holes (h+) decompose MB owing to their strong oxidation [19,45].

3. Experimental

3.1. Sample Preparation

Anhydrous ethanol (Analytical Reagent, AR), butyl titanate (AR), glacial acetic acid (AR), stannic chloride (AR), nickel chloride (AR) and methylene blue (AR) were purchased from Chengdu Chron Chemicals Co., Ltd. (Chengdu, China).
Solution A was obtained by adding butyl titanate and absolute ethyl alcohol in a volume ratio of 7:10. Deionized water, anhydrous ethanol, and glacial acetic acid were added with a volume ratio of 1:6:2 to gain Solution B. The volume ratio of A:B is 17:9. Solution B was dropwise put into solution A to form a sol. After aging, the sol converted to gel, which was undergoing drying and calcining at 550 °C for 1 h to get pure TiO2. A certain amount of SnCl4·5H2O or NiCl2·6H2O was put into solution B to prepare Sn-doped, Ni-doped, and Sn/Ni co-doped TiO2. The molar ratios of Sn/Ti and Ni/Ti were both 3%. They were marked as Sn–TiO2, Ni–TiO2, and Sn/Ni–TiO2.

3.2. Sample Characterization

The crystal structure of samples was analyzed by a DX–2700 X–ray diffractometer (Dandong Haoyuan Instrument Co. Ltd., Dandong, China). The test current was 30 mA, the voltage was 40 kV, and the scanning angle was 20°–70° with the scanning speed being 0.06°/s. The crystallite sizes (D) were computed by the Scherrer formula: D = 0.89λ/βcosθ, where λ is the wavelength of Cu Ka, 2θ is the Bragg diffraction angle, and β is the full width at half maximum of the diffraction peak. The mass fraction of anatase (XA) was computed by formula: XA = (1 + 1.26(IR/IA))−1, where IR and IA are the intensities of rutile (110) plane and anatase (101) plane. The morphology of samples (SEM and TEM) was observed using a Inspect F50 scanning electron microscope and a Tecnai G2 F20 transmission electron microscope (FEI Company, Hillsboro, OR, USA). The element composition and valence were analyzed by a multifunctional surface analysis system (XSAM800, Kratos Ltd., Manchester, Britain); The photoluminescence spectra were recorded on a fluorescence spectrometer (F–4600, Shimadzu Group Company, Kyoto, Japan); The optical absorption was tested using an ultraviolet-visible photometer (UV–3600, Shimadzu Group Company, Kyoto, Japan).

3.3. Photocatalysis Experiment

100 mL (10 mg/L) MB aqueous solution and 100 mg samples were mixed in a beaker. The obtained mixture was stirred in dark 30 min to achieve the adsorption and desorption equilibrium. Next, a 250 W xenon lamp with wavelength from 300 nm to 800 nm was turned on, which was placed 7.5 cm above the liquid level. The absorbance of the mixture was measured every 30 min after irradiation. The decolorization degree (D) was computed using the equation D = (A0–At)/A0 × 100%.

4. Conclusions

Pure TiO2, Sn–TiO2, Ni–TiO2, and Sn/Ni–TiO2 nanomaterials were obtained through the sol–gel route. The phase transformation from anatase to rutile is advanced by Sn doping, while it is inhibited by Ni doping. Sn–TiO2 is anatase/rutile mixed crystal structure, which accelerates the migration of photoelectric charges in phase interface, increases the lifetime of charge carriers, and improves the quantum efficiency. Besides, Sn doping is in favor of light absorption. Sn/Ni–TiO2 is inferior to Sn–TiO2 in photoinduced charges separation owing to its trace rutile ratio, which limits the mixed crystal effect. Therefore, the photocatalytic activity of Sn–TiO2 is higher than Sn/Ni–TiO2 and pure TiO2. The first–order reaction rate constant of Sn–TiO2 is 5.6 times higher than pure TiO2.

Author Contributions

Methodology, Q.Q. and J.W.; investigation, Y.X., D.Y. and Q.Z.; supervision, X.Z.; project administration, W.F.; formal analysis, Q.Q. and X.Z.; funding acquisition, X.Z. All authors have read and agreed to the published version of the manuscript.

Funding

This study was funded by the Training Program for Innovation of Chengdu University (grant numbers: S202011079053, CDU-CX-2021527).

Data Availability Statement

Data is contained within the article.

Conflicts of Interest

The authors declare no conflict of interest.

References

  1. Cherrak, R.; Hadjel, M.; Benderdouche, N.; Adjdir, M.; Mokhtar, A.; Khaldi, K.; Sghier, A.; Weidler, P.G. Preparation of nano-TiO2/diatomite composites by non-hydrolytic sol-gel process and its application in photocatalytic degradation of crystal violet. Silicon 2020, 12, 927–935. [Google Scholar] [CrossRef]
  2. Singh, J.; Manna, A.K.; Soni, R.K. Bifunctional Au-TiO2 thin films with enhanced photocatalytic activity and SERS based multiplexed detection of organic pollutant. J. Mater. Sci. Mater. Electron. 2019, 30, 16478–16493. [Google Scholar] [CrossRef]
  3. Gerasimova, T.V.; Evdokimova, O.L.; Kraev, A.S.; Ivanov, V.K.; Agafonov, A.V. Micro–mesoporous anatase TiO2 nanorods with high specific surface area possessing enhanced adsorption ability and photocatalytic activity. Microporous Mesoporous Mater. 2016, 235, 185–194. [Google Scholar] [CrossRef]
  4. Ravishankar, T.N.; Nagaraju, G.; Dupont, J. Photocatalytic activity of Li–doped TiO2 nanoparticles: Synthesis via ionic liquid-assisted hydrothermal route. Mater. Res. Bull. 2016, 78, 103–111. [Google Scholar] [CrossRef]
  5. Zhu, X.D.; Han, S.H.; Zhu, D.Z.; Chen, S.H.; Feng, W.; Kong, Q.Q. Preparation and characterisation of Ag modified rutile titanium dioxide and its photocatalytic activity under simulated solar light. Micro Nano Lett. 2019, 14, 757–760. [Google Scholar] [CrossRef]
  6. Kundu, A.; Mondal, A. Structural, optical, physio-chemical properties and photodegradation study of methylene blue using pure and iron-doped anatase titania nanoparticles under solar-light irradiation. J. Mater. Sci. Mater. Electron. 2019, 30, 3244–3256. [Google Scholar] [CrossRef]
  7. Yang, K.; Li, X.X.; Yu, C.L.; Zeng, D.B.; Chen, F.Y.; Zhang, K.L.; Huang, W.Y.; Ji, H.B. Review on heterophase/homophase junctions for efficient photocatalysis: The case of phase transition construction. Chin. J. Catal. 2019, 40, 796–818. [Google Scholar] [CrossRef]
  8. Krishnakumar, V.; Boobas, S.; Jayaprakash, J.; Rajaboopathi, M.; Han, B.; Louhi-Kultanen, M. Effect of Cu doping on TiO2 nanoparticles and its photocatalytic activity under visible light. J. Mater. Sci. Mater. Electron. 2016, 27, 7438–7447. [Google Scholar] [CrossRef]
  9. Umar, K.; Ibrahim, M.N.M.; Ahmad, A.; Rafatullah, M. Synthesis of Mn–doped TiO2 by novel route and photocatalytic mineralization/intermediate studies of organic pollutants. Res. Chem. Intermed. 2019, 45, 2927–2945. [Google Scholar] [CrossRef]
  10. Zhu, X.D.; Song, H.J.; Feng, W.; Wen, G.L.; Li, H.Y.; Zhou, J. Photocurrent response and photocatalytic activity of Nd–doped TiO2 thin films prepared by sol-gel method. J. Adv. Oxid. Technol. 2017, 20, 20160190. [Google Scholar] [CrossRef]
  11. Ali, I.; Kim, S.R.; Kim, S.P.; Kim, J.O. Anodization of bismuth doped TiO2 nanotubes composite for photocatalytic degradation of phenol in visible light. Catal. Today 2017, 282, 31–37. [Google Scholar] [CrossRef]
  12. Crisşan, M.; Răileanu, M.; Drăgan, N.; Crişan, D.; Ianculescu, A.; Nitoi, I.; Oancea, P.; Somacescu, S.; Stănică, N.; Vasile, B.; et al. Sol–gel iron–doped TiO2 nanopowders with photocatalytic activity. Appl. Catal. A Gen. 2015, 504, 130–142. [Google Scholar] [CrossRef]
  13. Grujić-Brojčin, M.; Armaković, S.; Tomić, N.; Abramović, B.; Golubović, A.; Stojadinović, B.; Kremenović, A.; Babić, B.; Dohčević-Mitrović, Z.; Šćepanović, M. Surface modification of sol–gel synthesized TiO2 nanoparticles induced by La–doping. Mater. Charact. 2014, 88, 30–41. [Google Scholar] [CrossRef]
  14. Shaban, M.; Ahmed, A.M.; Shehata, N.; Betiha, M.A.; Rabie, A.M. Ni-doped and Ni/Cr co–doped TiO2 nanotubes for enhancement of photocatalytic degradation of methylene blue. J. Colloid Interface Sci. 2019, 555, 31–41. [Google Scholar] [CrossRef]
  15. Georgieva, J.; Valova, E.; Armyanov, S.; Tatchev, D.; Sotiropoulos, S.; Avramova, I.; Dimitrova, N.; Hubin, A.; Steenhaut, O. A simple preparation method and characterization of B and N co–doped TiO2 nanotube arrays with enhanced photoelectrochemical performance. Appl. Surf. Sci. 2017, 413, 284–291. [Google Scholar] [CrossRef]
  16. Kalantari, K.; Kalbasi, M.; Sohrabi, M.; Royaee, S.J. Enhancing the photocatalytic oxidation of dibenzothiophene using visible light responsive Fe and N co–doped TiO2 nanoparticles. Ceram. Int. 2017, 43, 973–981. [Google Scholar] [CrossRef]
  17. Zhong, J.S.; Xu, J.R.; Wang, Q.Y. Nitrogen and vanadium co-doped TiO2 mesosponge layers for enhancement in visible photocatalytic activity. Appl. Surf. Sci. 2014, 315, 131–137. [Google Scholar]
  18. Jung, H.S.; Kim, H. Origin of low photocatalytic activity of rutile TiO2. Electron. Mater. Lett. 2009, 5, 73–76. [Google Scholar] [CrossRef]
  19. Leung, D.Y.C.; Fu, X.L.; Wang, C.F.; Ni, M.; Leung, M.K.H.; Wang, X.X.; Fu, X.Z. Hydrogen production over titania–based photocatalysts. ChemSusChem 2010, 3, 681–694. [Google Scholar] [CrossRef] [PubMed]
  20. Chetia, L.; Kalita, D.; Ahmed, G.A. Enhanced photocatalytic degradation by diatom templated mixed phase titania nanostructure. J. Photochem. Photobiol. A Chemistry 2017, 338, 134–145. [Google Scholar] [CrossRef]
  21. Ibrahim, A.; Mekprasart, W.; Pecharapa, W. Aatase/rutile TiO2 composite prepared via sonochemical process and their photocatalytic activity. Mater. Today Proc. 2017, 4, 6159–6165. [Google Scholar] [CrossRef]
  22. Likodimos, V.; Chrysi, A.; Calamiotou, M.; Fernández–Rodríguez, C.; Dona-Rodríguez, J.M.; Dionysiou, D.D.; Falaras, P. Microstructure and charge trapping assessment in highly reactive mixed phase TiO2 photocatalysts. Appl. Catal. B Environ. 2016, 192, 242–252. [Google Scholar] [CrossRef]
  23. Liao, Y.L.; Que, W.X.; Tang, Z.H.; Wang, W.J.; Zhao, W.H. Effects of heat treatment scheme on the photocatalytic activity of TiO2 nanotube powders derived by a facile electrochemical process. J. Alloy. Compd. 2011, 509, 1054–1059. [Google Scholar] [CrossRef]
  24. Banerjee, D.; Gupta, S.K.; Patra, N.; Raja, S.W.; Pathak, N.; Bhattacharyya, D.; Pujari, P.K.; Thakare, S.V.; Jha, S.N. Unraveling doping induced anatase–rutile phase transition in TiO2 using electron, X–ray and gamma–ray as spectroscopic probes. Phys. Chem. Chem. Phys. 2018, 20, 28699–28711. [Google Scholar] [CrossRef]
  25. Bai, S.; Gao, C.; Low, J.X.; Xiong, Y.J. Crystal phase engineering on photocatalytic materials for energy and environmental applications. Nano Res. 2019, 12, 2031–2054. [Google Scholar] [CrossRef]
  26. Liu, R.D.; Li, H.; Duan, L.B.; Shen, H.; Zhang, Q.; Zhao, X.R. Influences of annealing atmosphere on phase transition temperature, optical properties and photocatalytic activities of TiO2 phase-junction microspheres. J. Alloy. Compd. 2019, 789, 1015–1021. [Google Scholar] [CrossRef]
  27. Elsellami, L.; Dappozze, F.; Fessi, N.; Houas, A.; Guillard, C. Highly photocatalytic activity of nanocrystalline TiO2 (anatase, rutile) powders prepared from TiCl4 by sol–gel method in aqueous solutions. Process. Saf. Environ. Prot. 2018, 113, 109–121. [Google Scholar] [CrossRef]
  28. Abdullah, A.Z.; Ling, P.Y. Heat treatment effects on the characteristics and sonocatalytic performance of TiO2 in the degradation of organic dyes in aqueous solution. J. Hardous Mater. 2010, 173, 159–167. [Google Scholar] [CrossRef] [PubMed]
  29. Li, H.; Shen, X.J.; Liu, Y.D.; Wang, L.Z.; Lei, J.Y.; Zhang, J.L. Facile phase control for hydrothermal synthesis of anatase–rutile TiO2 with enhanced photocatalytic activity. J. Alloy. Compd. 2015, 646, 380–386. [Google Scholar] [CrossRef]
  30. Wang, Q.; Qiao, Z.; Jiang, P.; Kuang, J.L.; Liu, W.X.; Cao, W.B. Hydrothermal synthesis and enhanced photocatalytic activity of mixed-phase TiO2 powders with controllable anatase/rutile ratio. Solid State Sci. 2018, 77, 14–19. [Google Scholar] [CrossRef]
  31. Alves, A.K.; Berutti, F.A.; Bergmann, C.P. Visible and UV photocatalytic characterization of Sn–TiO2 electrospun fibers. Catal. Today 2013, 208, 7–10. [Google Scholar] [CrossRef]
  32. Turkten, N.; Cinar, Z.; Tomruk, A.; Bekbolet, M. Copper-doped TiO2 photocatalysts: Application to drinking water by humic matter degradation. Environ. Sci. Pollut. Res. 2019, 26, 36096–36106. [Google Scholar] [CrossRef] [PubMed]
  33. Ding, X.Z.; Liu, L.; Ma, X.M.; Qi, Z.Z.; He, Y.Z. The influence of alumina dopant on the structural transformation of gel–derived nanometre titania powders. J. Mater. Sci. Lett. 1994, 13, 462–464. [Google Scholar] [CrossRef]
  34. Song, G.B.; Liang, J.K.; Liu, F.S.; Peng, T.J.; Rao, G.H. Preparation and phase transformation of anatase–rutile crystals in metal doped TiO2/muscovite nanocomposites. Thin Solid Film. 2005, 491, 110–116. [Google Scholar] [CrossRef]
  35. Li, J.L.; Xu, X.T.; Liu, X.J.; Yu, C.Y.; Yan, D.; Shou, Z.; Pan, L.K. Sn doped TiO2 nanotube with oxygen vacancy for highly efficient visible light photocatalysis. J. Alloy. Compd. 2016, 679, 454–462. [Google Scholar] [CrossRef]
  36. Wu, M.C.; Wu, P.Y.; Lin, T.H.; Lin, T.F. Photocatalytic performance of Cu–doped TiO2 nanofibers treated by the hydrothermal synthesis and air-thermal treatment. Appl. Surf. Sci. 2018, 430, 390–398. [Google Scholar] [CrossRef]
  37. Duan, Y.D.; Fu, N.Q.; Zhang, Q.; Fang, Y.Y.; Zhou, X.W.; Lin, Y. Influence of Sn source on the performance of dye-sensitized solar cells based on Sn–doped TiO2 photoanodes: A strategy for choosing an appropriate doping source. Electrochim. Acta 2013, 107, 473–480. [Google Scholar] [CrossRef]
  38. Wang, T.; Wei, J.X.; Shi, H.M.; Zhou, M.; Zhang, Y.; Chen, Q.; Zhang, Z.M. Preparation of electrospun Ag/TiO2 nanotubes with enhanced photocatalytic activity based on water/oil phase separation. Physica E 2017, 86, 103–110. [Google Scholar] [CrossRef]
  39. Liu, X.Z.; Wen, K.; Long, H.Y. Surface doping of TiO2 powders via a gas–melt reaction using thermal plasma as an excitation source. Ceram. Int. 2020, 46, 1577–1585. [Google Scholar] [CrossRef]
  40. Mech, K. A novel magnetoelectrochemical method of synthesis of photoactive Ni–TiO2 coatings from glycinate electrolytes. Mater. Des. 2019, 182, 108055. [Google Scholar] [CrossRef]
  41. Zeng, P.; Liu, J.Y.; Wang, J.M.; Peng, T.Y. Fabrication of Ni nanoclusters–modified brookite TiO2 quasi nanocubes and its photocatalytic hydrogen evolution performance. Chin. J. Chem. Phys. 2019, 32, 625–634. [Google Scholar] [CrossRef] [Green Version]
  42. Lei, X.F.; Xue, X.X.; Yang, H. Preparation and characterization of Ag-doped TiO2 nanomaterials and their photocatalytic reduction of Cr(VI) under visible light. Appl. Surf. Sci. 2014, 321, 396–403. [Google Scholar] [CrossRef]
  43. Fan, X.; Wan, J.; Liu, E.Z.; Sun, L.; Hu, Y.; Li, H.; Hu, X.Y.; Fan, J. High-efficiency photoelectrocatalytic hydrogen generation enabled by Ag deposited and Ce doped TiO2 nanotube arrays. Ceram. Int. 2015, 41, 5107–5116. [Google Scholar] [CrossRef]
  44. Ke, S.J.; Cheng, X.S.; Wang, Q.H.; Wang, Y.M.; Pan, Z.D. Preparation of a photocatalytic TiO2/ZnTiO3 coating on glazed ceramic tiles. Ceram. Int. 2014, 40, 8891–8895. [Google Scholar] [CrossRef]
  45. Chen, Y.; Liu, K. Fabrication of Ce/N co–doped TiO2/diatomite granule catalyst and its improved visible-light-driven photoactivity. J. Hazard. Mater. 2017, 324, 139–150. [Google Scholar] [CrossRef]
Figure 1. XRD patterns of samples.
Catalysts 11 01341 g001
Figure 2. SEM images of samples: (a) pure TiO2, (b) Sn–TiO2, (c) Ni–TiO2, (d) Sn/Ni–TiO2.
Catalysts 11 01341 g002aCatalysts 11 01341 g002b
Figure 3. TEM and HRTEM images of pure TiO2 (a,c) and Sn–TiO2 (b,d).
Catalysts 11 01341 g003aCatalysts 11 01341 g003b
Figure 4. XPS spectra of Sn/Ni–TiO2: (a) full spectrum, (b) Ti 2p, (c) O 1s, (d) Sn 3d, and (e) Ni 2p.
Catalysts 11 01341 g004aCatalysts 11 01341 g004b
Figure 5. Photoluminescence (PL) spectra of pure TiO2, Ni–TiO2, Sn–TiO2, and Sn/Ni–TiO2.
Catalysts 11 01341 g005
Figure 6. Ultraviolet–visible absorption spectra of pure TiO2, Ni–TiO2, Sn–TiO2, and Sn/Ni–TiO2.
Catalysts 11 01341 g006
Figure 7. Decolorization degree curves (a) and kinetics curves (b) of samples.
Catalysts 11 01341 g007
Figure 8. Schematic diagram of transfer path of the photogenerated charges in Sn–TiO2.
Catalysts 11 01341 g008
Table 1. Phase composition and Crystallite size (D) of samples.
SamplesPhase Composition (Anatase/Rutile)D (nm)
pure TiO297.9/2.121.5/26.9
Sn–TiO258.9/41.116.9/25.8
Ni–TiO2100.0/021.7
Sn/Ni–TiO294.7/5.314.3/19.9
Publisher’s Note: MDPI stays neutral with regard to jurisdictional claims in published maps and institutional affiliations.

