Abstract
Molecular hydrogen (H2), as the green energy carrier from water electrolysis, can be utilized for separation of suspended micro-particles as electroflotation (EF). This study provides practical guidelines for the gas to solids (G/S) ratio as the governing parameter in EF, based on theoretical estimations and experiments for clarification of activated sludge. The G/S ratio in EF was controlled linearly by current density (j), under quasi-consistent current efficiency (at j > 8 mA/cm2) for H2 (~1) and O2 (~0.4) bubble generations on Ti cathode and IrTaOx anode, respectively. Based on the measured sizes of bubbles (approximated to 35 µm) and biological flocs (discretized to mean sizes of 22.5, 40, 60, 135, and 150 µm), batch flotation experiments estimated the maximum collision-attachment efficiency of 0.057. The rise velocities of floc-bubble aggregate were computed to derive the limiting G/S ratio to overcome the given influent hydraulic loading. Consequently, the estimates (5.23 × 10⁻⁴ and 5.92 × 10⁻⁴ at hydraulic loading of 0.87 and 1.73 cm/min, respectively) were compatible with the continuous EF experiments.
1. Introduction
Growing concerns on hitherto-unforeseen aqueous pollutants along with more stringent requirements for water treatment have led to variable processes based on advanced environmental catalysts. Electrochemical processes with electrocatalysts as core components could directly control redox transformation and separation of aqueous pollutants [1]. In particular, electrochemical water splitting can generate H2 and O2 bubbles [1] to separate micro-particulate pollutants in terms of electroflotation (EF) [2]. Flotation has been an efficient solid/liquid separation practice, especially for polishing colloidal particles with relatively low density [3] in drinking water and wastewater effluent [4]. Representative cases include clarification of oil–water emulsions [3,5,6], algal-laden surface water [7], tertiary wastewater treatment with phosphorus coagulation [4,8], and thickening of waste-activated sludge [9,10,11,12]. With respect to activated sludge clarification [2,13,14], the required detention time was far shorter than in sedimentation. Excellent thickening for the upper sludge blanket was also adventitious, reducing costs for subsequent sludge dewatering. Relative independence on the physico-chemical properties of the (biological) particles was another advantage of flotation [11,15].
In EF to clarify mixed liquor with biological solids (algae, bacteria) aggregates, moreover, the bubble generation rate can be controlled by current density (j) in a simple manner [2] to cope with influent loading fluctuations and variations in physico-chemical characteristics of biological flocs [14]. Our previous reports [2,13,14] corroborated excellent clarification and thickening of activated sludge by EF that eventually benefited the water treatment efficacy of biological nutrient removal processes. Along with the clarification/thickening driven by buoyancy of the electrolytic bubbles, the chemical energy of H2 can be recovered for conversion and storage of renewable energy sources in selected cases [16]. Even without a separator (in single compartment), the gaseous mixture is presumed to carry primarily H2 with minuscule amounts of O2 by aerobic metabolism of the biological solids.
The design and operation guidelines were established for dissolved air flotation (DAF) as the representative flotation technique, particularly for air to solids (A/S) ratio, solids loading rates, and downflow rate [10,12], among others. The A/S ratio primarily governs the number of attached bubbles per target particle and the rise velocity of bubble-particle aggregates [11,12]. The guidelines in DAF with respect to the A/S ratio (based on mass of bubbles and solids) were inapplicable to EF, because the electrolytic bubbles (H2 and O2) have significantly different density from the air bubbles. We previously proposed the gas to solids (G/S) ratio to extend the definition of A/S ratio for batch and continuous clarification of activated sludge clarification [2]. Nevertheless, the operational range of G/S ratio is highly dependent on the properties of electrocatalysts and target particles to necessitate a modeling approach. The type of electrode materials could affect the current efficiency (CE) and size distributions for the electrolytic bubbles [1]. These parameters would in turn influence the relationship of the G/S ratio with the operational j and collision-attachment efficiency of bubbles towards the target particles, respectively [2,13,14].
This study employed a straightforward theoretical model to estimate the limiting G/S ratio under variable hydraulic loadings in continuous EF with IrTaOx anode and Ti cathode. The size distributions of bubbles/flocs, CE of bubble generation, and collision/attachment efficiency were estimated by practical and reliable methods. The robustness of numerical calculations was confirmed by experimental observations. The results of this study would provide guidelines for engineering of EF processes and electrode materials for broad applications to cope with the wide variabilities in wastewater.
2. Results and Discussion
2.1. Electrolytic Bubble Generation on IrTaOx Anode and Ti Cathode
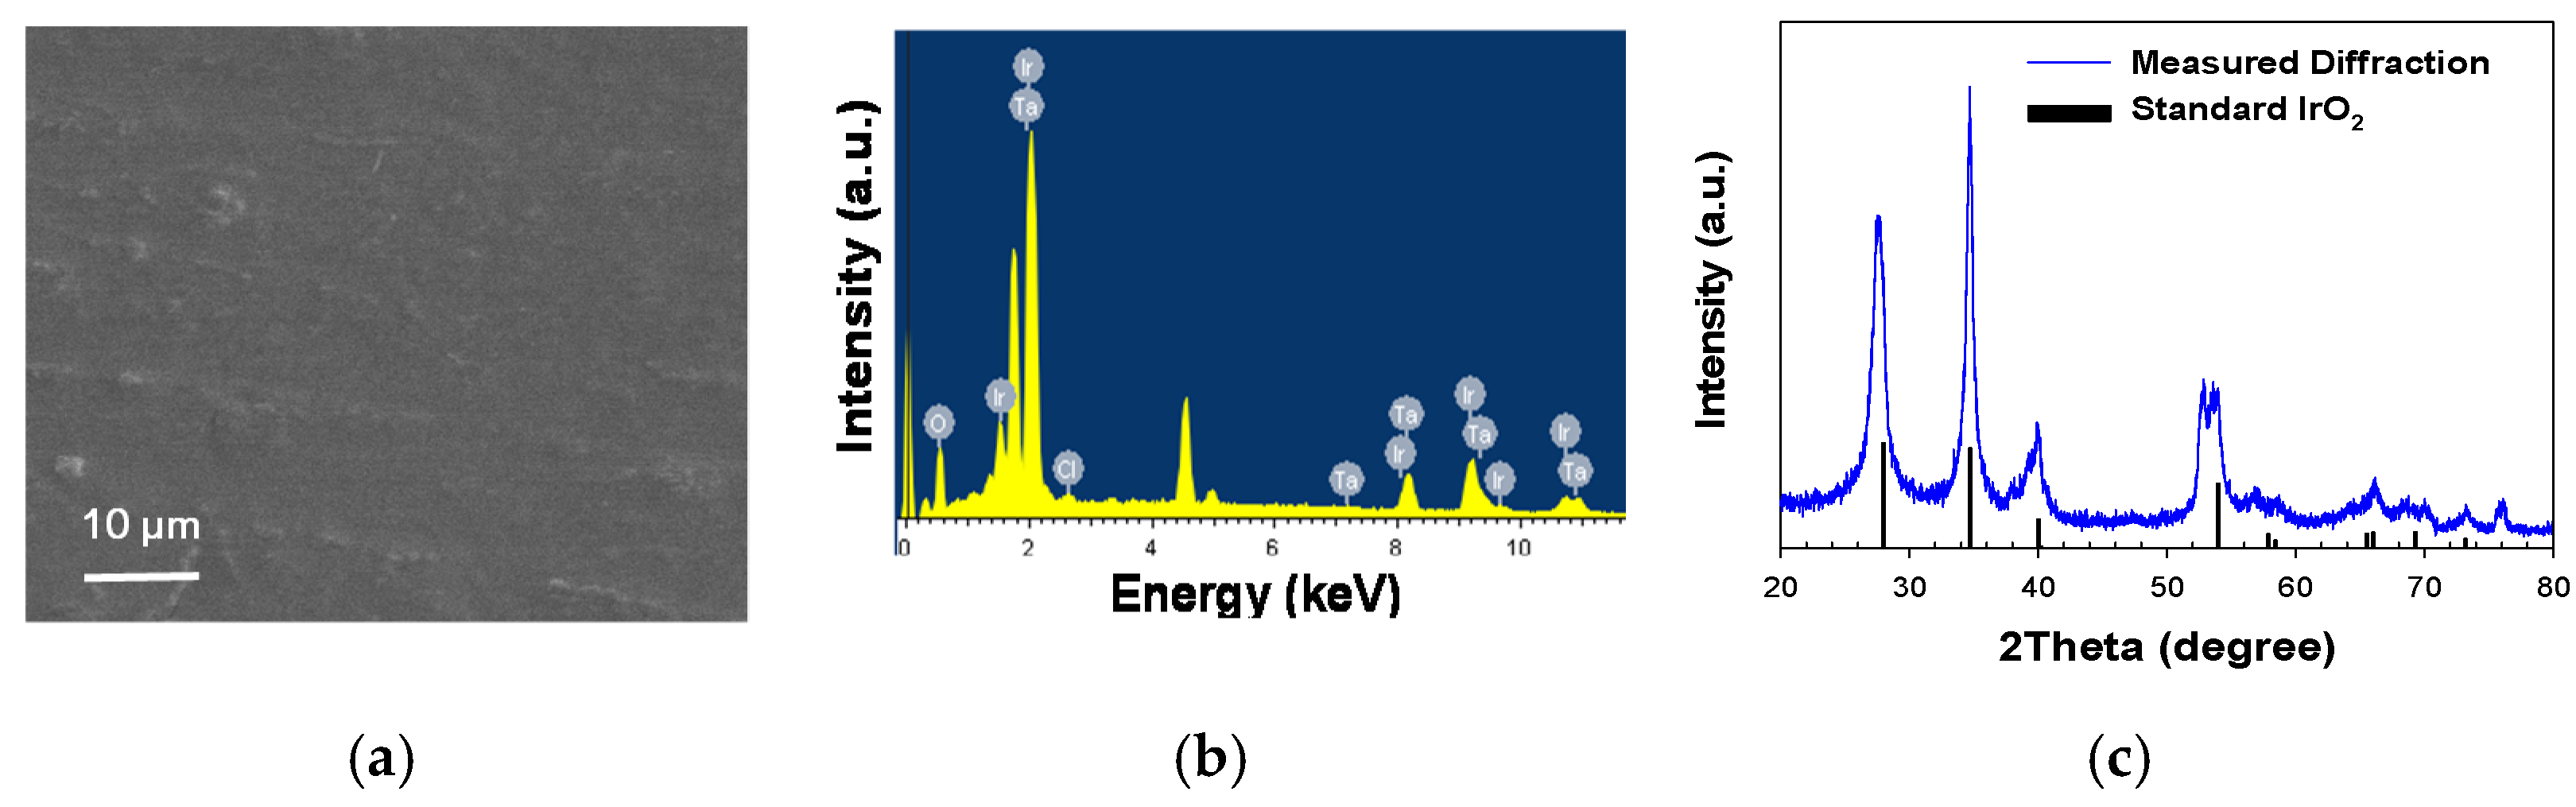
Figure 1 shows the morphology and composition of the IrTaOx (Ir:Ta = 7:3) mixed metal oxide anode employed in this study. The dimensionally stable anodes based on IrO2 have widely been deployed in EF, due to the supreme electrocatalytic activity for oxygen evolution reaction (OER) as well as corrosion-resistant properties in acidic (anodic) environments [16,17]. The catalytic activity for OER has been known to be in a volcano-type relation with the metal-oxygen bond strength, in which IrO2 and RuO2 occupied the apex with the minimal kinetic barrier (overpotential) for OER [16,17]. The Ta as the secondary component of IrTaOx could enhance the anodic stability [17]. IrO2 is known to carry out the OER by a deprotonation mechanism in near-neutral to acidic pH, exemplified by the following equation:
where –OH and –O are surface-bound reactive oxygen species as intermediates of OER. Scanning electron microscopy (SEM) noted a smooth horizontal surface without a prevailed crack, which would be beneficial for a long-term stability. A penetration of electrolytes through a crack on the surface could induce oxidation of the Ti substrate and passivation by TiO2. Energy dispersive X-ray spectroscopy (EDX) noted prevailing signals of Ir and Ta with minor contributions of Cl from the residual precursor salts. The X-ray diffraction (XRD) pattern unambiguously indicated a rutile IrO2 crystalline structure (JCPDS #15870) that was insignificantly altered by the mixed Ta components.
IrOx + H2O → IrOx–OH + H+ + e− → IrOx–O + 2H+ + 2e− → IrOx + 1/2O2 + 2H+ + 2e−
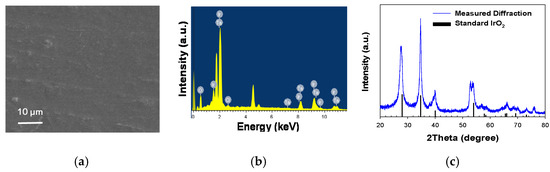
Figure 1.
Morphology and composition of IrTaOx mixed metal oxide anode based on representative (a) horizontal SEM image, (b) elemental composition measured by EDX, and (c) crystalline structure measured by XRD referenced to a standard pattern of IrO2.
The CE values for bubble generation, prerequisite for G/S ratio calculation in EF, were estimated in 5 mM NaCl solutions whose electrical conductivity (0.61 mS/cm) was comparable with activated sludge mixed liquor (0.60 mS/cm) in this study. To simulate a continuous EF operation, the electrolytes were initially saturated with O2 and H2, and mass transfer between rising bubbles and bulk electrolytes could be ruled out [2]. At j > 8 mA/cm2, the CE was consistently near 1 for H2 bubble generation (measurements with an O2 absorbent), as shown in Figure 2. Parallel determination on flow rates of gas mixture (without the O2 absorbent) estimated the CE of OER near 0.4. These observations were compatible with our previous estimation [2,13] on overall gas production efficiency of 0.7 (with assumed H2:O2 = 2:1). In comparison, the CE was much lower at j lower than 8 mA/cm2. Vogt [18] suggested that the bubble generation efficiency roughly coincided with the proportion of electrochemical products that were mass transferred into the gaseous phase (bubbles). The increase of j enlarged the fractional coverage of the adhering bubbles, which would invigorate the transport of dissolved species to the bubbles to a certain extent [2]. Likewise, the lower surface coverage by bubbles could favor local supersaturation of dissolved gases [19]. Analogous nonlinear increases of CE in response to j were reported previously by theoretical and experimental assessments [18,19].

Figure 2.
Measured gas flow rate of H2 and O2 mixture in reference with the theoretical rate. The corresponding CE values for H2 and O2 bubbles are shown as functions of applied j.
Ti has typically been employed as cathode material mainly for cost-effectiveness [17]. In this study, the Ti cathode further showed an excellent selectivity towards hydrogen evolution reaction (HER), due to poor electrocatalytic activities for the side reactions represented by oxygen reduction reaction (ORR). The type (2 versus 4 electrons transfer) and kinetics of ORR, which determine the consumed charge by ORR, would depend on the dissolved oxygen concentration and the cathode materials. For example, the CE of H2 bubble generation Pt [18,20] was less than 50% due to the active ORR. Additionally, depending on wastewater composition, reduction of nitrate or chlorate could be expected as well, particularly on Sn and Cu cathodes [21]. The lack of electrocatalytic activity of Ti, however, would elevate the cell voltage more severely as j increases due to the greater ohmic drop and charge transfer resistance.
The CE for O2 bubble generation was observed to be much lower (~0.4) than H2, resulting in nonstoichiometric water splitting (H2/O2 > 2). The surface coverage of O2 on IrTaOx anode would be by far lower than that of H2 on Ti cathode as expected by the intrinsic stoichiometry of water splitting (H2:O2 = 2:1) and aqueous solubility (1.39 mmol O2 and 0.81 mmol H2 per kg of water at 20 °C). Therefore, a supersaturation of O2 could be preferred over the growth of O2 bubble nuclei. The observed inferior CE for O2 bubbles could be further rationalized by the competing chlorine evolution reaction (ClER). The CE for OER and ClER would depend on Cl− concentration, overpotentials of the electrode materials [4]. Because the surface-bound reactive oxygen species are known to be the common intermediates both for OER and ClER in circum-neutral pH, the bond strength of O atoms to metal cations could shift the CE of ClER in volcano-type relations [16]. The rate of OER (charge transfer limited) would be proportional to j, whereas the diffusion of Cl− could rate-determine the ClER at relatively low chloride concentrations as in this study. Therefore, the interferences of ClER on anode and potentially chlorine reduction reaction on cathode could be invigorated as the chloride concentration increases and/or j decreases since the lowered surface coverage by bubbles could enhance the diffusion of dissolved species.
The contributions of O2 bubbles were neglected in this study, primarily because the measured volume of O2 bubbles counts for only 20% of the H2 bubbles. The fraction of O2 bubbles could be even lower during the separation of bio-solids due to the uptake of O2 by aerobic microorganisms [14]. In addition, the O2 bubbles could be larger than H2 bubbles [22] due to the lower generation rate (vide infra), resulting in inferior collection efficiency. From an engineering point of view, since the density of H2 (0.09 g/L at 25 °C) is far smaller than O2 (1.43 g/L), the G/S ratio on a mass basis would be biased significantly by a minor fraction of O2 in the bubble mixture. As long as the CE of bubble generation remains virtually constant (at j exceeding 8 mA cm−2 in this study), the G/S ratio could be controlled linearly by j, to be an important advantage of EF in practice [11,12]. In DAF, the major control factor of the A/S ratio is the pressure of the saturated water [11,12]. However, the pressure also affects the air solubility, which makes the control of the air generation rate rather complicated [11].
2.2. Size Distributions for Electrolytic Bubbles and Activated Sludge Flocs
The operational j and type of electrolyte marginally affected the number distributions of electrolytic bubbles, with superimposable mean diameters in the range of 34–35 μm (Figure 3a). The highest fraction (30–35%) was marked by 40 μm diameter, and the bubbles sized from 15 μm to 40 μm occupied the dominant fraction (>75%). In contrast, bubbles smaller than 10 μm were observed with a minor fraction (<4%). The variable bubble sizes in EF could be understood in terms of competing growth (via mass transfer of dissolved products to the dangling bubbles) and detachment from electrode surface [22]. The electrostatic interaction between bubbles and electrode surface could be in-turn influenced by j and ionic strength of electrolytes [1,22]. For instance, an augmented j tends to minify the bubbles by invigorated repulsion of negatively charged bubbles from cathode and sweeping by rising bubbles. Likewise, an elevated electrolyte concentration could decrease the bubble size by reduction in electrical double layer thickness [22]. Nevertheless, the effects of electrolyte conductivity and j were marginal in the operational range of this study, as shown in Figure 3a. Accordingly, a uniform bubble diameter (db) of 35 μm was assumed in this study for the following theoretical calculations.
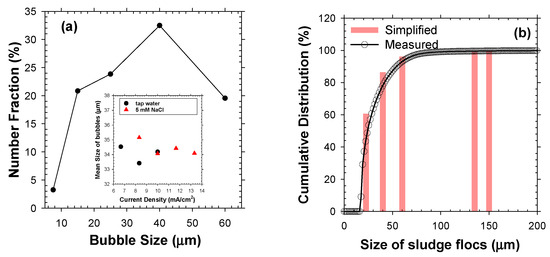
Figure 3.
The size distributions of (a) electrolytic bubbles in 5 mM of NaCl at j of 10 mA/cm2 and (b) activated sludge flocs in number bases. The inset in (a) shows the mean bubble size measured either in tap water or 5 mM of NaCl under j of 6.5–13.5 mA/cm2, and the bars in (b) depict the simplified particle size distribution.
The mixed liquor samples showed number distributions of flocs characterized by a distinct peak at ~19 μm with a broad tail up to <200 μm. Primary/colloidal particles sized less than 10 μm and macro-particles bigger than 200 μm occupied tiny fractions. The well-established structure of activated sludge flocs indicated that an excessive growth of filamentous bacteria could enlarge the floc size [2]. In order to simplify the calculations, the observed size distribution of bio-particles was discretized into five groups with mean floc diameter (df) of 22.5, 40, 60, 135, and 150 µm, respectively, that fell within the range reported in the literature [23]. Each group accounted for about 5, 12, 15, 50, and 18% of the total mass of mixed liquor suspended solids (MLSS), respectively.
2.3. Collision-Attachment Efficiency Estimated by Batch Flotation Experiments
The DAF with the injection of pressurized water intrinsically required divided contact and separation zones. In contrast, a continuous bubble generation in EF could allow collision/attachment and separation in single compartment under quiescent conditions. Therefore, the separation zone model widely accepted in DAF [24], based on the rise velocity of bubble-floc agglomerates (Vbf), could be employed to predict the overall separation efficiency in EF. The white water bubble blanket model [24] confirmed that the retention time in EF (23–46 min) could be sufficient for collision/attachment of bubble as a single collector for the bio-floc.
To this end, the efficiency of collision-attachment between flocs and bubbles (α) should be one of the most important parameters in EF. The α is known to be affected by surface properties, such as hydrophobicity and charge density, both for bubbles and particles. Therefore, the range of α for biosolids in EF should be differentiated from more widely known values in DAF [24,25,26]. Accordingly, in this study, the α0 (α for intact floc without an attached bubble) was estimated from a series of batch flotation experiments. In the absence of downward flow, attachment of a singular bubble was assumed to allow the floating and separation of a floc; i.e., Vbf > 0 in Equation (5). We further assumed identical α0 irrespective of df, while attachment of multiple bubbles to -single floc was ruled out. The α value also decreases sharply as the number of attached bubbles (Bn) increases (Equation (3)), since the adhered bubbles hinder the subsequent attachments [26]. Although the flocs with df of 135 and 150 µm required multiple bubble attachments (Bn of 3 and 4, respectively) to float, they accounted for only <4% of the total number of bio-solids. Consequently, the α0 value could be estimated from the number ratio of bio-particles to the total generated bubbles during the separation time, defined as the electrolysis duration to reach a clear solid/liquid interface [2].
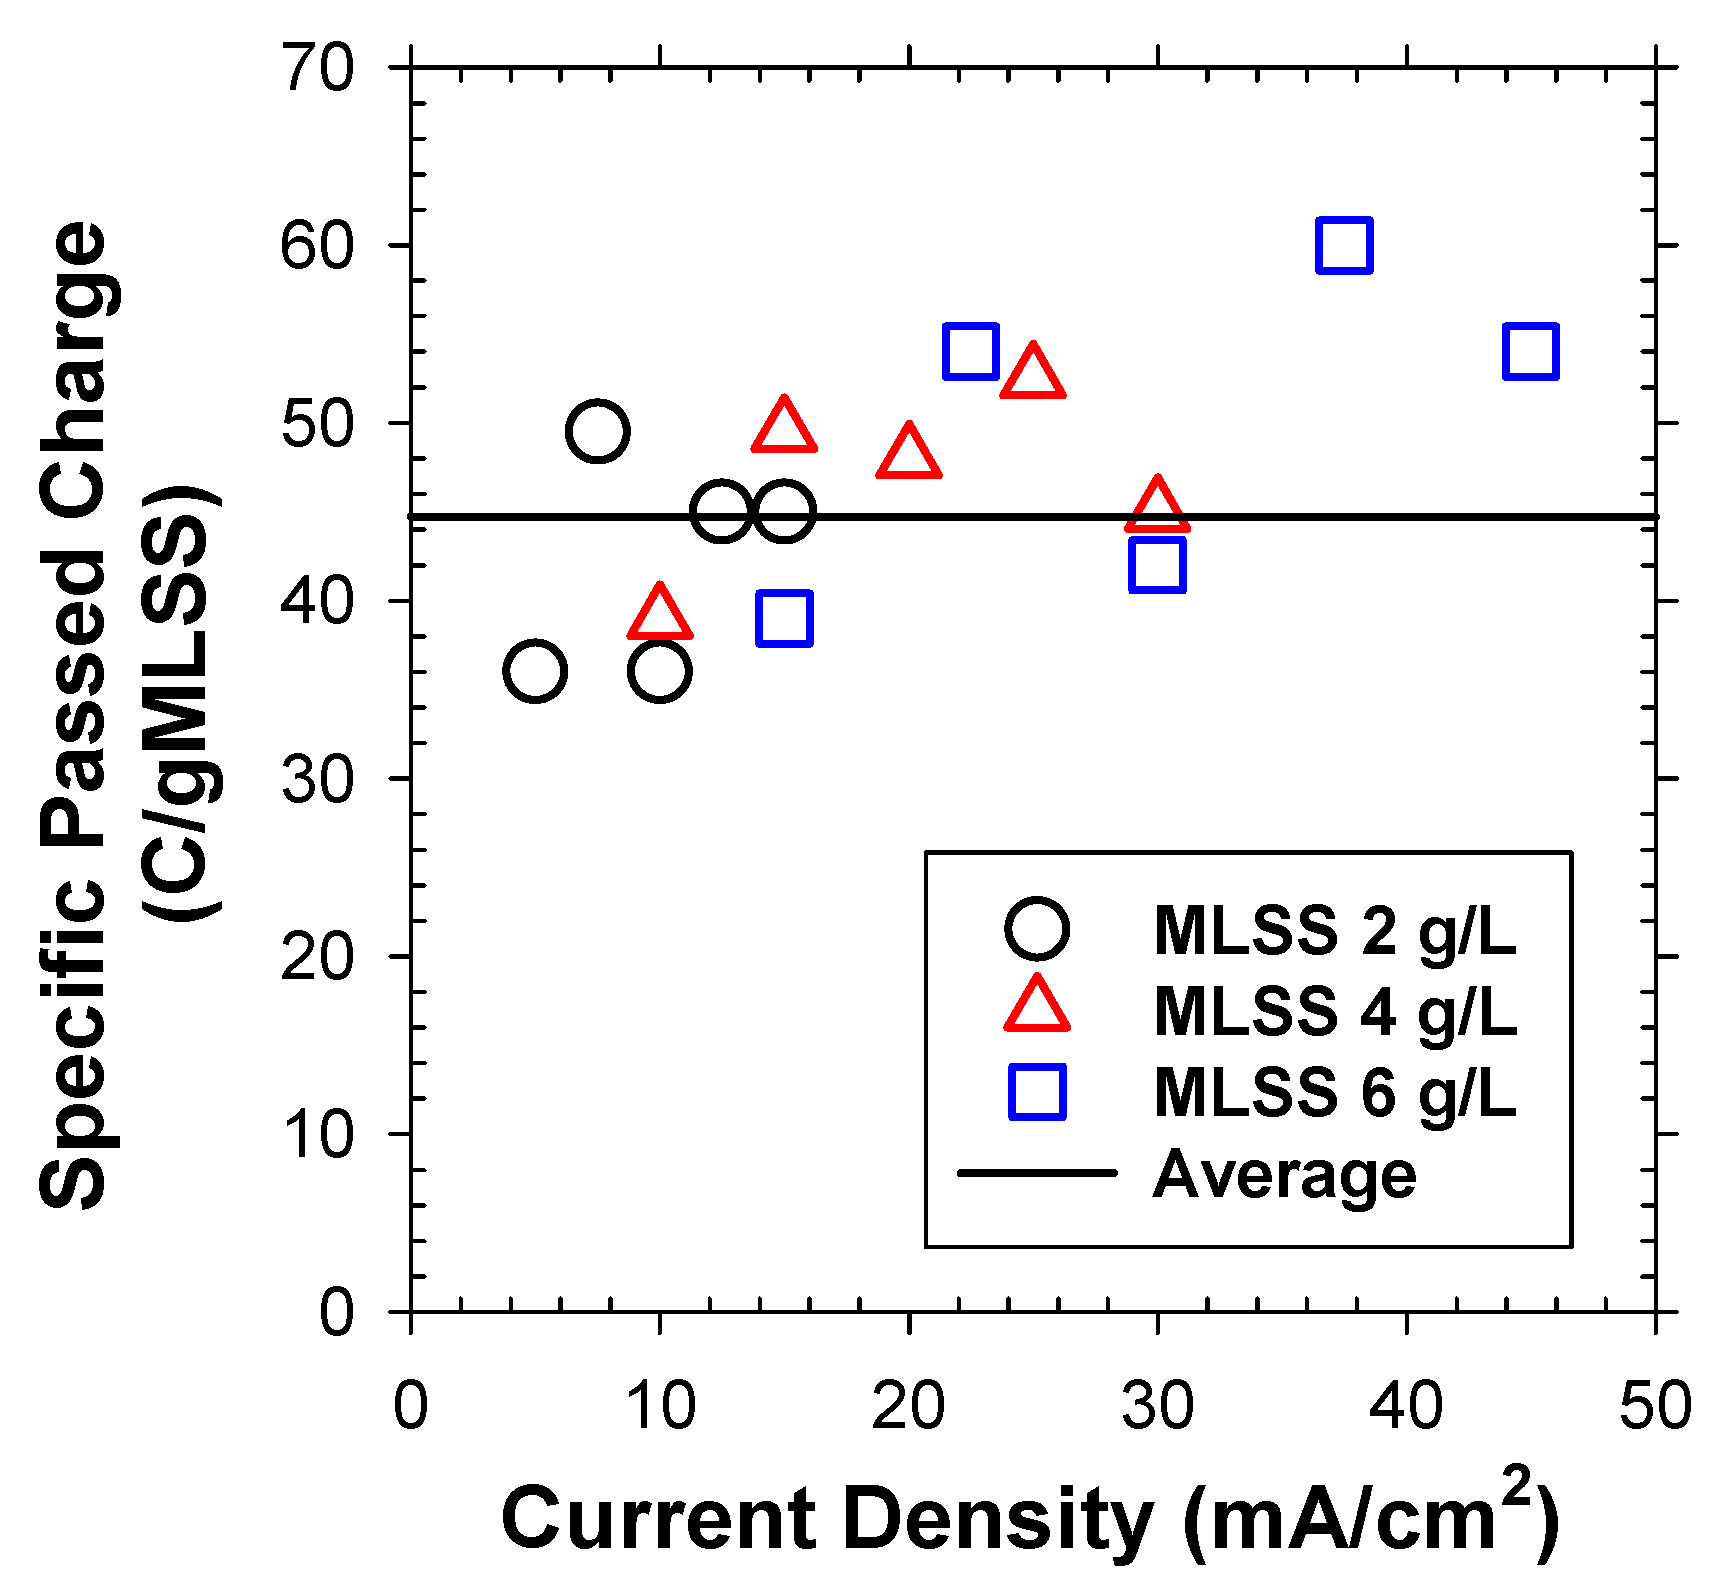
Under variable j and initial MLSS concentrations, the total passed charge for separation of unit mass of bio-solids was indeed superimposable (Figure 4), averaged to 44.7 C/gMLSS. As shown in Table 1, the total number of flocs per unit mass was computed based on the measured number fraction for each discretized particle group (Figure 3b) with assumptions of spherical particles with identical ρf (1.04 g/cm3) [23]. The passed charge estimated the total number of generated H2 bubbles, utilizing measured efficiency (Figure 2) and mean bubble size (db = 35 μm, Figure 3a). Accordingly, the α0 value was computed to be 0.057 (Table 1). This estimate was much smaller than the reported values in DAF (up to 0.4) [24,25,26]. The activated sludge flocs are known to have negatively charged surface due to extracellular polymeric substances with developed hydroxyl- and carboxyl-functional groups. To this end, the α value could be significantly changed by the surface charge (represented by zeta-potential) of bubbles [25]. The surface of H2 bubbles, generated from electrostatic repulsion from the cathode in EF are expected to be more negatively charged to give lower attachment efficiency with the bio-particles compared to the air bubbles in DAF.
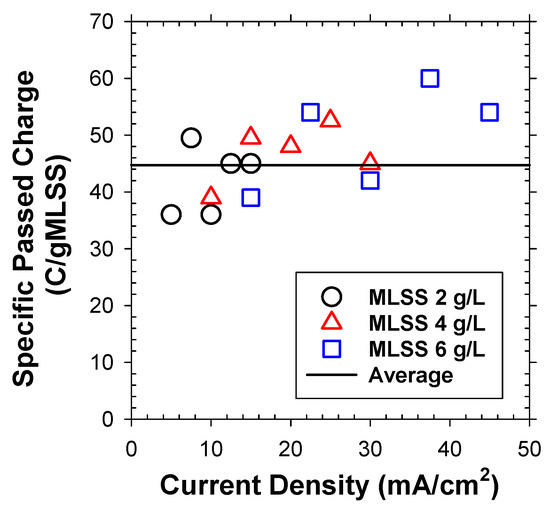
Figure 4.
The passed charge for separation of unit mass of activated sludge flocs under variable j and initial MLSS concentration in batch flotation experiments.

Table 1.
Estimation of the collision-attachment efficiency (α0) from batch flotation experiments.
2.4. Limiting G/S Ratio under Variable Floc Sizes and Hydraulic Loadings
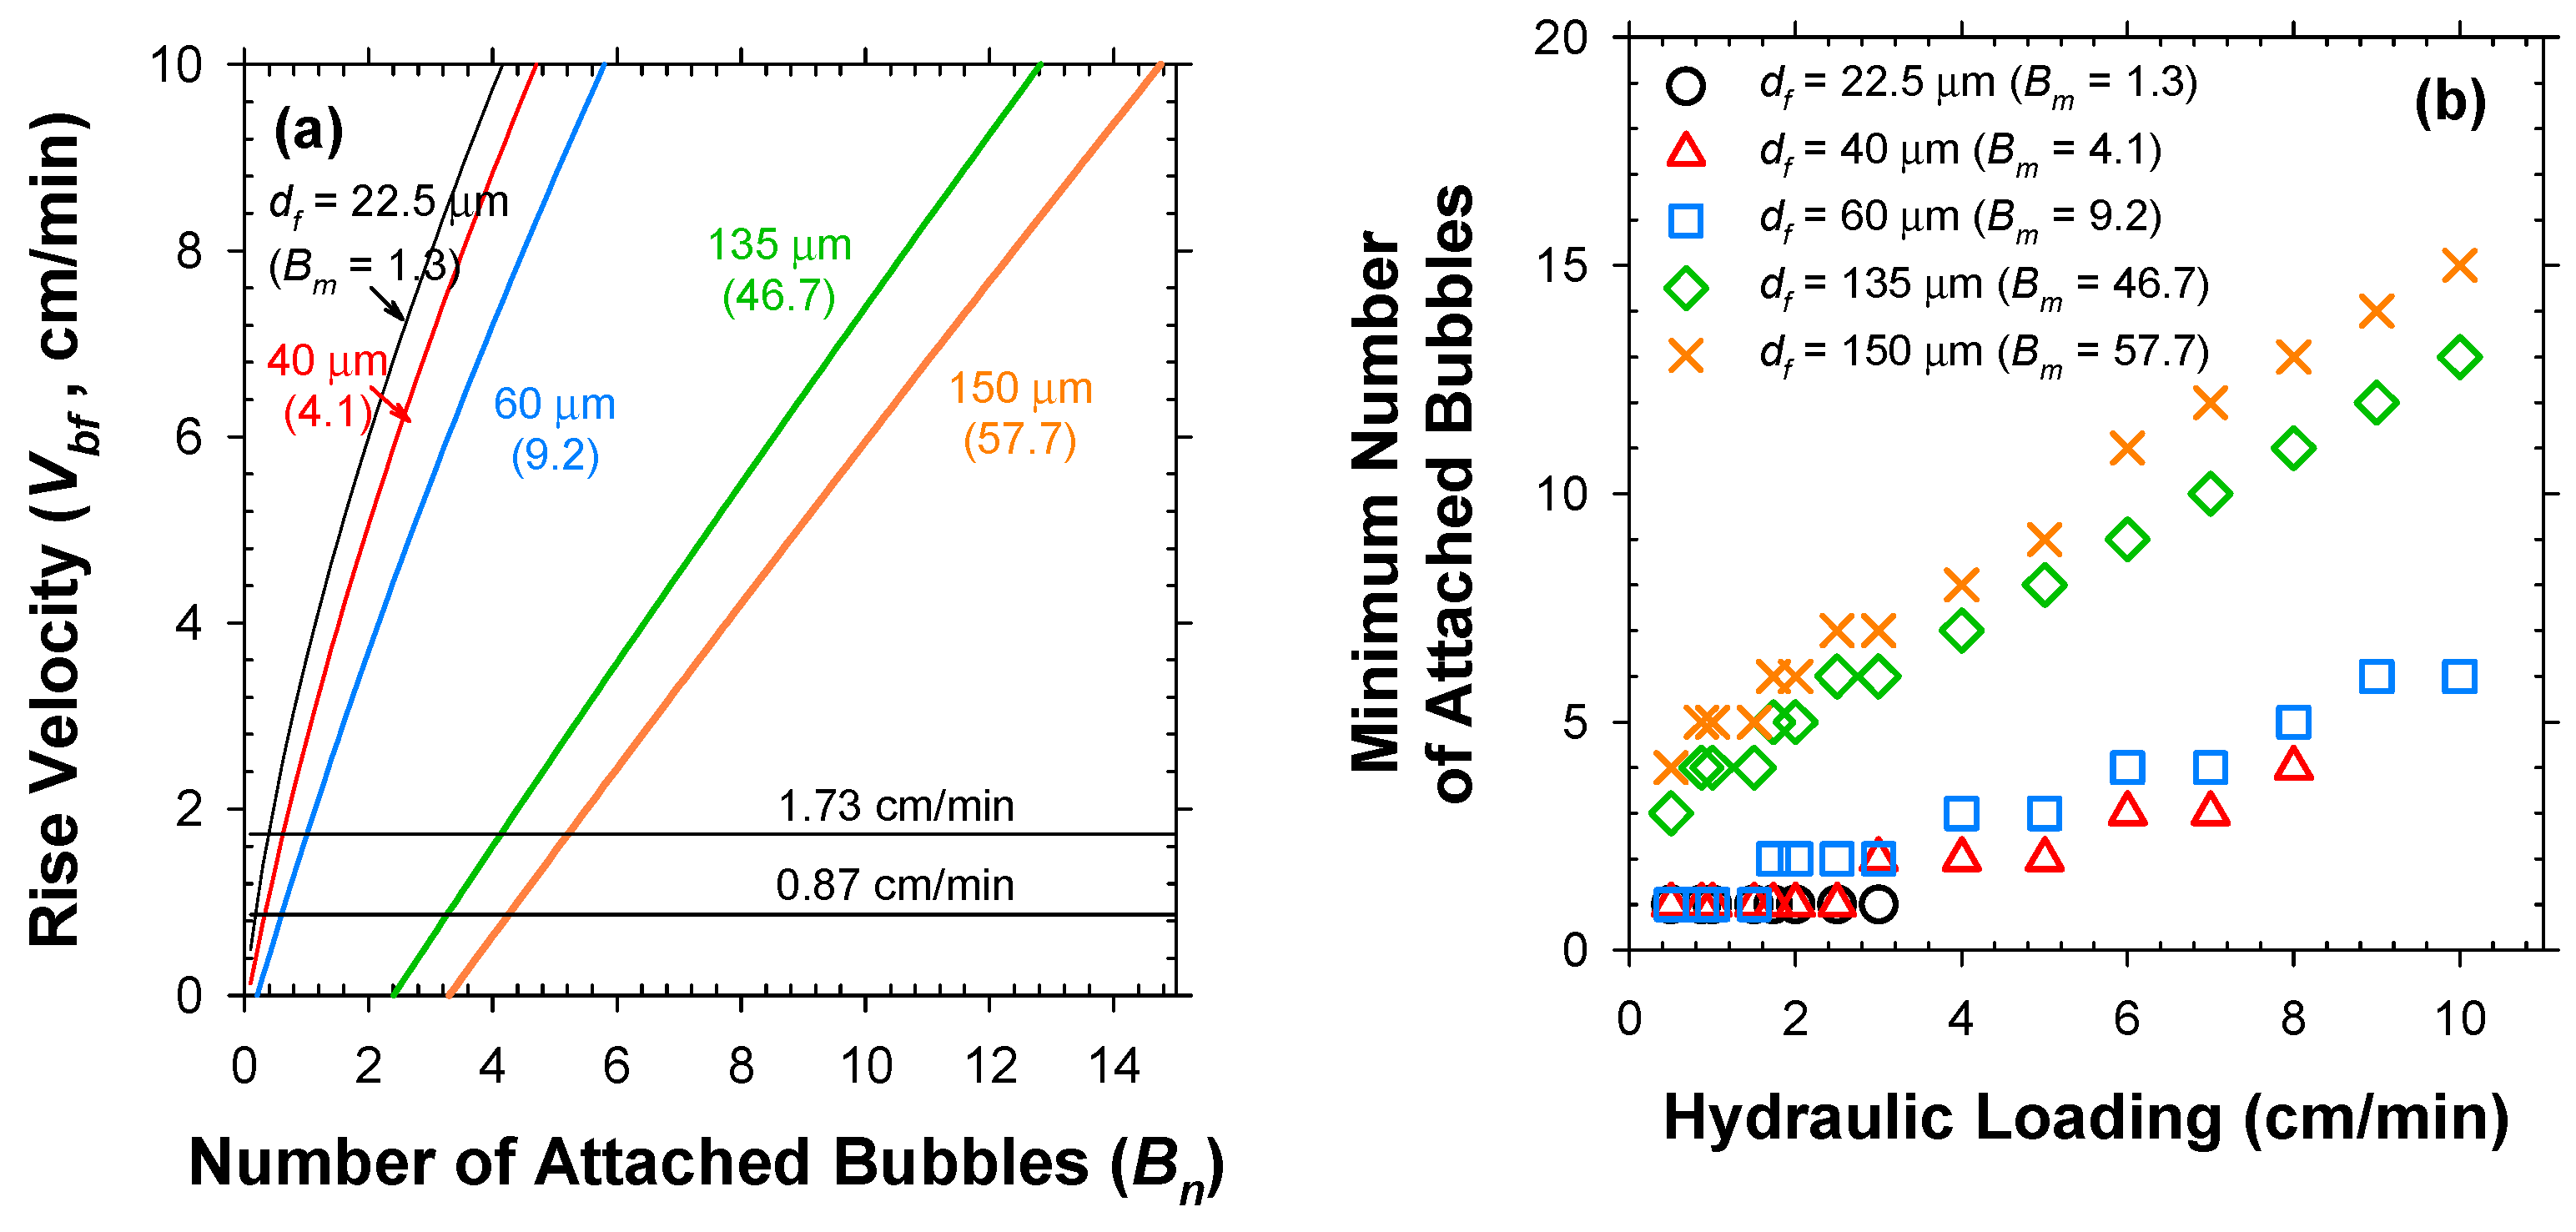
The Vbf should primarily determine the clarification efficiency for continuous flotation in flow reactors; i.e., Vbf should exceed the hydraulic loading (v) or downflow rate for an effective separation. The size of bubbles represented by db significantly influences the flotation efficiency [8]. On one hand, the larger bubbles are the more advantageous with respect to Vbf at a given Bn [25,26,27,28,29,30]. A body of literature reported that EF could generate finer bubbles than DAF that produces bubbles with a wider distribution of size even exceeding 200 μm [1,30,31,32]. Thus, there have been claims that the EF should be limitedly deployed under relatively low v [26,30]. On the other hand, a decrease in db could substantially elevate the Bm (the maximum Bn on a floc with size df), leading to a net increase in Vbf under a sufficiently large G/S ratio [25,27]. Therefore, the linear control of G/S ratio by j should be underscored as an important strength of EF, whereas an adjustment of db is practically infeasible.
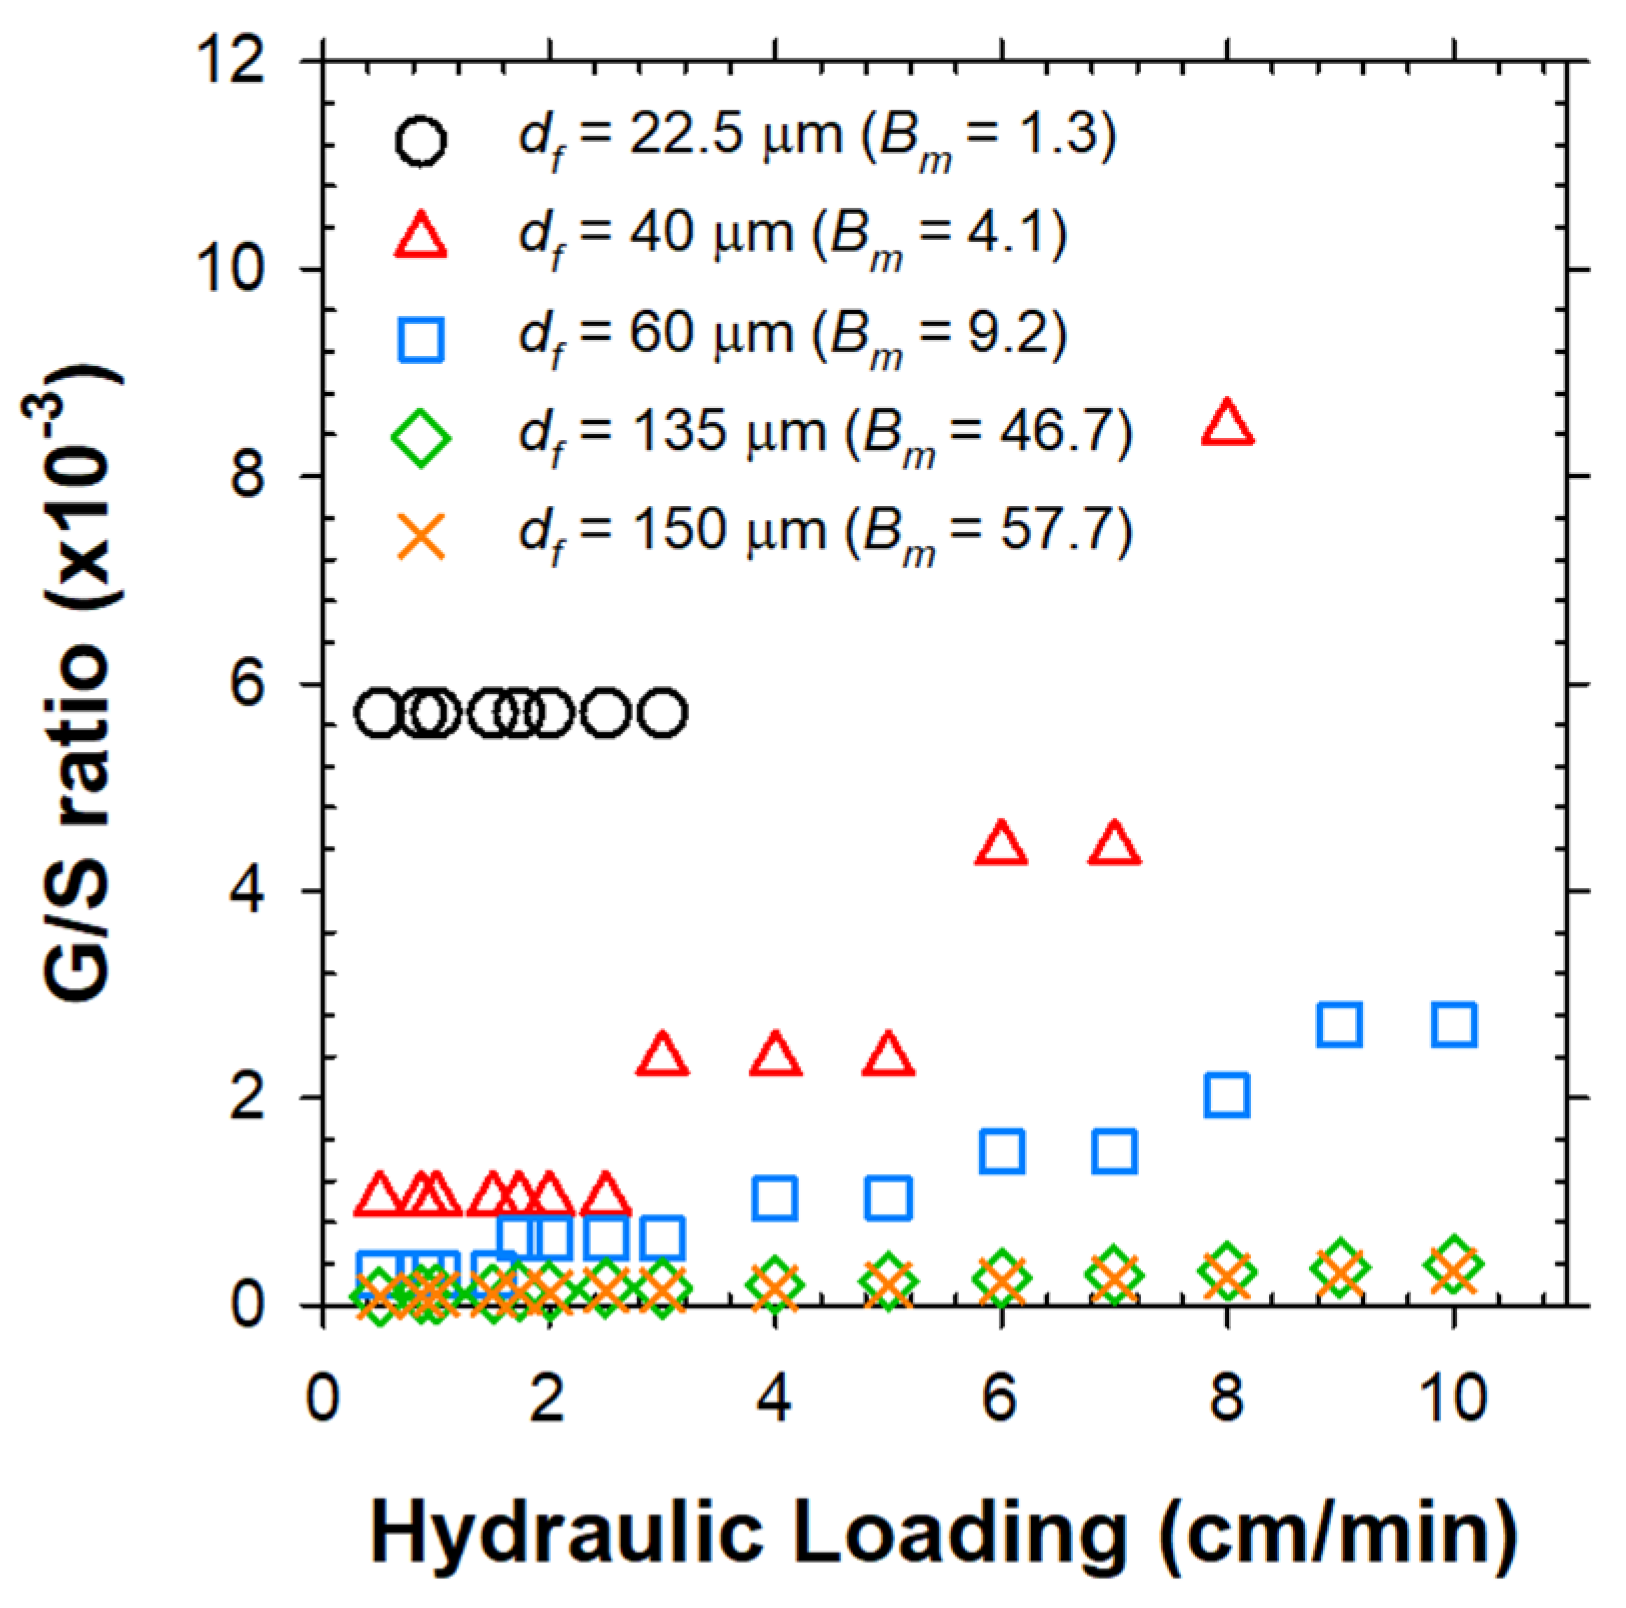
Figure 5a clearly depicts that the Vbf increased nonlinearly with Bn. The minimum Bn (Bnmin in integer form) to overcome the v could be computed for variable df as in Figure 5b. As readily expected, the Bnmin needs to be raised as v increases, more sharply for the larger bio-particles. Subsequently, the Bnmin was translated to total required numbers of bubbles (nb) and limiting G/S ratio under variable values of v (Figure 6), by sequential multiplications by 1/α using Equation (3) with plugging in the estimated α0 value. As shown in Figure 5b and Figure 6, the sludge flocs with df of 22.5 μm and 40 μm could be captured only under v below 3 and 8 cm/min due to the limited Bm of 1.3 and 4.1, respectively. Therefore, the hydraulic loading on the flotation unit should be lowered as the target particle size decreases [24]. The limiting G/S ratio was negligibly altered by the v for df of 22.5 μm (since the only available Bn was 1) and 135–150 μm (since the floc mass far outweighed the H2 bubble mass). In contrast, the limiting G/S ratio for solids with df of 40 μm was the most sensitive to the variations of v. Consequently, the G/S ratio would be the more effective parameter as the particle size approaches the bubble size (df/db~1).
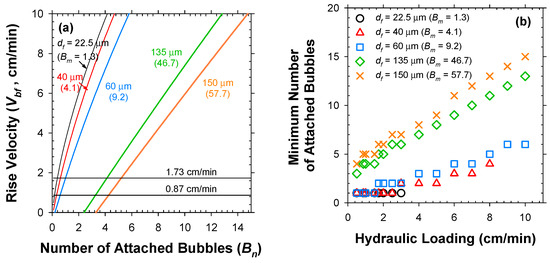
Figure 5.
Relations of (a) Vbf versus Bn and (b) minimum Bn versus v for individual bio-particles with variable sizes.
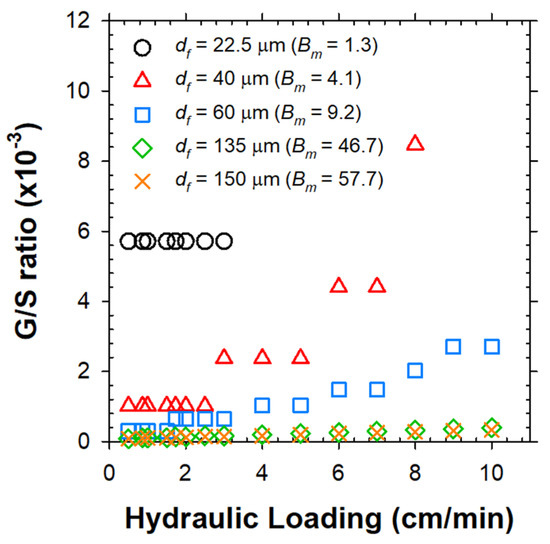
Figure 6.
Limiting G/S ratio as a function of influent v for individual bio-particles with variable sizes.
2.5. Limiting G/S Ratio for Continous Clarification of Mixed Liquor
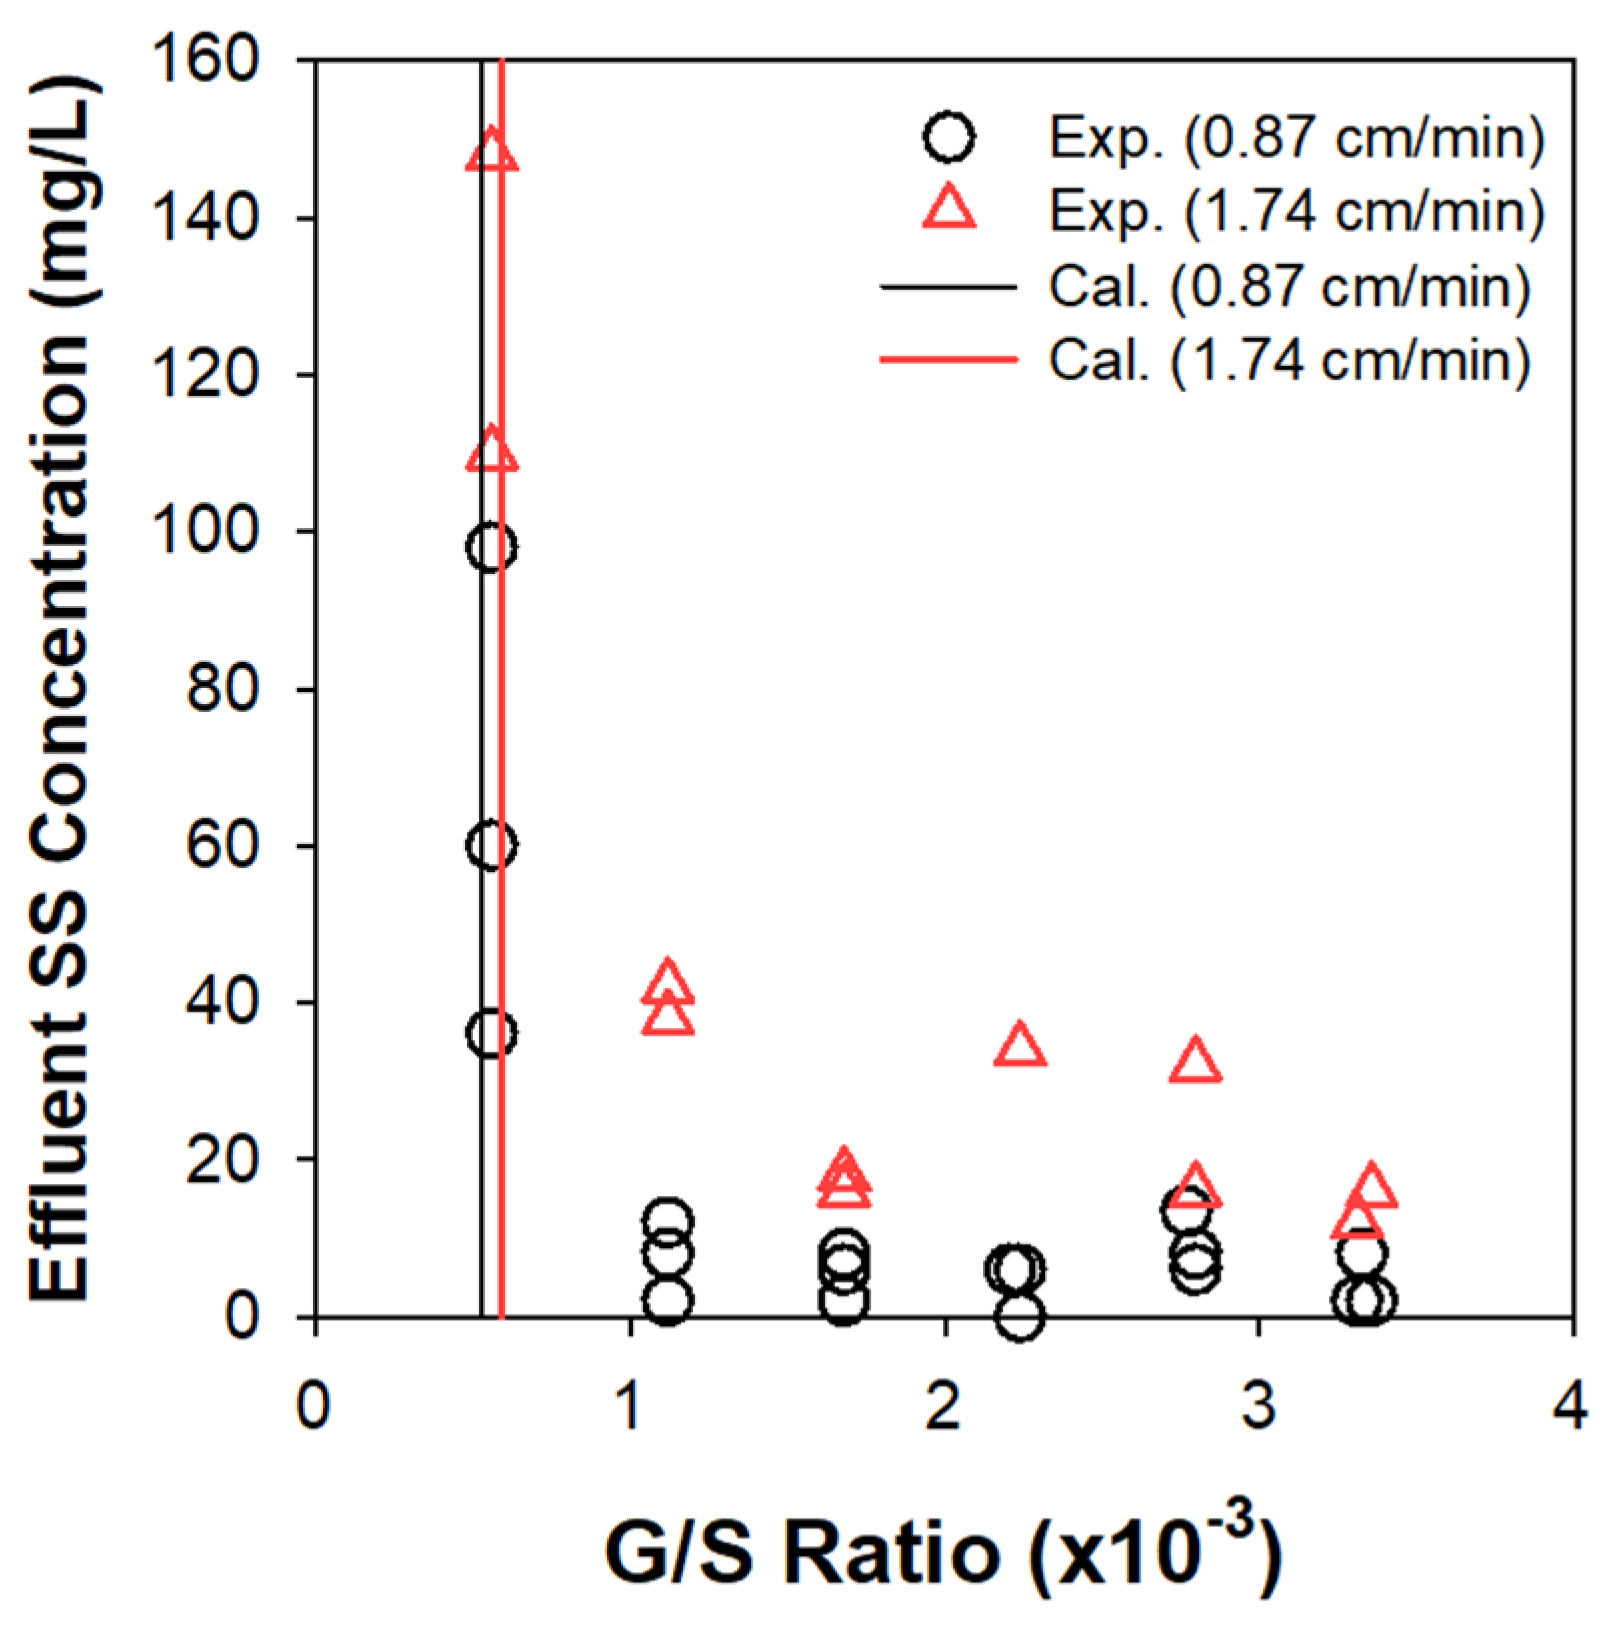
The clarification of activated sludge was assessed in continuous EF experiments under varying G/S ratios, based on effluent suspended solids (SS) concentration (Figure 7). The upper sludge bed quickly grew up to monotonically descend the solids/liquid interface. The SS in subnatant was comprised of the influent particles and (partly) the solids detached from the top sludge blanket. The bubbles rising from the electrode module at the bottom captured the suspended flocs to prevent them from escaping through the outlet beneath the electrodes. Figure 7 corroborated the existence of limiting G/S ratios above which the effluent SS concentration was sharply alleviated. A further increase over the limiting G/S ratio insignificantly improved the separation efficiency. The influent MLSS concentration also marginally influenced the clarification efficiency [2]. Table 2 illustrates the detailed procedure to estimate the limiting G/S ratio (at v of 0.87 cm/min as an example) for separation of mixed liquor with the array of particles. In brief, the nb value for each group of flocs was weighted by the estimated number of flocs in unit mass (1 g) of MLSS to determine the total required mass of H2 bubbles (G/S ratio).
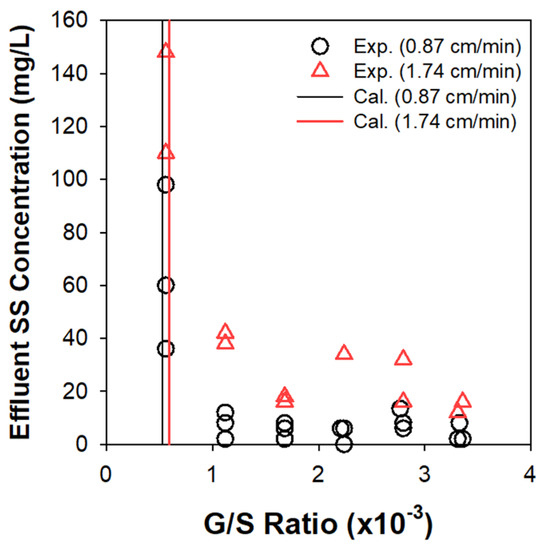
Figure 7.
Effluent SS concentrations as functions of G/S ratio in continuous EF experiments, in comparison with the limiting G/S ratio from the theoretical calculation.
Table 2.
Calculation of limiting G/S ratio corresponding to downflow rate of 0.87 cm/min.
The theoretical estimates of limiting G/S ratio (5.23 × 10⁻⁴ and 5.92 × 10⁻⁴ at 0.87 and 1.74 cm/min, respectively) were in general agreement with the experimental observations, as confirmed in Figure 7. The v doubled from 0.87 to 1.74 cm/min actually necessitated similar limiting G/S ratio, as rationalized by Figure 6. These values were far lower than our previous experimental estimates (7 × 10⁻³–1 × 10⁻²) that included the contributions of O2 bubbles [2]. Although the density of bubble is ignorable compared to water and marginally influences Vbf, as inferred from Equation (5), the composition of bubble mixture (fraction of O2) in EF could significantly change the G/S ratio. This study thus claims that neglecting the O2 bubbles (the minor constituent) would provide more consistent guidelines for the G/S ratio in practical applications. Considering the density of air (1.23 g/L) and H2, on the other hand, the above criteria correspond to (7.1–8.1) × 10−3 of A/S ratio, being comparable with the lower limit of the reported range (5 × 10⁻³–4 × 10⁻²) for sludge clarification by DAF [11]. Generation of finer bubbles in EF could bring about more efficient separation efficiency than in DAF [2], although the specific energy consumption and installation cost should be considered for a fair comparison.
A comparison between Bnmin and Bm could also preconceive the maximum separation efficiency at a specific v. For example, it is impossible to separate the particles with Bnmin exceeding Bm, and the mass fraction of these flocs could be translated to the effluent SS concentration. In this study, the Bnmin was always smaller than Bm in both loading conditions to theoretically allow a perfect separation. However, the observed effluent SS concentration was as high as 40 mg/L with clarification efficiency > 98%. These nonideal behaviors would be partly attributed to a turbulence caused by the incoming flow and the rising bubbles. Our previous report also noted the disruption of an excessively grown sludge bed, especially as the G/S ratio increased [2]. Thus, both contact and separation in a single compartment EF unit might limit the maximum operational range for v and G/S ratio [26] to avoid turbulence. The assumptions of this study could underestimate the limiting G/S ratio, since the bubble-floc agglomerates with Vbf greater than v could still consume additional bubbles during flotation. As the α value diminishes, in addition, interactions not included in the model (e.g., bubble formation at floc surface and/or bubble entrapment) could be more significant [31].
3. Materials and Methods
Grade-2 Ti plates (99.5% metal basis, Narae Plus, Seoul, Korea) with 15 cm2 area and 0.5 mm thickness were coated with Ir7Ta3Ox by the following procedure. The Ti substrates were rubbed with sandpaper (#150) and sequentially pretreated by sonication (in deionized water, 0.5 h), degreasing (in 50 v/v% of acetone, 24 h), and thermochemical cleaning (in 10 m/v% oxalic acid at 80 °C for 10 min) to remove surface impurities, such as TiO2. 70 mM of H2IrCl6 and 30 mM of TaCl5 were dissolved in 1:1 v/v ethanol/isopropanol solution as a precursor. For thermal decomposition, 50 µL of precursor solution was drop-casted on both sides of the pre-treated Ti plates, dried in the oven at 80 °C for 10 min, and annealed in the atmosphere at 525 °C for 10 min. The coating procedure was repeated 6 times before final atmospheric annealing for 1 h (525 °C). The Ir7Ta3Ox anode was paralleled with two Ti cathodes (spacing among electrodes = 5 mm) as a monopolar electrode module to give active geometric surface area of 30 cm2.
A mass flowmeter (Coleparmer, Vernon Hills, IL, USA) equipped with a moisture removal apparatus estimated the CE of electrolytic bubble generation from a gas-tight reactor (500 mL). The CE values were determined in 5 mM NaCl solutions under j of 1.7–26.7 mA/cm2. The measurements were repeated with an O2 removal column (Matheson, Irving, TX, USA) to separately quantify the CE of H2 and O2 bubbles. Since the volumetric flow rate was estimated from pressure drop across an internal restriction, the flow of gas mixture (w/o the O2 removal) was calibrated by viscosity based on the Sutherland formula and Wilke method. The CE values were eventually calculated as ratios to the theoretical rate (mL/min) from Faraday’s law:
where, I is current (mA), n is the number of electrons involved in charge transfer (eq./mol); 2 for the H2 and 4 for O2, and F is the Faraday’s constant (96,485.3 C/mol). The bubble size was measured by an online particle counter (Chemtrac, Norcross, GA, USA) [2,13], utilizing a light blockage method by infrared laser diode with a measurement range from 2–400 μm. The electrolyte in the reactor was circulated through the sensor at 100 mL/min.
Activated sludge samples (sludge volume index of the mixed liquor: 50 ± 5 mL/g) were collected from a lab-scale sequencing batch reactor [2]. The floc size distribution was determined by a laser-diffraction-based particle size analyzer (Malvern Instruments, Ltd., Malvern, UK). Batch EF experiments, for estimation of α0 from required charge for clarification, were performed in a cylindrical reactor (1 L). The initial MLSS and current ranged from 2–6 g/L and 50–600 mA, respectively. In continuous EF experiments, cylindrical reactors (2 L) were first filled with 5 mM of NaCl before introducing mixed liquor upon the potential bias. The effluent was collected from the reactor bottom to evaluate the separation efficiency based on SS concentration. The MLSS concentration, flow rate, and current were in the range of 2–4 g/L, 2–4 L/h, and 60–1420 mA, respectively. The (ML)SS concentrations were measured based on the Standard Methods [33]. More details in clarification experiments can be found in our previous reports [2,13,14].
A theoretical calculation for limiting the G/S ratio in EF was grounded on Equations (3)–(5). The bubble-particle agglomerates would escape with effluent in a flow reactor if the Vbf (calculated based on the separation zone model in DAF [24]) is lower than the v.
where, the dfb is the relative diameter of floc to bubble (df/db), while the density of water, flocs, and bubbles are denoted as ρw, ρf, and ρb, respectively.
4. Conclusions
This study revisited the limiting G/S ratio (mass ratio of bubbles to solids) theoretically and experimentally for clarification of activated sludge mixed liquor. The bubble generation CE was ~1 for H2 (on Ti cathode) and ~0.4 for O2 (on Ir7Ta3Ox anode), respectively, with minor dependences on electrolyte and j (>8 mA/cm2) in the operational conditions. Therefore, the G/S ratio in EF could be readily adjusted by j upon fluctuating influent conditions, while the contributions of minor O2 bubbles could be ruled out. Upon the simplified size distributions for bio-solids and bubbles, batch experiments estimated α0 of 0.057. The numerical estimates for the limiting G/S ratio were 5.23 × 10⁻⁴ and 5.92 × 10⁻⁴ at 0.87 and 1.74 cm/min of v, respectively, in general agreement with the continuous EF experiments. The buoyancy of electrolytic bubbles (primarily molecular H2) could be employed for variable environmental remediation (separation of particulate pollutants) and energy conversion (renewable energy storage) purposes, to be fitted to water-energy nexus framework in selected cases.
Author Contributions
Conceptualization, T.H.C. and K.C.; methodology, J.K.; validation, C.M.C.; formal analysis, C.M.C.; writing—original draft preparation, J.K.; writing—review and editing, K.C.; visualization, J.K.; supervision, T.H.C. and K.C.; project administration, T.H.C.; funding acquisition, K.C. All authors have read and agreed to the published version of the manuscript.
Funding
This research was funded by the Ministry of Trade, Industry and Energy (MOTIE, Korea) under Materials/Components Technology Development Program (No. 20011360) and National Strategic R&D Program for Future Hydrogen (NRF-2021M3I3A1084818) through the National Research Foundation of Korea.
Conflicts of Interest
The authors declare no conflict of interest.
References
- Chen, G. Electrochemical technologies in wastewater treatment. Sep. Purif. Technol. 2004, 38, 11–41. [Google Scholar] [CrossRef]
- Cho, K.W.; Kim, Y.J.; Choi, Y.G.; Hong, S.W.; Chung, T.H. Ratio of electrolytic bubbles to solids as a governing parameter of flotation for activated sludge. Environ. Eng. Sci. 2009, 26, 1131–1138. [Google Scholar] [CrossRef]
- Al-Shamrani, A.; James, A.; Xiao, H. Destabilisation of oil–water emulsions and separation by dissolved air flotation. Water Res. 2002, 36, 1503–1512. [Google Scholar] [CrossRef]
- Murugananthan, M.; Raju, G.B.; Prabhakar, S. Separation of pollutants from tannery effluents by electro flotation. Sep. Purif. Technol. 2004, 40, 69–75. [Google Scholar] [CrossRef]
- Hosny, A.Y. Separating oil from oil-water emulsions by electroflotation technique. Sep. Technol. 1996, 6, 9–17. [Google Scholar] [CrossRef]
- Moosai, R.; Dawe, R.A. Gas attachment of oil droplets for gas flotation for oily wastewater cleanup. Sep. Purif. Technol. 2003, 33, 303–314. [Google Scholar] [CrossRef]
- Sandbank, E.; Shelef, G.; Wachs, A. Improved electroflotation for the removal of suspended solids from algal pond effluents. Water Res. 1974, 8, 587–592. [Google Scholar] [CrossRef]
- Zlokarnik, M. Separation of activated sludge from purified waste water by Induced Air Flotation (IAF). Water Res. 1998, 32, 1095–1102. [Google Scholar] [CrossRef]
- Offringa, G. Dissolved air flotation in Southern Africa. Water Sci. Technol. 1995, 31, 159–172. [Google Scholar] [CrossRef]
- Haarhoff, J.; van Vuuren, L.R. Design parameters for dissolved air flotation in South Africa. Water Sci. Technol. 1995, 31, 203–212. [Google Scholar] [CrossRef]
- Bratby, J.; Ambrose, W. Design and control of flotation thickeners. Water Sci. Technol. 1995, 31, 247–261. [Google Scholar] [CrossRef]
- Chung, T.H.; Kim, D.Y. Significance of pressure and recirculation in sludge thickening by dissolved air flotation. Water Sci. Technol. 1997, 36, 223–230. [Google Scholar]
- Cho, K.W.; Chung, C.M.; Kim, Y.J.; Chung, T.H. Continuous clarification and thickening of activated sludge by electrolytic bubbles under control of scale deposition. Bioresour. Technol. 2010, 101, 2945–2951. [Google Scholar] [CrossRef] [PubMed]
- Cho, K.; Chung, C.M.; Kim, Y.J.; Hoffmann, M.R.; Chung, T.H. Electroflotation clarifier to enhance nitrogen removal in a two-stage alternating aeration bioreactor. Environ. Technol. 2013, 34, 2765–2772. [Google Scholar] [CrossRef]
- Gnirss, R.; Peter-Frölich, A. Biological treatment of municipal wastewater with deep tanks and flotation for secondary clarification. Water Sci. Technol. 1996, 34, 257–265. [Google Scholar] [CrossRef]
- Cho, K.; Hoffmann, M.R. Molecular hydrogen production from wastewater electrolysis cell with multi-junction BiOx/TiO2 anode and stainless steel cathode: Current and energy efficiency. Appl. Catal. B-Environ. 2017, 202, 671–682. [Google Scholar] [CrossRef] [Green Version]
- Trasatti, S. Electrocatalysis: Understanding the success of DSA®. Electrochim. Acta 2000, 45, 2377–2385. [Google Scholar] [CrossRef]
- Vogt, H. The rate of gas evolution of electrodes—I. An estimate of the efficiency of gas evolution from the supersaturation of electrolyte adjacent to a gas-evolving electrode. Electrochim. Acta 1984, 29, 167–173. [Google Scholar] [CrossRef]
- Vogt, H. On the gas-evolution efficiency of electrodes I–Theoretical. Electrochim. Acta 2011, 56, 1409–1416. [Google Scholar] [CrossRef]
- Joe, J.C.K.; Janssen, L.; Van Strelen, S.; Verbunt, J.; Sluyter, W. Bubble parameters and efficiency of gas bubble evolution for a chlorine-, a hydrogen-and an oxygen-evolving wire electrode. Electrochim. Acta 1988, 33, 769–779. [Google Scholar]
- Zhang, X.; Wang, Y.T.; Liu, C.B.; Yu, Y.F.; Lu, S.Y.; Zhang, B. Recent advances in non-noble metal electrocatalysts for nitrate reduction. Chem. Eng. J. 2021, 403, 126269. [Google Scholar] [CrossRef]
- Hacha, R.R.; Merma, A.G.; Couto, H.J.B.; Torem, M.L. Measurement and analysis of H-2 and O-2 bubbles diameter produced era by electroflotation processes in a modified Partridge-Smith cell. Powder Technol. 2019, 342, 308–320. [Google Scholar] [CrossRef]
- Andreadakis, A.D. Physical and chemical properties of activated sludge floc. Water Res. 1993, 27, 1707–1714. [Google Scholar] [CrossRef]
- Edzwald, J.K. Dissolved air flotation and me. Water Res. 2010, 44, 2077–2106. [Google Scholar] [CrossRef] [PubMed]
- Han, M.; Kim, W.; Dockko, S. Collision efficiency factor of bubble and particle (abp) in DAF: Theory and experimental verification. Water Sci. Technol. 2001, 43, 139–144. [Google Scholar] [CrossRef] [PubMed]
- Fukushi, K.-i.; Tambo, N.; Matsui, Y. A kinetic model for dissolved air flotation in water and wastewater treatment. Water Sci. Technol. 1995, 31, 37–47. [Google Scholar] [CrossRef]
- Edzwald, J.K. Principles and applications of dissolved air flotation. Water Sci. Technol. 1995, 31, 1–23. [Google Scholar] [CrossRef]
- Kwak, D.; Jung, H.; Kim, S.; Won, C.; Lee, J. Separation characteristics of inorganic particles from rainfalls in dissolved air flotation: A Korean perspective. Sep. Sci. Technol. 2005, 40, 3001–3015. [Google Scholar] [CrossRef]
- Kwak, D.-H.; Jung, H.-J.; Kwon, S.-B.; Lee, E.-J.; Won, C.-H.; Lee, J.-W.; Yoo, S.-J. Rise velocity verification of bubble-floc agglomerates using population balance in the DAF process. J. Water Supply Res. Technol.—AQUA 2009, 58, 85–94. [Google Scholar] [CrossRef]
- Matis, K.; Gallios, G.; Kydros, K. Separation of fines by flotation techniques. Sep. Technol. 1993, 3, 76–90. [Google Scholar] [CrossRef]
- Rubio, J.; Souza, M.; Smith, R. Overview of flotation as a wastewater treatment technique. Miner. Eng. 2002, 15, 139–155. [Google Scholar] [CrossRef]
- Burns, S.; Yiacoumi, S.; Tsouris, C. Microbubble generation for environmental and industrial separations. Sep. Purif. Technol. 1997, 11, 221–232. [Google Scholar] [CrossRef]
- Federation, W.E.; Association, A. Standard Methods for the Examination of Water and Wastewater; American Public Health Association (APHA): Washington, DC, USA, 2005. [Google Scholar]


Publisher’s Note: MDPI stays neutral with regard to jurisdictional claims in published maps and institutional affiliations. |
© 2021 by the authors. Licensee MDPI, Basel, Switzerland. This article is an open access article distributed under the terms and conditions of the Creative Commons Attribution (CC BY) license (https://creativecommons.org/licenses/by/4.0/).