Article

Photo-Fenton Oxidation of Methyl Orange Dye Using South African Ilmenite Sands as a Catalyst

by
Alicia Levana Butt
,
John Kabangu Mpinga
and
Shepherd Masimba Tichapondwa
*
Department of Chemical Engineering, Water Utilization and Environmental Engineering Division, University of Pretoria, Pretoria 0002, South Africa
*
Author to whom correspondence should be addressed.
Catalysts 2021, 11(12), 1452; https://doi.org/10.3390/catal11121452
Submission received: 21 October 2021 / Revised: 20 November 2021 / Accepted: 26 November 2021 / Published: 29 November 2021
(This article belongs to the Special Issue Application of Photocatalysts in Environmental Chemistry)

Abstract

:
In this study, the viability of South African ilmenite sands as a catalyst in the photo-Fenton-like degradation of methyl orange (MO) dye was investigated. The mineralogy and other properties of the material were characterized. Complete decolorization occurred under acidic conditions (pH < 4) in the presence of ilmenite and H2O2. Light irradiation accelerated the rate of reaction. Parameter optimization revealed that a pH of 2.5, UVB irradiation, 2 g/L catalyst loading, and a hydrogen peroxide concentration of 1.0 mM were required. Under these conditions, complete decolorization was observed after 45 min. Degradation kinetics were best described by the pseudo-first order (PFO) model. Rate constants of 0.095 and 0.034 min−1 were obtained for 5 and 20 mg/L MO concentrations, respectively. A 37% total organic carbon removal was observed after 60 min. This suggests a stepwise MO degradation pathway with intermediate formation rather than complete mineralization. Although iron leaching was detected, the mineralogy of the catalyst recovered after the reaction was similar to the fresh catalyst.

1. Introduction

The increased demand for clean, potable water coupled with diminishing access to clean water sources has resulted in a growing need for research into alternative water sources, with water reuse showing great potential [1,2]. Anthropogenic activities such as manufacturing and agricultural activities generate large volumes of effluents contaminated with aromatic organic compounds, which are classified as refractory or emerging pollutants. If left untreated, these compounds pose serious health threats as they possess known endocrine-disrupting and carcinogenic properties [3,4]. Conventional biological wastewater treatment processes are the most widely used in wastewater treatment [5]. However, these processes are incapable of degrading the recalcitrant priority and some emerging pollutants. As a result, tertiary water treatment processes such as adsorption [6] and membrane separation have been implemented to remediate these compounds to make the effluent suitable for reuse. While these technologies have been shown to be effective [7], they tend to generate secondary waste streams that require further treatment or specialized containment [7]. Advanced oxidation processes (AOPs) are a group of technologies that have emerged to eliminate these shortcomings due to their ability to break down and mineralize refractory organic compounds to benign carbon dioxide and water [8]. The principle behind AOPs is driven by the generation of highly oxidative free radicals that participate in redox chemical reactions, which drive the degradation process [9]. The Fenton reaction is one of the most effective AOPs; it uses soluble iron salts and hydrogen peroxide to generate highly reactive hydroxyl radicals. Although commonly used, the Fenton reaction is problematic as it introduces large quantities of iron into solution and generates secondary metal-containing sludge [9,10,11]. Resultantly, modifications to the process have been implemented; chief amongst these is the use of alternative sources of iron [12,13]. Additionally, introducing light to the reactor setup to obtain the so-called photo-Fenton reaction reportedly allows for faster catalyst regeneration [14,15]. This results in a superior performance compared to the classical Fenton’s reagent [16].
Catalytic wet peroxide oxidation (CWPO) is one of the AOPs developed to overcome the problems associated with the classical Fenton reaction [9,17]. This process uses a solid metal-bearing catalyst instead of a soluble metal salt to avoid excessive metal leaching and sludge formation [18]. Current research in CWPO focuses on identifying and developing efficient, cost-effective catalysts for use in systems utilized to degrade a range of pollutants [19]. The catalysts used are generally classified as natural or synthetic, with synthetics comprised of a large group of different types. Numerous catalysts and composite materials have been developed with varying levels of efficiency reported [18]. However, it is generally accepted that the complicated synthesis methods and expensive raw materials make them economically unviable [19,20]. Emerging research has therefore focused on identifying naturally occurring minerals that can be used as alternative catalysts [21,22,23].
Ilmenite (FeTiO3) is one such minerals that has shown promise as a catalyst for AOPs. The presence of redox-active Fe elements in the ilmenite structure makes it suitable for Fenton-like processes, while the presence of TiO2 allows for potential photocatalytic activity [21]. These researchers obtained a significant degradation efficiency and TOC removal for phenol and real hospital wastewater [24,25]. Additionally, Pataquiva-Mateus et al. [26] conducted a study using three Colombian ilmenites from different locations as catalysts for the decolorization of the azo dye, namely Orange II, in the Fenton’s reaction. The study found that the catalyst with the most significant percentage of iron (56.7%) led to the fastest decolorization rate, with complete decolorization achieved following 9 h of reaction time.
It is worth noting that while naturally occurring minerals have been proven to be effective and low-cost catalysts, their mineralogy will vary with location. This ultimately influences the chemical and physical properties of the catalyst, and varying efficiencies might be observed for ores with the same major compounds. This study is therefore aimed at determining the viability of naturally occurring South African ilmenite as a catalyst in the CWPO process using methyl orange as a model compound. The optimum reaction parameters are investigated and the reaction mechanism is elucidated.

2. Results

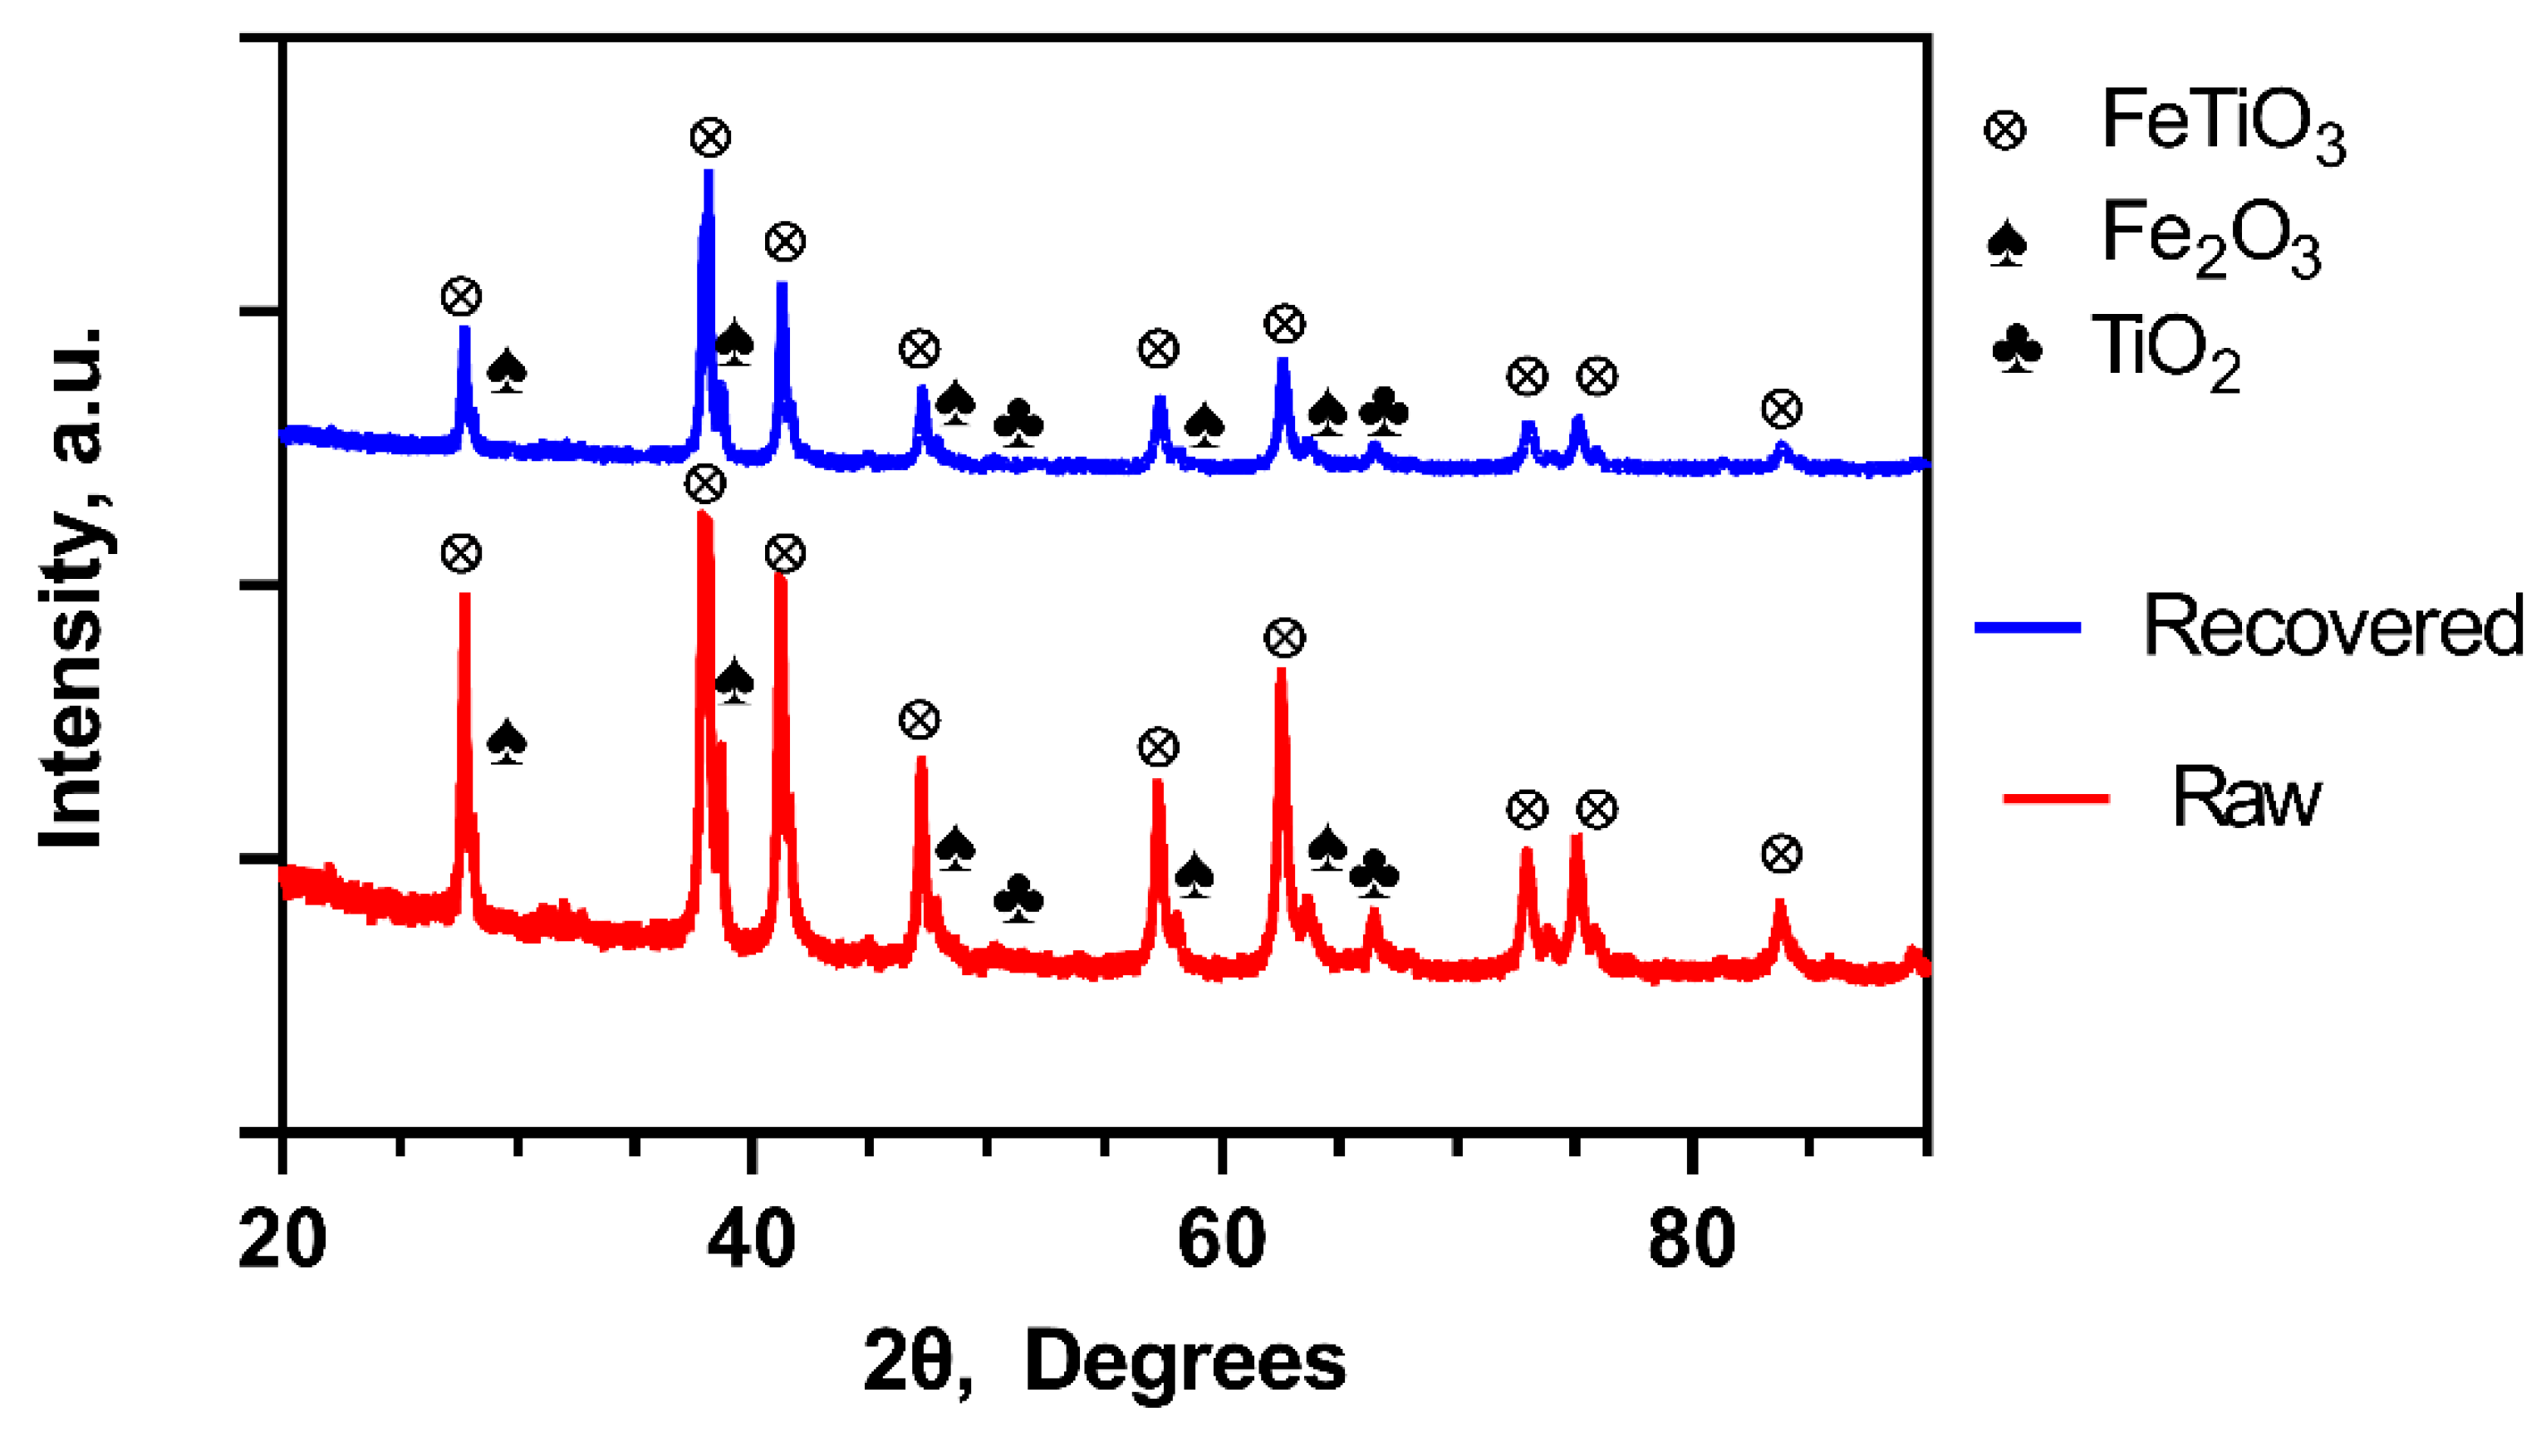
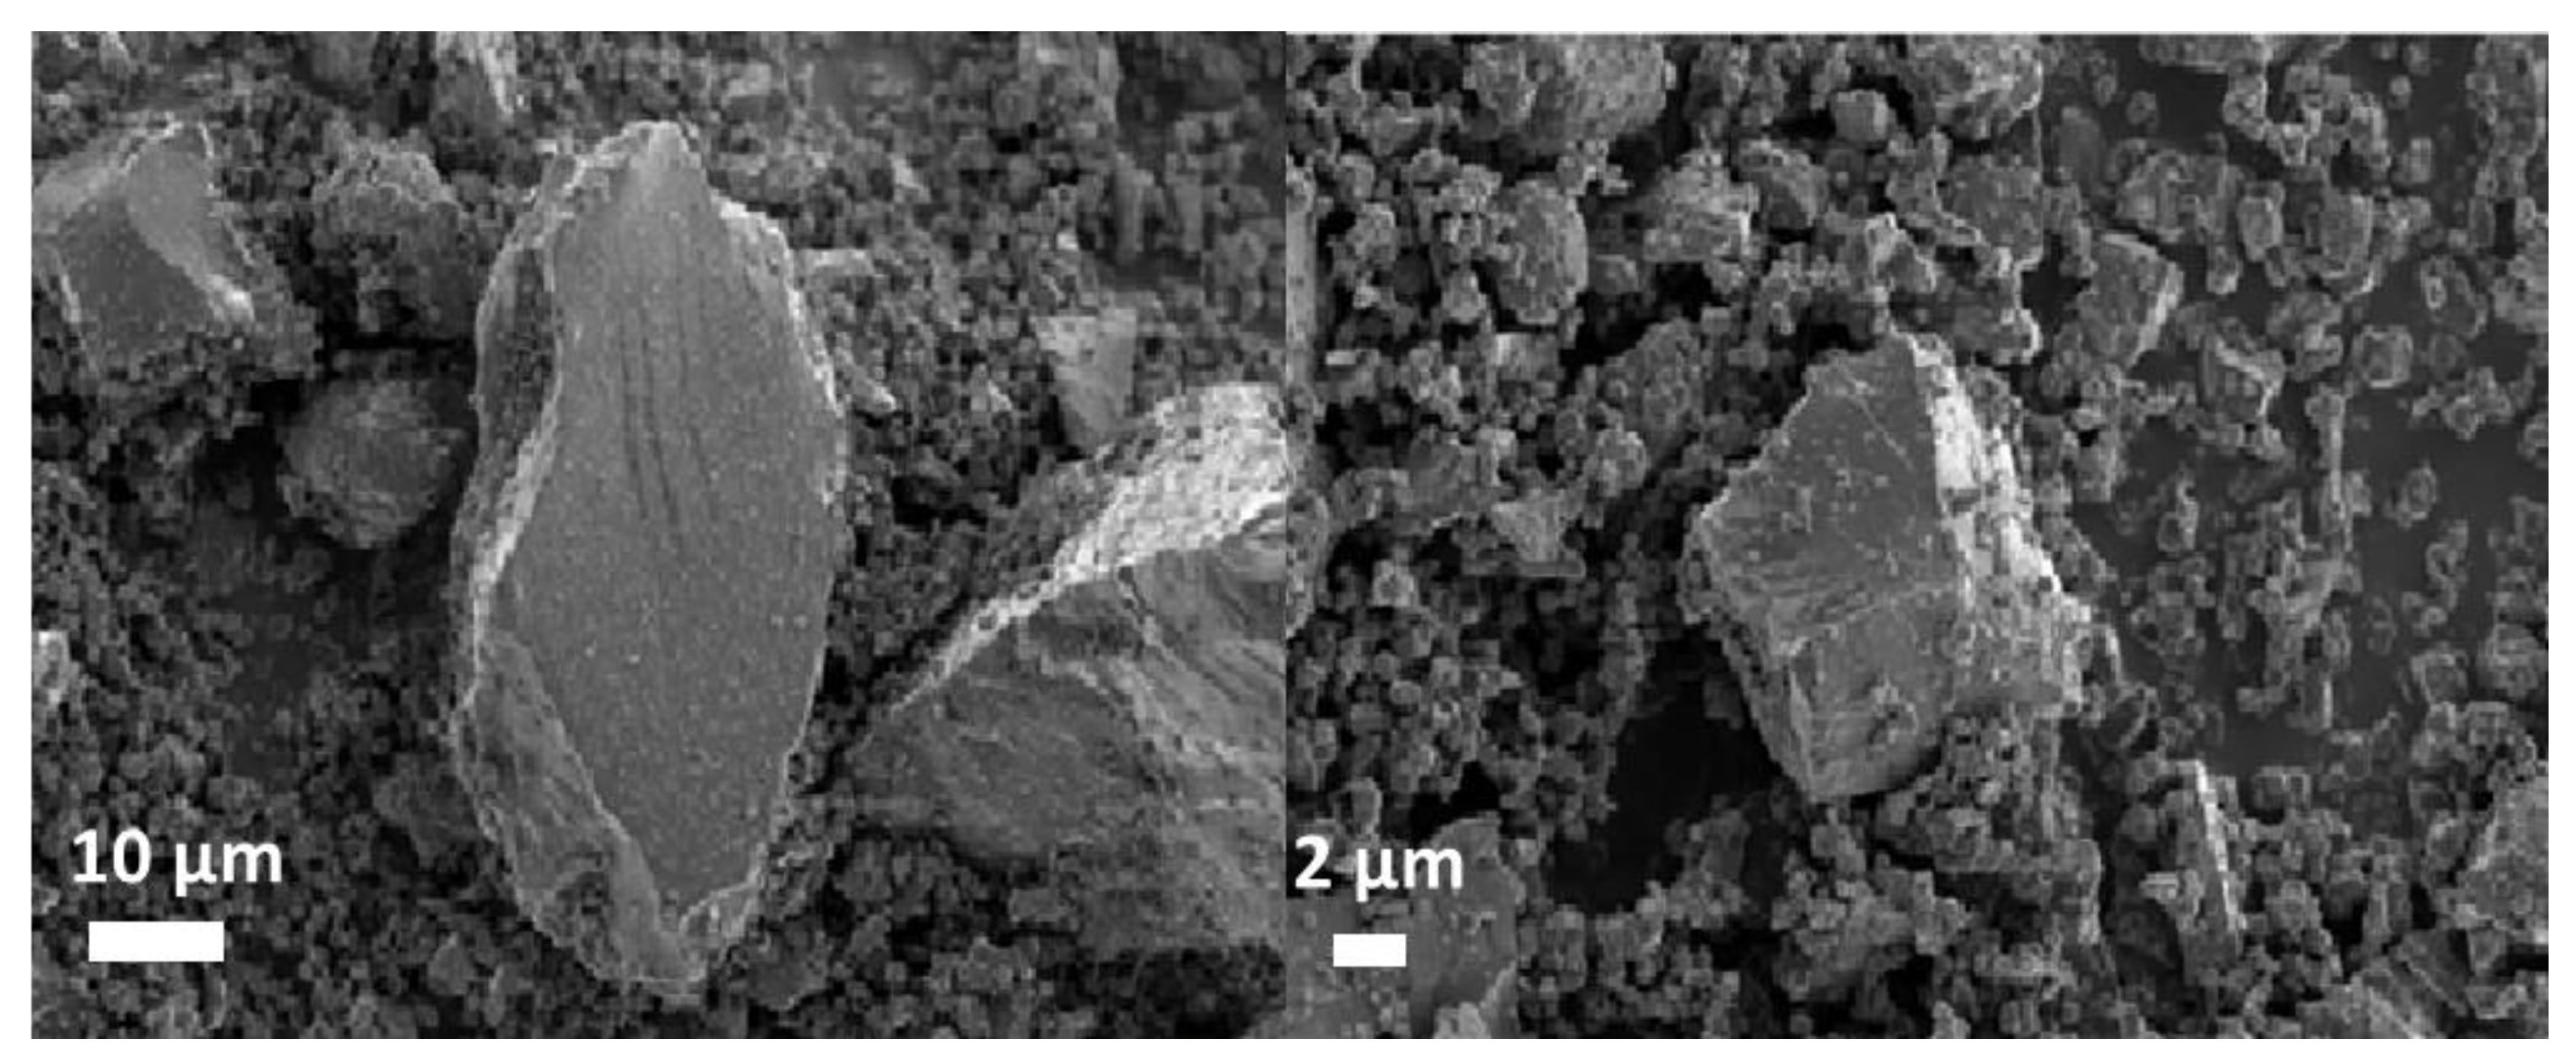
2.1. Catalyst Characterization

The mineralogy of the catalyst was determined through XRD analysis; the results obtained are presented in Figure 1. The most pronounced peaks were observed at 2θ values of 27.8, 38.1, 41.2, and 62.5. These were attributed to the presence of ilmenite which accounted for 83.53% of the composition. Hematite (14.99%) and trace amounts of rutile (1.2%) were also detected. Hematite has been reported to be an effective catalyst in Fenton-type reactions and positively contributes to the performance of ilmenite [9]. Titanium oxide is one of the most widely used catalysts in photocatalysis due to its ability to generate highly reactive free radicals following electron/hole pair separation under light irradiation [9]. For this study, it is postulated that the influence of TiO2 will be negligible since it is present in trace amounts. Additionally, it has been reported that the rutile phase detected had a lower efficacy compared to anatase, a polymorph of TiO2 [27]. An XRF analysis revealed the elemental distribution to be Fe (34.6 wt.%), Ti (32.3 wt.%), and oxygen (28.73 wt.%), with trace amounts of Mn, Mg, Al, and V, respectively.
It should be noted that the theoretical weight percentages of elements in pure ilmenite are 36.8% Fe, 31.6% Ti, and 31.6% O. However, since the present sample is natural and not purified, variations are expected. Table 1 summarizes characterization results reported by other researchers. The majority of the studies had a higher TiO2 concentration and a minimal amount of hematite.
Figure 2 shows the morphology of the catalyst used in the study. The larger particles had an irregular angular morphology while the smaller particles had a near-spherical shape with a high degree of agglomeration. The primary size of the particles in the agglomerates was in the nano-range. It was postulated that these particles gave rise to the higher BET surface area (10.42 m2/g) recorded in the present study compared to the values reported in literature (Table 1). EDS images (Figure S1) confirmed a relatively even distribution of titanium and iron throughout the material. The scattered silicon clusters were attributed to amorphous SiO2 since no crystalline quarts were detected in the XRD analysis.

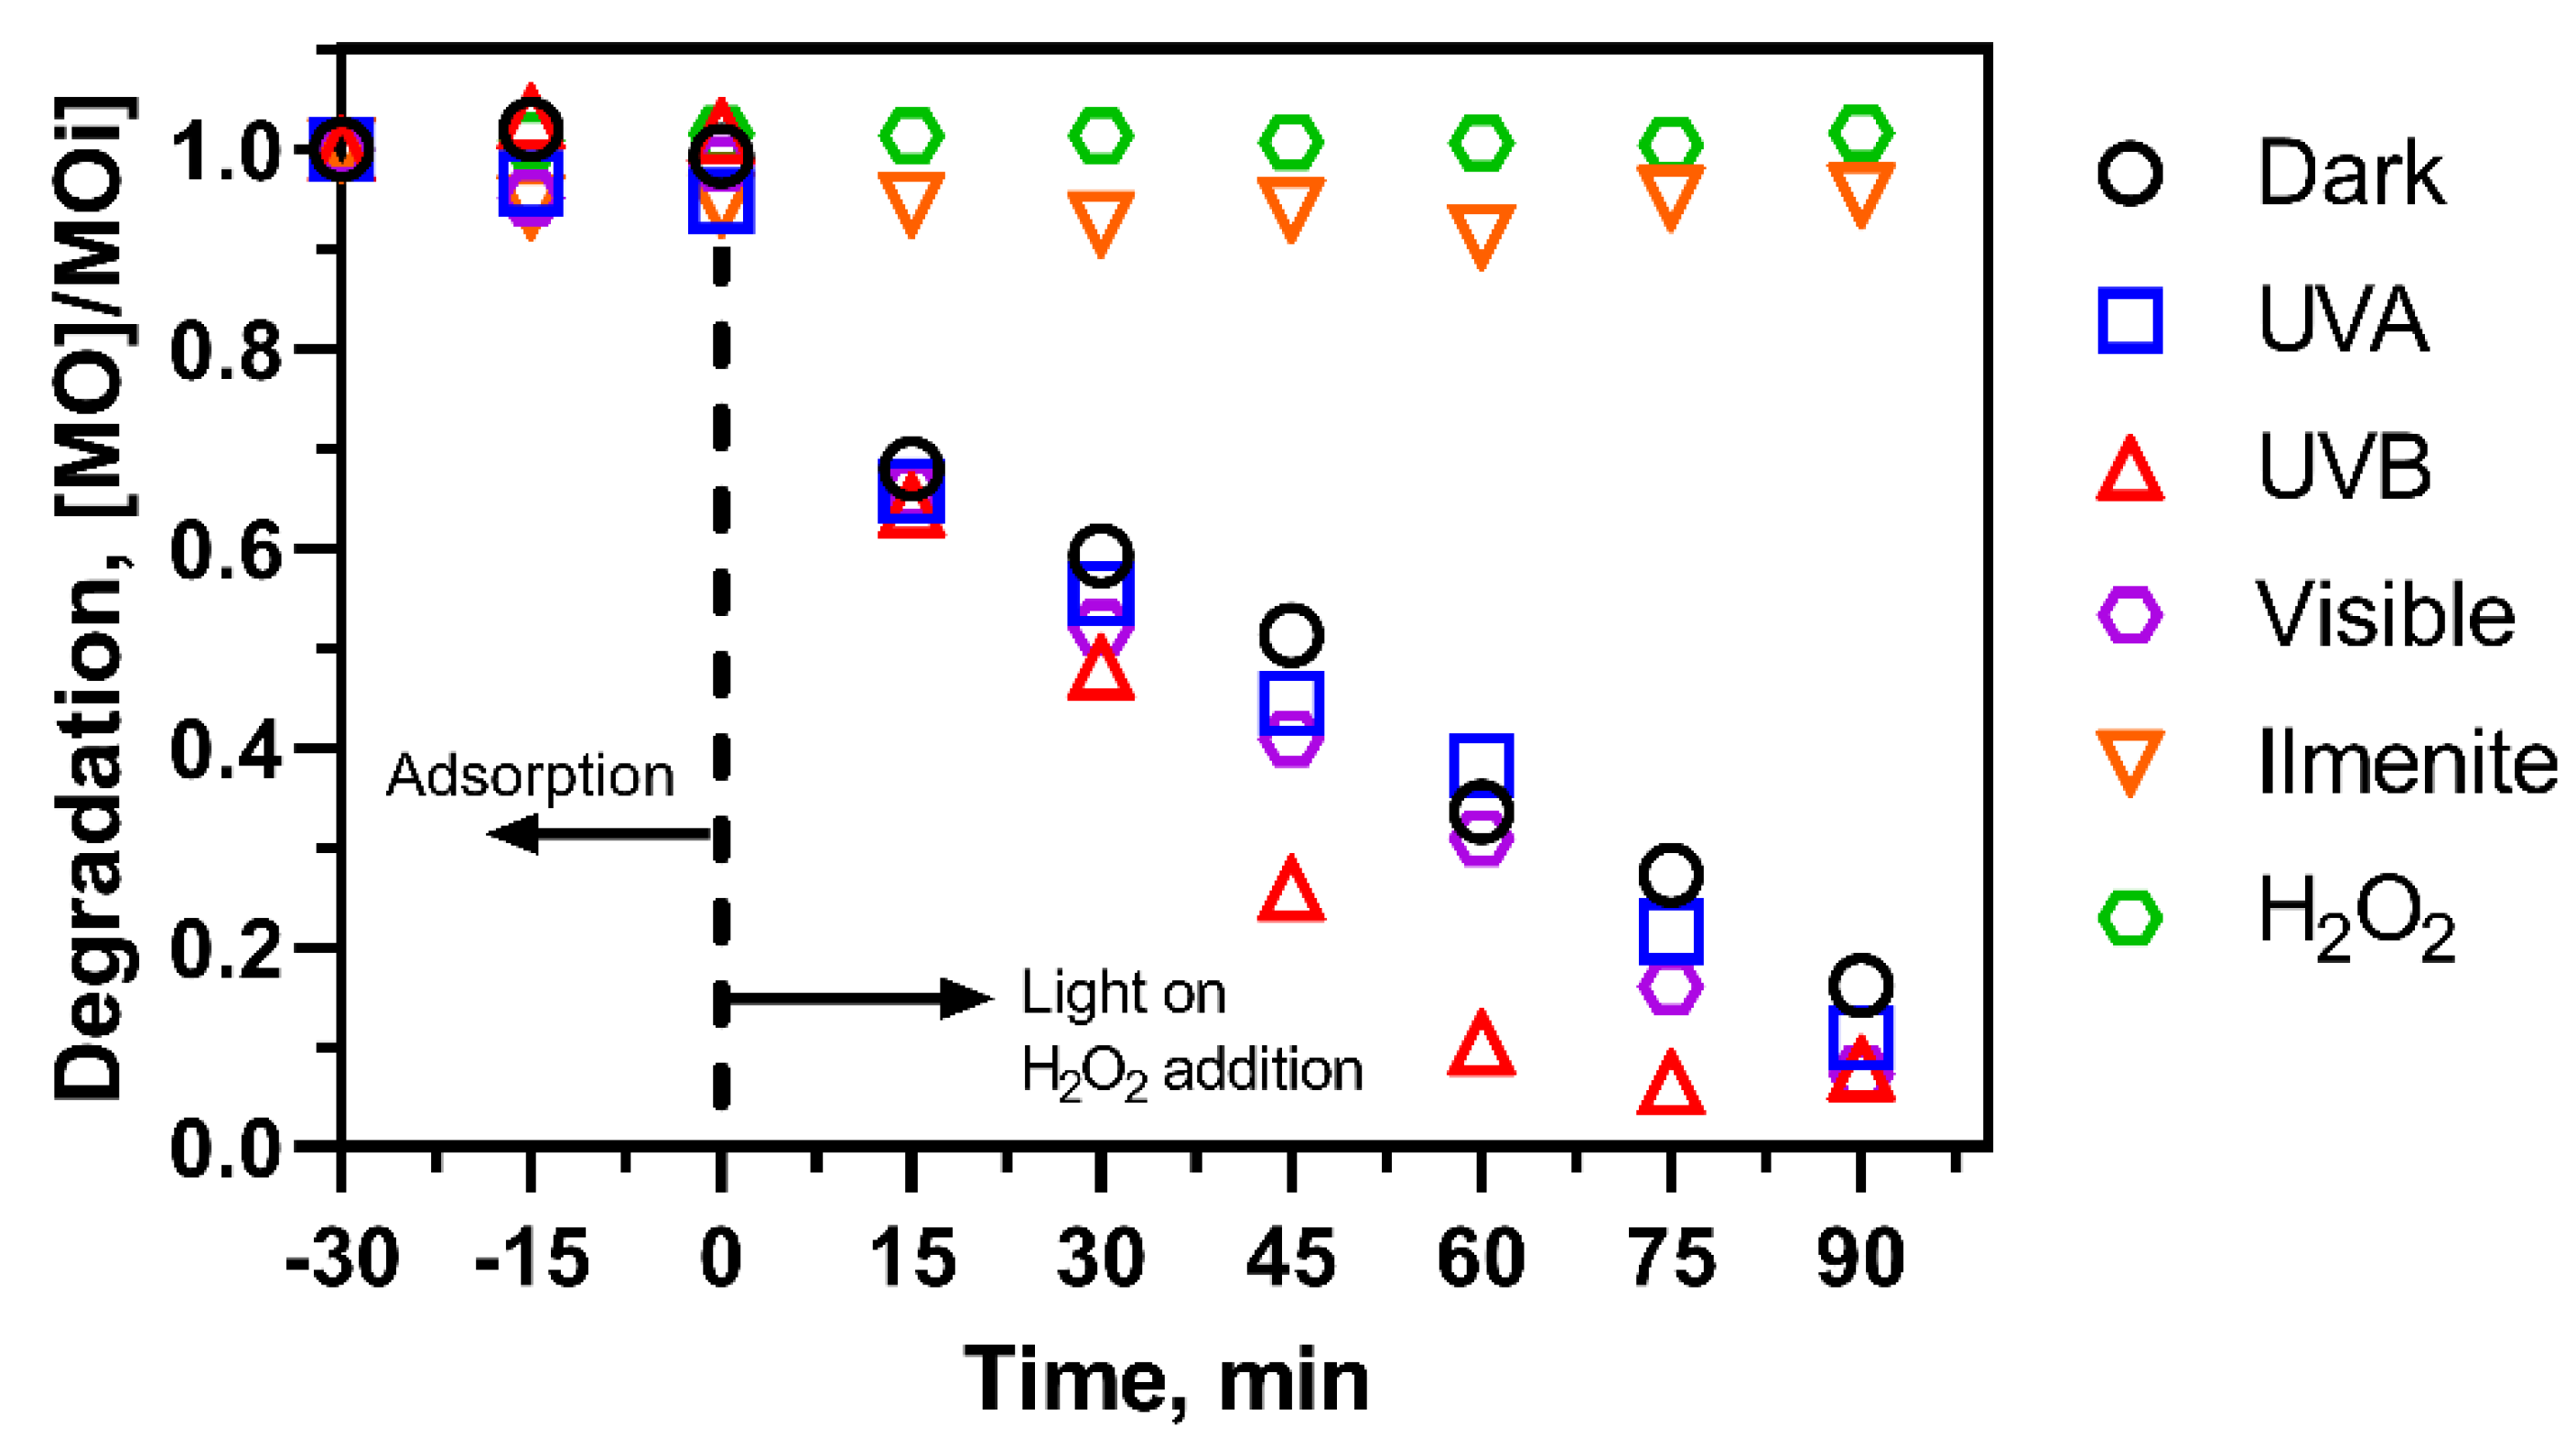
2.2. Control Experiments
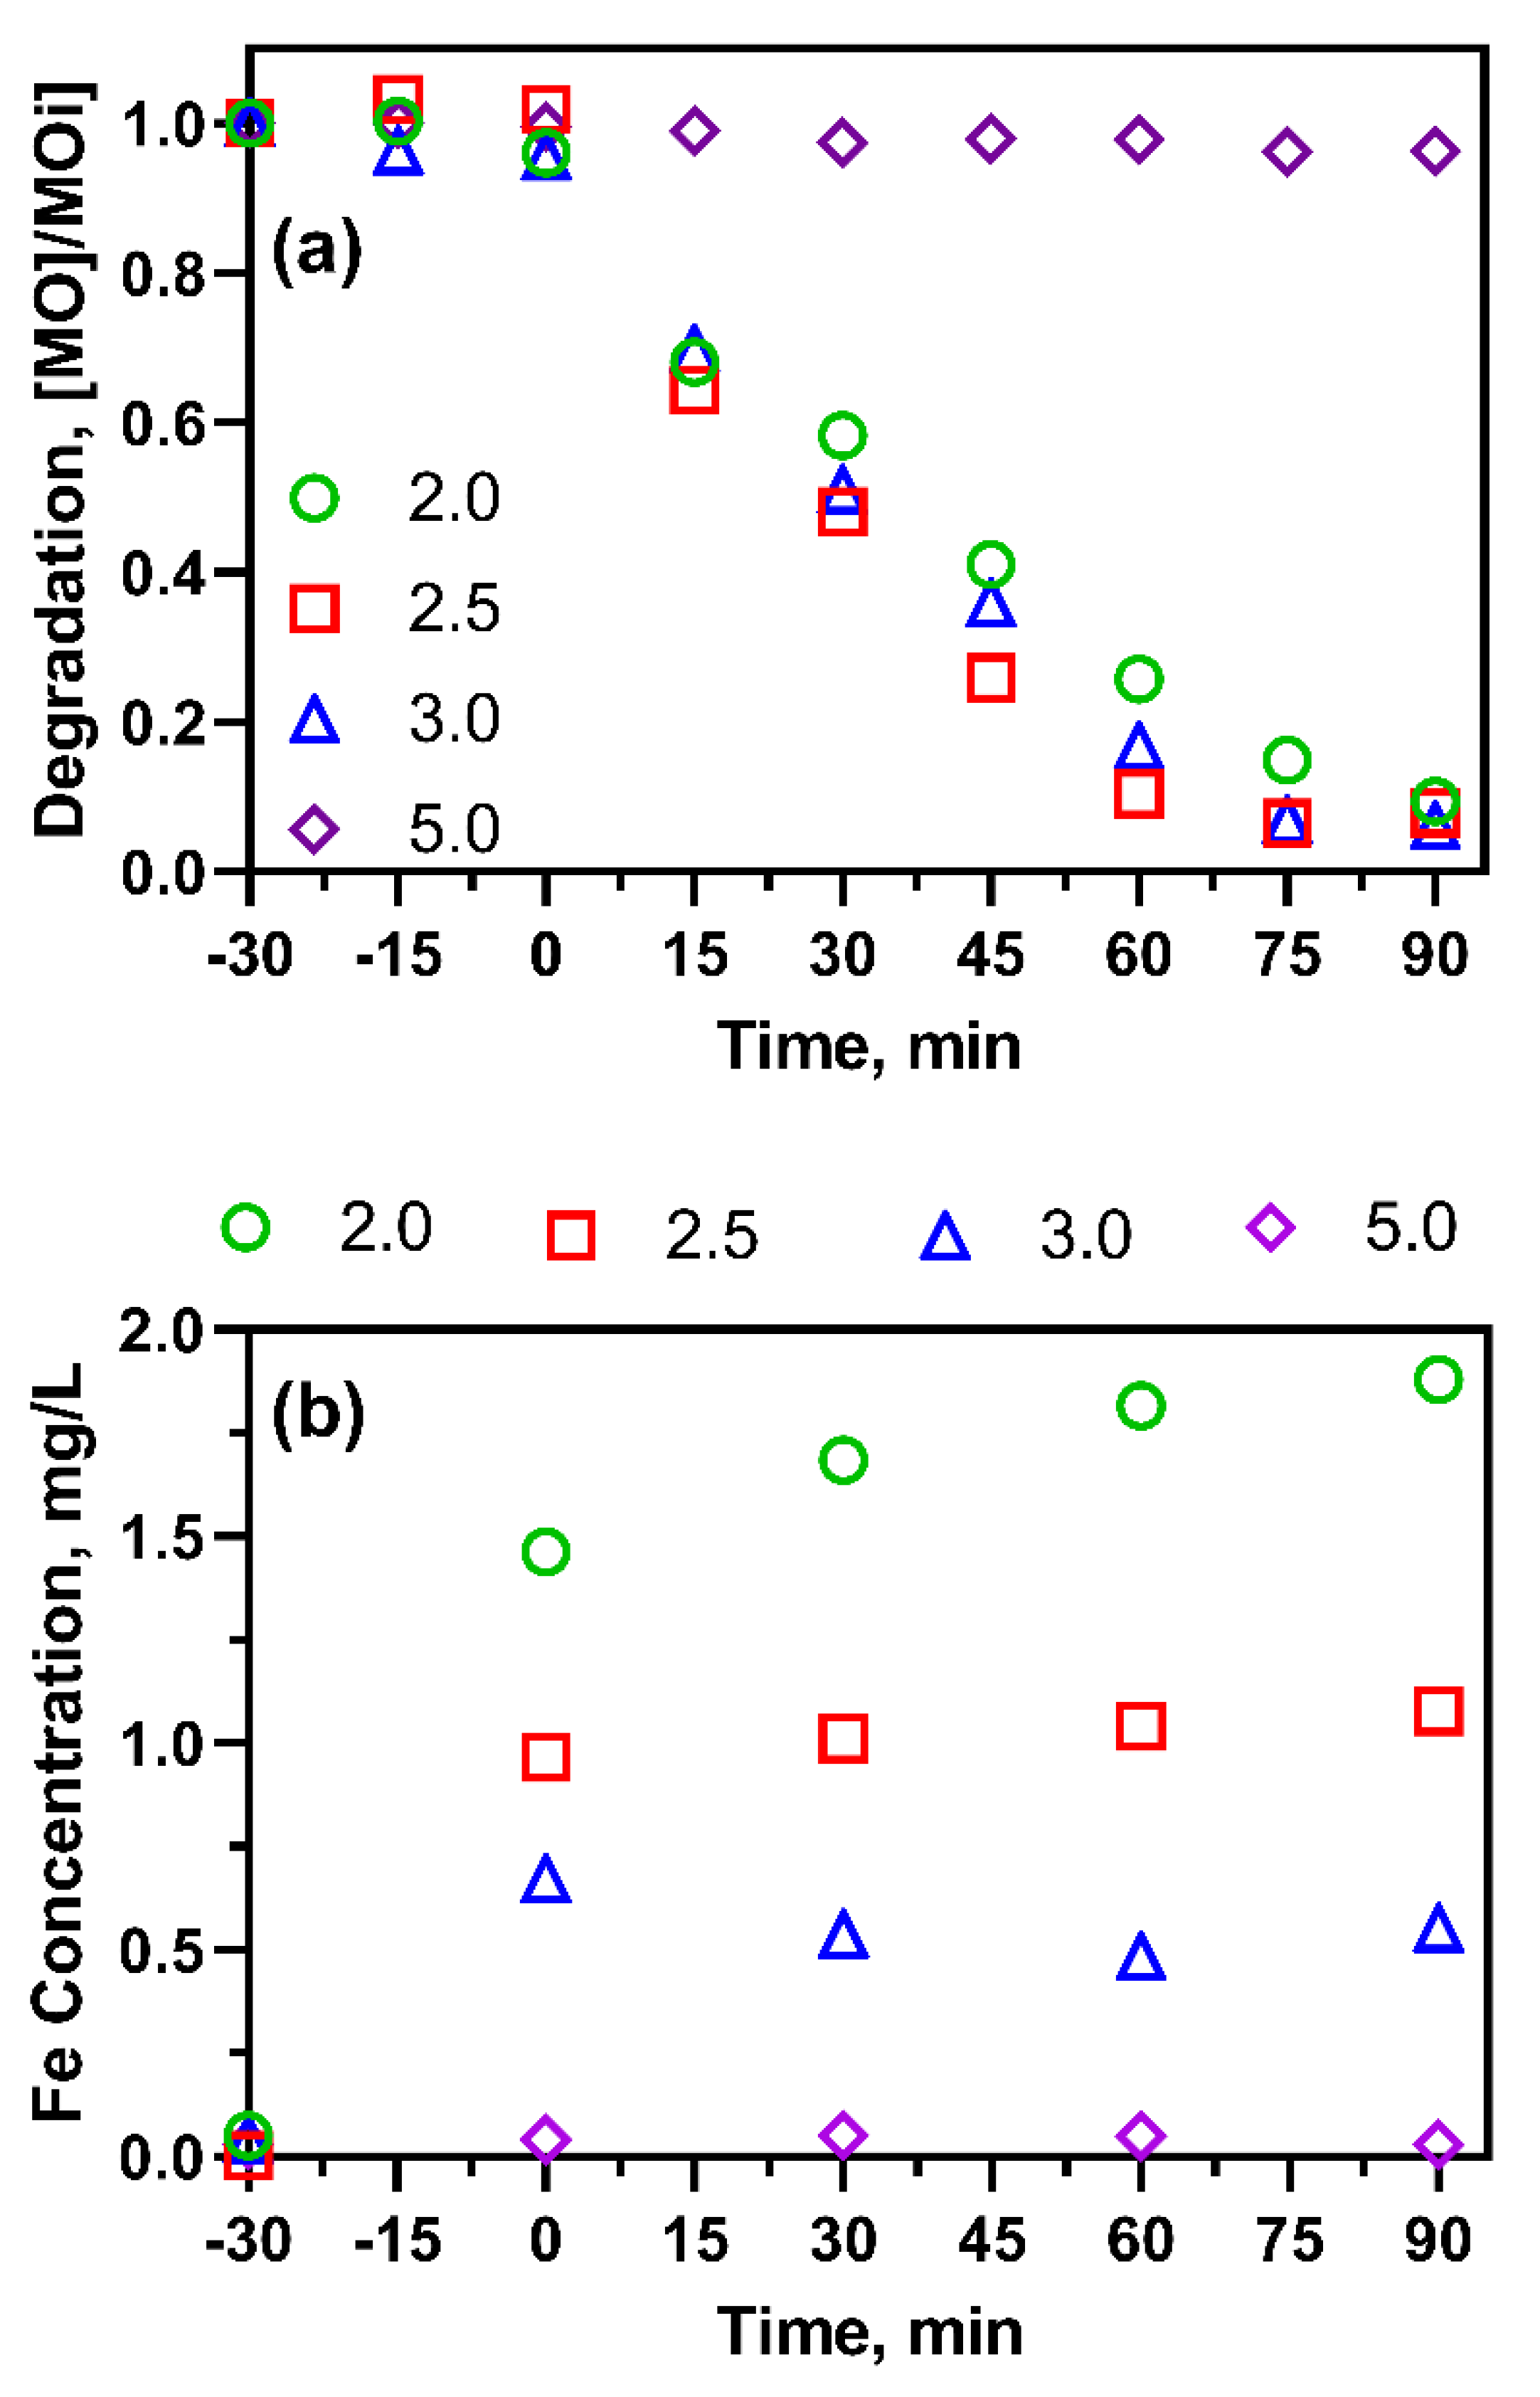
The effect of various process parameters on the decolorization of methyl orange dye over time is presented in Figure 3. The time −30 to 0 min represents the experiment run in the absence of light (in the dark). Minimal decolorization was observed in the presence of ilmenite and H2O2 alone. This is expected since the experiments were conducted at low pH values, which are known to enhance the stability of H2O2 [30]. However, the catalyst and H2O2 (dark) had a combined result in 84% degradation after 120 min. It should be noted that only ilmenite was present in the first 30 min from −30 to 0 min and no degradation was observed. Upon the introduction of H2O2, a noticeable decolorization was recorded. This confirms that the system behaves similarly to the Fenton’s reaction, where a source of iron and H2O2 is required to form the highly reactive hydroxyl (•OH) free radicals.
This is because the addition of UV irradiation creates a second pathway for radical generation, as shown in reactions 1 and 2 [16]:
Fe 2 + +   H 2 O 2     Fe 3 + + OH + OH ( Fenton   reaction )
Fe ( OH ) 2 +   hv   Fe 2 + + OH ( photo - Fenton   reaction )
This second pathway leads to efficient cycling between Fe2+ and Fe3+; here, the Fe3+ generated through the primary Fenton reaction is further reduced by the energy of the photons supplied through irradiation. It has long been observed that iron undergoes this type of cycling when exposed to light, particularly in natural waters with the photo-oxidation of dissolved organic matter [31]. Further research has shown that light is a driving force in the iron redox cycle in aquatic environments where it is able to reduce Fe3+ to Fe2+ by direct interaction with organic ligands or photochemically produced superoxide [15,16,31].
In this study, the effect of various irradiation sources on the rate of degradation was investigated (Figure 3). UVA and visible light irradiation showed comparable degradation rates to the dark experiments; however, UVB irradiation resulted in a faster degradation. This is supported by literature which states that UVB irradiation is the most effective for Fe3+ photoreduction, thus increasing the amount of Fe2+ in the system compared to other irradiation wavelengths [32,33,34]. A study conducted by Eskandarian et al. [35] on the degradation of pharmaceuticals using TiO2 in photocatalysis examined the effect of different wavelengths on degradation efficiency. They found that as the irradiation wavelength increased, photo energy decreased and thus degradation rates also decreased. It is thought that this observation might explain why UVB irradiation had the fastest degradation rate compared to the UVA and visible light wavelengths in the present study. In addition, UVB irradiation has been shown to produce higher concentrations of Fe2+ than UVA irradiation [36].

2.3. Effect of pH

The pH plays a critical role in the classic Fenton’s reaction. Several studies have reported the optimum pH to be in a narrow range between 2 and 3 [14,16]. Figure 4a reports the MO degradation at various pH under UVB irradiation. Complete decolorization was observed after 75 min for the pH levels 2.0 and 2.5, and after 90 min for pH 3.0. Virtually no degradation was recorded at pH 5. Complementary studies to determine whether the pH influences the availability of Fe and ultimately the extent of the reaction were also conducted. These results are presented in Figure 4b. The Fe available in the solution increased with decreasing initial pH. A maximum iron concentration of 1.88 mg/L for pH 2 and 0.55 mg/L for pH 3 was determined after 120 min of contact time. It is noteworthy that at pH 5, no iron leached was detected. This suggests that the degradation reaction proceeded as a homogeneous Fenton-type reaction rather than a heterogeneous reaction [33] since Fe had to leach from the catalyst before the degradation process. Several studies have reported that homogeneous Fenton-type reactions are associated with the sludge formation and deactivation of the solid catalysts since continuous leaching results in the destruction of the catalyst [15,37]. However, in this study, no noticeable change in the crystal structure was observed after the reaction (Figure 1).
Optimum degradation occurred at pH 2.5; this was attributed to the combined behavior of Fe and H2O2 at different pH values. At pH values above 3, the reduced iron (Fe2+) can potentially re-oxidize and precipitate, resulting in decreased •OH generation [38,39]. Additionally, it has been reported that when the solution pH is below 2.5, the scavenging effect of the •OH radicals increases due to the excess H+ ions generated [19]. García-Muñoz et al. [40] showed that the use of ilmenite in the CWPO process could work efficiently at a circumneutral pH; this was attributed to the high percentage of rutile in the ilmenite sample. The authors suggest that different mechanisms drive H2O2 decomposition at different pH levels. They posit that under a circumneutral pH, decomposition is mainly driven by the generation of electron/hole pairs that can be attributed to the TiO2 content. In this study, it is unlikely that this mechanism was dominant given the low quantities of TiO2 present in the catalyst (Table 2).
The iron Pourbaix diagram reveals that speciation strongly depends on solution pH [38,39]. At pH values below 9, Fe2+ is the dominant species, while below pH 4, Fe3+ dominates. The presence of both Fe species is needed for the cycling of iron in the system, which increases the efficacy of the reaction. Therefore, the pH and irradiation source play a large role in the efficient cycling of iron in the photo-Fenton system [16].
The main reaction mechanism was therefore postulated to be similar to the classic Fenton reagent [41]. Firstly, Fe2+ enters the solution as a result of dissolution from the catalyst surface at low pH. Thereafter, the dissolved Fe ions react with H2O2 to produce Fe3+, OH, and a •OH radical according to reaction 3.
Fe 2 + ( aq ) + H 2 O 2 ( aq ) Fe 3 + ( aq ) + OH ( aq ) + OH ( aq )
The generated •OH radical reacts with the methyl orange compound, breaking down the azo dye bonds and likely producing short-chain organic acids, some of which will be mineralized to CO2 and water as they are exposed to more hydroxyl free radicals (reaction 4).
C 14 H 14 N 3 NaS ( aq ) + OH   ( aq ) ( Short   Chain   Organic   Acids ) + H 2 O + CO 2
The generated Fe3+ in solution is reduced by the OH to generate more Fe2+ and another •OH radical according to reaction 5 below.
Fe 3 + ( aq ) + OH ( aq )   Fe 2 + ( aq ) + OH ( aq )
The proposed reaction and Fe cycling will continue until the depletion of H2O2 in the system. The free radicals react with the organic molecules present through three main mechanisms, namely demethylation, methylation, and hydroxylation [42,43].
Although some iron leaching does occur, it is evident from the XRD analysis (Figure 1) that negligible changes in mineral composition occur to the catalyst. Therefore, it is proposed that the reaction begins on the surface and continues in the solution once enough iron has leached. However, it is also noted through the iron leaching data that minimal quantities of iron are present in the solution. The reaction mechanism is more comparable to the classical homogeneous Fenton’s reaction rather than the heterogeneous reaction [36].

2.4. Effect of Catalyst Loading

The effect of catalyst loading on the MO degradation efficiency was investigated and it was established that degradation increased with increasing catalyst loading (Figure 5a). Optimum degradation occurred at a loading of 2000 mg/L; beyond this loading, no appreciable increase was observed. Figure 5b indicates that the amount of iron leached into the solution increased with an increase in catalyst loading. Dissolved iron concentrations of 0.85 and 3.0 mg/L were recorded after 30 min of contact time for 500 and 2500 mg/L catalyst loadings, respectively. This observation was attributed to the simple increase in the amount of iron. However, an analysis of the ratio of leached iron compared to the theoretical iron available in the catalyst had an inverse relationship, where 0.49% iron was leached from 500 mg/L catalyst loading compared to 0.35% for the 2500 mg/L loading. Interestingly, the 2000 mg/L loading, which presented the fastest degradation rate, had 2.5 mg/L Fe in the solution, which corresponds to 0.36%. This implies that a higher concentration of Fe2+ leached into the solution does not necessarily promote the degradation reaction; rather, it was postulated that there is a maximum level of Fe2+ in the solution that can react with H2O2 to generate •OH radicals.
Figure 5 shows that while it took 90 min to achieve a maximum degradation from the onset of the run, maximum iron leaching occurred in the first 30 min, after which the concentration remained constant. Further tests with shorter sampling times were conducted to determine the Fe leaching kinetics (Figure 5c). The kinetics were best described by the pseudo-second order (PSO) model, which had an R2 value of 0.992 and a rate constant of 0.264 g.mg−1min−1 compared to the R2 of 0.979 and rate constant of 0.78 min−1 for the pseudo-first order (PFO) model. The 95% prediction intervals are also presented in the shaded area. A narrower band observed in the PSO model signifies better probability for future observations and it can confidently be used for further work.

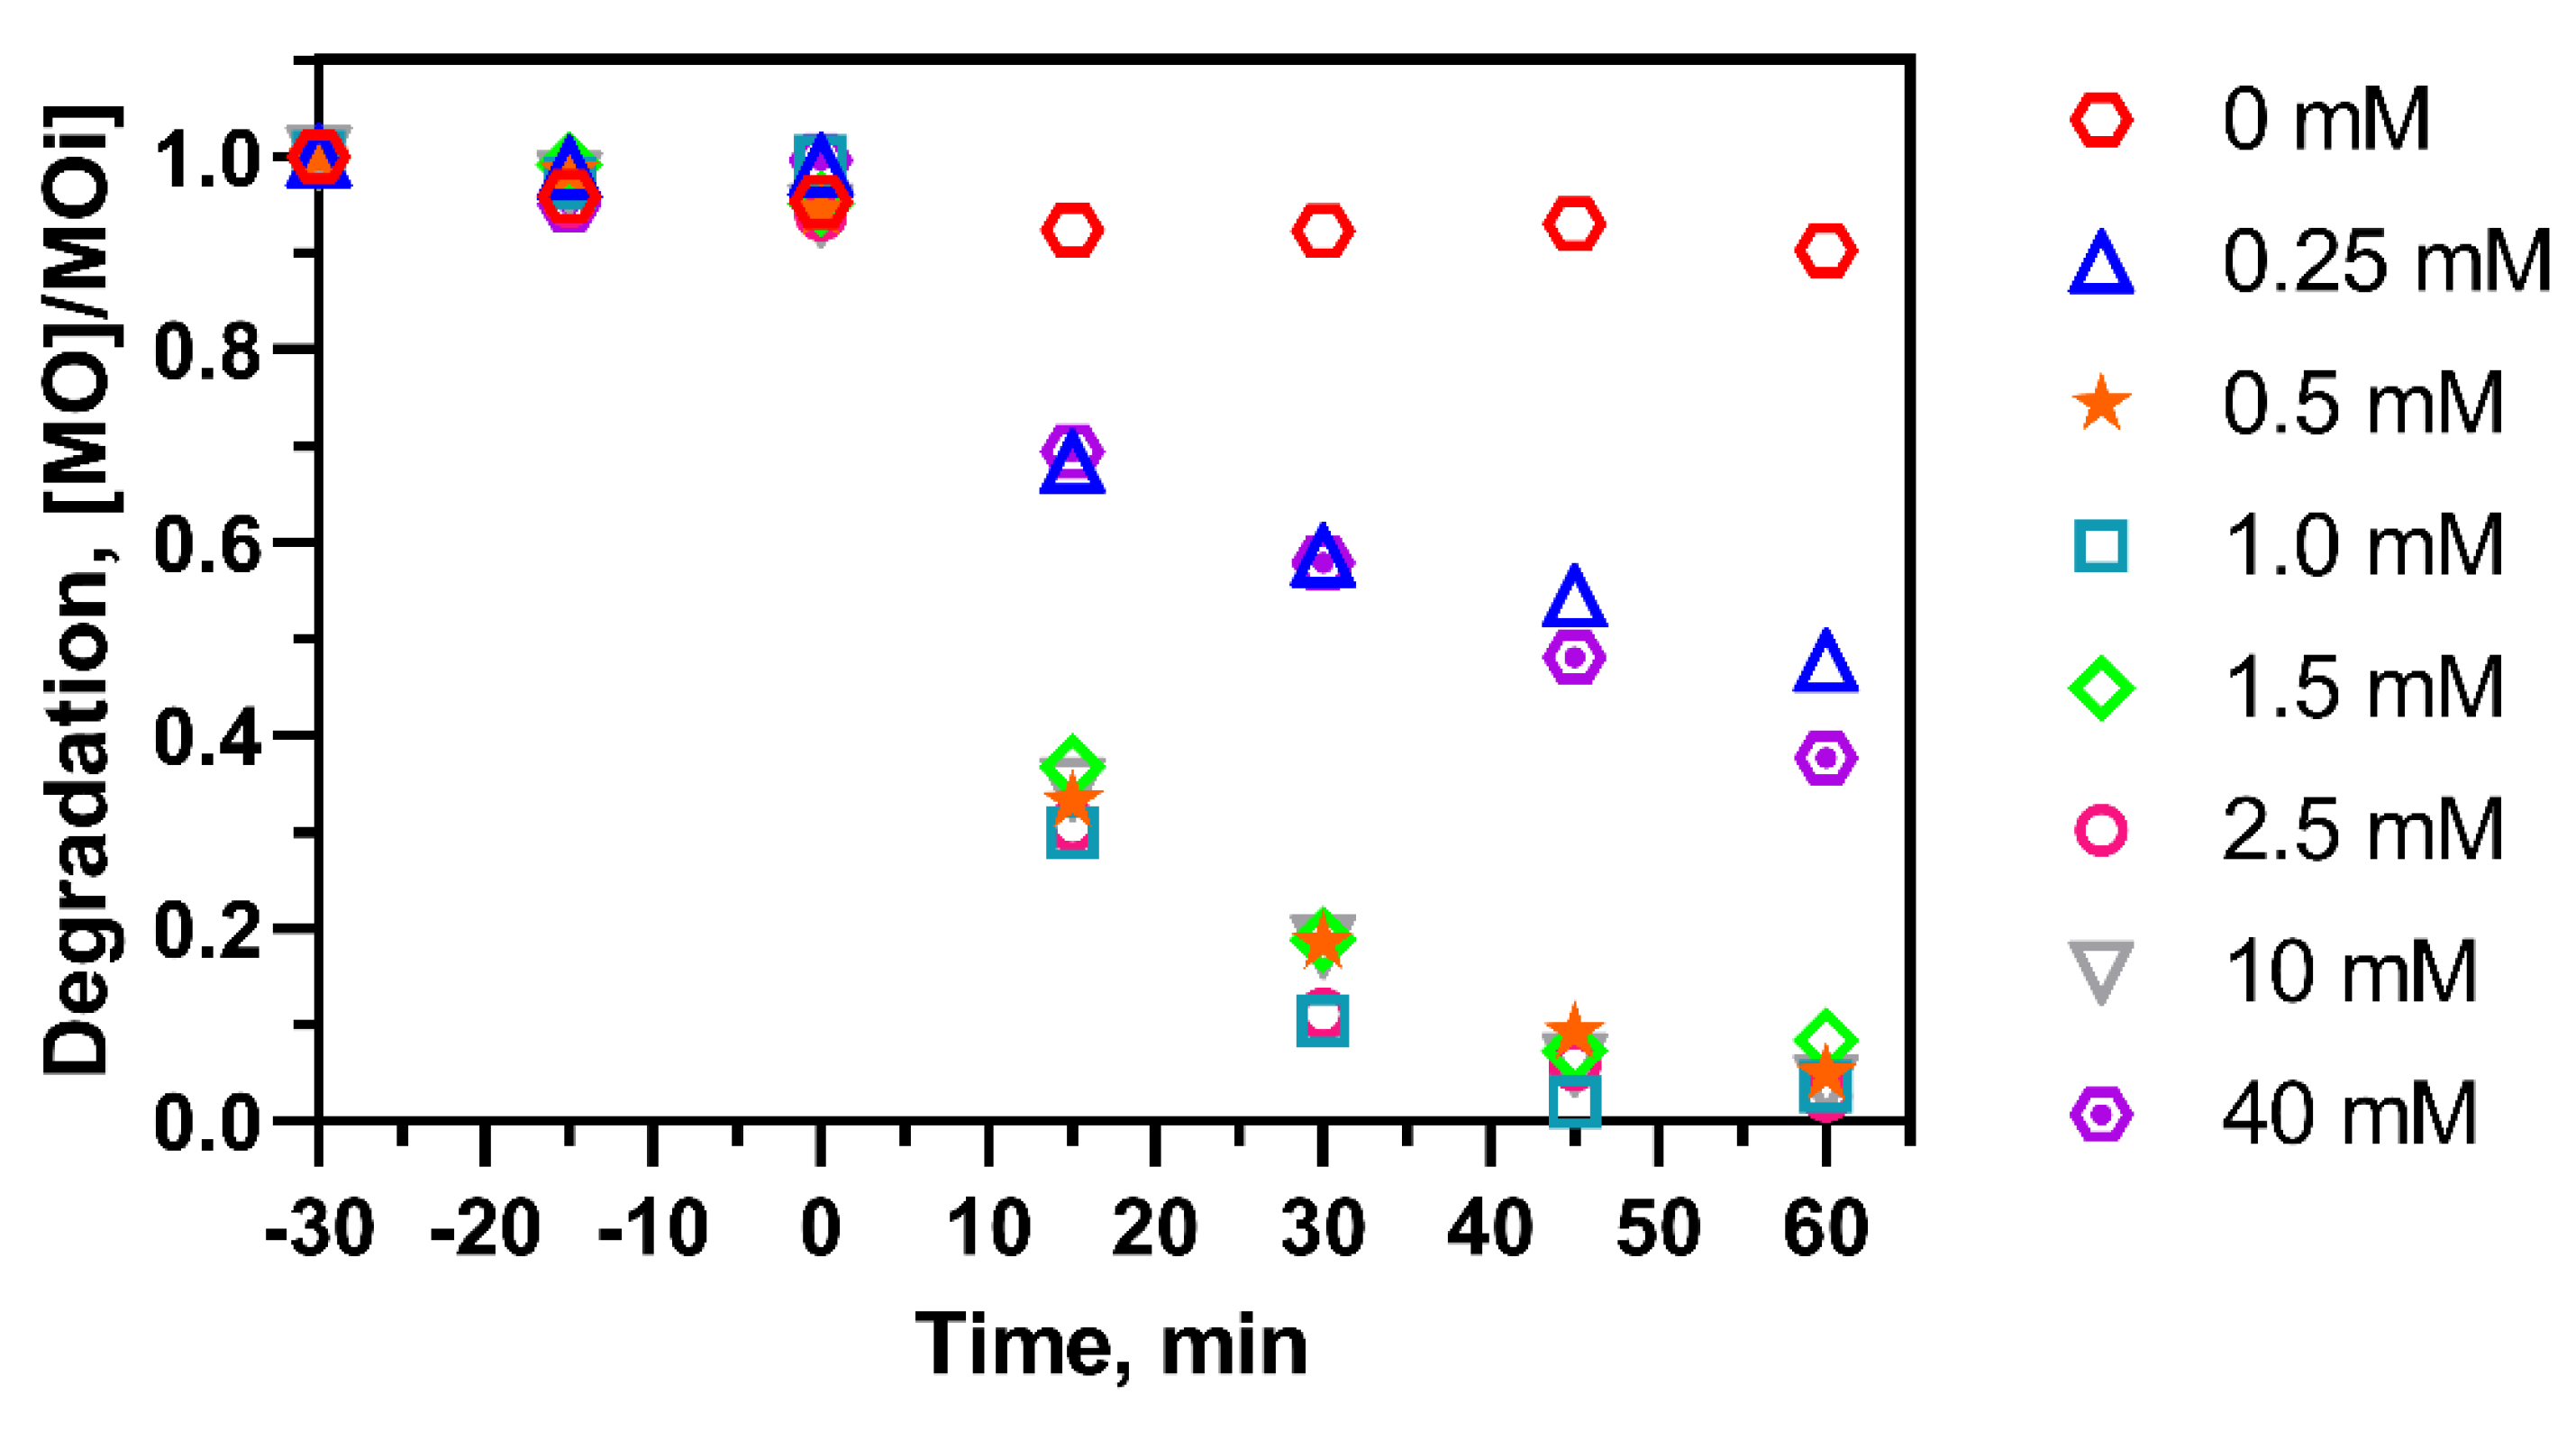
2.5. Effect of H2O2 Concentration

Hydrogen peroxide is an important reagent in the Fenton’s reaction as it provides the reactive •OH free radicals responsible for initiating the degradation reaction. The effect of H2O2 concentrations on the degradation of methyl orange is shown in Figure 6. The complete mineralization of MO occurs according to reaction 6. Based on this reaction, the 10 mg/L MO concentration used in Figure 6 required 1.31 mM of H2O2 at the stoichiometric ratio.
C 14 H 14 N 3 O 3 SNa + 43 H 2 O 2 14 CO 2 + 3 HNO 3 +   NaHSO 4 + 48 H 2 O
Therefore, the concentrations of 0.25, 0.5, and 1 mM in Figure 6 were below the stoichiometric amount required for complete breakdown of MO. Nevertheless, for the last two concentrations, complete decolorization of the MO was achieved. It should be noted that the amount of H2O2 required for the decolorization of MO with intermediate formation is lower than the stoichiometric amount required for the complete breakdown of the primary MO structure. When the stoichiometric amount was exceeded, i.e., at 1.5, 2.5, and even 10 mM, complete decolorization was also achieved. However, when the amount of H2O2 was too high, at 40 mM, i.e., about 30 times the stoichiometric amount, the catalytic activity dropped and only 60% of the MO was decolorized.
Excess H2O2 can lead to an increase in the scavenging effect by H2O2 on •OH radicals, which can inhibit the reaction by producing weaker oxidizing radicals [19]. The scavenging effect of excess H2O2 is summarized in reaction 7 [44].
H 2 O 2 + OH   H 2 O + O 2 H
The resulting hydroperoxyl radical (•O2H) has a lower redox potential (1.7 V) than the hydroxyl radical (•OH) which has a redox potential of 2.7 V [45,46]. Therefore, these radicals have a lower oxidizing capacity and thus can decrease the rate of degradation [46].

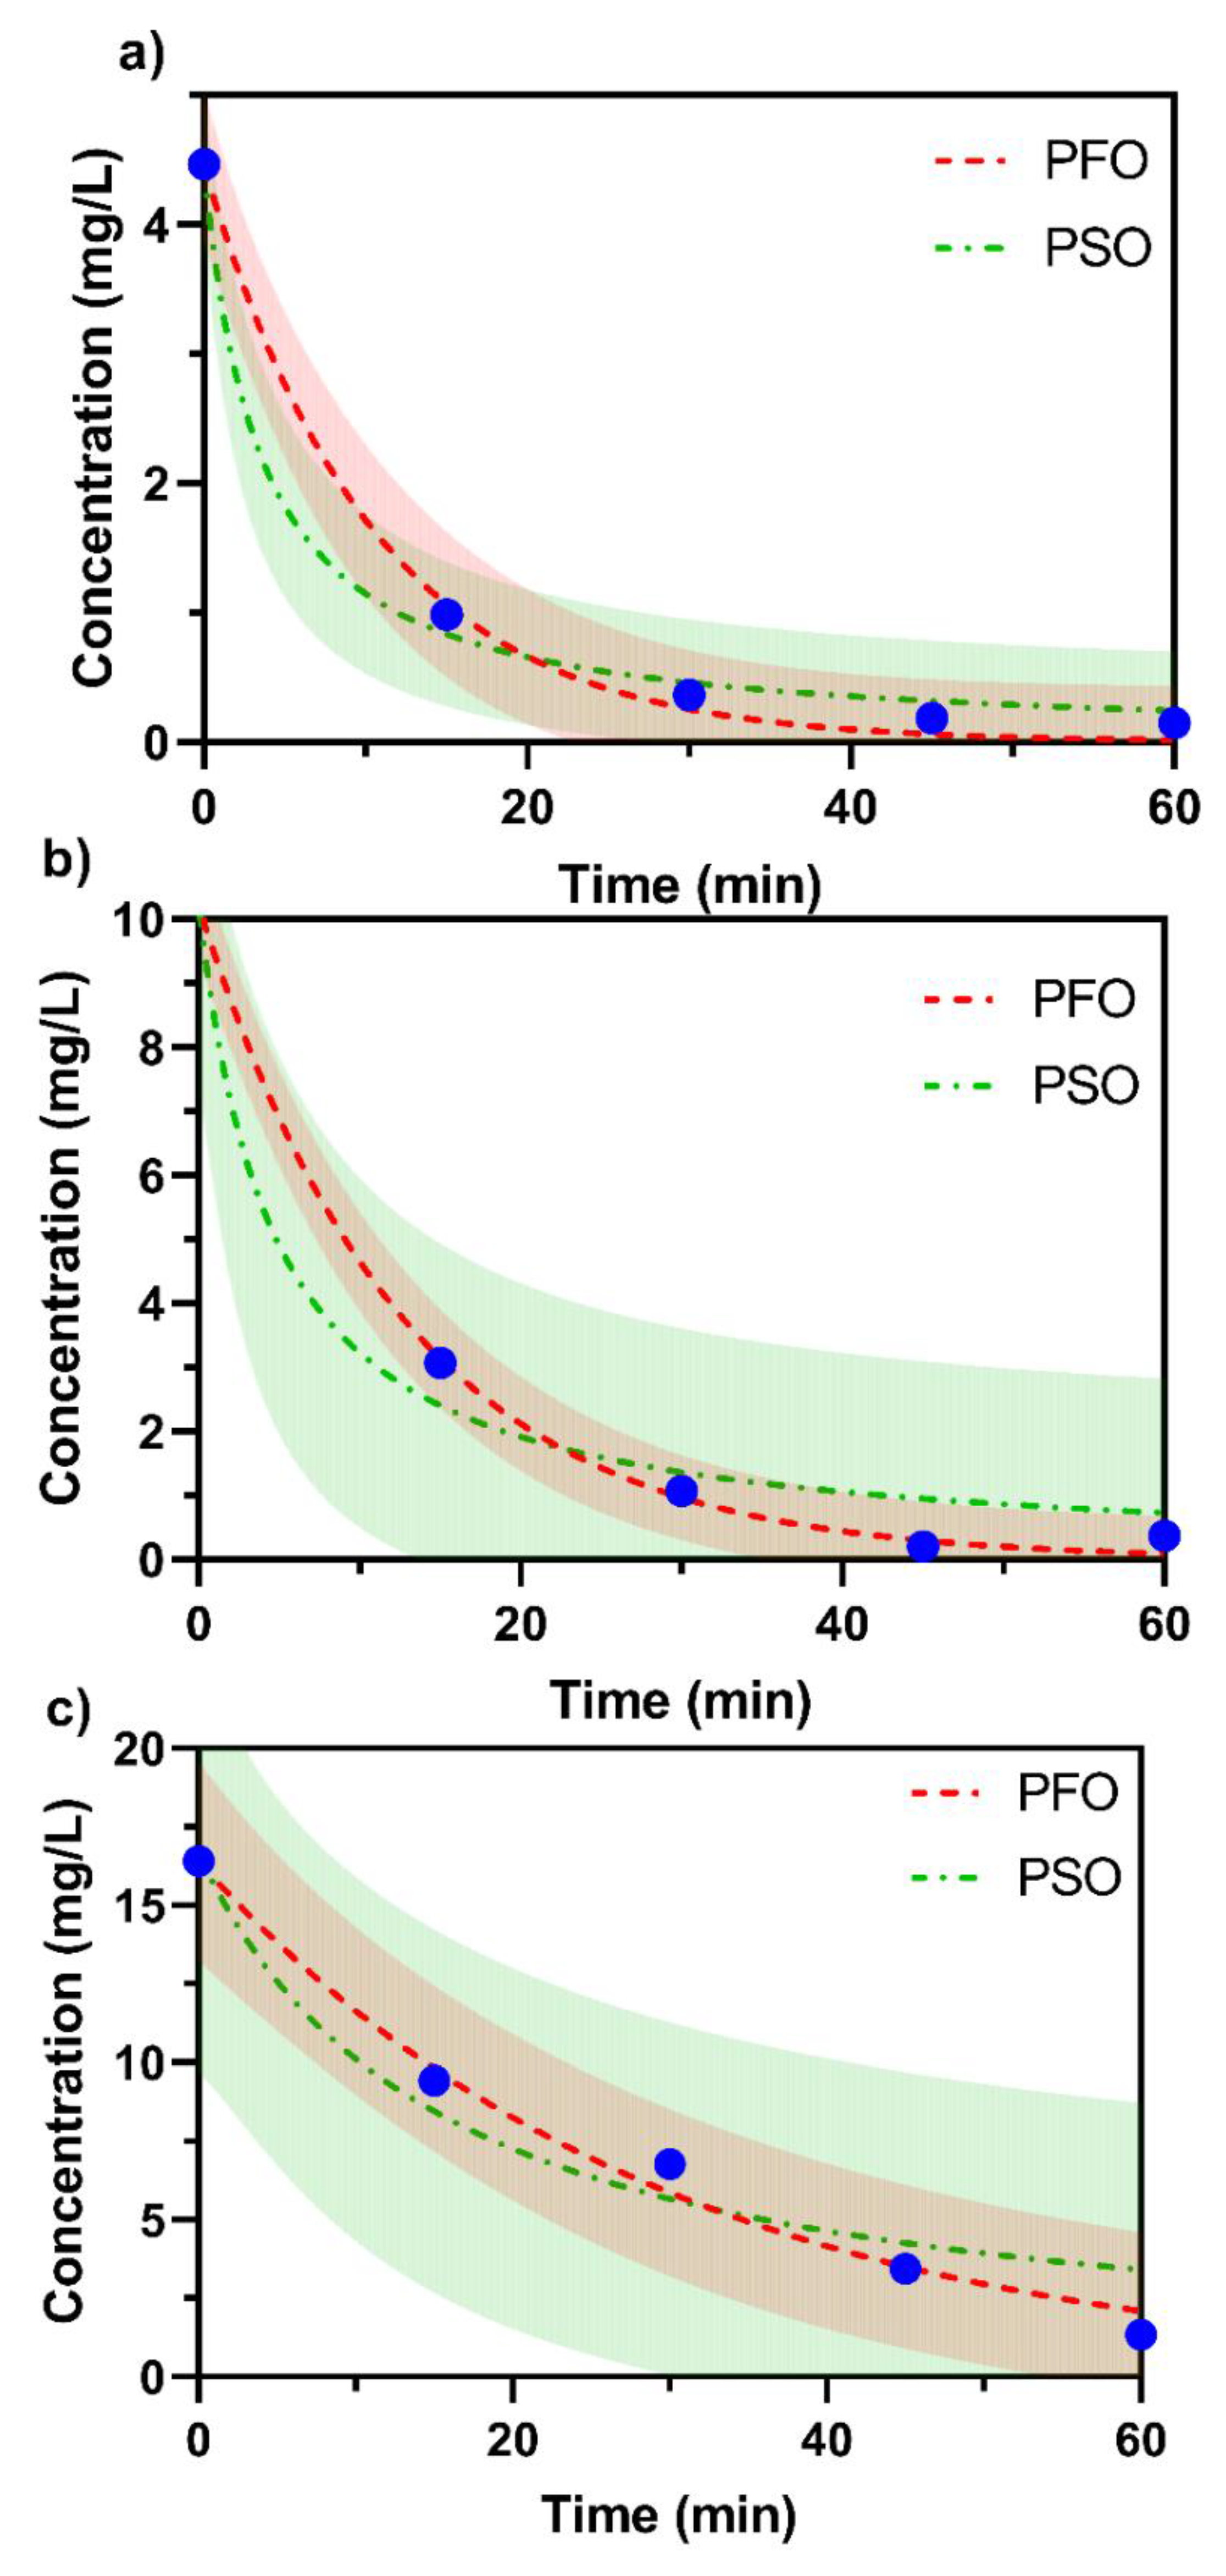
2.6. Effect of Initial MO Concentration
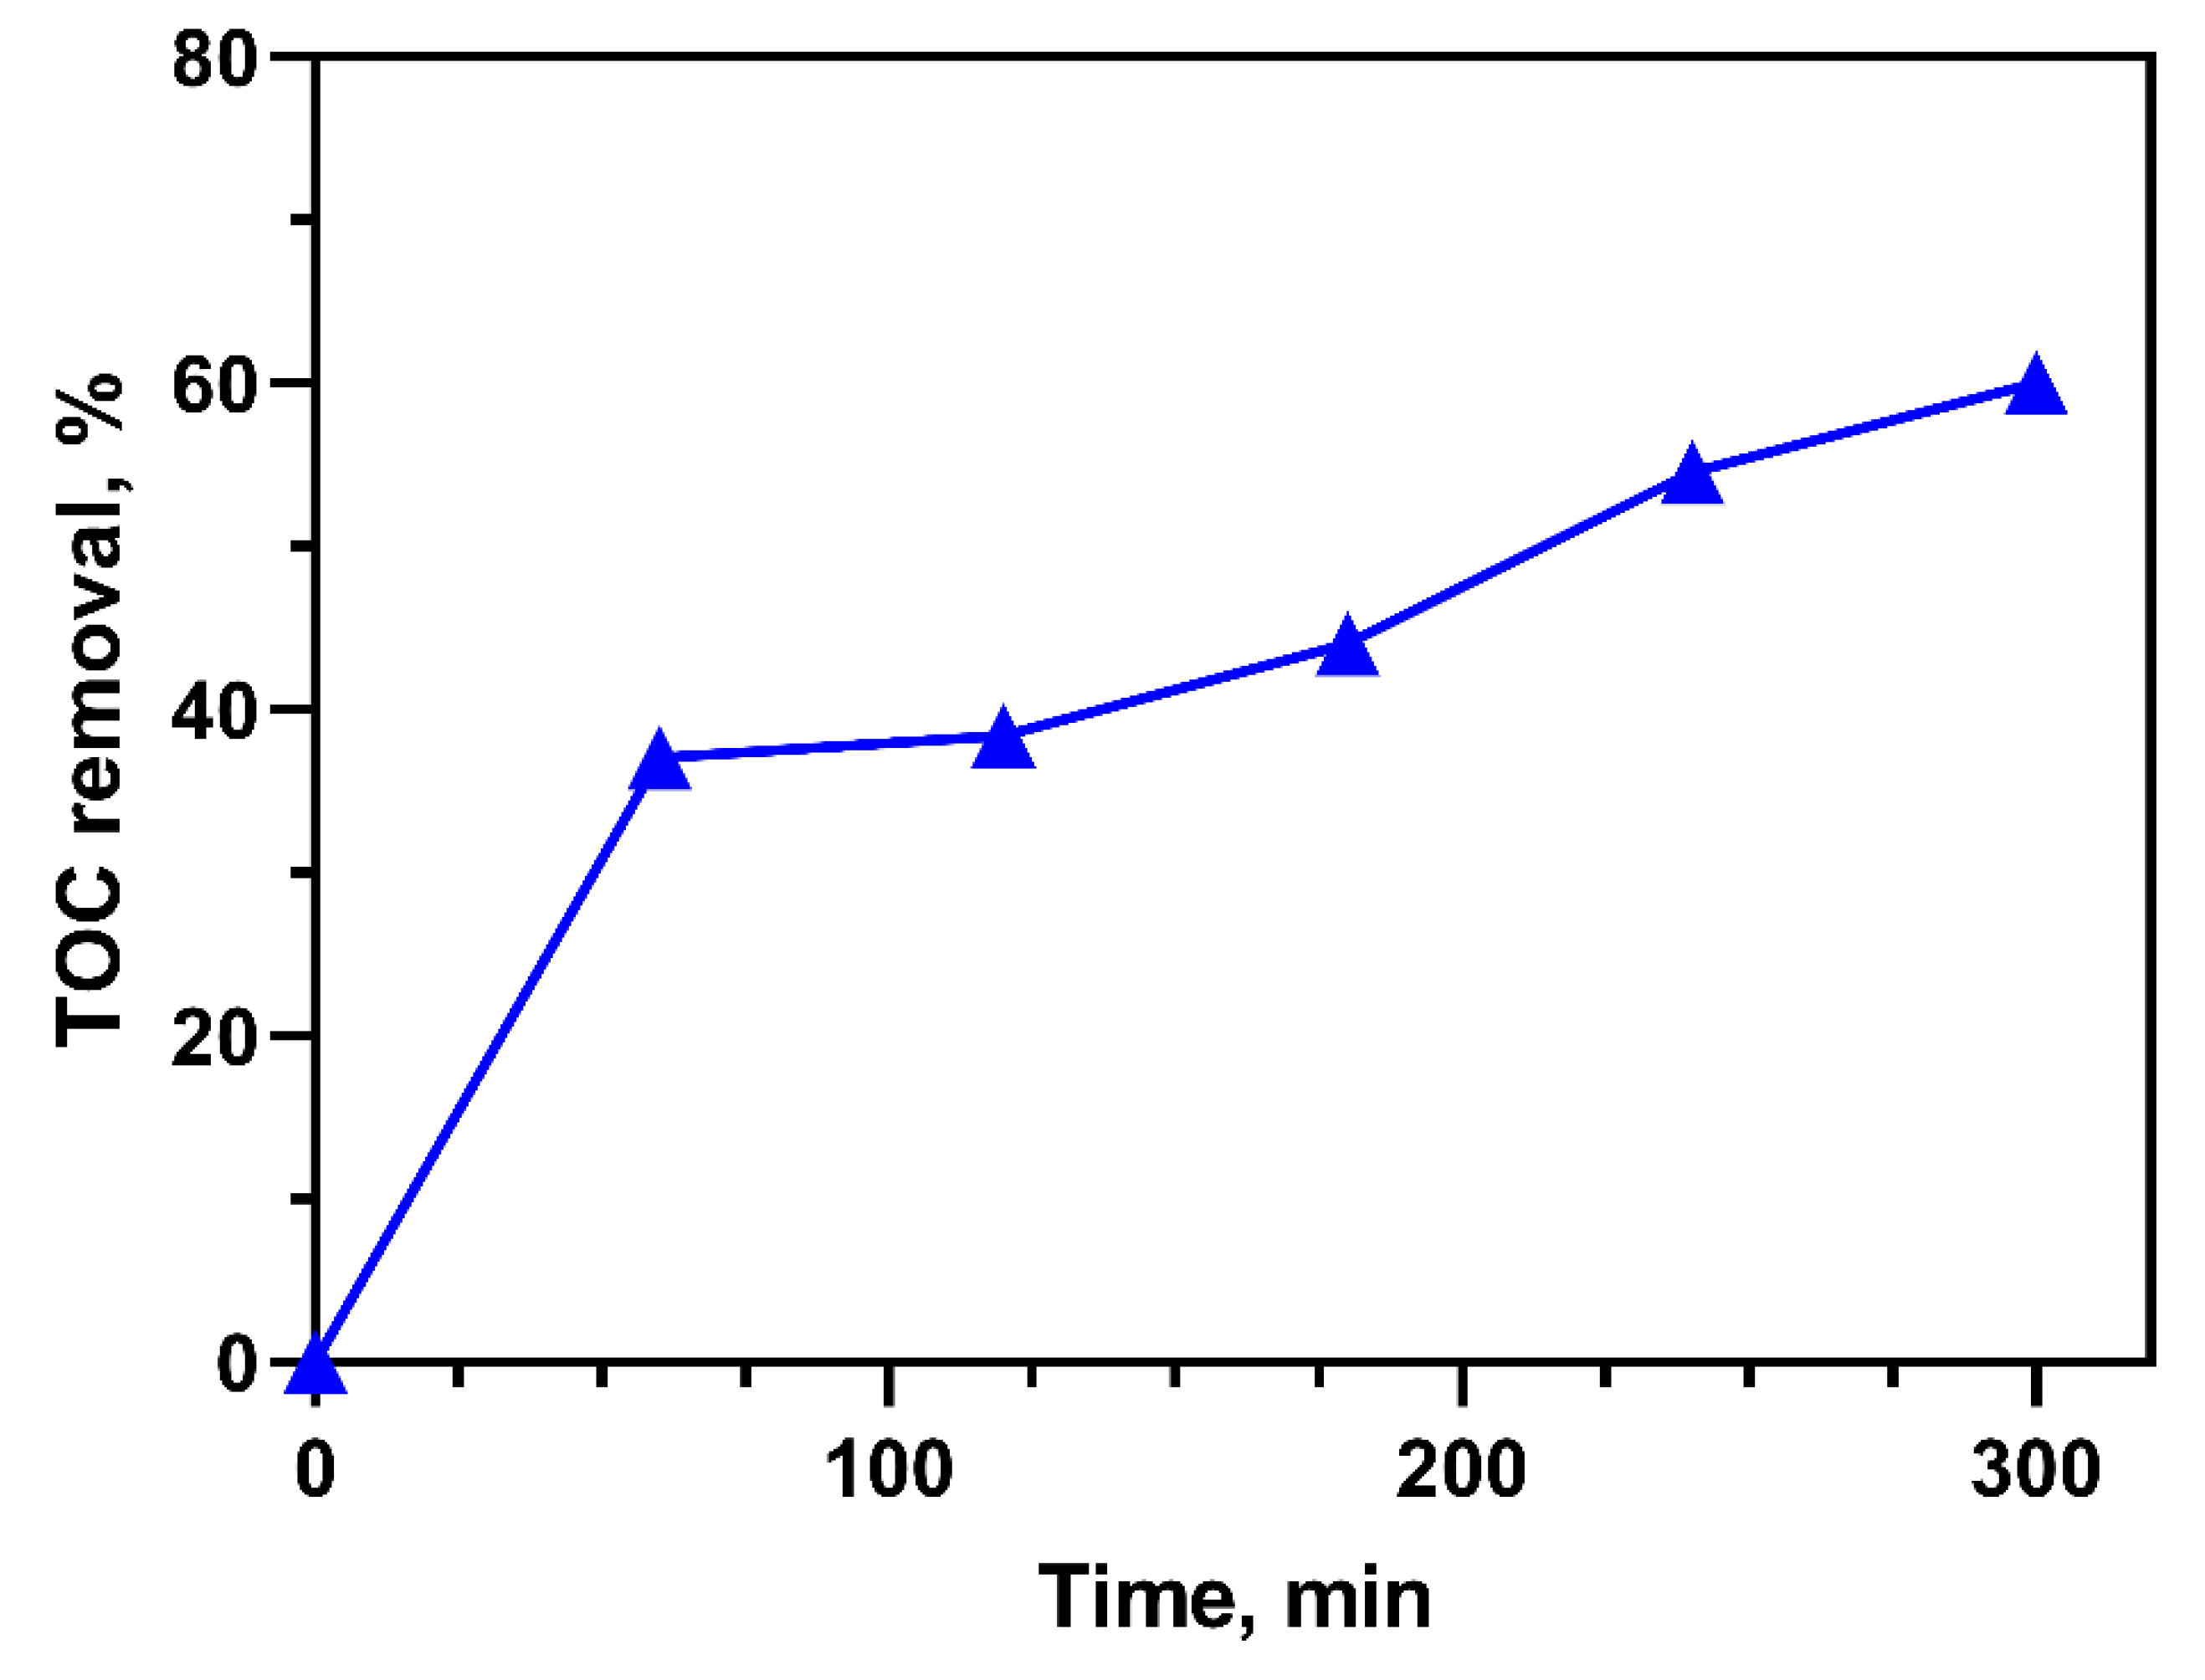
The rate of methyl orange degradation was shown to be directly dependent on the initial concentration (Figure 7). A two-fold increase in the MO concentration from 5 to 10 mg/L did not show an appreciable change in the degradation rate; however, doubling the concentration to 20 mg/L slowed down the reaction significantly. This observation is most likely due to a variation in the pollutant to H2O2 stoichiometric ratio; at higher pollutant concentrations, the system became H2O2-deficient. In the present study, the initial concentration of the H2O2 was kept constant, resulting in MO to H2O2 ratios of 67, 33, and 16 for the 5, 10, and 20 mg/L amounts, respectively. Surprisingly, even though the rate of decolorization of the 20 mg/L MO solution was slow, near-complete degradation was still achieved after 60 min. Other studies reported that the initial pollutant concentration did not affect the efficiency of the system when a stoichiometric amount of H2O2 was added in accordance with the initial organic load [18].
In order to further analyze the degradation kinetics at various initial MO concentrations, the experimental data were fit to several commonly used kinetic models. It is widely acknowledged that the Fenton’s reaction mechanism is complex as it consists of numerous parallel and serial reactions involving different molecular and radical species [47]. Due to this complexity, performing a detailed kinetic analysis is challenging even for the model wastewaters, where most of the organic compounds present in the reaction mixture are known. Therefore, the data was fit to the pseudo-first order (PFO) and pseudo-second order (PSO) kinetic models. The analytical form of the equations is shown in Equations (8) and (9), respectively.
C = C 0   e k t
C =   C 0 1 + k C 0 t
The fits for the two models at varying concentrations are shown graphically in Figure 8. The shaded areas in the figure show the 95% prediction bands for the respective fits. These bands represent the areas with a 95% probability of future observations [48]. Table 2 summarizes the non-linear kinetic parameter fits for the models. Relatively good fits were obtained for the PFO model, with R2 values of 0.996 and 0.9886 for the initial concentration 5 and 20 mg/L, respectively, while the PSO model had R2 values of 0.9957 and 0.9476 for the same initial concentrations. However, the 95% prediction bands for both models showed a large uncertainty in the location of future observations. For example, the PFO model fit for the 10 mg/L experiments predicted a range of 9.6 to 10.8 mg/L for the initial concentration; this was narrower than the 8.2 to 12.3 mg/L range predicted by the PSO model. The uncertainty of the future observations increased even further for the 20 mg/L runs. These extremely large uncertainties makes the application of these kinetic models extremely risky. For the present study, it can generally be concluded that the PFO model best fits the data. However, it is worth noting that the degradation kinetics of methyl orange using various AOPs have resulted in conflicting results, with some authors identifying the reaction as first order [49] and others as second order [50].

2.7. TOC Removal

Near-complete degradation was observed for solutions of the MO concentrations in the range of 5–20 mg/L. However, the extent of the mineralization was not as high, with 37% TOC removal recorded after 60 min (Figure 9) for a 10 mg/L MO aqueous solution. Fenton-type reactions are renowned for their ability to significantly reduce the total organic carbon (TOC) in both simulated water and environmental samples [19]. However, it is acknowledged that the extent of mineralization is largely dependent on the chemical structure of the target compounds, among other factors [51]. Complex aromatic compounds such as MO are less likely to be directly converted into CO2 and H2O. Rather they undergo an intricate degradation mechanism, resulting in the formation of an assortment of intermediate organic compounds [52]. It was therefore postulated that similar degradation pathways with intermediate formations occurred in the present investigation.
In this study, it was hypothesized that the TOC removal was H2O2-limited since excess catalyst loadings did not lead to an increase in the rate of reaction. However, the effect of H2O2 concentration studies revealed that excess amounts negatively affected the reaction due to possible scavenging effects. Taking this into consideration, cyclic tests, which involved adding a fresh dose of 1.0 mM of H2O2 into the reactor at 60 min intervals, were conducted with the aim of improving the TOC removal efficiency. Some studies have shown that a stepwise addition of H2O2 improves the efficiency of the Fenton process [53]. Figure 9 shows the evolution of TOC after five cycles. Forty percent of the TOC remained, implying 60% mineralization.

3. Materials and Methods

3.1. Materials

Pre-milled (<54 μm) ilmenite was supplied by AMIS Matrix Reference Materials (AMIS 0454). The ilmenite was sourced from the Tronox Namakwa Sands Mine at Brand-se-Baai in the Northern Cape province of South Africa. Methyl orange powder (85%), sulphuric acid (H2SO4; 98%), and H2O2 (30%) were all purchased from Sigma Aldrich (St. Louis, MO, USA). All materials were used as received without further processing apart from H2SO4 which was diluted with ultrapure (de-ionized) water before use. De-ionized water from a Purelab Flex 3 was used in the mixing of all solutions. Three different tubular lamps with different wavelengths were used as sources of irradiation. Table 3 shows the model and corresponding wavelengths of the lamps used.

3.2. Catalyst Characterization

The catalyst was characterized to elucidate its morphology, mineralogy, elemental composition, and BET surface area. A Zeiss Ultra Plus field emission scanning electron microscope (FE-SEM) was used to capture the SEM/EDS images. XRD spectra were determined using a PANalytical X’Pert Pro powder diffractometer in θ-θ configuration fitted with an X’Celerator detector and variable divergence with Fe-filtered Co-Kα radiation (λ = 1.789 Å)-fixed slits. The mineral phases present were confirmed using X’Pert Highscore plus software, which indexed the spectra against the ICSD database. The weight fractions of the various phases were estimated using the Rietveld method. The elemental composition of the catalyst was examined using the Thermo Fisher ARL Perform’X Sequential XRF instrument with Uniquant software. Only elements found above the detection limits were reported. A Micrometrics Tristar 3000 BET analyzer was used to determine the BET surface area. All samples were degassed for 24 h at 150 °C under a 105 Torr vacuum before analysis.

3.3. Methods

All degradation experiments were conducted in a closed container lined with reflective material in a temperature-controlled environment (20 °C). Two magnetic stirrers were placed in the container with a tubular lighting fixture placed directly above the stirrers. In addition, 0.8 L beakers served as reactors; for every experiment, 400 mL of methyl orange dye (MO) solution was used. The pH was adjusted to the desired value using a few drops of concentrated H2SO4; thereafter, the required amount of the catalyst was added. The MO-catalyst suspension was left to equilibrate in the dark for 30 min before switching on the light source and adding H2O2. Several aliquots were taken at predetermined intervals, centrifuged, filtered, and analyzed using a WPA-Lightwave II UV-vis spectrophotometer.
A set of control experiments were conducted to establish the effect of the presence of the catalyst, namely H2O2 or light alone on the degradation of MO. The following initial conditions were used: (MO) = 10 mg/L, (ilmenite) = 1 g/L, (H2O2) = 2.5 mM, pH = 3, and irradiation = UVB.
The subsequent parameter optimization experiments were conducted following a procedure similar to the one described for the control experiments. However, alterations were made to the parameter being optimized. The initial conditions were used in all experiments unless the optimal condition was determined, in which case the optimal condition was used. The effect of pH was investigated at pH values of 2, 2.5, 3, and 5. This was tested in conjunction with four irradiation conditions (dark, UVA, UVB, and visible). Thereafter, the effect of the catalyst loading was tested in a range of 0 mg/L to 2500 mg/L, followed by the optimization of the effect of the H2O2 concentration ranging from 0.0 mM to 40.0 mM. Once the optimal conditions were determined, methyl orange concentrations were varied to examine the effect of the initial concentration (5, 10, and 20 mg/L).
In order to establish the dominant reaction mechanism, the concentration of iron in solution was determined at varying pH and catalyst loadings. The iron concentration was determined using a spectro genesis inductively coupled plasma optical emission spectrometry (ICP-OES). An additional 24 h leaching tests at pH 2.5 were conducted in order to determine the stability of the catalyst. XRD analysis was conducted on the recovered solid residue.
The degree of the mineralization of the MO was investigated using a Shimadzu TOC-V wp Total Organic Carbon (TOC) analyzer. Samples were analyzed before reaction and after selected periods thereafter. The extent of the MO degradation and possible formation of organic intermediate products was analyzed using a Nexera LC-40 System coupled to an LCMS-9030 Q-TOF operated in the negative ESI mode. Chromatographic separation was performed using a gradient of the mobile phase (A), water containing 0.1% (v/v) formic acid, and (B) acetonitrile.

4. Conclusions

Naturally occurring South African ilmenite sands were found to be an effective iron-bearing catalyst in the chemical wet peroxide oxidation of methyl orange dye in simulated wastewater. Complete decolorization of MO was observed, leading to unidentified intermediate products. The reaction was highly dependent on the initial pH of the solution, which in turn influenced the extent of iron leaching. Decolorization occurred via the homogeneous Fenton’s reaction mechanism, although less leached iron was required. UVB irradiation improved the rate of reaction by aiding the cycling of Fe (II) and Fe (III) in the aqueous phase. The concentration of H2O2 was found to play a pivotal role in both the decolorization of MO and subsequent mineralization of the intermediate products formed.

Supplementary Materials

The following are available online at https://www.mdpi.com/article/10.3390/catal11121452/s1. Figure S1: SEM-EDS Micrographs of three different sites (a, b and c) of the catalyst sample using EDS to determine the elemental composition.

Author Contributions

Conceptualization, A.L.B. and S.M.T.; methodology, A.L.B. and S.M.T.; investigation, A.L.B.; resources, S.M.T.; data curation, A.L.B., J.K.M. and S.M.T.; writing—original draft preparation, A.L.B.; writing—review and editing, A.L.B., J.K.M. and S.M.T.; supervision, S.M.T.; funding acquisition, S.M.T. All authors have read and agreed to the published version of the manuscript.

Funding

This research study was funded by the National Research Foundation (NRF) of South Africa, grant number TTK18024324064, awarded to Shepherd M. Tichapondwa of the University of Pretoria.

Data Availability Statement

Not applicable.

Acknowledgments

The authors would like to thank AMIS Matrix Reference Materials for supplying the ilmenite samples used in this study. They also thank Charl Hertzog and Wiebke Grote from the University of Pretoria for assisting with the ICP and XRD analysis, respectively, as well as Alette Devega for all the technical and logistical support in the lab.

Conflicts of Interest

The authors declare no conflict of interest.

References

  1. Water Research Commission. Parched prospects: The Emerging Water Crisis in South Africa. Water Wheel 2014, 13, 42–47. [Google Scholar]
  2. Oller, I.; Malato, S.; Pérez, J.A.S. Combination of Advanced Oxidation Processes and biological treatments for wastewater decontamination—A review. Sci. Total Environ. 2011, 409, 4141–4166. [Google Scholar] [CrossRef] [PubMed]
  3. Walker, C.H. Polycyclic Aromatic Hydrocarbons. In Organic Pollutants: An Ecotoxicological Perspective, 2nd ed.; CRC Press: Boca Raton, FL, USA, 2009. [Google Scholar]
  4. Hai, F.I. Hybrid Treatment Systems for Dye Wastewater. Crit. Rev. Environ. Sci. Technol. 2007, 37, 315–377. [Google Scholar] [CrossRef]
  5. Qasim, S.R.; Zhu, G. Biological Waste Treatment. In Wastewater Treatment and Reuse: Theory and Design Examples; CRC Press: Boca Raton, FL, USA, 2018. [Google Scholar]
  6. Jelic, A.; Katsou, E.; Malamis, S.; Bolzonella, D.; Fatone, F. Occurrence, Removal, and Fate of PAHs and VOCs in Municipal Wastewater Treatment Plants: A Literature Review. In Wastewater Treatment: Occurrence and Fate of Polycyclic Aromatic Hydrocarbons (PAHs); Forsgren, A.J., Ed.; CRC Press: Boca Raton, FL, USA, 2015. [Google Scholar]
  7. Ankush Mandal, M.K.; Sharma, M.; Khushboo Pandey, S.; Dubey, K.K. Membrane Technologies for the Treatent of Pharmacceutical Industry Wastewater. In Water and Wastewater Treatment Technologies; Bui, X.-T., Chiemchaisri, C., Fujioka, T., Varjani, S., Eds.; Springer: Singapore, 2019. [Google Scholar]
  8. Ameta, S.C.; Ameta, R. Introduction. In Advanced Oxidation Processes for Wastewater Treatment: Emerging Green Chemical Technology, 1st ed.; Ameta, S.C., Ameta, R., Eds.; Academic Press: Cambridge, MA, USA, 2018. [Google Scholar]
  9. Ameta, R.; Chohadia, A.K.; Jain, A.; Punjabi, P.B. Fenton and Photo-Fenton Processes. In Advanced Oxidation Processes for Wastewater Treatment; Academic Press: Cambridge, MA, USA, 2018. [Google Scholar]
  10. Zhu, Y.; Zhu, R.; Xi, Y.; Zhu, J.; Zhu, G.; He, H. Strategies for enhancing the heterogeneous Fenton catalytic reactivity: A review. Appl. Catal. B Environ. 2019, 255, 1–16. [Google Scholar] [CrossRef]
  11. Soon, A.N.; JHameed, B.H. Heterogeneous catalytic treatment of synthetic dyes in aqueous media using Fenton and photo-assisted Fenton process. Desalination 2011, 269, 1–16. [Google Scholar] [CrossRef]
  12. Rezaei, F.; Vione, D. Effect of pH on zero valent iron performance in heterogeneous fenton anf fenton-like processes: A review. Molecules 2018, 23, 3127. [Google Scholar] [CrossRef] [PubMed] [Green Version]
  13. Minella, M.; Bertinetti, S.; Hanna, K.; Minero, C.; Vione, D. Degradation of ibuprofen and phenol with a Fenton-like process triggered by zero-valent iron (ZVI-Fenton). Environ. Res. 2019, 179, 108750. [Google Scholar] [CrossRef]
  14. Jack, R.S.; Ayoko, G.A.; Adebajo, M.O.; Frost, R.L. A review of iron species for visible-light photocatalytic water purification. Environ. Sci. Pollut. Res. 2015, 22, 7439–7449. [Google Scholar] [CrossRef] [PubMed]
  15. Vorontsov, A.V. Advancing Fenton and photo-Fenton water treatment through the catalyst design. J. Hazard. Mater. 2019, 372, 103–112. [Google Scholar] [CrossRef]
  16. Tokumura, M.; Morito, R.; Hatayama, R.; Kawase, Y. Iron redox cycling in hydroxyl radical generation during the photo-Fenton oxidative degradation: Dynamic change of hydroxyl radical concentration. Appl. Catal. B Environ. 2011, 106, 565–576. [Google Scholar] [CrossRef]
  17. Tehrani-Bagha, A.R.; Balchi, T. Catalytic Wet Peroxide Oxidation. In Advanced Oxidation Processes for Wastewater Treament; Ameta, R., Ameta, S.C., Eds.; Elsevier: Amsterdam, The Netherlands, 2018. [Google Scholar]
  18. Rueda Márquez, J.J.; Levchuk, I.; Sillanpää, M. Application of catalytic wet peroxide oxidation for industrial and urban wastewater treatment: A review. Catalysts 2018, 8, 673. [Google Scholar] [CrossRef] [Green Version]
  19. Wang, N.; Zheng, T.; Zhang, G.; Wang, P. A review on Fenton-like processes for organic wastewater treatment. J. Environ. Chem. Eng. 2016, 4, 762–787. [Google Scholar] [CrossRef] [Green Version]
  20. Mak, C.H.; Han, X.; Du, M.; Kai, J.-J.; Tsang, K.F.; Jia, G.; Cheng, K.-C.; Shen, H.-H.; Hsu, H.-Y. Heterogenization of homogeneous photocatalysts utilizing synthetic and natural support materials. J. Mater. Chem. A 2021, 9, 4454–4504. [Google Scholar] [CrossRef]
  21. García-Muñoz, P.; Pliego, G.; Zazo, J.A.; Bahamonde, A.; Casas, J.A. Ilmenite (FeTiO3) as low cost catalyst for advanced oxidation processes. J. Environ. Chem. Eng. 2016, 4, 542–548. [Google Scholar] [CrossRef]
  22. Munoz, M.; Domínguez, P.; De Pedro, Z.M.; Casas, J.A. Naturally occurring iron minerals as inexpensive catalysts for CWPO. Appl. Catal. B Environ. 2017, 203, 166–173. [Google Scholar] [CrossRef] [Green Version]
  23. Lu, M.-C.; Chen, J.-N.; Huang, H.-H. Role of Goethite dissolution in the oxidation of 2-chlorophenol with hydrogen peroxide. Chemosphere 2002, 46, 131–136. [Google Scholar] [CrossRef]
  24. García-Muñoz, P.; Pliego, G.; Zazo, J.A.; Munoz, M.; De Pedro, Z.M.; Bahamonde, A.; Casas, J.A. Treatment of hospital wastewater through the CWPO-Photoassisted process catalyzed by ilmenite. J. Environ. Chem. Eng. 2017, 5, 4337–4343. [Google Scholar] [CrossRef]
  25. García-Muñoz, P.; Pliego, G.; Bahamonde, A.; Casas, J.A. Sulfonamides photoassisted oxidation treatments catalyzed by ilmenite. Chemosphere 2017, 180, 523–530. [Google Scholar] [CrossRef] [PubMed]
  26. Pataquiva-Mateus, A.Y.; Zea, H.R.; Ramirez, J.H. Degradation of Orange II by Fenton reaction using ilmenite as catalyst. Environ. Sci. Pollut. Res. 2017, 24, 6187–6194. [Google Scholar] [CrossRef] [PubMed]
  27. Tichapondwa, S.M.; Newman, J.P.; Kubheka, O. Effect of TiO2 phase on the photocatalytic degradation of methylene blue dye. Phys. Chem. Earth 2020, 118–119, 102900. [Google Scholar] [CrossRef]
  28. Canas-Martinez, D.M.; Gauthier, G.H.; Pedraza-Avella, J.A. Photo-oxidative and photo-reductive capabilities of ilmenite-rich black sand concentrates using methyl orange as a probe molecule. Photochem. Photobiol. Sci. 2019. [Google Scholar] [CrossRef] [PubMed]
  29. Silveira, J.E.; Paz, W.S.; García-Muñoz, P.; Zazo, J.A.; Casas, J.A. UV-LED/ilmenite/persulfate for azo dye mineralization: The role ofsulfate in the catalyst deactivation. Appl. Catal. B Environ. 2017, 219, 314–321. [Google Scholar] [CrossRef]
  30. Kuo, W.G. Decolorizing Dye Wastewater with Fenton’s Reagent. Water Res. 1992, 26, 881–886. [Google Scholar] [CrossRef]
  31. Voelker, B.M.; Morel, F.M.M.; Sulzerger, B. Iron Redox Cycling in Surface Waters: Effect of Humic Substances and Light. Environ. Sci. Technol. 1997, 31, 1004–1011. [Google Scholar] [CrossRef] [Green Version]
  32. Rijkenberg, M.J.A.; Gerringe, L.J.A.; Neale, P.J.; Timmermans, K.R.; Buma, A.G.J.; De Baar, H.J.W. UVA viability overrules UVB ozone depletion effects on the photoreduction of iron in the Southern Ocean. Geophys. Res. Lett. 2004, 31, 8. [Google Scholar] [CrossRef] [Green Version]
  33. Rijkenberg, M.J.A.; Fischer, A.C.; Kroon, J.J.; Gerringe, L.J.A.; Timmermans, K.R.; Wolterbeek, H.T.; de Baar, H.J.W. The influence of UV irradiation on the photoreduction of iron in the Southern Ocean. Mar. Chem. 2005, 93, 119–129. [Google Scholar] [CrossRef]
  34. Lueder, U.; Jorgensen, B.B.; Kappler, A.; Schmidt, C. Photochemistry of iron in aquatic environments. Environ. Sci. Process. Impacts 2020, 22, 12–24. [Google Scholar] [CrossRef]
  35. Eskandarian, M.R.; Choi, H.; Fazli, M.; Rasoulifard, M.H. Effect of UV-LED wavelength on direct photolytic and TiO2 photocatalytic degradation of emerging contaminants in water. Chem. Eng. J. 2016, 300, 414–422. [Google Scholar] [CrossRef]
  36. Nidheesh, P.V. Heterogeneous Fenton catalysts for the abatement of organic pollutants from aqueous solution: A review. R. Soc. Chem. 2015, 5, 40552–40577. [Google Scholar] [CrossRef]
  37. Pignatello, J.J.; Oliveros, E.; MacKay, A. Advanced Oxidation Processes for Organic Contaminant Destruction Based on the Fenton Reaction and Related Chemistry. Crit. Rev. Environ. Sci. Technol. 2006, 36, 1–84. [Google Scholar] [CrossRef]
  38. Beverskog, B.; Puigdomenech, I. Revised pourbaix diagrams for iron at 25–300 °C. Corros. Sci. 1996, 38, 2121–2135. [Google Scholar] [CrossRef]
  39. Salgado, P.; Melin, V.; Contreras, D.; Moreno, Y.; Mansilla, H. Fenton Reaction Driven by Iron Ligands. J. Chil. Chem. Soc. 2013, 58, 2096–2101. [Google Scholar] [CrossRef] [Green Version]
  40. García-Muñoz, P.; Pliego, G.; Antonio Zazo, J.; Casas, J.A. Photocatalytic wet peroxide oxidation process at circumneutral pH using ilmenite as catalyst. J. Environ. Chem. Eng. 2018, 6, 7312–7317. [Google Scholar] [CrossRef]
  41. Butt, A.L.; Tichapondwa, S.M. Catalytic Wet Peroxide Oxidation of Methyl Orange using Naturally-Occurring South African Ilmenite as a Catalyst. Chem. Eng. Trans. 2020, 81, 367–371. [Google Scholar]
  42. Dai, K.; Chen, H.; Peng, T.; Ke, D.; Yi, H. Photocatalytic degradation of methyl orange in aqueous suspension of mesoporous titania nanoparticles. Chemosphere 2007, 69, 1361–1367. [Google Scholar] [CrossRef] [PubMed]
  43. Cohen, M.; Ferroudj, N.; Combes, A.; Pichon, V.; Abramson, S. Tracking the degradation pathway of three model aqueous pollutants in a heterogeneous Fenton process. J. Environ. Chem. Eng. 2019, 7. [Google Scholar] [CrossRef]
  44. Jiang, C.; Pang, S.; Ouyang, F.; Ma, J.; Jiang, J. A new insight into Fenton and Fenton-like processes for water treatment. J. Hazard. Mater. 2010, 174, 813–817. [Google Scholar] [CrossRef] [PubMed]
  45. Wang, J.; Wang, S. Reactive species in advanced oxidation processes: Formation, identification and reaction mechanism. Chem. Eng. J. 2020, 401, 1–19. [Google Scholar] [CrossRef]
  46. Zhang, T.; Zhu, H.; Croue, J.-P. Production of Sulfate Radical from Peroxymonosulfate Induced by a Magnetically Separable CuFe2O4 Spinel in Water: Efficiency, Stability, and Mechanism. Environ. Sci. Technol. 2013, 47, 2784–2791. [Google Scholar] [CrossRef] [PubMed]
  47. Maduna, K.; Kumar, N.; Aho, A.; Wärnå, J.; Zrnčević, S.; Murzin, D.Y. Kinetics of Catalytic Wet Peroxide Oxidation of Phenolics in Olive Oil Mill Wastewaters over Copper Catalysts. ACS Omega 2018, 3, 7247–7260. [Google Scholar] [CrossRef] [Green Version]
  48. Hyndman, R.J.; Athanasopoulos, G. Forecasting: Principles and Practice; OTexts: Melbourne, Australia, 2018. [Google Scholar]
  49. García-Muñoz, P.; Pliego, G.; Zazo, J.A.; Barbero, B.; Bahamonde, A.; Casas, J.A. Modified ilmenite as catalyst for CWPO-Photoassisted process under LED light. Chem. Eng. J. 2016. [Google Scholar] [CrossRef]
  50. Youssef, N.A.; Shaban, S.A.; Ibrahim, F.A.; Mahmoud, A.S. Degradation of methyl orange using Fenton catalytic reaction. Egypt. J. Pet. 2016, 25, 317–321. [Google Scholar] [CrossRef] [Green Version]
  51. Ganzenko, O.; Trellu, C.; Oturan, N.; Huguenot, D.; Péchaud, Y.; van Hullebusch, E.D.; Oturan, M.A. Electro-Fenton treatment of a complex pharmaceutical mixture: Mineralization efficiency and biodegradability enhancement. Chemosphere 2020, 253, 126659. [Google Scholar] [CrossRef] [PubMed]
  52. Konstantinou, I.K.; Albanis, T.A. TiO2-assisted photocatalytic degradation of azo dyes in aqueous solution: Kinetic and mechanistic investigations: A review. Appl. Catal. B Environ. 2004, 49, 1–14. [Google Scholar] [CrossRef]
  53. Zhang, H.; Wu, X.; Li, X. Oxidation and coagulation removal of COD from landfil leachate by Fered-Fenton process. Chem. Eng. J. 2012, 210, 188–194. [Google Scholar] [CrossRef]
Figure 1. XRD spectra and the associated mineralogy of the catalyst before (raw) and after the (recovered) reaction.
Catalysts 11 01452 g001
Figure 2. SEM images of the raw ilmenite catalyst at various magnifications.
Catalysts 11 01452 g002
Figure 3. The degradation of methyl orange under the presence and/or absence of various parameters. Operating conditions: (MO) = 10 mg/L, (H2O2) = 2.5 mM, (ilmenite) = 1000 mg/L, pH = 3, and temperature = ±20 °C.
Catalysts 11 01452 g003
Figure 4. (a) Degradation of methyl orange at different pH levels under the influence of the UVB irradiation (b) leaching of Fe into the solution at different pH values. Operating conditions: (MO) = 10 mg/L, (H2O2) = 2.5 mM, (ilmenite) = 1000 mg/L, temperature = ±20 °C, and irradiation = UVB (λ = 310–350 nm).
Catalysts 11 01452 g004
Figure 5. (a) Degradation of methyl orange at various catalyst loadings. (b) Iron leaching at various catalysts loadings. (c) Leaching kinetics at a 2000 mg/L loading. Operating conditions: (MO) = 10 mg/L, (H2O2) = 2.5 mM, pH = 2.5, irradiation = UVB (λ = 310 nm–350 nm), and temperature = ±20 °C.
Catalysts 11 01452 g005
Figure 6. Effect of H2O2 concentration on methyl orange degradation. Operating conditions: (MO) = 10 mg/L, (ilmenite] = 2000 mg/L, pH =2.5, irradiation = UVB (λ = 310 nm–350 nm), and temperature = ±20 °C.
Catalysts 11 01452 g006
Figure 7. The degradation of methyl orange overtime at different initial concentrations. Operating conditions: (ilmenite) = 2000 mg/L, (H2O2) = 1.0 mM, pH = 2.5, irradiation = UVB (λ = 310 nm–350 nm), and temperature = ±20 °C.
Catalysts 11 01452 g007
Figure 8. First and second order kinetic modelling at varying initial MO concentrations: (a) MO = 5 mg/L, (b) MO = 10 mg/L, and (c) MO = 20 mg/L.
Catalysts 11 01452 g008
Figure 9. TOC removal over time with an addition of 1.0 mM of H2O2 every 60 min. Operating conditions: (MO) = 10 mg/L, (H2O2) = 1.0 mM, (ilmenite) = 2000 mg/L, pH = 2.5, irradiation = UVB (λ = 310 nm–350 nm), and temperature = ±20 °C.
Catalysts 11 01452 g009
Table 1. Comparison of the ilmenite catalyst used in this study compared to the ilmenite used in other studies.
StudyXRD (%)XRF (%)BET (m2/g)
FeTiO3Fe2O3TiO2FeTi
Present study (before reaction)83.5314.991.234.6032.3010.42
Present study (recovered catalyst after reaction)82.4316.081.49---
García-Muñoz et al. [21]85-1536376
Canas-Martinez et al. [28]69.502.814.18NA *NA *NA *
Silveira et al. [29]85-1536376
Munoz et al. [22]NA *NA *NA *36.237.04
* Information not reported in the reference.
Table 2. Kinetic parameters obtained after fitting the PFO and PSO kinetic models to the experimental data.
ConcentrationFirst OrderSecond Order
κ (min−1)R2κ (L/(mol·min−1)R2
5 mg/L0.095380.9960.064850.9957
10 mg/L0.078560.99850.021200.9828
20 mg/L0.034290.98860.0038820.9476
Table 3. The model and peak wavelengths of the different lamps used for irradiation.
Irradiation SourceModelPeak Wavelengths (nm)
UVAPhilips TL-K 40 W/10 R Actinic BL Reflector365
UVBExo Terra Reptile UVB 200 18 W, 60 cm310–350
VisiblePhilips Master Super 80 TL-D 18 W/865440, 560, 640
Publisher’s Note: MDPI stays neutral with regard to jurisdictional claims in published maps and institutional affiliations.

